Embed Size (px)
Citation preview
Maps of Recent and Projected Climate Change in Wisconsin
Wisconsin Initiative on Climate Change Impacts 40 Science Hall
550 N. Park Street Madison, WI 53706
608.263.3063 wicci.wisc.edu

2 WISCONSIN INITIATIVE ON CLIMATE CHANGE IMPACTS (WICCI)
Except for northeastern Wisconsin, most of Wisconsin has warmed since 1950. Averaged across the state, the warming has been +1.1°F, with a peak warming of 2-2.5°F across northwestern Wisconsin. Wisconsin is becoming “less cold,” with the greatest warming during winter-spring and nighttime temperatures increasing more than daytime temperatures. Method: The source of observed temperature data was 176 weather stations measuring daily maximum and minimum temperatures during 1950-2006 in and around Wisconsin, from the National Weather Service’s Cooperative Observer Program). These data were interpolated to an 8-km grid (Serbin & Kucharik, 2009). Daily average temperature was estimated by averaging the daily maximum and minimum temperatures. Trends in annual temperature were estimated using the slopes of linear regression fits for the entire 1950-2006 time series.

3 WISCONSIN INITIATIVE ON CLIMATE CHANGE IMPACTS (WICCI)
The observed warming since 1950 has been greatest in winter, with an average increase of 2.5°F across Wisconsin. Winter temperatures in northwestern Wisconsin have increased by 3.5-4.5°F. Method: The source of observed temperature data was 176 weather stations measuring daily maximum and minimum temperatures during 1950-2006 in and around Wisconsin, from the National Weather Service’s Cooperative Observer Program). These data were interpolated to an 8-km grid (Serbin & Kucharik, 2009). Daily average temperature was estimated by averaging the daily maximum and minimum temperatures. Trends in annual temperature were estimated using the slopes of linear regression fits for the entire 1950-2006 time series.

4 WISCONSIN INITIATIVE ON CLIMATE CHANGE IMPACTS (WICCI)
Springtime temperatures across Wisconsin have increased by 1.7°F since 1950, with increases of 2.5-3.5°F across the northwestern part of the state. Method: The source of observed temperature data was 176 weather stations measuring daily maximum and minimum temperatures during 1950-2006 in and around Wisconsin, from the National Weather Service’s Cooperative Observer Program). These data were interpolated to an 8-km grid (Serbin & Kucharik, 2009). Daily average temperature was estimated by averaging the daily maximum and minimum temperatures. Trends in annual temperature were estimated using the slopes of linear regression fits for the entire 1950-2006 time series.

5 WISCONSIN INITIATIVE ON CLIMATE CHANGE IMPACTS (WICCI)
Observed changes in summertime temperatures since 1950 have been spatially heterogeneous but have increased by 0.5°F when averaged statewide. The largest summertime warming has been 1.5-2°F over central-northwestern Wisconsin. Method: The source of observed temperature data was 176 weather stations measuring daily maximum and minimum temperatures during 1950-2006 in and around Wisconsin, from the National Weather Service’s Cooperative Observer Program). These data were interpolated to an 8-km grid (Serbin & Kucharik, 2009). Daily average temperature was estimated by averaging the daily maximum and minimum temperatures. Trends in annual temperature were estimated using the slopes of linear regression fits for the entire 1950-2006 time series.

6 WISCONSIN INITIATIVE ON CLIMATE CHANGE IMPACTS (WICCI)
In Wisconsin, average temperatures have changed the least since 1950 during autumn, cooling by -0.6°F. This cooling has reached -1.5°F across northeastern and southern Wisconsin. Method: The source of observed temperature data was 176 weather stations measuring daily maximum and minimum temperatures during 1950-2006 in and around Wisconsin, from the National Weather Service’s Cooperative Observer Program). These data were interpolated to an 8-km grid (Serbin & Kucharik, 2009). Daily average temperature was estimated by averaging the daily maximum and minimum temperatures. Trends in annual temperature were estimated using the slopes of linear regression fits for the entire 1950-2006 time series.

7 WISCONSIN INITIATIVE ON CLIMATE CHANGE IMPACTS (WICCI)
Wisconsin is projected to warm by 4-9°F by the middle of this century, based on one emission scenario. Northern Wisconsin is projected to warm the most, while the least warming is expected along Lake Michigan. The mean projected warming rate is about four times greater than what has been observed since 1950. Method: The climate output that was analyzed was produced by fourteen global climate models from the Coupled Model Intercomparison Project Phase 3 (CMIP3), a critical source of data to the Fourth Assessment Report of the Intergovernmental Panel on Climate Change (IPCC AR4). Results are based on the A1B emission scenario, which is considered a mid-line scenario for both carbon dioxide emissions and economic growth, with carbon dioxide levels in the atmosphere rising from 390 ppmv (parts per million by volume) at present to 550 ppmv by the mid-2050s. The coarse climate projections were downscaled to a 0.1° latitude x 0.1° longitude grid over Wisconsin and debiased against observed temperature and precipitation from station observations within the National Weather Service’s Cooperative Observer Program. By interpolating and debiasing probability distribution functions and their attributes, a realistic representation of the variance and extremes of temperature and precipitation was achieved, in addition to a realistic representation of the means of both variables. In computing the projected change in annual average temperature, the difference in mean temperature between 2046-2065 and 1961-2000 was computed. The stated range represents the 10th – 90th percentiles based on a range of model projections. Thus, there is a 90% chance the warming will exceed 4°F, and a 90% chance it will be less than 9°F.

8 WISCONSIN INITIATIVE ON CLIMATE CHANGE IMPACTS (WICCI)
The warming is projected to be largest in winter, with projected increases of 5-11°F by the mid-21st century across Wisconsin, and with the greatest warming across northwestern Wisconsin. Method: The climate output that was analyzed was produced by fourteen global climate models from the Coupled Model Intercomparison Project Phase 3 (CMIP3), a critical source of data to the Fourth Assessment Report of the Intergovernmental Panel on Climate Change (IPCC AR4). Results are based on the A1B emission scenario, which is considered a mid-line scenario for both carbon dioxide emissions and economic growth, with carbon dioxide levels in the atmosphere rising from 390 ppmv (parts per million by volume) at present to 550 ppmv by the mid-2050s. The coarse climate projections were downscaled to a 0.1° latitude x 0.1° longitude grid over Wisconsin and debiased against observed temperature and precipitation from station observations within the National Weather Service’s Cooperative Observer Program. By interpolating and debiasing probability distribution functions and their attributes, a realistic representation of the variance and extremes of temperature and precipitation was achieved, in addition to a realistic representation of the means of both variables. In computing the projected change in wintertime average temperature, the difference in mean December-February temperature between 2046-2065 and 1961-2000 was computed.

9 WISCONSIN INITIATIVE ON CLIMATE CHANGE IMPACTS (WICCI)
Springtime temperatures are projected to increase by 3-9°F by the mid-21st century, with the largest increases across northern Wisconsin. Method: The climate output that was analyzed was produced by fourteen global climate models from the Coupled Model Intercomparison Project Phase 3 (CMIP3), a critical source of data to the Fourth Assessment Report of the Intergovernmental Panel on Climate Change (IPCC AR4). Results are based on the A1B emission scenario, which is considered a mid-line scenario for both carbon dioxide emissions and economic growth, with carbon dioxide levels in the atmosphere rising from 390 ppmv (parts per million by volume) at present to 550 ppmv by the mid-2050s. The coarse climate projections were downscaled to a 0.1° latitude x 0.1° longitude grid over Wisconsin and debiased against observed temperature and precipitation from station observations within the National Weather Service’s Cooperative Observer Program. By interpolating and debiasing probability distribution functions and their attributes, a realistic representation of the variance and extremes of temperature and precipitation was achieved, in addition to a realistic representation of the means of both variables. In computing the projected change in springtime average temperature, the difference in mean March-May temperature between 2046-2065 and 1961-2000 was computed.

10 WISCONSIN INITIATIVE ON CLIMATE CHANGE IMPACTS (WICCI)
Warming is projected to be weakest in summer, with increases of 3-8°F by the mid-21st century for Wisconsin, peaking across northern Wisconsin. Method: The climate output that was analyzed was produced by fourteen global climate models from the Coupled Model Intercomparison Project Phase 3 (CMIP3), a critical source of data to the Fourth Assessment Report of the Intergovernmental Panel on Climate Change (IPCC AR4). Results are based on the A1B emission scenario, which is considered a mid-line scenario for both carbon dioxide emissions and economic growth, with carbon dioxide levels in the atmosphere rising from 390 ppmv (parts per million by volume) at present to 550 ppmv by the mid-2050s. The coarse climate projections were downscaled to a 0.1° latitude x 0.1° longitude grid over Wisconsin and debiased against observed temperature and precipitation from station observations within the National Weather Service’s Cooperative Observer Program. By interpolating and debiasing probability distribution functions and their attributes, a realistic representation of the variance and extremes of temperature and precipitation was achieved, in addition to a realistic representation of the means of both variables. In computing the projected change in summertime average temperature, the difference in mean June-August temperature between 2046-2065 and 1961-2000 was computed.
11 WISCONSIN INITIATIVE ON CLIMATE CHANGE IMPACTS (WICCI)
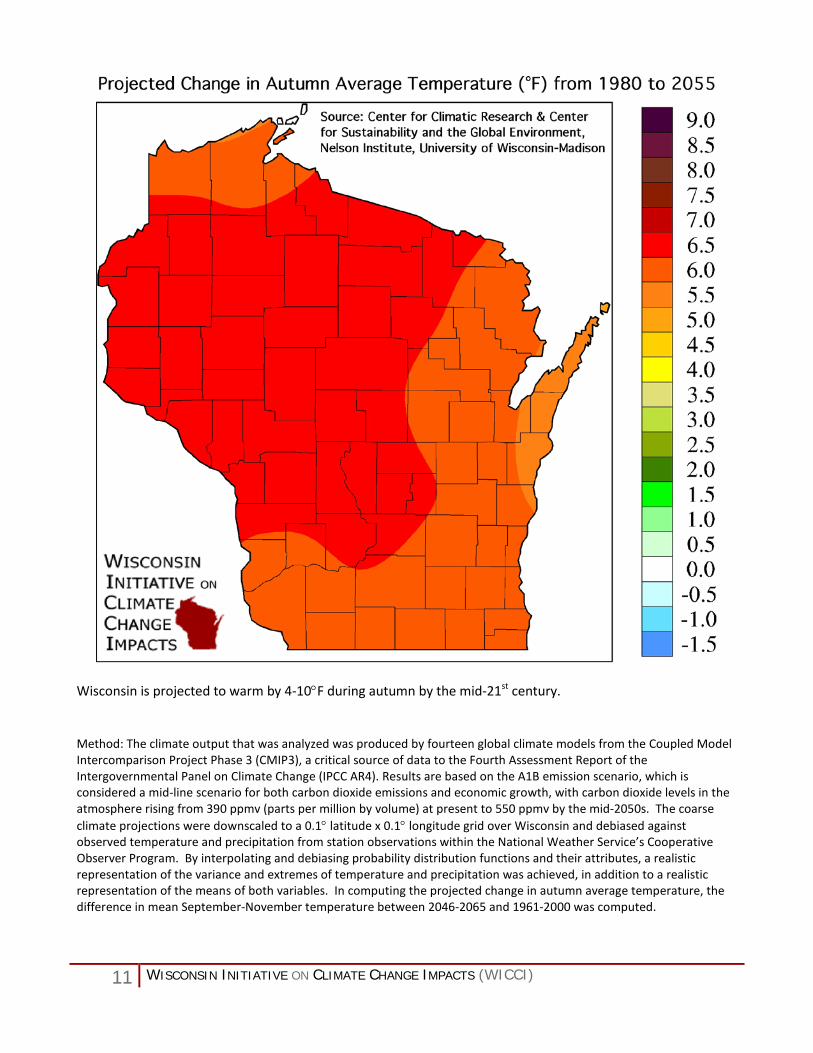
Wisconsin is projected to warm by 4-10°F during autumn by the mid-21st century. Method: The climate output that was analyzed was produced by fourteen global climate models from the Coupled Model Intercomparison Project Phase 3 (CMIP3), a critical source of data to the Fourth Assessment Report of the Intergovernmental Panel on Climate Change (IPCC AR4). Results are based on the A1B emission scenario, which is considered a mid-line scenario for both carbon dioxide emissions and economic growth, with carbon dioxide levels in the atmosphere rising from 390 ppmv (parts per million by volume) at present to 550 ppmv by the mid-2050s. The coarse climate projections were downscaled to a 0.1° latitude x 0.1° longitude grid over Wisconsin and debiased against observed temperature and precipitation from station observations within the National Weather Service’s Cooperative Observer Program. By interpolating and debiasing probability distribution functions and their attributes, a realistic representation of the variance and extremes of temperature and precipitation was achieved, in addition to a realistic representation of the means of both variables. In computing the projected change in autumn average temperature, the difference in mean September-November temperature between 2046-2065 and 1961-2000 was computed.

12 WISCONSIN INITIATIVE ON CLIMATE CHANGE IMPACTS (WICCI)
Typically, daily high temperatures exceed 90°F roughly 12 times per year in southern Wisconsin and only 5 times per year in northern Wisconsin. Based on one emission scenario, by the mid-21st century, the frequency of such hot days may roughly triple. This consists of 2 to 5 more weeks each year with daily high temperatures exceeding 90°F. Method: The climate output that was analyzed was produced by fourteen global climate models from the Coupled Model Intercomparison Project Phase 3 (CMIP3), a critical source of data to the Fourth Assessment Report of the Intergovernmental Panel on Climate Change (IPCC AR4). Results are based on the A1B emission scenario, which is considered a mid-line scenario for both carbon dioxide emissions and economic growth, with carbon dioxide levels in the atmosphere rising from 390 ppmv (parts per million by volume) at present to 550 ppmv by the mid-2050s. The coarse climate projections were downscaled to a 0.1° latitude x 0.1° longitude grid over Wisconsin and debiased against observed temperature and precipitation from station observations within the National Weather Service’s Cooperative Observer Program. By interpolating and debiasing probability distribution functions and their attributes, a realistic representation of the variance and extremes of temperature and precipitation was achieved, in addition to a realistic representation of the means of both variables. The projected change in the frequency of 90°F days is computed as the difference in the number of such hot days per year during 2046-2065 and 1961-2000. Results are based on the time-mean cumulative distribution function and the frequency of exceeding the 90°F high-temperature threshold, using the full array of realizations of the small-scale atmospheric state for a given large-scale circulation pattern.

13 WISCONSIN INITIATIVE ON CLIMATE CHANGE IMPACTS (WICCI)
A consistent trend towards more frequent hot days has not yet emerged. From 1950 to 2006, the observed frequency of 90°F days has increased by 2 days per year across northwestern Wisconsin and decreased by 2-4 days per year over central and southwestern Wisconsin. Method: The source of observed temperature data was 176 weather stations measuring daily maximum temperatures during 1950-2006 in and around Wisconsin, from the National Weather Service’s Cooperative Observer Program. These data were interpolated to an 8-km grid (Serbin & Kucharik, 2009). Trends in the frequency of daily high temperatures exceeding 90°F were estimated using the slopes of linear regression fits for the entire 1950-2006 time series.
14 WISCONSIN INITIATIVE ON CLIMATE CHANGE IMPACTS (WICCI)
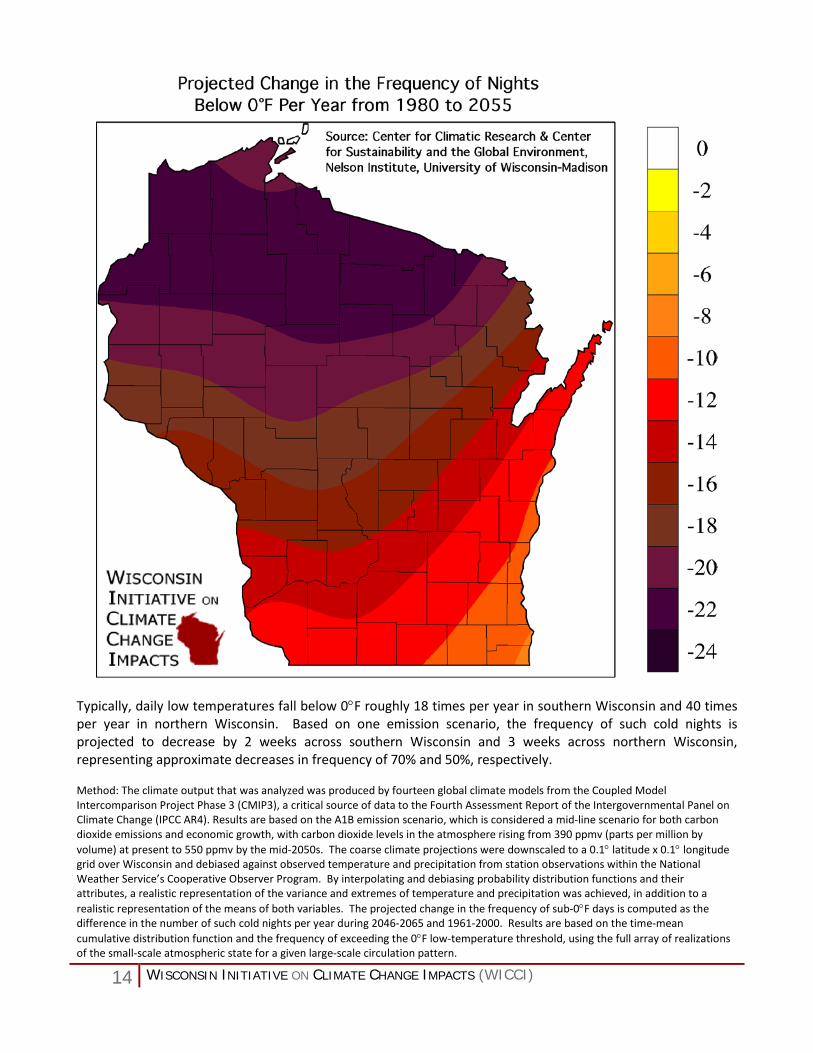
Typically, daily low temperatures fall below 0°F roughly 18 times per year in southern Wisconsin and 40 times per year in northern Wisconsin. Based on one emission scenario, the frequency of such cold nights is projected to decrease by 2 weeks across southern Wisconsin and 3 weeks across northern Wisconsin, representing approximate decreases in frequency of 70% and 50%, respectively. Method: The climate output that was analyzed was produced by fourteen global climate models from the Coupled Model Intercomparison Project Phase 3 (CMIP3), a critical source of data to the Fourth Assessment Report of the Intergovernmental Panel on Climate Change (IPCC AR4). Results are based on the A1B emission scenario, which is considered a mid-line scenario for both carbon dioxide emissions and economic growth, with carbon dioxide levels in the atmosphere rising from 390 ppmv (parts per million by volume) at present to 550 ppmv by the mid-2050s. The coarse climate projections were downscaled to a 0.1° latitude x 0.1° longitude grid over Wisconsin and debiased against observed temperature and precipitation from station observations within the National Weather Service’s Cooperative Observer Program. By interpolating and debiasing probability distribution functions and their attributes, a realistic representation of the variance and extremes of temperature and precipitation was achieved, in addition to a realistic representation of the means of both variables. The projected change in the frequency of sub-0°F days is computed as the difference in the number of such cold nights per year during 2046-2065 and 1961-2000. Results are based on the time-mean cumulative distribution function and the frequency of exceeding the 0°F low-temperature threshold, using the full array of realizations of the small-scale atmospheric state for a given large-scale circulation pattern.
15 WISCONSIN INITIATIVE ON CLIMATE CHANGE IMPACTS (WICCI)
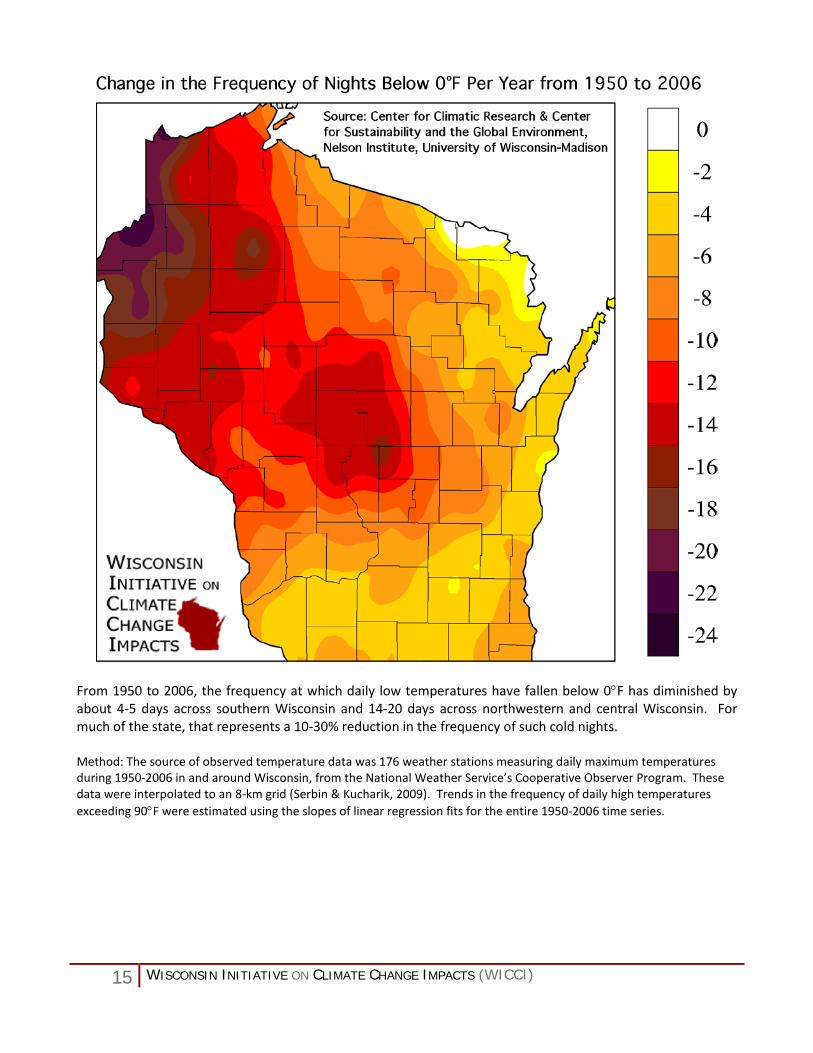
From 1950 to 2006, the frequency at which daily low temperatures have fallen below 0°F has diminished by about 4-5 days across southern Wisconsin and 14-20 days across northwestern and central Wisconsin. For much of the state, that represents a 10-30% reduction in the frequency of such cold nights. Method: The source of observed temperature data was 176 weather stations measuring daily maximum temperatures during 1950-2006 in and around Wisconsin, from the National Weather Service’s Cooperative Observer Program. These data were interpolated to an 8-km grid (Serbin & Kucharik, 2009). Trends in the frequency of daily high temperatures exceeding 90°F were estimated using the slopes of linear regression fits for the entire 1950-2006 time series.

16 WISCONSIN INITIATIVE ON CLIMATE CHANGE IMPACTS (WICCI)
From 1950 to 2006, Wisconsin as a whole has become wetter, with an increase in annual precipitation of 3.1 inches. This observed increase in annual precipitation has primarily occurred in southern and western Wisconsin, while northern Wisconsin has experienced some drying. Method: The source of observed temperature data was 176 weather stations measuring daily maximum temperatures during 1950-2006 in and around Wisconsin, from the National Weather Service’s Cooperative Observer Program. These data were interpolated to an 8-km grid (Serbin & Kucharik, 2009). Trends in the frequency of daily high temperatures exceeding 90°F were estimated using the slopes of linear regression fits for the entire 1950-2006 time series.
17 WISCONSIN INITIATIVE ON CLIMATE CHANGE IMPACTS (WICCI)
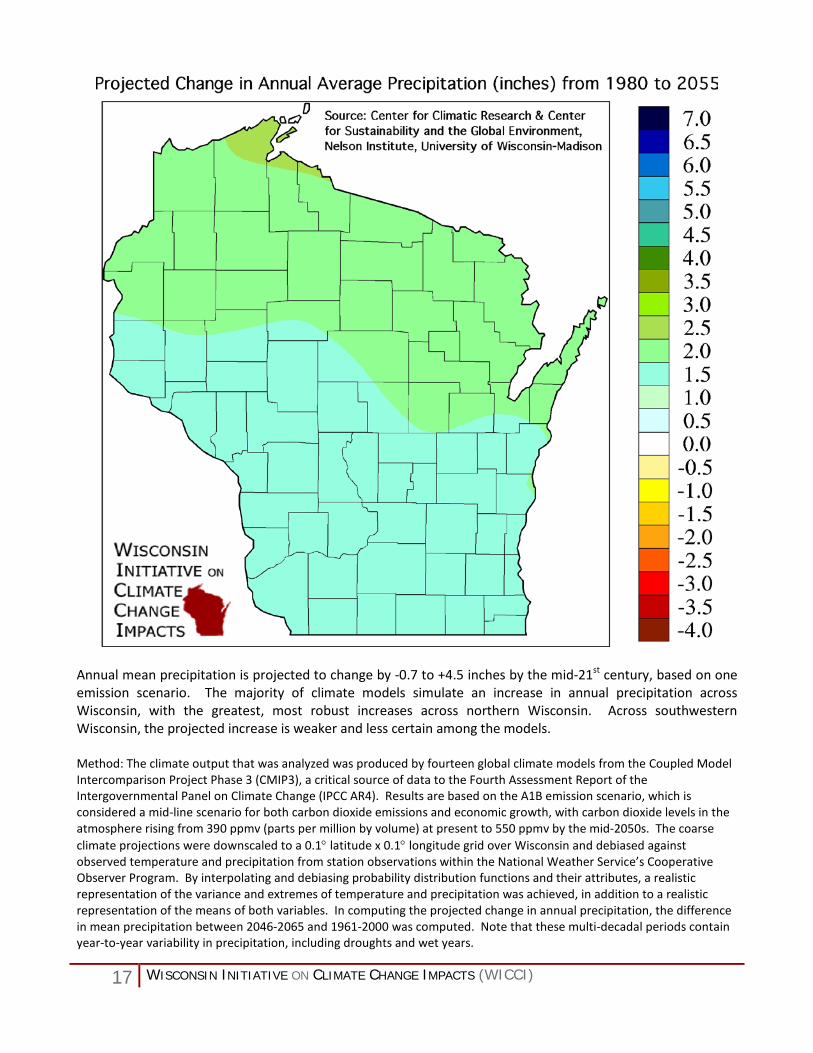
Annual mean precipitation is projected to change by -0.7 to +4.5 inches by the mid-21st century, based on one emission scenario. The majority of climate models simulate an increase in annual precipitation across Wisconsin, with the greatest, most robust increases across northern Wisconsin. Across southwestern Wisconsin, the projected increase is weaker and less certain among the models. Method: The climate output that was analyzed was produced by fourteen global climate models from the Coupled Model Intercomparison Project Phase 3 (CMIP3), a critical source of data to the Fourth Assessment Report of the Intergovernmental Panel on Climate Change (IPCC AR4). Results are based on the A1B emission scenario, which is considered a mid-line scenario for both carbon dioxide emissions and economic growth, with carbon dioxide levels in the atmosphere rising from 390 ppmv (parts per million by volume) at present to 550 ppmv by the mid-2050s. The coarse climate projections were downscaled to a 0.1° latitude x 0.1° longitude grid over Wisconsin and debiased against observed temperature and precipitation from station observations within the National Weather Service’s Cooperative Observer Program. By interpolating and debiasing probability distribution functions and their attributes, a realistic representation of the variance and extremes of temperature and precipitation was achieved, in addition to a realistic representation of the means of both variables. In computing the projected change in annual precipitation, the difference in mean precipitation between 2046-2065 and 1961-2000 was computed. Note that these multi-decadal periods contain year-to-year variability in precipitation, including droughts and wet years.

18 WISCONSIN INITIATIVE ON CLIMATE CHANGE IMPACTS (WICCI)
A modest increase in wintertime precipitation of 0.5 inch has occurred from 1950 to 2006 in Wisconsin. Method: The source of observed temperature data was 176 weather stations measuring daily maximum temperatures during 1950-2006 in and around Wisconsin, from the National Weather Service’s Cooperative Observer Program. These data were interpolated to an 8-km grid (Serbin & Kucharik, 2009). Trends in the frequency of daily high temperatures exceeding 90°F were estimated using the slopes of linear regression fits for the entire 1950-2006 time series.
19 WISCONSIN INITIATIVE ON CLIMATE CHANGE IMPACTS (WICCI)
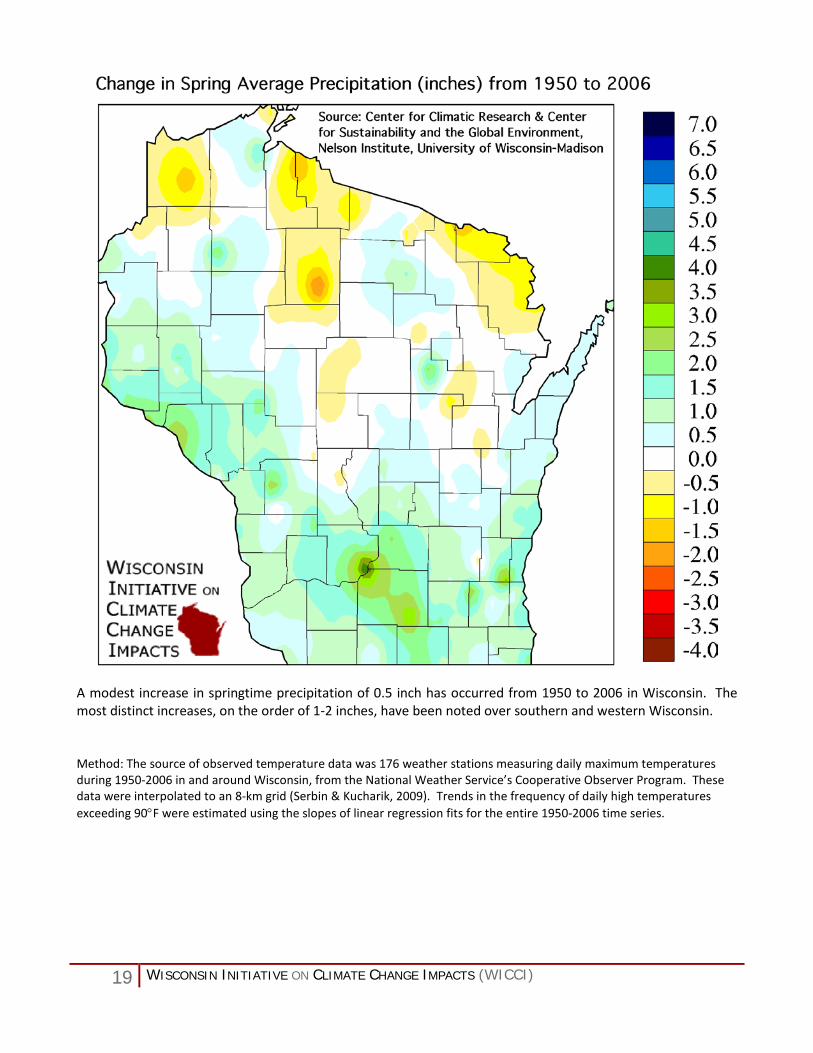
A modest increase in springtime precipitation of 0.5 inch has occurred from 1950 to 2006 in Wisconsin. The most distinct increases, on the order of 1-2 inches, have been noted over southern and western Wisconsin. Method: The source of observed temperature data was 176 weather stations measuring daily maximum temperatures during 1950-2006 in and around Wisconsin, from the National Weather Service’s Cooperative Observer Program. These data were interpolated to an 8-km grid (Serbin & Kucharik, 2009). Trends in the frequency of daily high temperatures exceeding 90°F were estimated using the slopes of linear regression fits for the entire 1950-2006 time series.
20 WISCONSIN INITIATIVE ON CLIMATE CHANGE IMPACTS (WICCI)
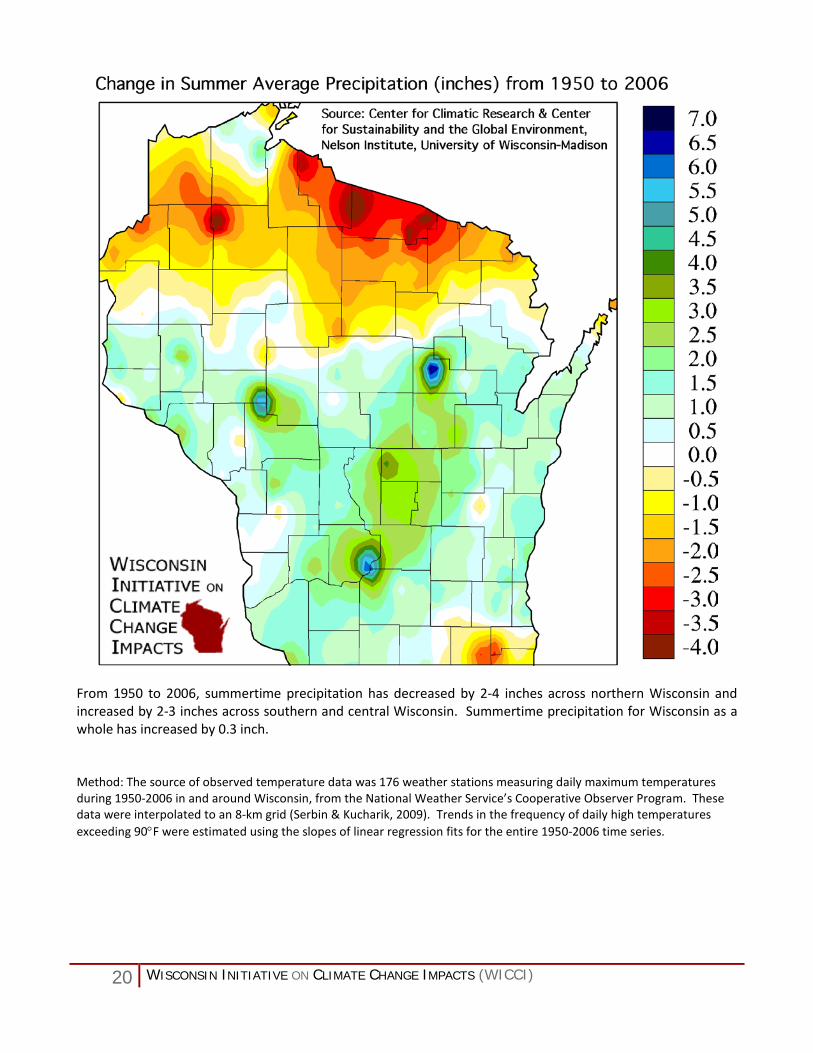
From 1950 to 2006, summertime precipitation has decreased by 2-4 inches across northern Wisconsin and increased by 2-3 inches across southern and central Wisconsin. Summertime precipitation for Wisconsin as a whole has increased by 0.3 inch. Method: The source of observed temperature data was 176 weather stations measuring daily maximum temperatures during 1950-2006 in and around Wisconsin, from the National Weather Service’s Cooperative Observer Program. These data were interpolated to an 8-km grid (Serbin & Kucharik, 2009). Trends in the frequency of daily high temperatures exceeding 90°F were estimated using the slopes of linear regression fits for the entire 1950-2006 time series.

21 WISCONSIN INITIATIVE ON CLIMATE CHANGE IMPACTS (WICCI)
The vast majority of the increase in precipitation across Wisconsin during 1950 to 2006 has occurred during autumn, with observed increases in autumn precipitation of 1.8 inches statewide. The increase in autumn precipitation has reached 2.5-3.5 inches across northwestern Wisconsin. Method: The source of observed temperature data was 176 weather stations measuring daily maximum temperatures during 1950-2006 in and around Wisconsin, from the National Weather Service’s Cooperative Observer Program. These data were interpolated to an 8-km grid (Serbin & Kucharik, 2009). Trends in the frequency of daily high temperatures exceeding 90°F were estimated using the slopes of linear regression fits for the entire 1950-2006 time series.

22 WISCONSIN INITIATIVE ON CLIMATE CHANGE IMPACTS (WICCI)
Wintertime precipitation is projected to increase by +0.1 to +1.2 inches by the mid-21st century, based on one emission scenario. The average projection among the climate models is a 20% increase in wintertime precipitation across northern Wisconsin. Method: The climate output that was analyzed was produced by fourteen global climate models from the Coupled Model Intercomparison Project Phase 3 (CMIP3), a critical source of data to the Fourth Assessment Report of the Intergovernmental Panel on Climate Change (IPCC AR4). Results are based on the A1B emission scenario, which is considered a mid-line scenario for both carbon dioxide emissions and economic growth, with carbon dioxide levels in the atmosphere rising from 390 ppmv (parts per million by volume) at present to 550 ppmv by the mid-2050s. The coarse climate projections were downscaled to a 0.1° latitude x 0.1° longitude grid over Wisconsin and debiased against observed temperature and precipitation from station observations within the National Weather Service’s Cooperative Observer Program. By interpolating and debiasing probability distribution functions and their attributes, a realistic representation of the variance and extremes of temperature and precipitation was achieved, in addition to a realistic representation of the means of both variables. In computing the projected change in wintertime precipitation, the difference in mean December-February precipitation between 2046-2065 and 1961-2000 was computed.

23 WISCONSIN INITIATIVE ON CLIMATE CHANGE IMPACTS (WICCI)
The projected increase in Wisconsin precipitation is primarily attributed to springtime. Springtime precipitation is projected to change by -0.4 to +2.0 inches by the mid-21st century, based on one emission scenario, with the vast majority of the climate models suggesting an increase, typically greatest over northern Wisconsin. Method: The climate output that was analyzed was produced by fourteen global climate models from the Coupled Model Intercomparison Project Phase 3 (CMIP3), a critical source of data to the Fourth Assessment Report of the Intergovernmental Panel on Climate Change (IPCC AR4). Results are based on the A1B emission scenario, which is considered a mid-line scenario for both carbon dioxide emissions and economic growth, with carbon dioxide levels in the atmosphere rising from 390 ppmv (parts per million by volume) at present to 550 ppmv by the mid-2050s. The coarse climate projections were downscaled to a 0.1° latitude x 0.1° longitude grid over Wisconsin and debiased against observed temperature and precipitation from station observations within the National Weather Service’s Cooperative Observer Program. By interpolating and debiasing probability distribution functions and their attributes, a realistic representation of the variance and extremes of temperature and precipitation was achieved, in addition to a realistic representation of the means of both variables. In computing the projected change in springtime precipitation, the difference in mean March-May precipitation between 2046-2065 and 1961-2000 was computed.

24 WISCONSIN INITIATIVE ON CLIMATE CHANGE IMPACTS (WICCI)
There is little agreement among climate models on how summertime precipitation will change over Wisconsin. Models predict a range from a 2” decrease in precipitation to a 0.6” increase when averaged over the state. Method: The climate output that was analyzed was produced by fourteen global climate models from the Coupled Model Intercomparison Project Phase 3 (CMIP3), a critical source of data to the Fourth Assessment Report of the Intergovernmental Panel on Climate Change (IPCC AR4). Results are based on the A1B emission scenario, which is considered a mid-line scenario for both carbon dioxide emissions and economic growth, with carbon dioxide levels in the atmosphere rising from 390 ppmv (parts per million by volume) at present to 550 ppmv by the mid-2050s. The coarse climate projections were downscaled to a 0.1° latitude x 0.1° longitude grid over Wisconsin and debiased against observed temperature and precipitation from station observations within the National Weather Service’s Cooperative Observer Program. By interpolating and debiasing probability distribution functions and their attributes, a realistic representation of the variance and extremes of temperature and precipitation was achieved, in addition to a realistic representation of the means of both variables. In computing the projected change in summertime precipitation, the difference in mean June-August precipitation between 2046-2065 and 1961-2000 was computed.
25 WISCONSIN INITIATIVE ON CLIMATE CHANGE IMPACTS (WICCI)
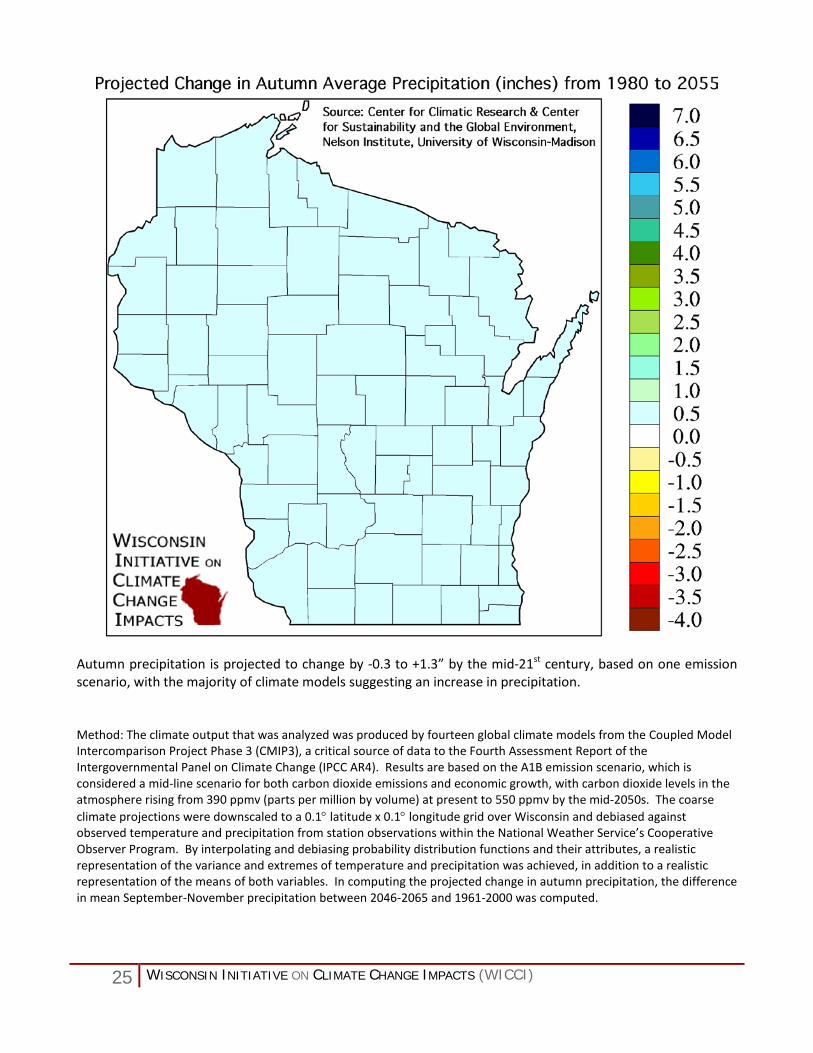
Autumn precipitation is projected to change by -0.3 to +1.3” by the mid-21st century, based on one emission scenario, with the majority of climate models suggesting an increase in precipitation. Method: The climate output that was analyzed was produced by fourteen global climate models from the Coupled Model Intercomparison Project Phase 3 (CMIP3), a critical source of data to the Fourth Assessment Report of the Intergovernmental Panel on Climate Change (IPCC AR4). Results are based on the A1B emission scenario, which is considered a mid-line scenario for both carbon dioxide emissions and economic growth, with carbon dioxide levels in the atmosphere rising from 390 ppmv (parts per million by volume) at present to 550 ppmv by the mid-2050s. The coarse climate projections were downscaled to a 0.1° latitude x 0.1° longitude grid over Wisconsin and debiased against observed temperature and precipitation from station observations within the National Weather Service’s Cooperative Observer Program. By interpolating and debiasing probability distribution functions and their attributes, a realistic representation of the variance and extremes of temperature and precipitation was achieved, in addition to a realistic representation of the means of both variables. In computing the projected change in autumn precipitation, the difference in mean September-November precipitation between 2046-2065 and 1961-2000 was computed.
26 WISCONSIN INITIATIVE ON CLIMATE CHANGE IMPACTS (WICCI)
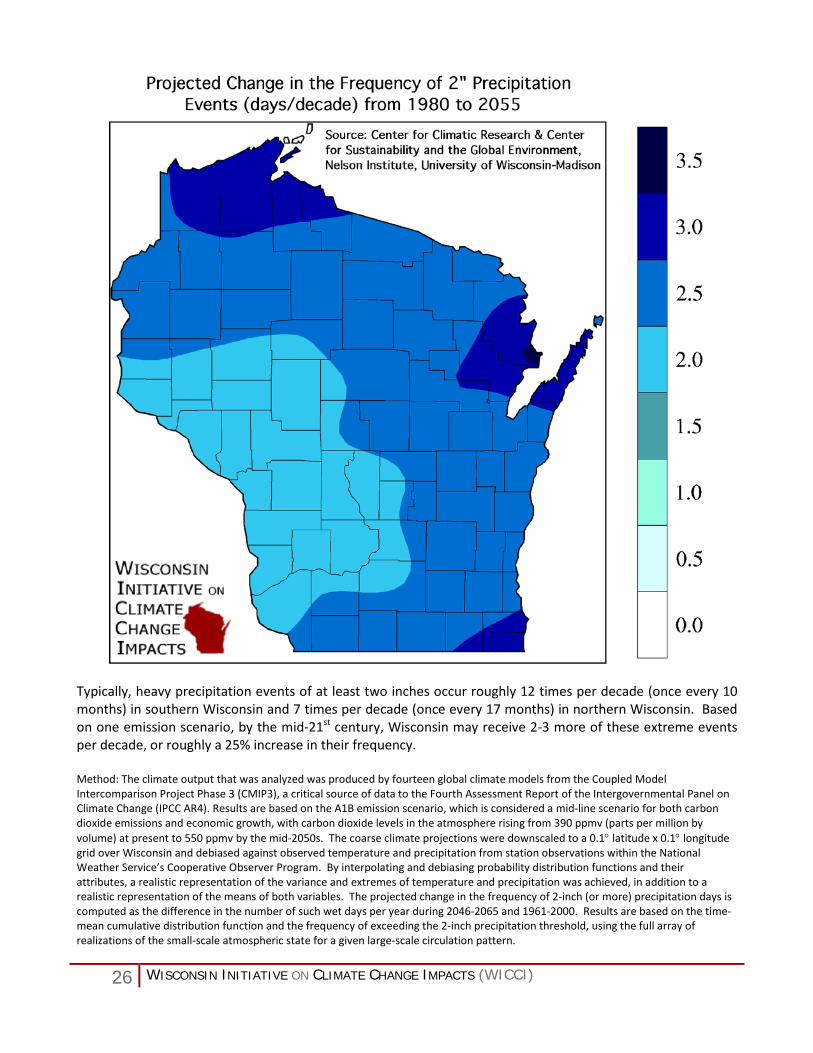
Typically, heavy precipitation events of at least two inches occur roughly 12 times per decade (once every 10 months) in southern Wisconsin and 7 times per decade (once every 17 months) in northern Wisconsin. Based on one emission scenario, by the mid-21st century, Wisconsin may receive 2-3 more of these extreme events per decade, or roughly a 25% increase in their frequency. Method: The climate output that was analyzed was produced by fourteen global climate models from the Coupled Model Intercomparison Project Phase 3 (CMIP3), a critical source of data to the Fourth Assessment Report of the Intergovernmental Panel on Climate Change (IPCC AR4). Results are based on the A1B emission scenario, which is considered a mid-line scenario for both carbon dioxide emissions and economic growth, with carbon dioxide levels in the atmosphere rising from 390 ppmv (parts per million by volume) at present to 550 ppmv by the mid-2050s. The coarse climate projections were downscaled to a 0.1° latitude x 0.1° longitude grid over Wisconsin and debiased against observed temperature and precipitation from station observations within the National Weather Service’s Cooperative Observer Program. By interpolating and debiasing probability distribution functions and their attributes, a realistic representation of the variance and extremes of temperature and precipitation was achieved, in addition to a realistic representation of the means of both variables. The projected change in the frequency of 2-inch (or more) precipitation days is computed as the difference in the number of such wet days per year during 2046-2065 and 1961-2000. Results are based on the time-mean cumulative distribution function and the frequency of exceeding the 2-inch precipitation threshold, using the full array of realizations of the small-scale atmospheric state for a given large-scale circulation pattern.


![Polar Climate Change as Manifest in Atmospheric …...tainty in projected climate change [ 4]. This review forms part of a Topical Collection on Climate Change and Atmospheric Circulation](https://img.dokumen.tips/doc/110x75/5f47ba734b9e0419c1183f85/polar-climate-change-as-manifest-in-atmospheric-tainty-in-projected-climate.jpg)


