Embed Size (px)
Citation preview

Mapping the Vegetation of Texas

Background
• TPWD wants better land cover for Texas– More land cover classes – Better spatial resolution – Better accuracy (overall 85%)– Better ecological interpretation
• Partners Required!– MoRAP, University of Missouri– TNC, Texas– NatureServe, Southeast Region– TNRIS– NRCS, TXFS, USFWS, others

Phase 1 Available Now
Phase 2Available Now
Phase 3 Available Now
Phase 4 Available Now
Phase 5September 2012
Ecological Mapping
Systems of Texas
Phase 6September
2013
Phase LPCAvailable Now

Classify Land Cover(e.g. grassland)
Create Map with Named Mapping Units(e.g. Southeastern Great Plains Tallgrass Prairie)
Provide Interpretation of Mapping Units(booklet, summary statistics by ecoregion, etc.)
Draft Mapping Targets(NatureServe Ecological Systems)
3-date TM Satellite Imagery (30m resolution)
Training data from air photos plus
ground data
Land use data (NRCS Common Land Units)
Assign Information using soils, ecoregions, geology, ecological site
type, hydrology, slop, aspect, & elevation (“modeling”)
Design and Execute Presentation
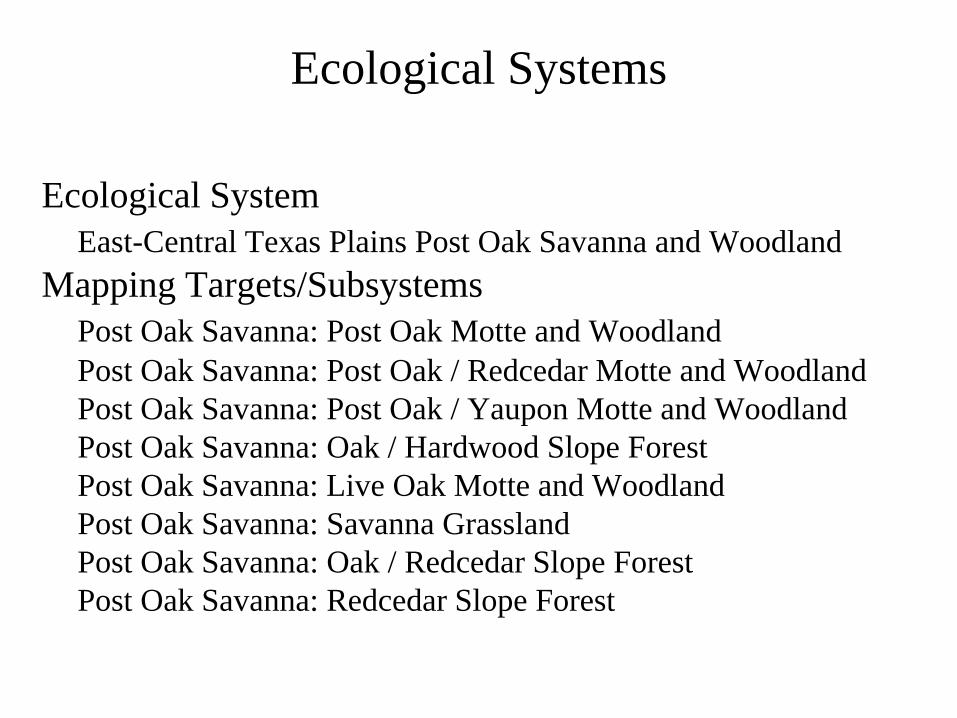
Ecological Systems
Ecological SystemEast-Central Texas Plains Post Oak Savanna and Woodland
Mapping Targets/Subsystems Post Oak Savanna: Post Oak Motte and WoodlandPost Oak Savanna: Post Oak / Redcedar Motte and WoodlandPost Oak Savanna: Post Oak / Yaupon Motte and WoodlandPost Oak Savanna: Oak / Hardwood Slope ForestPost Oak Savanna: Live Oak Motte and WoodlandPost Oak Savanna: Savanna GrasslandPost Oak Savanna: Oak / Redcedar Slope ForestPost Oak Savanna: Redcedar Slope Forest
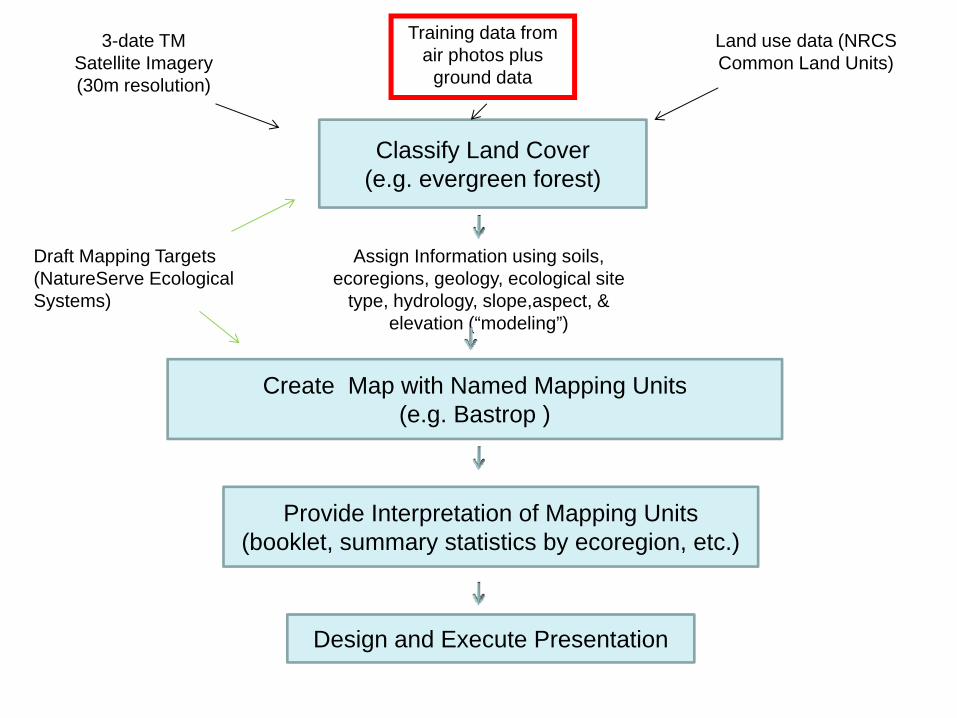
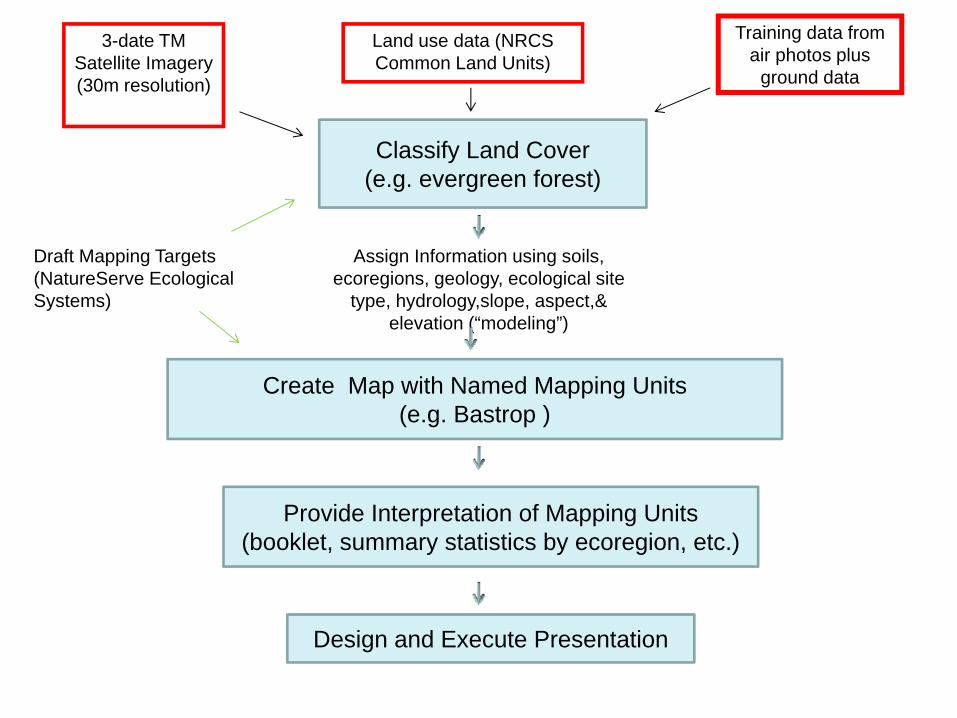
Classify Land Cover(e.g. evergreen forest)
Create Map with Named Mapping Units(e.g. Bastrop )
Provide Interpretation of Mapping Units(booklet, summary statistics by ecoregion, etc.)
Draft Mapping Targets(NatureServe Ecological Systems)
3-date TM Satellite Imagery (30m resolution)
Training data from air photos plus
ground data
Land use data (NRCS Common Land Units)
Assign Information using soils, ecoregions, geology, ecological site
type, hydrology, slope,aspect, & elevation (“modeling”)
Design and Execute Presentation

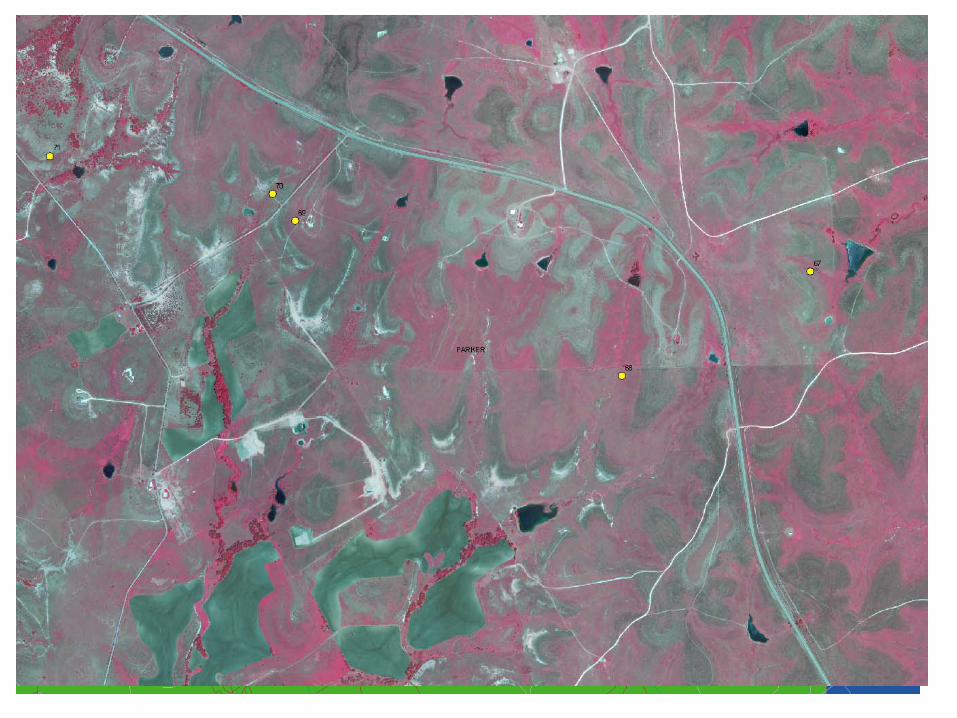
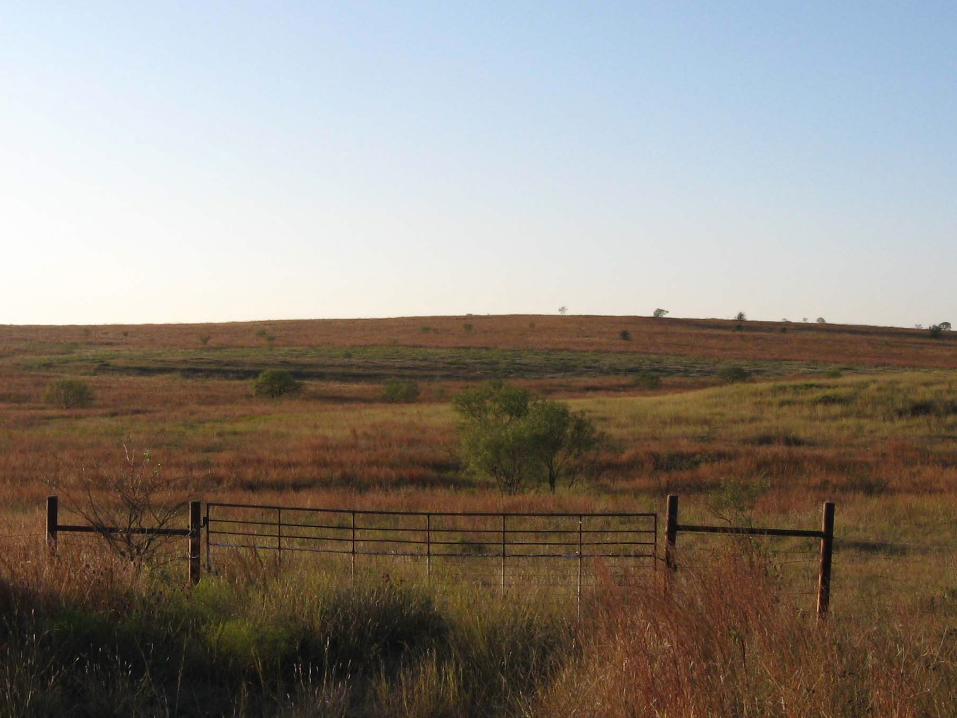
Field Data Collection• Roadside survey• GPS Location (Lat/Long)• Attributes
– Land Cover• i.e.: grassland, shrubland
– Percent cover• Woody components
– CEG , BLEG– tree, shrub
• Herbaceous– Dominant Species
• “top three” species– trees, shrubs, herbaceous
– Ecological Systems/Subsystems


Classify Land Cover(e.g. evergreen forest)
Create Map with Named Mapping Units(e.g. Bastrop )
Provide Interpretation of Mapping Units(booklet, summary statistics by ecoregion, etc.)
Draft Mapping Targets(NatureServe Ecological Systems)
3-date TM Satellite Imagery (30m resolution)
Training data from air photos plus
ground data
Land use data (NRCS Common Land Units)
Assign Information using soils, ecoregions, geology, ecological site
type, hydrology,slope, aspect,& elevation (“modeling”)
Design and Execute Presentation
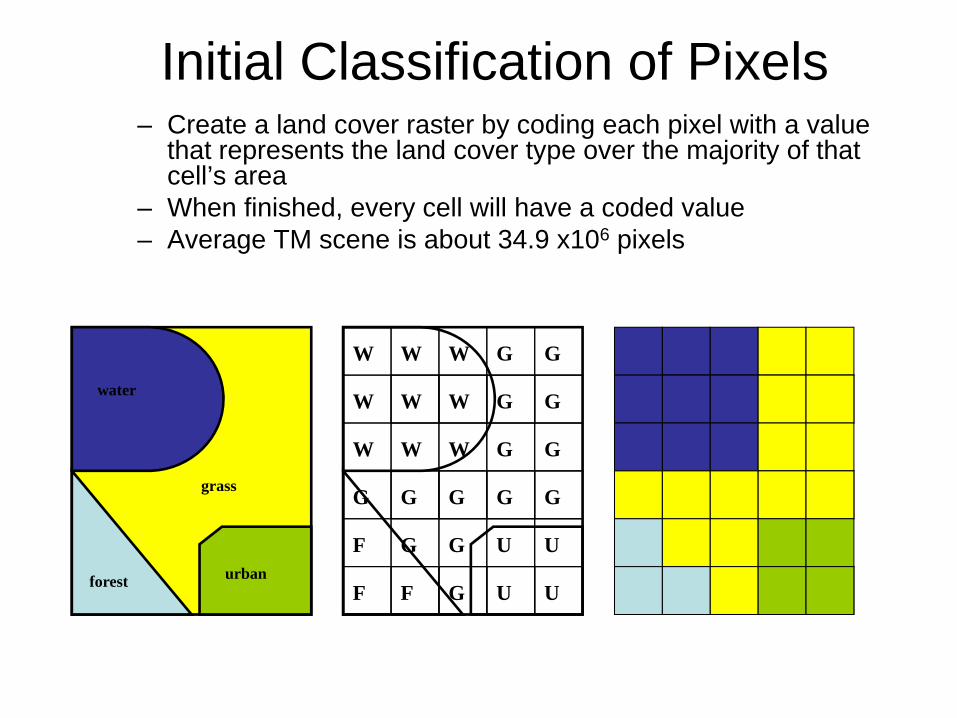
Initial Classification of Pixels– Create a land cover raster by coding each pixel with a value
that represents the land cover type over the majority of that cell’s area
– When finished, every cell will have a coded value– Average TM scene is about 34.9 x106 pixels
water
grass
forest urban
W W W
W W W
W W W
G G
G G
G G
G G G G G
G G U U
UUGF
F
F

Land Cover Class Barren
Barren/Impervious
BLEG Forest
CD Forest
CD Mixed Forest
CD Shrub
CEG Forest
Crop
EG Shrub
Grass Farm
Grassland
Marsh
Swamp
Urban High
Urban Low
Water
State Park

Classify Land Cover(e.g. cold deciduous forest)
Create Map with Named Mapping Units(e.g. Edwards Plateau: Deciduous Oak
Slope Forest)
Provide Interpretation of Mapping Units(booklet, summary statistics by ecoregion, etc.)
Draft Mapping Targets(NatureServe Ecological Systems)
3-date TM Satellite Imagery (30m resolution)
Training data from air photos plus
ground data
Land use data (NRCS Common Land Units)
Assign Information using soils, ecoregions, geology, ecological site
type, hydrology,slope,aspect,& elevation (“modeling”)
Design and Execute Presentation

Modeling Synopsis• Examined SSURGO, GAT, Ecological Site Types (ESTs)• Modeled:
– Historic vegetation to ESTs and to soils (Ecoclass)– Interpretation of current land cover to ESTs and soils (e.g.
evergreen forest on site type XX is ZZ mapping system)
• Rules applied: (Decision Tree)– Slope,aspect,elevation,landscape postion, hydrology,& EPA
ecoregion
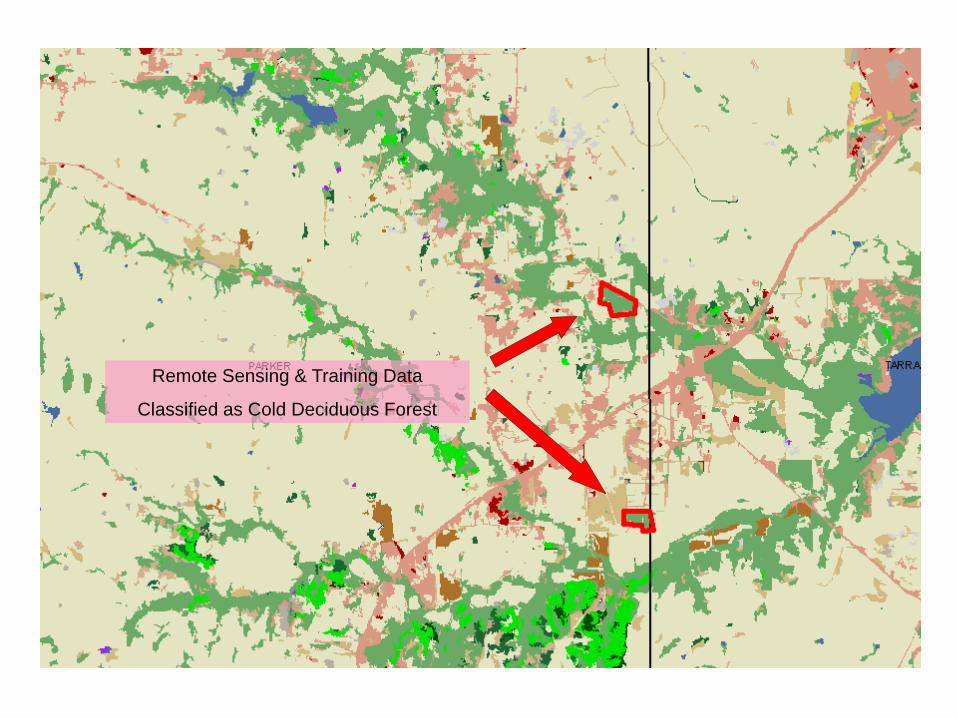
Remote Sensing & Training Data
Classified as Cold Deciduous Forest

SSURGO Soils – EcoClass - PE36-52 Loamy Sand
ESD – Historic - Post Oak Woodland
SSURGO Soils - EcoClass – PE40-54 Blackland
ESD – Historic – Tallgrass Prairie
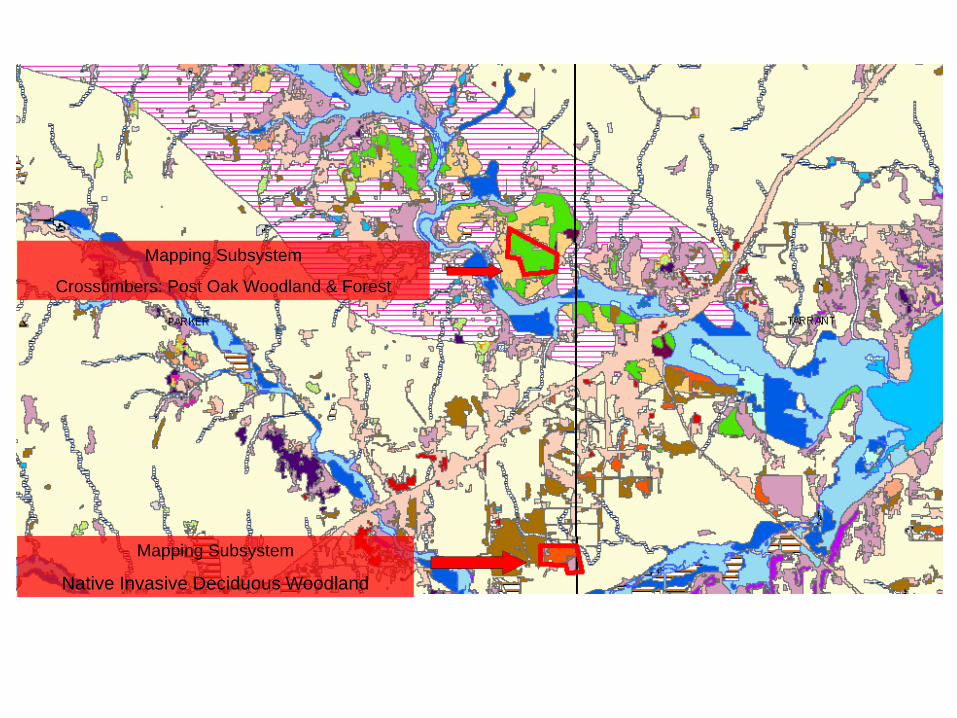
Mapping Subsystem
Crosstimbers: Post Oak Woodland & Forest
Mapping Subsystem
Native Invasive Deciduous Woodland
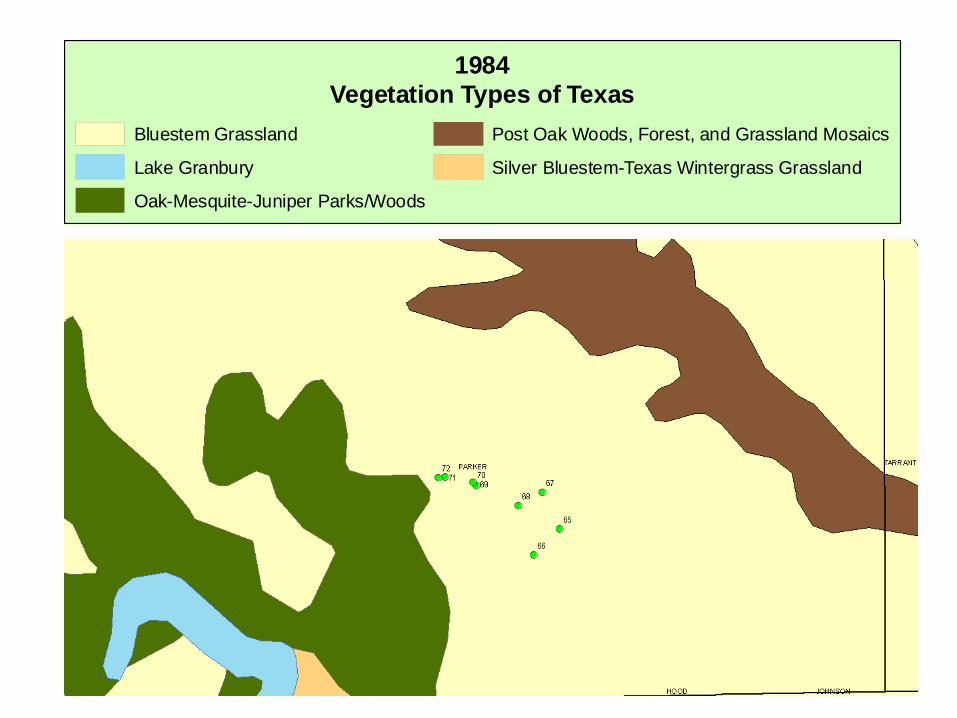
1984Vegetation Types of Texas
Bluestem Grassland
Lake Granbury
Oak-Mesquite-Juniper Parks/Woods
Post Oak Woods, Forest, and Grassland Mosaics
Silver Bluestem-Texas Wintergrass Grassland

Ecologic al Sys tem sBarren / Non-urban
Barren / Urban
Blackland Pra irie D istu rbance or Tam e G rassland
C rosstim bers Deciduous Slope Forest
C rosstim bers Deciduous-Jun ipe r S lope Forest
C rosstim bers Live Oak Forest and Wood land
C rosstim bers Post O ak Forest and Wood land
C rosstim bers Post O ak-Jun iper Forest and Woodland
C rosstim bers Sandyland Oak Wood land
C rosstim bers Savanna Grassland
East-C entra l Texas Pla ins Post Oak M otte and Woodland
Edw ards Pla teau Ashe Jun iper Dry -M esic Slope Forest and W ood land
Edw ards Pla teau Deciduous D ry-M esic S lope Fo rest and Wood land
Edw ards Pla teau Floodp la in Deciduous Forest and Wood land
Edw ards Pla teau Lim estone Ashe Juniper M otte and Forest
Edw ards Pla teau Lim estone Deciduous M otte and Wood land
Edw ards Pla teau Lim estone Deciduous-Ev ergreen M ot te and W ood land
Edw ards Pla teau Lim estone Evergreen Shrub land and Shrub M ot te
Edw ards Pla teau L im estone E ve rgreen Slope Shrub land
Edw ards Pla teau L im estone L ive Oak M ot te and F orest
Edw ards Pla teau L im estone S avanna G rassland
Edw ards Pla teau L im estone S hin Oak Shrubland and Shrub M ot te
Edw ards Pla teau L im estone S hin Oak Slope Sh rub land
Edw ards Pla teau L ive Oak D ry-M esic Slope F orest and Woodland
Edw ards Pla teau O ak-Ashe Jun iper D ry-M esic Slope Fo rest and Woodland
Gr ass Farm
M arsh
N ative Invas ive : Deciduous Wood land
N ative Invas ive : Jun iper Sh rub land
N ative Invas ive : Jun iper Wood land
N ative Invas ive : M esqu ite Sh rub land
Open Water
R owcrops
Southeaste rn Gr ea t P la ins Floodp la in Deciduous Forest and Woodland
Southeaste rn Gr ea t P la ins Floodp la in Deciduous Shrubland
Southeaste rn Gr ea t P la ins Floodp la in Evergreen Shr ub land
Southeaste rn Grea t P la ins Floodpla in Herbaceous Vegetat ion
Southeaste rn Grea t P la ins Floodpla in Jun iper F or est and Wood land
Southeaste rn Grea t P la ins Floodpla in Live Oak F or est and Wood land
Southeaste rn Grea t P la ins Floodpla in M ixed D eciduous F orest and Woodland
Southeaste rn Grea t P la ins Riparian D eciduous Fo rest and Wood land
Southeaste rn Grea t P la ins Riparian D eciduous Sh rub land
Southeaste rn Grea t P la ins Riparian Eve rgreen Shrub land
Southeaste rn Grea t P la ins Riparian H erbaceous Vegeta tion
Southeaste rn Grea t P la ins Riparian Jun iper Fo res t and Wood land
Southeaste rn Grea t P la ins Riparian L ive O ak Fo res t and Wood land
Southeaste rn Grea t P la ins Riparian M ix ed D eciduous Fo rest and Wood land
Southeaste rn Grea t P la ins Ta llgrass Pra irie
Southeaste rn Grea t P la ins Wooded Cliff/B lu ff
Sw am p
U rban H igh In tensity
U rban Low In tensity
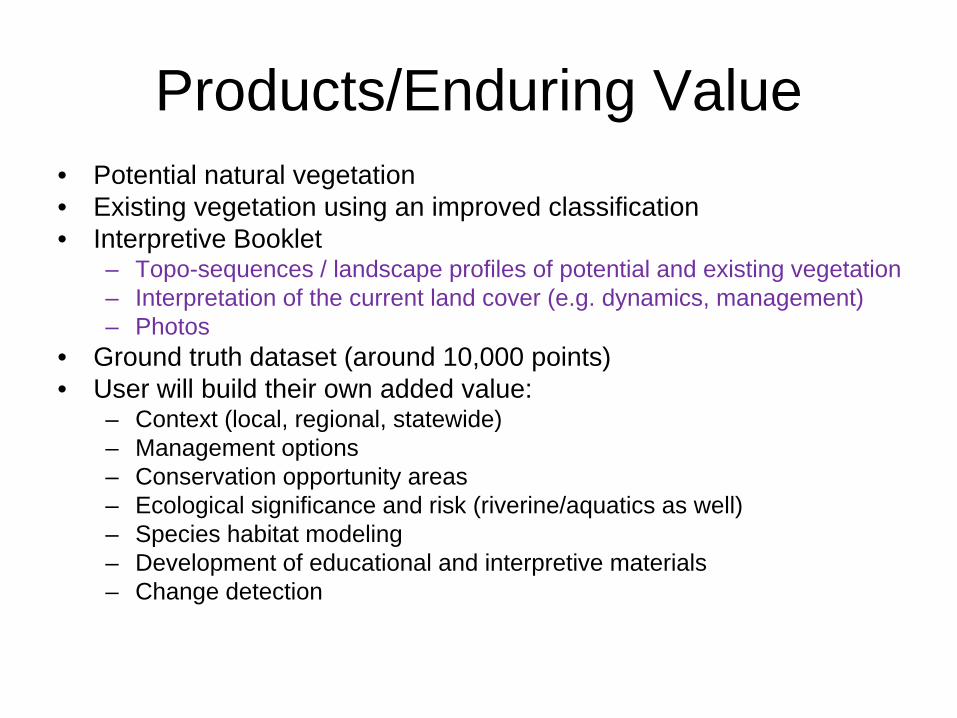
Products/Enduring Value• Potential natural vegetation• Existing vegetation using an improved classification• Interpretive Booklet
– Topo-sequences / landscape profiles of potential and existing vegetation– Interpretation of the current land cover (e.g. dynamics, management)– Photos
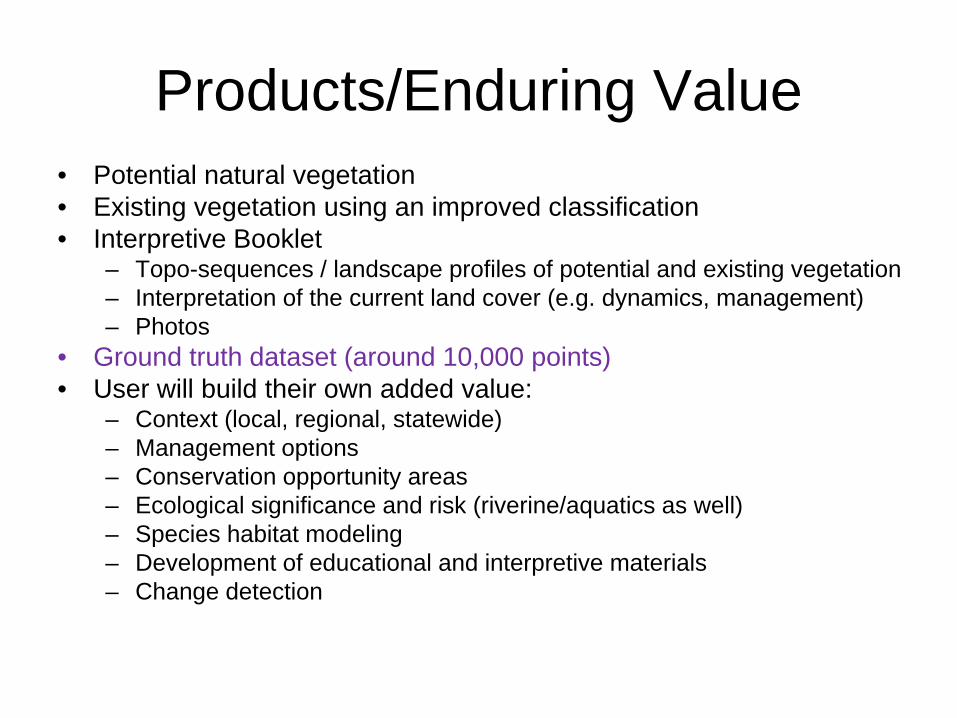
• Ground truth dataset (around 10,000 points)• User will build their own added value:
– Context (local, regional, statewide)– Management options– Conservation opportunity areas– Ecological significance and risk (riverine/aquatics as well)– Species habitat modeling– Development of educational and interpretive materials – Change detection

Interpretive Booklet
Products/Enduring Value• Potential natural vegetation• Existing vegetation using an improved classification• Interpretive Booklet
– Topo-sequences / landscape profiles of potential and existing vegetation– Interpretation of the current land cover (e.g. dynamics, management)– Photos
• Ground truth dataset (around 10,000 points)• User will build their own added value:
– Context (local, regional, statewide)– Management options– Conservation opportunity areas– Ecological significance and risk (riverine/aquatics as well)– Species habitat modeling– Development of educational and interpretive materials – Change detection
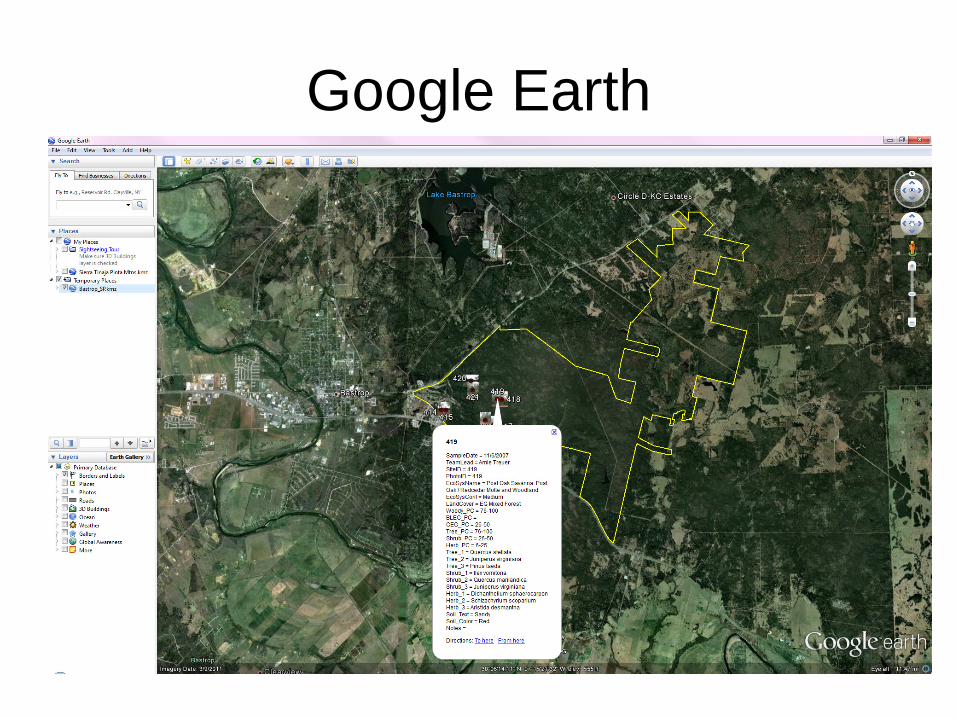
Google Earth

Google Earth

Web Application

Web Application

Products/Enduring Value• Potential natural vegetation• Existing vegetation using an improved classification• Interpretive Booklet
– Topo-sequences / landscape profiles of potential and existing vegetation– Interpretation of the current land cover (e.g. dynamics, management)– Photos
• Ground truth dataset (around 10,000 points)• User will build their own added value:
– Context (local, regional, statewide)– Management options– Conservation opportunity areas– Ecological significance and risk (riverine/aquatics as well)– Species habitat modeling– Development of educational and interpretive materials – Change detection
Questions?


![Review of Effective Vegetation Mapping Using the UAV ... · Mapping vegetation using satellite images may be more effective than mapping based on aerial photographs [3]. At present,](https://img.dokumen.tips/doc/110x75/5ed510f6701442424c0b7a6a/review-of-effective-vegetation-mapping-using-the-uav-mapping-vegetation-using.jpg)