Embed Size (px)
Citation preview
University of Wollongong University of Wollongong
Research Online Research Online
Faculty of Science, Medicine and Health - Papers: Part B Faculty of Science, Medicine and Health
1-1-2018
Mapping the Lagoon at Aldabra Atoll, Western Indian Ocean Mapping the Lagoon at Aldabra Atoll, Western Indian Ocean
Sarah Hamylton University of Wollongong, [email protected]
Annelise Hagan University of Cambridge
Nancy Bunbury Seychelles Islands Foundation
Frauke Fleischer-Dogley Seychelles Islands Foundation
Tom Spencer University of Cambridge, [email protected]
Follow this and additional works at: https://ro.uow.edu.au/smhpapers1
Publication Details Citation Publication Details Citation Hamylton, S., Hagan, A., Bunbury, N., Fleischer-Dogley, F., & Spencer, T. (2018). Mapping the Lagoon at Aldabra Atoll, Western Indian Ocean. Faculty of Science, Medicine and Health - Papers: Part B. Retrieved from https://ro.uow.edu.au/smhpapers1/282
Research Online is the open access institutional repository for the University of Wollongong. For further information contact the UOW Library: [email protected]

Mapping the Lagoon at Aldabra Atoll, Western Indian Ocean Mapping the Lagoon at Aldabra Atoll, Western Indian Ocean
Abstract Abstract Aldabra Atoll occupies a unique place among the world's atolls due to the wealth of biodiversity it supports, its relatively undisturbed status and its designation as a World Heritage Site. This landmark conservation designation was due largely to the scientific advocacy and campaigning work of David Stoddart, with its strong focus on creating detailed and accurate inventories of the biological and physical attributes of this remote atoll. The lagoon mapping campaign described in the present study continues this tradition, making use of recent developments in geospatial technology to provide a detailed snapshot of the large and shallow lagoon that has hitherto been unavailable to physical and ecological science. Here we provide the first detailed maps of benthic community character and bathymetry in the Aldabra lagoon, the output of two related mapping exercises undertaken in February 2009 as part of a collaborative project between Cambridge Coastal Research Unit and the Seychelles Islands Foundation. The lagoon environment of Aldabra Atoll was mapped using satellite remote sensing techniques in conjunction with detailed in situ ground-referencing conducted over a 3.5 week period with the aim of creating large-scale, high resolution habitat and bathymetry maps. A series of closed loop levelling surveys were undertaken to establish the relative positioning of a network of five benchmarks around the Research Station, providing a common vertical datum against which the bathymetric map could be referenced. Eight habitat groupings were identified in the lagoon, with the two dominant classes mapped being "sparse macroalgae and seagrass assemblage on sand" and "dense macroalgal mat on sand", which covered 35% and 33% of the lagoon area respectively. Variations in lagoon floor elevation range from -0.2 to -30 m. Much of the lagoon is a flat, shallow (<3>m) platform and the deepest areas are associated with the channels, particularly Grande Passe in the northwest. These maps represent a detailed record of the contemporary lagoon character against which future change of the lagoon environment can be monitored.
Keywords Keywords indian, western, atoll, aldabra, ocean, lagoon, mapping
Publication Details Publication Details Hamylton, S., Hagan, A., Bunbury, N., Fleischer-Dogley, F. & Spencer, T. (2018). Mapping the Lagoon at Aldabra Atoll, Western Indian Ocean. Atoll Research Bulletin, 619 45-59.
This journal article is available at Research Online: https://ro.uow.edu.au/smhpapers1/282

45
MAPPING THE LAGOON AT ALDABRA ATOLL, WESTERN INDIAN OCEAN
SARAH HAMYLTON1,2, ANNELISE HAGAN1, NANCY BUNBURY3, FRAUKE FLEISCHER-DOGLEY3, and TOM SPENCER1
ABSTRACT
Aldabra Atoll occupies a unique place among the world’s atolls due to the wealth of biodiversity it supports, its relatively undisturbed status and its designation as a World Heritage Site. This landmark conservation designation was due largely to the scientific advocacy and campaigning work of David Stoddart, with its strong focus on creating detailed and accurate inventories of the biological and physical attributes of this remote atoll. The lagoon mapping campaign described in the present study continues this tradition, making use of recent developments in geospatial technology to provide a detailed snapshot of the large and shallow lagoon that has hitherto been unavailable to physical and ecological science. Here we provide the first detailed maps of benthic community character and bathymetry in the Aldabra lagoon, the output of two related mapping exercises undertaken in February 2009 as part of a collaborative project between Cambridge Coastal Research Unit and the Seychelles Islands Foundation. The lagoon environment of Aldabra Atoll was mapped using satellite remote sensing techniques in conjunction with detailed in situ ground-referencing conducted over a 3.5 week period with the aim of creating large-scale, high resolution habitat and bathymetry maps. A series of closed loop levelling surveys were undertaken to establish the relative positioning of a network of five benchmarks around the Research Station, providing a common vertical datum against which the bathymetric map could be referenced. Eight habitat groupings were identified in the lagoon, with the two dominant classes mapped being “sparse macroalgae and seagrass assemblage on sand” and “dense macroalgal mat on sand”, which covered 35% and 33% of the lagoon area respectively. Variations in lagoon floor elevation range from -0.2 to -30 m. Much of the lagoon is a flat, shallow (<3 m) platform and the deepest areas are associated with the channels, particularly Grande Passe in the northwest. These maps represent a detailed record of the contemporary lagoon character against which future change of the lagoon environment can be monitored.
INTRODUCTION Broadly, an atoll is defined as a circular or irregularly shaped, isolated oceanic reefs at or near sea level that enclose a lagoon usually tens of meters deep. The shallow and emergent margin of atolls contains islands and reefs around the outer rim, which typically comprise a smaller area than the lagoon (Goldberg, 2016). The UNESCO World Heritage site of Aldabra Atoll, Seychelles, western Indian Ocean, is well known as one of the most remarkable and least disturbed oceanic atolls on Earth. With only a small research station on Picard Island, human influence at Aldabra is extremely low and the atoll is a refuge for many endangered and endemic species. Amongst these are the Aldabra giant tortoise of which there are around 100,000; one of the largest congregations of nesting green turtles in the Indian Ocean; the world’s second largest breeding population of greater and lesser frigate birds; and the last flightless bird species in the Indian Ocean, the white-throated rail (Stoddart and Ferrari, 1983). From the late 1960s, when the Royal Society of London established a research station on the atoll, to the early 1980s, a vigorous international research effort, amounting to over 50 years of person-effort (Stoddart, 1979), was applied to understanding many elements of this complex ecosystem (including terrestrial vegetation community mapping, geological mapping and tortoise population dynamics); that work has been
1 Cambridge Coastal Research Unit, Department of Geography, University of Cambridge, UK 2 School of Earth and Environmental Sciences, University of Wollongong, Australia 3 Seychelles Islands Foundation, La Ciotat building, Mont Fleuri, Victoria, PO Box 853, Seychelles
46
subsequently taken forward by the officers and research associates of the Seychelles Island Foundation (SIF). However, the physical and ecological characteristics of the atoll’s lagoon are still, beyond its immediate rocky (Taylor, 1978) and mangrove-fringed (Macnae, 1971) margins, largely unknown. This is perhaps not surprising; it is a highly challenging environment in which to work, due to its great size and large flood and ebb tide fluxes (the atoll experiences a meso-tidal regime and nearly three quarters of the lagoon drains at low tide). These fluxes are associated with high tidal velocities that restrict small boat access and usage and the deployment of fixed instrumentation. Given the rapidly changing water levels that result from the semi-diurnal tidal fluctuations, the likelihood of seasonally variable water surface slopes across the lagoon and the lack of accurate positional information, conventional line or echo-sounding surveys related to a water surface datum are not possible. Rather, these difficulties mean that habitat mapping through remote sensing is the only way in which to map this environment within a relatively short time-frame. In February 2009, a team from Cambridge Coastal Research Unit, ably supported by local SIF personnel, embarked on a 3.5 week expedition to map the lagoon environment of Aldabra Atoll, using satellite remote sensing techniques in conjunction with detailed in situ ground-referencing with the aim of creating a large-scale high resolution habitat map. Two related mapping exercises were undertaken, which focused on the benthic community character and the bathymetry of the lagoon (Hamylton et al., 2012a). Both hard copy and digital forms of this map have helped to fill knowledge gaps of western Indian Ocean marine biodiversity, for example, in modelling habitat suitability for dugong (Dugong dugon; Hamylton et al., 2012b) and have been incorporated into site management plans. These outputs represent a first baseline record of lagoon condition against which future change of the lagoon environment can be monitored. Location and Environment
Located 420 km northwest of Madagascar and 620 m east of mainland Africa, Aldabra Atoll (9°24′S, 46°22′E) is one of the largest atolls in the world, with a total area of 365 km2 (Andréfouët et al., 2009). The lagoon, at 203 km2, accounts for over half of the total area and is encircled by a series of narrow islands averaging 2 km in width (Figure 1). The four main islands of Grand Terre, Malabar, Picard and Polymnie are composed of 125, 000 year old limestone in the form of two platforms at +4 m and +8 m above present mean sea level (Stoddart, 1984). The islands are separated by a number of deep (10-30 m depth) narrow channels that connect the lagoon to the surrounding ocean. Initial measurements of tidal dynamics at Aldabra were made by HMS Owen, in a side channel to Grande Passe (Main Channel; Figure 1), between 14 January – 12 February 1962 and then by HMS Vidal over a 4 day period in 1967 (4 – 8 September). These records were, however, very short, and severely compromised by being within the tidal passes. The early benchmark paper on tidal dynamics at Aldabra is that by Farrow and Brander (1971). They variously occupied a number of stations within the lagoon and at the entrance to the passes, with detailed (but daylight) studies at Passe Houareau (East Channel) and Passe Gionnet (Figure 1); their prime station was in the West Channels, at Passe du Bois, and related to the Vidal benchmark on the islet at that site. Farrow and Brander (1971) had no long-term tidal records available and used published predictions for Kilindini/Dar es Salaam, over 600 km to the west of the atoll, to establish tidal curves for any station in the lagoon from the predicted Kilindini tidal curves. Subsequently, David Pugh undertook a year (1975–1976) of water level recording and analysis from a tide gauge positioned off the reef edge mid-way between the Research Station and Old Settlement on Picard (for bathymetry see Drew, 1977). This revealed that the compression of the rising and falling tide through a small number of channels into and out of the lagoon substantially modifies the semi-diurnal rhythm of the open ocean (a high tide every 12 hours), resulting in a reduced tidal range inside the lagoon. Thus, for example, whilst the tidal range at mean spring tides outside the atoll is 2.74 m, at Passe Houareau (500 m into the lagoon from the channel mouth) the spring tidal range is only 1.2 m (Pugh and Rayner, 1981; Pugh, 1979). At the far eastern end of the atoll, at Bras Takamaka, high water is delayed by 4.5 hours at greatest spring tides; at neaps the whole region is dry at high water. Similar patterns characterise the southern margin of the lagoon, with a lag time of 3.5 hr at Dune Jean-Louis. At low

47
Figure 1. Location of Aldabra Atoll and map of Aldabra showing the four main islands of Grand Terre, Malabar, Picard and Polymnie. Channels connecting the lagoon to the open ocean are A) West Channels (including Passe du Bois); B) Grand Passe; C) Passe Gionnet; and D) Passe Houareau.
spring tides a substantial area of lagoon floor is also exposed at Dune d’Messe. The only places where there is reliable water at lowest springs are around the limestone islets within Passe Gionnet and along the westernmost and easternmost sectors of Malabar (Middle) Island. Little is known about lagoon tidal curves although they are thought to be asymmetrical, with ebb drainage for 9.5 – 10 hrs of the 12.5 hr tidal cycle. Towards spring tide, more water enters Passe Houareau than can drain away before the next tide. Water level gradually builds up until at high spring tides approximately 0.3 m water depth covers the lagoon platform. Extreme low water coincides with neap tides. Tidal currents are extreme: 1.5 m s-1 at Passe du Bois (one of the Western channels), probably reaching 3 m s-1 at Passe Houareau and over 3 m s-
1 at Passe Gionnet, peaking at 3.7 m s-1 (Farrow and Brander, 1971).
METHODS
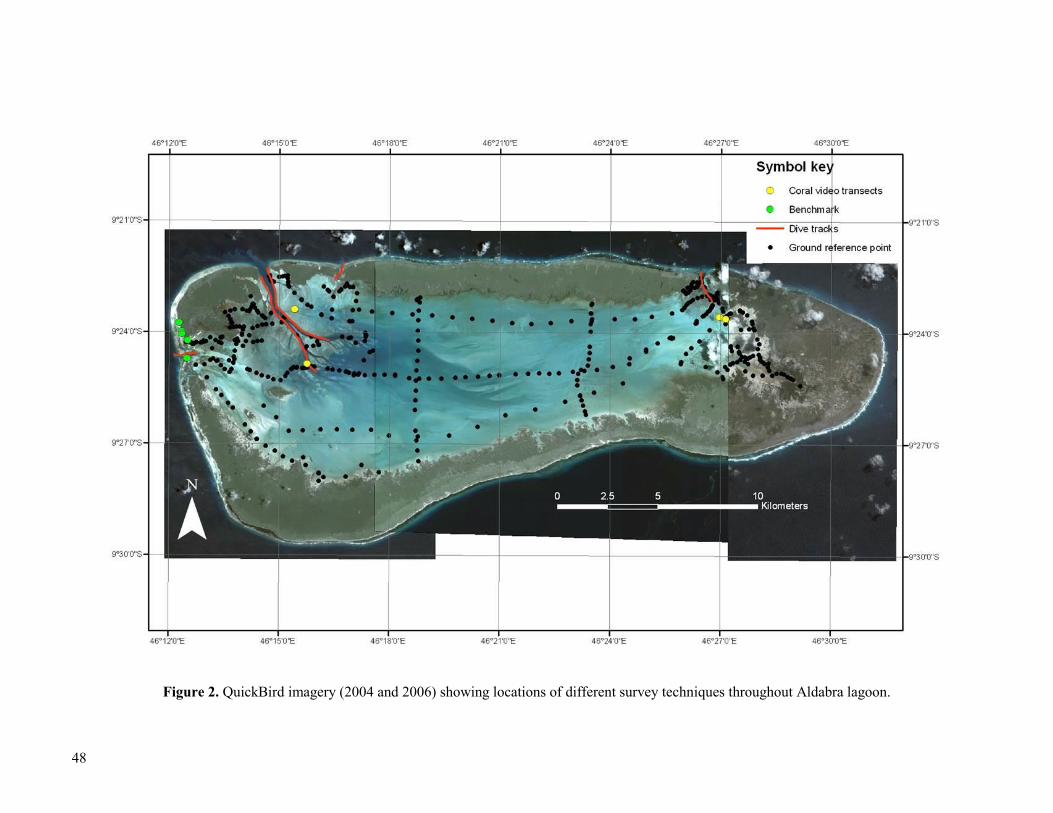
Mapping the Benthic Community Character of Aldabra Lagoon Ground Referencing from Boat-based and in-situ SCUBA Surveys Records of the lagoon surface character were collected at 486 locations throughout the largely shallow and sheltered lagoon from a small boat (see Figure 2). Estimates of the areal coverage of different benthic classes were generated from a snapshot (typically 30 seconds) of oblique underwater video footage, covering an area of 10 m. This was captured by a Seaviewer drop camera mounted on 50 m length of submarine cable. Within the lagoon, the depths of video referencing locations ranged from 1 m to approximately 20 m. The tethered underwater video camera was lowered to drift approximately 10 cm above the lagoon floor. The geographical position of each footage sample was recorded by a differential GPS on the boat (positional accuracy ± 0.2 m). Video camera surveys allowed efficient ground referencing over an extensive area of the lagoon during the 3.5 week fieldwork period.
48
Figure 2. QuickBird imagery (2004 and 2006) showing locations of different survey techniques throughout Aldabra lagoon.
49
In addition to the boat based observations, five SCUBA diving surveys were carried out using standard underwater video transect techniques to assess benthic community structure and species composition at key sites coincident with channels in the eastern and western sides of the lagoon (see Figure 2). Sites were selected that characterised the different coral and sediment biofacies provisionally identified by Farrow (1971) and Taylor (1978). Localised details of community composition were recorded for a belt transect along the reef measuring 30 m x 0.8 m at pre-determined depths. These quantitative surveys complemented the larger area surveys from the tethered video camera.
Analysis of Ground Referencing Video Footage All underwater video footage collected from the boat and via scuba surveys was examined and the relative proportional cover, totalling 100%, of one or more of the following 21 benthic classes was visually estimated: Bare carbonate sand; bedrock; coral rubble; coral rubble with turf; sponges; live coral; dead coral; coralline algae; Thalassodendron ciliatum; Thalassia hemprichii; Halodule sp.; Halophila ovalis; Enteromorpha sp.; Green algal turf; Hypnea esperi; Caulerpa spp.; Halimeda spp.; Hydroclathrus clathrus; algal mat; red fleshy algae; and Sargassum binderi. Percentage cover was chosen in order to standardise between differing areas covered by these distinctive and easily identifiable assemblages. The dataset generated from video footage analysis was subsequently used to develop a classification scheme for the lagoon habitat map. A multivariate pair-wise Bray-Curtis cluster analysis was conducted on the coverage statistics (Bray and Curtis, 1957). This cluster analysis identified natural groupings in the samples which formed the basis of the distinct class groupings for the lagoon habitat map (Clarke and Warwick, 2001). Satellite Image Processing Three QuickBird images acquired between February 2004 and March 2006 provided synoptic coverage of the lagoon. Pre-processing procedures were applied to the three satellite images prior to classification. These procedures included an empirical line atmospheric correction (Karpouzli and Malthus, 2003); image masking to remove land areas; and water column correction (Lyzenga, 1981). A maximum likelihood unsupervised classification was performed on the three images to produce a single, classified thematic digital map composed of 30 classes. These were subsequently interpreted with respect to the ground-referencing dataset from the video footage records. A detailed description of the image processing techniques applied to generate the map can be found elsewhere (Hamylton et al., 2012b). Habitat Map Validation The resulting habitat map was validated using an independent set of 97 underwater photographs collected by Aldabra Research Station staff. These covered a representative range of benthic habitat types within the lagoon. Validation proceeded by overlaying each photograph onto the habitat map and recording the class identified on the map. In a separate validation exercise, all photographs were independently viewed and assigned a class with respect to the eight classes of the classification scheme. Class assignments arising from the classification algorithm and the separate validation exercise were compared and the overall accuracy was defined as the proportion of underwater photographs that were assigned the same class by both approaches (Congalton, 1991). Mapping the Bathymetry of Aldabra Lagoon Establishing accurate vertical positioning Any work on lagoon water levels must be related to a common tidal datum, generally taken to be mean sea level. Peter Dale and a team of students from the Department of Geography, Cambridge University established a network of benchmarks around the seaward perimeter of the atoll rim in 1970, related to the Vidal benchmark established in 1967; the nearest surviving benchmark to the Vidal marker is station AB7 (Dale, 1972). A further benchmark was established in May 1975 by the UK Institute of Oceanographic Sciences (Main Tide Gauge IOS; see Pugh, 1978 for details). Finally, two benchmarks were emplaced by the Surveys Division of the Seychelles Government, by differential GPS methods, as

50
part of the Seychelles Maritime Boundaries Project (pers. comm. Chang-Tave, 2009; Map Geosystems Report); these are known as ‘Republic of Seychelles Survey Marker (GPS Control 1998) No. 1501 and No. 1502.’ This study reports the first inter-comparison of these different benchmarks around the Research Station on Aldabra. A base station was established at the Main Tide Gauge IOS benchmark and height differences between all benchmarks were determined by semi-automatic level surveys; in all cases, closure errors were <0.007 m (Figure 3; Table 1).
Figure 3. Conducting semi-automatic level surveys to calculate relative height differences between benchmarks.
51
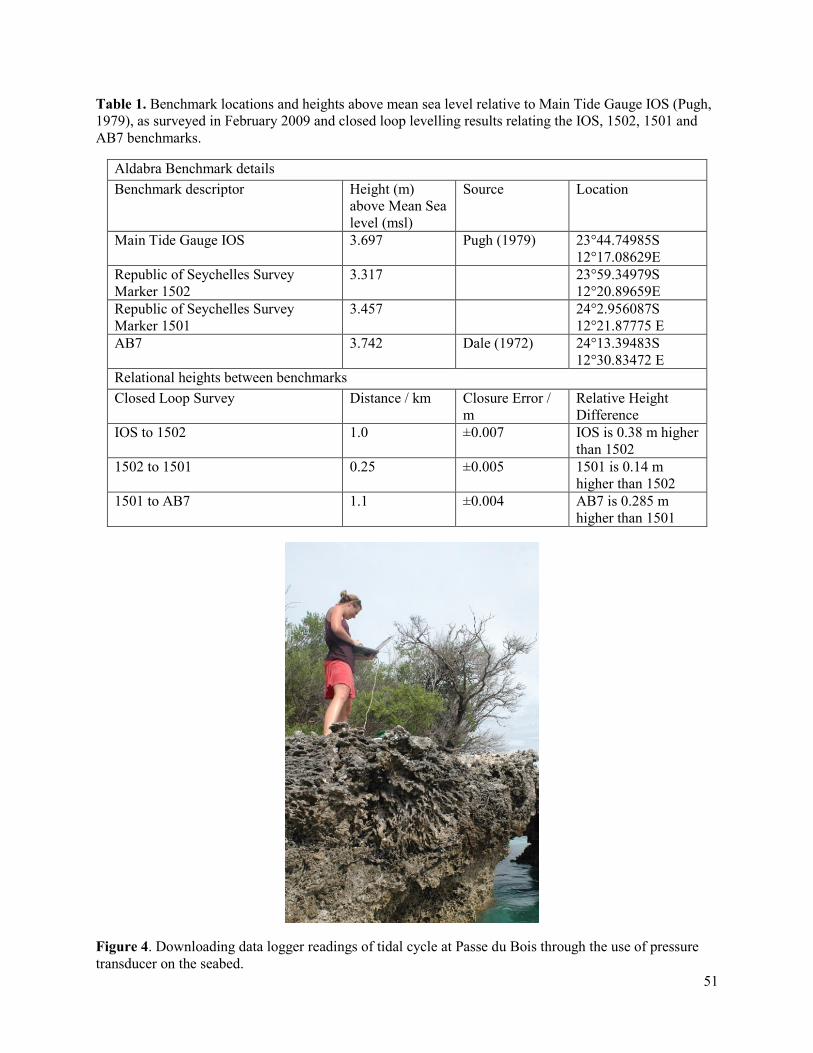
Table 1. Benchmark locations and heights above mean sea level relative to Main Tide Gauge IOS (Pugh, 1979), as surveyed in February 2009 and closed loop levelling results relating the IOS, 1502, 1501 and AB7 benchmarks.
Aldabra Benchmark details Benchmark descriptor Height (m)
above Mean Sea level (msl)
Source Location
Main Tide Gauge IOS 3.697 Pugh (1979) 23°44.74985S 12°17.08629E
Republic of Seychelles Survey Marker 1502
3.317 23°59.34979S 12°20.89659E
Republic of Seychelles Survey Marker 1501
3.457 24°2.956087S 12°21.87775 E
AB7 3.742 Dale (1972) 24°13.39483S 12°30.83472 E
Relational heights between benchmarks Closed Loop Survey Distance / km Closure Error /
m Relative Height Difference
IOS to 1502 1.0 ±0.007 IOS is 0.38 m higher than 1502
1502 to 1501 0.25 ±0.005 1501 is 0.14 m higher than 1502
1501 to AB7 1.1 ±0.004 AB7 is 0.285 m higher than 1501
Figure 4. Downloading data logger readings of tidal cycle at Passe du Bois through the use of pressure transducer on the seabed.

52
Interestingly, the difference in elevation between the height of AB7 from our surveys (+3.742 m above mean sea level) and that derived from reference to the Vidal benchmark alone by Dale (1972; +3.620 m) is 0.122 m. The difference in height between AB7 and the Vidal benchmark was not re-established. We therefore take Dale’s (1972; Table 1) height differential for this comparison; the Vidal mark is 1.67 m lower than AB7. Semi-diurnal tidal cycles were measured throughout the fieldwork period using a pressure transducer placed on the seabed in Passe du Bois, at the western end of Ilot Du Bois. Tidal fluctuation readings were recorded with a Campbell 21X Micrologger and downloaded every three days (Figure 4). The height of the sensor was established relative to the Vidal benchmark, thereby providing the means to relate the tidal measurements collected to a common island datum.
Estimating Lagoon Depths from Satellite Images Two hundred and thirteen depth measurements were collected from the lagoon using a hand-held HawkEye single beam bathymetric sonar sounder and corrected to the common vertical datum of mean sea level as determined by field levelling and water depth measurements (see above). As with the ground referencing footage, the geographical position of each measurement was recorded by differential GPS on the boat (positional accuracy ±0.2 m). A detailed description of the image processing associated with the bathymetric mapping has been published elsewhere (Hamylton et al., 2012a). A band ratio transformation was applied to estimate the water depth of each image pixel from the satellite images. This was based on the relationship between the ratio of the green (560 nm) and blue (485 nm) wavelength bands of the satellite image and water depth (Stumpf et al., 2003). Depth estimations from the resulting digital bathymetric map were then compared with an additional 188 point water depth measurements recorded in the field.
RESULTS
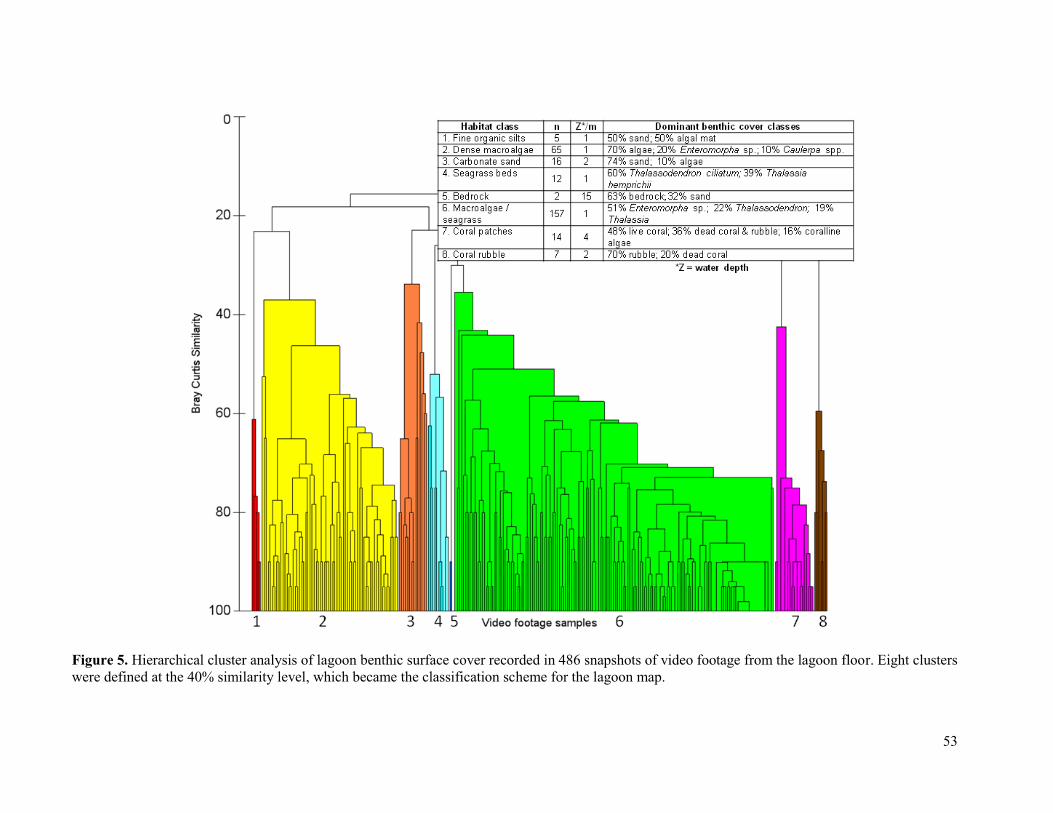
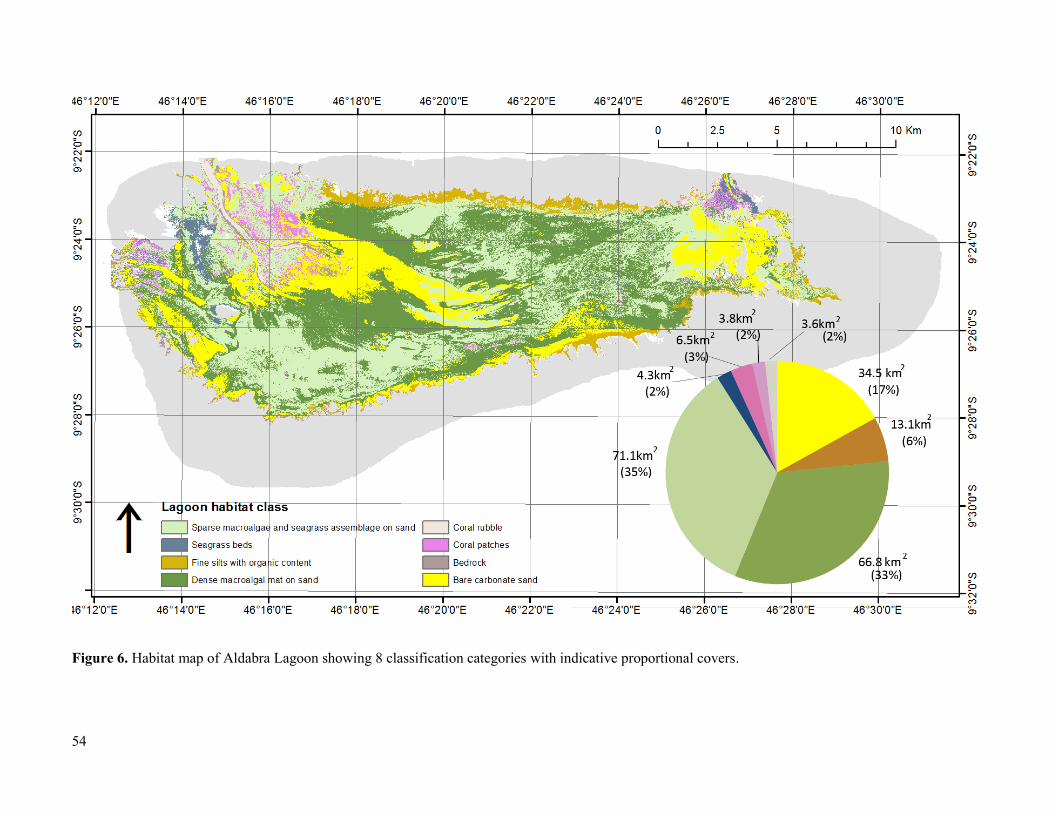
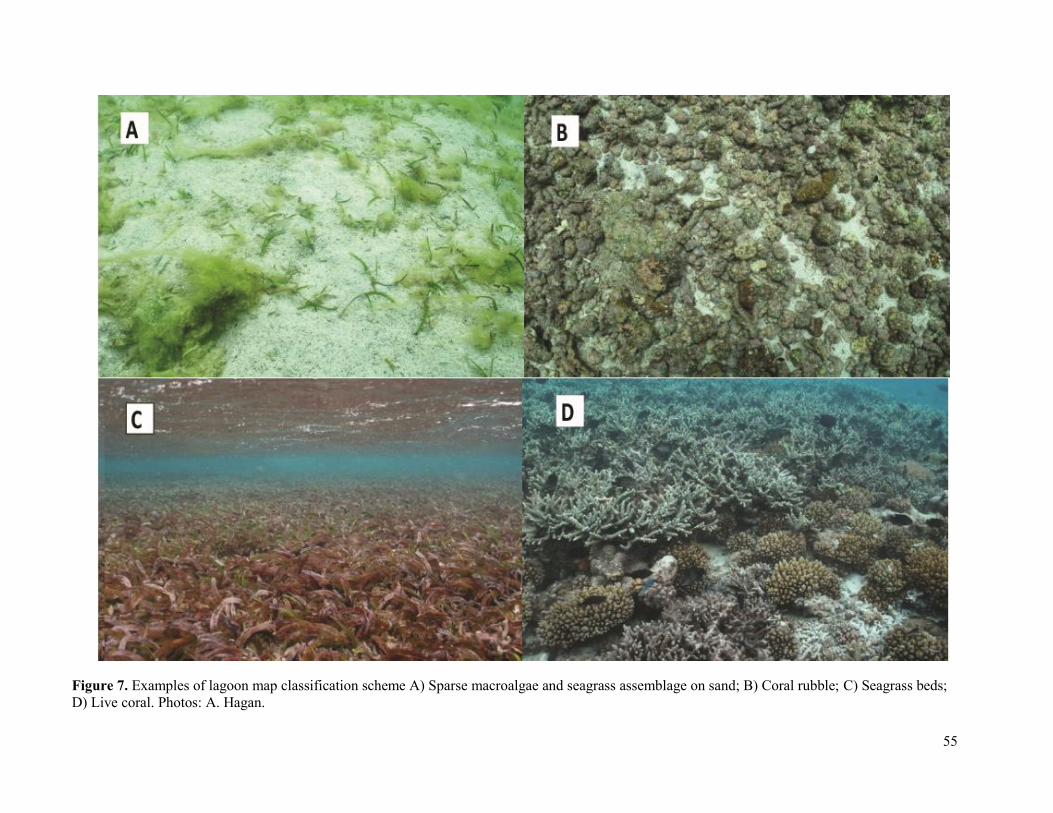
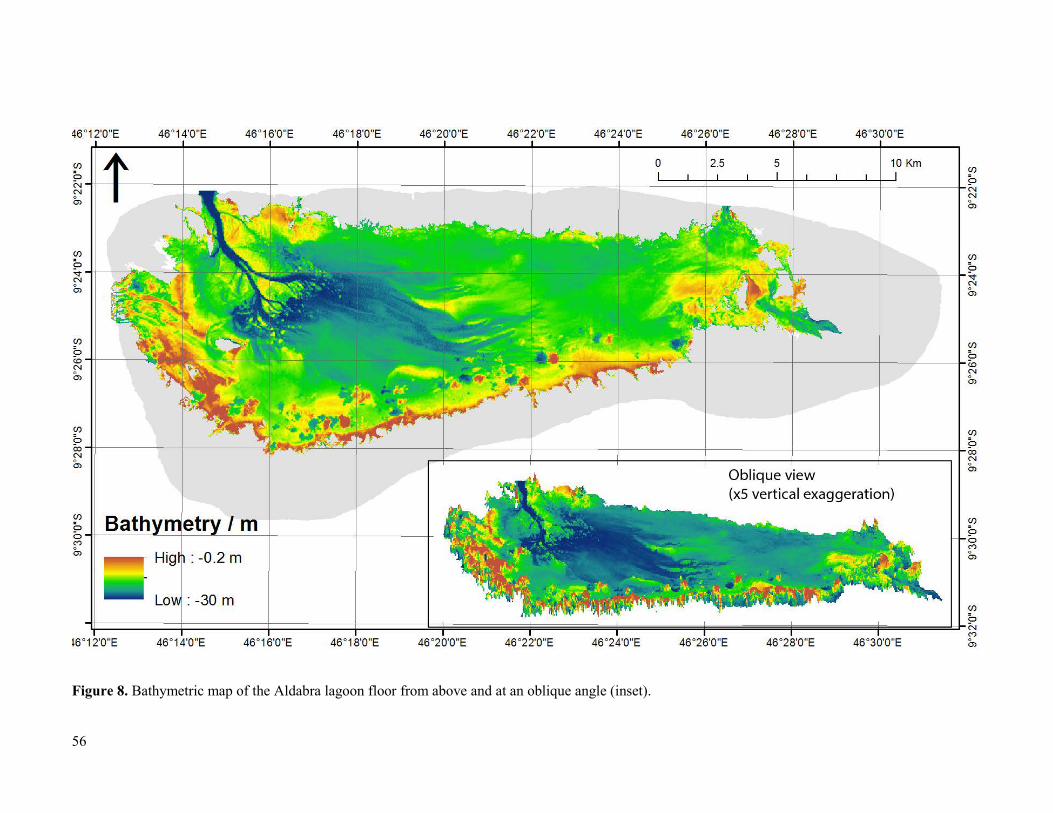
Eight habitat groupings emerged from the cluster analysis of the ground-referencing points at the 40% level of Bray–Curtis similarity. A habitat scheme was developed on the basis of these clusters, which became the key for the habitat map and these were aligned with the interpretations of classes produced by the image classification (Figure 5). The spectral detail of the QuickBird images was sufficient to generate a preliminary lagoon classification of 30 classes, which was subsequently generalised into 8 classes (Figure 6). These aligned with the 8 natural groupings identified in the cluster analysis (Figure 5). The two dominant classes mapped were “sparse macroalgae and seagrass assemblage on sand” and “dense macroalgal mat on sand”, which covered 35% and 33% of the lagoon area respectively. Aside from algae and seagrasses, other notable habitat classes were bare carbonate sand (17% of the lagoon area) and, around the periphery of the lagoon in association with fringing mangroves, finer sand with organic matter. The remaining classes of coral, coral rubble, bedrock and seagrass beds occurred in the vicinity of the channels, particularly the northern channels of Grande Passe in the west and Passe Houareau in the east (see Figure 7 for example photos). Across all 8 classes, the digital map had an overall accuracy of 65%. The main spectral confusion appeared to arise in distinguishing between macroalgae and seagrass, thus, when these classes were merged, the overall accuracy of the map improved to 72%. Estimates of lagoon floor elevation in relation to mean sea level ranged from -0.2 to -30 m. The deepest areas were associated with the channels, particularly Grande Passe in the northwest (Figure 8). Here, the channel subdivided into two main veins running into the lagoon centre to create a deeper dish (6–8 m deep) on the western side of the lagoon. Much of the lagoon in the east and around the rest of the periphery was shallow (<3 m). The shallowest areas of the lagoon were along the shorelines marking the inner margin of the southern lagoon boundary.
53
Figure 5. Hierarchical cluster analysis of lagoon benthic surface cover recorded in 486 snapshots of video footage from the lagoon floor. Eight clusters were defined at the 40% similarity level, which became the classification scheme for the lagoon map.
54
Figure 6. Habitat map of Aldabra Lagoon showing 8 classification categories with indicative proportional covers.
55
Figure 7. Examples of lagoon map classification scheme A) Sparse macroalgae and seagrass assemblage on sand; B) Coral rubble; C) Seagrass beds; D) Live coral. Photos: A. Hagan.
56
Figure 8. Bathymetric map of the Aldabra lagoon floor from above and at an oblique angle (inset).

57
DISCUSSION
Previous descriptions of the nature of lagoon substrates, by Farrow (1971), Taylor (1978) and Stoddart (1984) have been highly generalized, often stressing the uniformity of cover types. We suggest that these descriptions are an artefact of the difficulty in studying the nature of the Aldabra lagoon floor and its spatial variability. Even when simplifying the 21benthic categories into 8 classes, the detailed character of the lagoon substrate is apparent (Figure 6). The two dominant classes mapped “sparse macroalgae and seagrass assemblage on sand” and “dense macroalgal mat on sand” collectively cover 68% of the lagoon area. These occur mainly on the shallower expanses of lagoon floor that are situated further away from the main channels, and are not therefore subject to the increased hydrodynamic flows that drain the lagoon each tidal cycle. Aldabra Atoll would greatly benefit from further application of modern mapping techniques, particularly a LiDAR survey incorporating both the terrestrial and marine environments, and the establishment of regular, repeated drone surveys to monitor areas of management interest. One such area emerging from the present study would be the north western lagoon along Grande Passe. This, the largest (widest and deepest) channel connecting the lagoon to the open ocean, experiences substantial currents over the course of each tidal cycle, and supports a relatively high level of benthic diversity, including diverse coral and seagrass assemblages. This situation appears largely unchanged since 1978, when Taylor (1978, 19), described the lagoon floor as ‘generally rock bottomed, but may have a thin cover of fine sand or silt. Near the channels the hydrodynamic situation is much more complex and a mosaic of habitats is developed, with accumulations of sand, beds of marine angiosperms, coral patches and mixed sand and coral areas’. A further set of tidal measurements at a single point on Aldabra would be of limited value. The problem of tidal variations around the Atoll and within the lagoon needs to be addressed using modern scientific equipment and technical skills, building on the pioneering efforts of Farrow and Brander almost half a century ago. The logistical problems are immense but the potential benefits are equally great. All existing observations in the lagoon come from recordings in the period of the SE Trade Winds which may result in the setup of considerable water surface slopes across the lagoon towards the north, conditions which are unlikely to be replicated at other times of the year (and therefore of interest in themselves). Ideally we would like to model water surface topography at spring, neap and mid tides, and then derive current velocity fields, the relative contribution of the various channels, and water residence times. This would then allow the calculation of sediment and nutrient budgets for the entire lagoon, and, for example, help understand mangrove response to different tidal conditions. The threat of climate change has emerged since much of the early work that was carried out at Aldabra. Indeed, coral bleaching and ocean acidification could potentially have a large influence within the lagoon. Surveys following the 1997/98 Indian Ocean warming event found that lagoonal patch reefs and individual heads of massive coral species in the lagoon at Aldabra displayed only limited bleaching (Spencer et al., 2000). Deeper waters appeared to suffer higher levels of coral mortality, e.g. 66% at 10 m depth and 38% at 20 m depth, with limited recovery of hard corals and no substantive macroalgal cover increases some five years after the event (Stobart et al., 2005). With annual average sea surface temperature rates of warming of 0.75°C for this ocean region (Hughes et al., 2017; Lough, 2012) this threat emphasises the value of detailed maps as a record for comparison to ascertain changes in benthic communities. Broadly, Aldabra offers an excellent location at which to assess the substantial biodiversity of a near-pristine tropical marine ecosystem, providing both i) a benchmark of good coral reef health in a region (northern Madagascar, Comores and East Africa) being heavily exploited and impacted by human pressures and ii) an anthropogenically undisturbed system in which it should be possible to monitor ecological responses to changes in sea surface temperature and irradiance. In 1978, John Taylor speculated ‘it might be predicted that a progressive increase in sea level will deepen and enlarge the present lagoon, resulting in an improved circulation and sedimentation and encouraging a greater diversity of lagoon habitats’ (Taylor, 1978, 25). For the period 1950–2001, reconstructed sea level rise at Port Louis, Mauritius (57°30′E 20°09′S) and Rodrigues (63°25′E 19°40′S) was 1.5 and 1.3 mm a-1 respectively (Church et al., 2006). However, the instrumented record shows
58
considerable inter-decadal variability; thus at Port Louis a period of sea level rise (+3.7 ± 1.5 mm a–1, 1986–2000) was preceded by a phase of sea level fall (-1.9 ± 1.5 mm a–1, 1953–1964) (Church et al., 2006). Further north, at Pointe La Rue, Mahé (55°32′E 4°40′S) the instrumented record shows sea level rise but with very high variability (+5.6 ± 6.6 mm a–1, 1993–2000) 4°40′S); the 1950–2001 relative trend at this site was 0.5 mm a–1 (Church et al., 2006). However, recent studies of the decadal rate of sea surface height (SSH) change north of 5°S have shown a switch from this low rate of long-term rise to a rise of ca. 6 mm a–1 in the period 2004–2013 (Thompson et al., 2016). It is in these contexts that lagoonal bathymetry and habitat coverage will need to be re-assessed over future decades.
ACKNOWLEDGEMENTS
For logistical and funding support we thank the Seychelles Islands Foundation, Seychelles Environment Trust and the Cambridge Coastal Research Unit. We are also grateful to Naomi Doak, Robyn James, University of Queensland, and Lilian Pintea, Director of Conservation Science, Jane Goodall Institute, for the acquisition of Quickbird imagery. We thank the Seychelles Bureau of Standards for permission to undertake this work.
REFERENCES
Andréfouët S., Chagnaud N. and Kranenburg C. 2009. Atlas of western and central Indian Ocean coral reefs. Centre IRD de Nouméa, Nouméa, Nouvelle-Calédonie, CD-ROM.
Bray J. R. and Curtis J. T. 1957. An ordination of the upland forest communities of southern Wisconsin. Ecological Monographs 27:325–349.
Church J. A., White N. J. and Hunter J. R. 2006. Sea-level rise at tropical Pacific and Indian Ocean islands. Global and Planetary Change 53: 155–168.
Clarke K. R. and Warwick R. M. 2001. Change in marine communities: an approach to statistical analysis and interpretation. 2nd ed. Plymouth, UK: Primer-E.
Congalton R. G. 1991. A review of assessing the accuracy of classifications of remotely sensed data. Remote Sensing of Environment 37:35–46.
Drew E. A. 1977. A photographic survey down the seaward reef-front of Aldabra Atoll. Atoll Research Bulletin 193:1–17.
Farrow G. and Brander K. 1971. Tidal studies on Aldabra. Philosophical Transactions of the Royal Society of London. Series B, Biological Sciences:93–121.
Goldberg W. 2016. Atolls of the world: revisiting the original checklist. Atoll Research Bulletin, 610. Hamylton S., Spencer T. and Hagan A. 2012a. Spatial modelling of benthic cover using remote sensing
data in the Aldabra lagoon, western Indian Ocean. Marine Ecology Progress Series 460, 35–47. Hamylton S. M., Hagan A. B. and Doak N. 2012b). Observations of dugongs at Aldabra Atoll, western
Indian Ocean: lagoon habitat mapping and spatial analysis of sighting records. International Journal of Geographical Information Science 26:839–853.
Hughes T. P., Barnes M. L., Bellwood D. R., et al. 2017. Coral reefs in the Anthropocene. Nature 546:82–90.
Karpouzli E. and Malthus T. 2003. The empirical line method for the atmospheric correction of IKONOS imagery. International Journal of Remote Sensing 24:1143–1150.
Lough J. 2012. Small change, big difference: sea surface temperature distributions for tropical coral reef ecosystems, 1950–2011. Journal of Geophysical Research: Oceans 117.
Lyzenga D. R. (1981) Remote sensing of bottom reflectance and water attenuation parameters in shallow water using aircraft and Landsat data. International Journal of Remote Sensing 2:71–82.
Macnae W.1971. Mangroves on Aldabra. Philosophical Transactions of the Royal Society of London. Series B, Biological Sciences 260:237–247.
59
Pugh D. 1979. Sea levels at Aldabra Atoll, Mombasa and Mahé, western equatorial Indian Ocean, related to tides, meteorology and ocean circulation. Deep Sea Research Part A. Oceanographic Research Papers 26:237–258.
Pugh D. and Rayner R. 1981. The tidal regimes of three Indian Ocean atolls and some ecological implications. Estuarine, Coastal and Shelf Science 13:389–407.
Spencer T., Teleki K. A., Bradshaw C., et al. 2000. Coral bleaching in the southern Seychelles during the 1997–1998 Indian Ocean warm event. Marine Pollution Bulletin 40:569–586.
Stobart B., Teleki K., Buckley R., et al. 2005. Coral recovery at Aldabra Atoll, Seychelles: five years after the 1998 bleaching event. Philosophical Transactions of the Royal Society of London A: Mathematical, Physical and Engineering Sciences 363:251–255.
Stoddart D. 1979. Aldabra and the Aldabra research station. Philosophical Transactions of the Royal Society of London. Series B, Biological Sciences: 3–10.
Stoddart D. 1984. Coral reefs of the Seychelles and adjacent regions. In: Stoddart DR (eds) Biogeography and Ecology of the Seychelles Islands. W. Junk: The Hague, 63–81.
Stoddart D. and Ferrari J. 1983. Aldabra atoll: a stunning success story for conservation. Nature Resources 19: 20–28.
Stumpf R. P., Holderied K. and Sinclair M. 2003. Determination of water depth with high-resolution satellite imagery over variable bottom types. Limnology and Oceanography 48:547–556.
Taylor J. D. 1978. Faunal response to the instability of reef habitats: Pleistocene molluscan assemblages of Aldabra Atoll. Palaeontology 21:1–30.
Thompson P., Piecuch C., Merrifield M., et al. 2016. Forcing of recent decadal variability in the Equatorial and North Indian Ocean. Journal of Geophysical Research: Oceans 121:6762–6778.


