Embed Size (px)
Citation preview

oceanwww.oceanexplorer.noaa.gov
1
Image captions/credits on Page 2.
INSPIRE: Chile Margin 2010
Mapping the Deep Ocean
FocusBathymetric mapping
Grade Level7-8 (Physical Science)
Focus QuestionWhat are some of the techniques that ocean explorers use to map the deep ocean?
Learning Objectivesn Students will create a two-dimensional topographic map from
bathymetric survey data.
n Students will create a three-dimensional model of seafloor topography from a two-dimensional topographic map.
n Students will be able to interpret two- and three-dimensional topographic data.
Materialsq Copies of Midwater Plume Bathymetric Data; one for each student
groupq Copies of Bathymetric Data Reduction Sheet; one for each student
groupq Tracing paperq Pieces of foamcore display board, 8-1/2” x 11,” five for each student
groupq Glue, preferably spray type used for mounting photographsq Sharp scissors or X-Acto knives for cutting cardboard
Audio-Visual Materialsq (Optional) video or computer projection equipment
Teaching TimeTwo 45-minute class periods
Seating ArrangementGroups of four students
Maximum Number of Students32
2
Image captions/credits on Page 2.
www.oceanexplorer.noaa.gov INSPIRE: Chile Margin 2010: Mapping the Deep OceanGrades 7-8 (Physical Science)
Key WordsBathymetryMultibeamSonarChile Triple JunctionPlate boundariesPlume
Background InformationNOTE: Explanations and procedures in this lesson are written at a level appropriate to professional educators. In presenting and discussing this material with students, educators may need to adapt the language and instructional approach to styles that are best suited to specific student groups.
Earthquakes and volcanoes are among Earth’s most spectacular and terrifying geological events. The Mount St. Helens eruption of 1980 and the Haiti (7.0 magnitude) and Chile (8.8 magnitude) earthquakes of 2010 are recent and memorable examples of the extreme power that often accompanies these events. The Indian Ocean tsunami of 2004 was caused by an underwater earthquake that is estimated to have released the energy of 23,000 Hiroshima-type atomic bombs, and caused the deaths of more than 150,000 people.
Volcanoes and earthquakes are both linked to movements of tectonic plates, which are portions of the Earth’s outer crust (the lithosphere) about 5 km thick, as well as the upper 60 - 75 km of the underlying mantle. These plates move on a hot flowing mantle layer called the asthenosphere, which is several hundred kilometers thick. Heat within the asthenosphere creates convection currents (similar to the currents that can be seen if food coloring is added to a heated container of water). Movement of convection currents causes tectonic plates to move several centimeters per year relative to each other.
Where tectonic plates slide horizontally past each other, the boundary between the plates is known as a transform plate boundary. As the plates rub against each other, huge stresses are set up that can cause portions of the rock to break, resulting in earthquakes. Places where these breaks occur are called faults. A well-known example of a transform plate boundary is the San Andreas fault in California. View animations of different types of plate boundaries at:http://www.seed.slb.com/flash/science/features/earth/livingplanet/plate_boundaries/en/index.html.
A convergent plate boundary is formed when tectonic plates collide more or less head-on. When two continental plates collide, they may cause rock to be thrust upward at the point of collision, resulting in mountain-building. (The Himalayas were formed by the collision of
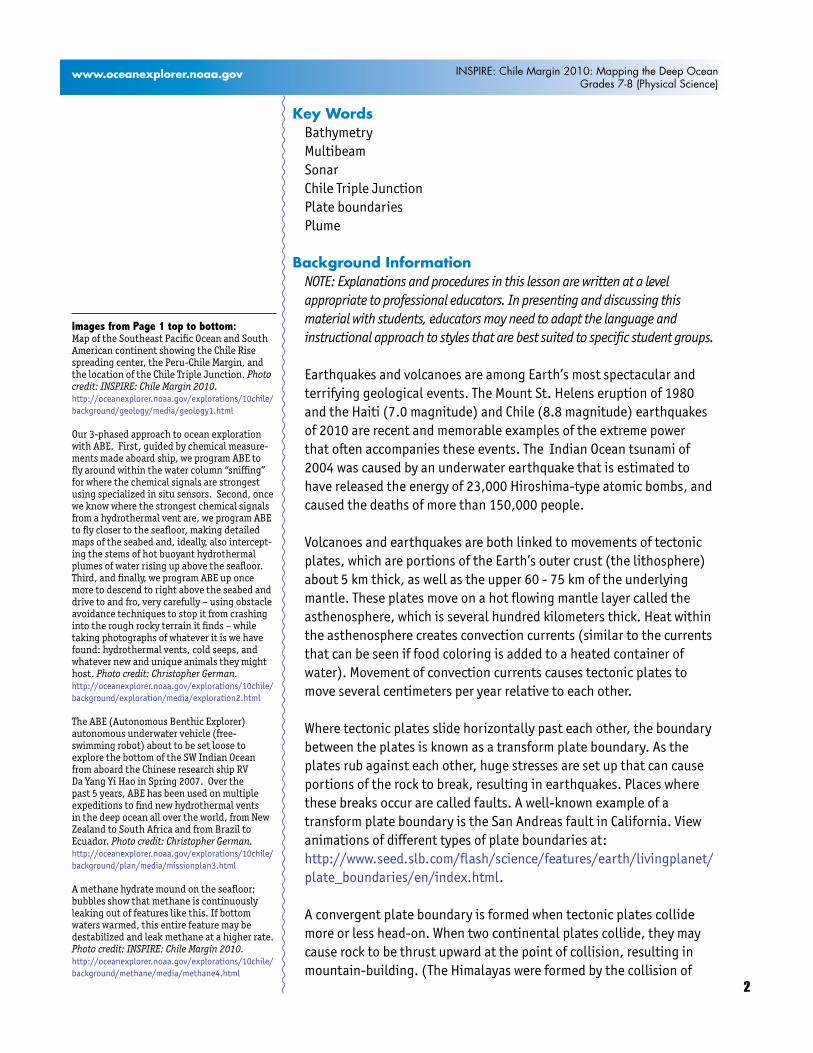
Images from Page 1 top to bottom:Map of the Southeast Pacific Ocean and South American continent showing the Chile Rise spreading center, the Peru-Chile Margin, and the location of the Chile Triple Junction. Photo credit: INSPIRE: Chile Margin 2010.http://oceanexplorer.noaa.gov/explorations/10chile/background/geology/media/geology1.html
Our 3-phased approach to ocean exploration with ABE. First, guided by chemical measure-ments made aboard ship, we program ABE to fly around within the water column “sniffing” for where the chemical signals are strongest using specialized in situ sensors. Second, once we know where the strongest chemical signals from a hydrothermal vent are, we program ABE to fly closer to the seafloor, making detailed maps of the seabed and, ideally, also intercept-ing the stems of hot buoyant hydrothermal plumes of water rising up above the seafloor. Third, and finally, we program ABE up once more to descend to right above the seabed and drive to and fro, very carefully – using obstacle avoidance techniques to stop it from crashing into the rough rocky terrain it finds – while taking photographs of whatever it is we have found: hydrothermal vents, cold seeps, and whatever new and unique animals they might host. Photo credit: Christopher German.http://oceanexplorer.noaa.gov/explorations/10chile/background/exploration/media/exploration2.html
The ABE (Autonomous Benthic Explorer) autonomous underwater vehicle (free-swimming robot) about to be set loose to explore the bottom of the SW Indian Ocean from aboard the Chinese research ship RV Da Yang Yi Hao in Spring 2007. Over the past 5 years, ABE has been used on multiple expeditions to find new hydrothermal vents in the deep ocean all over the world, from New Zealand to South Africa and from Brazil to Ecuador. Photo credit: Christopher German.http://oceanexplorer.noaa.gov/explorations/10chile/background/plan/media/missionplan3.html
A methane hydrate mound on the seafloor; bubbles show that methane is continuously leaking out of features like this. If bottom waters warmed, this entire feature may be destabilized and leak methane at a higher rate.Photo credit: INSPIRE: Chile Margin 2010.http://oceanexplorer.noaa.gov/explorations/10chile/background/methane/media/methane4.html

3
Image captions/credits on Page 2.
www.oceanexplorer.noaa.gov INSPIRE: Chile Margin 2010: Mapping the Deep OceanGrades 7-8 (Physical Science)
the Indo-Australian Plate with the Eurasian Plate). When an oceanic plate and a continental plate collide, the oceanic plate moves beneath the continental plate in a process known as subduction. Deep trenches are often formed where tectonic plates are being subducted, and earthquakes are common. As the sinking plate moves deeper into the mantle, fluids are released from the rock causing the overlying mantle to partially melt. The new magma (molten rock) rises and may erupt violently to form volcanoes, often forming arcs of islands along the convergent boundary. These island arcs are always landward of the neighboring trenches. View the 3-dimensional structure of a subduction zone at:http://oceanexplorer.noaa.gov/explorations/03fire/logs/subduction.html.
Where tectonic plates are moving apart, they form a divergent plate boundary. At divergent plate boundaries, magma rises from deep within the Earth and erupts to form new crust on the lithosphere. Most divergent plate boundaries are underwater (Iceland is an exception), and form submarine mountain ranges called oceanic spreading ridges. While the process is volcanic, volcanoes and earthquakes along oceanic spreading ridges are not as violent as they are at convergent plate boundaries. View the 3-dimensional structure of a mid-ocean ridge at:http://oceanexplorer.noaa.gov/explorations/03fire/logs/ridge.html.
Artist’s cross section illustrating the main types of plate boundaries. (Cross section by José F. Vigil from This Dynamic Planet -- a wall map produced jointly by the U.S. Geological Survey, the Smithsonian Institution, and the U.S. Naval Research Laboratory.)http://pubs.usgs.gov/gip/dynamic/Vigil.html
Figure 1: Types of Plate Boundaries

4
Image captions/credits on Page 2.
www.oceanexplorer.noaa.gov INSPIRE: Chile Margin 2010: Mapping the Deep OceanGrades 7-8 (Physical Science)
Along the western coast of Chile, three of Earth’s tectonic plates intersect in a way that does not occur anywhere else on the planet (see Figure 2). Chile, and the other countries of South America, lie on top of the South American tectonic plate. To the west of Chile, the Nazca Plate extends beneath the Pacific Ocean and meets the Pacific Plate along a divergent plate boundary called the East Pacific Rise. The southern edge of the Nazca Plate adjoins the Antarctic Plate along another divergent plate boundary called the Chile Rise. The eastern edge of the Chile Rise is being subducted beneath the South American plate at the Chile Triple Junction (CTJ), which is unique because it consists of a mid-oceanic ridge being subducted under a continental tectonic plate. The eastern portion of the Nazca Plate is also being subducted along the Peru-Chile Trench, and the Andes mountains are one consequence of this process. Not surprisingly, complex movements of three tectonic plates at the CTJ result in numerous earthquakes. In fact, the largest earthquake ever recorded (magnitude 9.5) occurred along the Peru-
Figure 2: Chile Triple Junction
Paci�cPlate
AntarcticPlate
NazcaPlate
South AmericanPlate
CTJ
Peru-Chile Tre nch Ea
st P
aci�
c Rise
Chile Rise

5
Image captions/credits on Page 2.
www.oceanexplorer.noaa.gov INSPIRE: Chile Margin 2010: Mapping the Deep OceanGrades 7-8 (Physical Science)
Chile Trench in 1960. While earthquakes and volcanoes are often associated with massive destruction and loss of human life, the same processes that cause these events are also responsible for producing unique habitats for very different life forms.
One of the most exciting and significant scientific discoveries in the history of ocean science was made in 1977 at a divergent plate boundary near the Galapagos Islands. Here, researchers found large numbers of animals that had never been seen before clustered around underwater hot springs flowing from cracks in the lava seafloor. Similar hot springs, known as hydrothermal vents, have since been found in many other locations where underwater volcanic processes are active. Hydrothermal vents are formed when the movement of tectonic plates causes deep cracks to form in the ocean floor. Seawater flows into these cracks, is heated by magma, and then rises back to the surface of the seafloor. The water does not boil because of the high pressure in the deep ocean, but may reach temperatures higher than 350° C. This superheated water dissolves minerals in Earth’s crust. Hydrothermal vents are locations where the superheated water erupts through the seafloor. The temperature of the surrounding water is near-freezing, which causes some of the dissolved minerals to precipitate from the solution. This makes the hot water plume look like black smoke, and in some cases the precipitated minerals form chimneys or towers.
The presence of thriving biological communities in the deep ocean was a complete surprise, because it was assumed that food energy resources would be scarce in an environment without sunlight to support photosynthesis. Researchers soon discovered that the organisms responsible for this biological abundance do not need photosynthesis, but instead are able to obtain energy from chemical reactions through a process known as chemosynthesis. Photosynthesis and chemosynthesis both require a source of energy that is transferred through a series of chemical reactions into organic molecules that living organisms may use as food. In photosynthesis, light provides this energy. In chemosynthesis, the energy comes from other chemical reactions. Energy for chemosynthesis in the vicinity of hydrothermal vents often comes from hydrogen sulfide. Cold seeps are another type of chemosynthetic deep-sea community in which hydrocarbons (such as methane or oil) seeping out of sediments provide an energy source for living organisms. Cold seeps are commonly found along continental margins, and are home to many species that have not been found anywhere else on Earth.
A primary purpose of the INSPIRE: Chile Margin 2010 Expedition is to locate new chemosynthetic ecosystems near the CTJ. Because hydrothermal vents and cold-seeps cause changes to the chemistry and physical characteristics of surrounding seawater, these geologic features are often surrounded by masses of seawater that are distinctly

6
Image captions/credits on Page 2.
www.oceanexplorer.noaa.gov INSPIRE: Chile Margin 2010: Mapping the Deep OceanGrades 7-8 (Physical Science)
different from normal seawater. These water masses are called plumes, and provide ocean explorers with clues about the location of hydrothermal vents and cold-seeps.
To search for these clues, expedition scientists will use deep-tow sidescan sonar and data recorders that can detect chemical and physical water characteristics that signal the presence of hydrothermal vents and cold-seeps. Once plumes have been located, the depth and size of selected plumes will be investigated in more detail using instruments that measure conductivity, temperature, depth, optical backscatter, and redox potential so that the source of the plume can be located within an area of about 1 km. High resolution maps of this area will be prepared using an autonomous underwater vehicle (AUV). Finally, the AUV will collect overlapping photographs of the vent or cold-seep site. This lesson focuses on ocean floor maps and some of the technologies used to prepare these maps. For more information and activities about physical and chemical measurements and technologies, please see “The Oceanographic Yo-Yo” lesson. For more about AUVs, please see “The Ridge Exploring Robot” lesson. Both of these lessons can be found in the lesson plan collection for INSPIRE: Chile Margin 2010 Expedition.
Learning Procedure1. To prepare for this lesson:
(a) Review introductory essays for the INSPIRE: Chile Margin 2010 Expedition at http://oceanexplorer.noaa.gov/explorations/10chile/welcome.html
(b) Review information about sonar (Step 2) and decide whether you will use the referenced video clips to enhance classroom discussions.
(c) Review procedures for preparing two- and three-dimensional maps from bathymetric data (Steps 3-5) and gather materials for each student group.
2. If students are not familiar with deep-sea chemosynthetic communities, briefly describe the concept of chemosynthesis, and contrast it with photosynthesis. Tell students that chemosynthetic ecosystems in the deep ocean are found where a source of chemical energy is emerging from the ocean floor. Introduce the INSPIRE: Chile Margin 2010 Expedition, and say that a primary purpose of the expedition is to locate new chemosynthetic ecosystems near the Chile Triple Junction. Explain the overall strategy that will be used to search for these ecosystems, and emphasize that a key component of this strategy is to obtain high-resolution maps of areas being searched.
Ask students what they know about sonar, and provide additional information as necessary. Be sure students understand that sonar

7
Image captions/credits on Page 2.
www.oceanexplorer.noaa.gov INSPIRE: Chile Margin 2010: Mapping the Deep OceanGrades 7-8 (Physical Science)
(which stands for SOund NAvigation and Ranging) uses an acoustic signal or pulse of sound that is transmitted into the water by a sort of underwater speaker known as a transducer. Transducers may be mounted on the hull of a ship, or may be towed in a container called a towfish. If the seafloor or other object is in the path of the sound pulse, the sound bounces off the object and returns an “echo” to the sonar transducer. The time elapsed between the emission of the sound pulse and the reception of the echo is used to calculate the distance of the object. Some sonar systems also measure the strength of the echo, and this information can be used to make inferences about some of the reflecting object’s characteristics. Hard objects, for example, produce stronger echoes that softer objects. Sonar systems can be used to determine water depth, as well as to locate and identify underwater objects.
The INSPIRE: Chile Margin 2010 Expedition will use two types of sonar: side-scan and multibeam. Side-scan sonar provides images of the sea floor, and uses transducers mounted on a Towed Ocean Bottom Instrument (TOBI), which is a platform that can be towed at depths ranging from 200 m to 6000 m. Return echoes are continuously recorded and analyzed by a processing computer to produce images made up of dark and light areas that can be used to locate seafloor features. Because side-scan sonar systems do not provide bathymetric data, multibeam sonar will be used to produce the high-resolution maps needed by the expedition. A multibeam system uses multiple transducers pointing at different angles on either side of a ship to create a swath of signals. The time interval between signal transmission and return echo arrival is used to estimate depth over the area of the swath. In addition to high-resolution maps, multibeam data can be used to create three dimensional models or even “fly-by” videos that simulate a trip across the area being mapped. For a fascinating example of this, see http://oceanexplorer.noaa.gov/explorations/02fire/logs/jul08/media/sm2k.html. This 3D fly-through movie shows the seafloor in the Magic Mountain area of Explorer Ridge (near the coast of Washington and British Columbia) where there are active hydrothermal vents. This movie was produced using the Simrad SM2000 sonar system aboard the ABE autonomous vehicle, which is the same technology being used for the INSPIRE: Chile Margin 2010 expedition. To see what the vents look like, you can view other fly-throughs of the same area at http://oceanexplorer.noaa.gov/explorations/02fire/logs/magicmountain. Recently, a new generation of multibeam sonars has been developed that are able to map features in the water column as well as the seafloor. This ability will potentially allow multibeam sonars to map the location of fish and marine mammals, and a wide range of physical oceanographic processes.

8
Image captions/credits on Page 2.
www.oceanexplorer.noaa.gov INSPIRE: Chile Margin 2010: Mapping the Deep OceanGrades 7-8 (Physical Science)
3. Tell students that on May 17, 2009, NOAA’s new ocean exploration ship the Okeanos Explorer was testing its multibeam sonar mapping system off the coast of California (see http://oceanexplorer.noaa.gov/okeanos/welcome.html for more about the Okeanos Explorer). Suddenly, the multibeam image showed a plume of what scientists believe may be methane gas rising vertically 1000 meters from the ocean floor. No such feature had ever been reported from this area before.
Provide each student group with a copy of Midwater Plume Bathymetric Data and Bathymetric Data Reduction Sheet. Say that their assignment is to use information about water depth (bathymetry) to construct two- and three-dimensional maps of a seafloor area where the plume was discovered. Tell the students that the bathymetric data are part of a data set that was produced by an exploration vessel using multibeam bathymetry. Be sure students understand that each data point represents the depth of water below the exploration ship when the vessel was at the location described by the grid coordinates. Each grid cell interval corresponds to one minute of latitude or longitude. Note that for the purposes of this exercise, we are not dealing with all of the side-scan data, which would include more than an hundred additional depth readings in each grid cell, and would be much more difficult to process without computer analysis.
Have each group enter the depth readings from the bathymetric data sheet into the corresponding grid cells on the Bathymetric Data Reduction Sheet. Next, have the students draw contour lines on the Data Reduction Sheet for depths of 1,500 m, 1600 m, 1,700 m, 1,800 m, and 1,900 m. Tell the students to assume that the depth reading was taken at the center of each grid cell (indicated on the Data Reduction Sheet by the light crossed diagonal lines). In most cases, student will have to interpolate the position of the contour lines; for example, if one grid cell has a depth reading of 1,550 m and an adjacent cell has a depth reading of 1,650 m, students should assume that the 1,600 m contour line passes halfway between the center points of the two cells. When students have completed their contour maps, have them make a master tracing, and five photocopies. If you want them to make larger models, they can enlarge their master tracing on the photocopier.
4. Have the students mount each copy of their contour map onto a piece of cardboard. Be sure to use enough glue to cover the entire surface of the cardboard. Next, students should prepare the five layers of their three dimensional model. By cutting along the 1,900 m contour line on one mounted map, then cutting along the 1,800 m contour on the next mounted map, and so on until five layers

9
Image captions/credits on Page 2.
www.oceanexplorer.noaa.gov INSPIRE: Chile Margin 2010: Mapping the Deep OceanGrades 7-8 (Physical Science)
have been cut out corresponding to each of the five contour lines constructed on the Data Reduction Sheet. If students are using X-Acto knives, be sure to have a suitable backing (heavy cardboard, cutting board, etc.) to protect work surfaces.
5. Starting with the 1,900 m contour, carefully glue successive contours together to build the three-dimensional model of the plume site.
6. Using the models the students have produced, discuss the features of the site where the newly-discovered plume originates. Students should recognize that the plume rises from the base of an amphitheater-shaped basin. This feature may be the result of an underwater landslide. Such landslides have been associated with the release of methane contained in ice-like substances called methane hydrates. For more discussion about landslides and methane release, see the March 3, 2010 log from the INSPIRE: Chile Margin 2010 Expedition (http://oceanexplorer.noaa.gov/explorations/10chile/logs/mar3/mar3.html), and “More About Methane and Methane Hydrates” in the Expedition Education Module. Figure 3 shows a multibeam sonar image of the actual plume site. This image has much greater detail than students’ models because it includes hundreds of additional data points.
You may want to show students a video simulation (http://ccom.unh.edu/NOAA_oceanexploration) of how multibeam sonar discovered this plume, since it provides a graphic overview of how multibeam
Figure 3: Multibeam Sonar Image of plume site discovered by the Okeanos Explorer
Image Credit: NOAA

10
Image captions/credits on Page 2.
www.oceanexplorer.noaa.gov INSPIRE: Chile Margin 2010: Mapping the Deep OceanGrades 7-8 (Physical Science)
works. In the first part of the video, the Okeanos Explorer is travelling towards us from the top of the screen along the white line which represents the course of the ship. The swath of multibeam sonar signals radiates from either side of the ship in shades of blue and green. As the video continues, the viewing angle moves around the starboard (right) side of the ship until we are looking toward the stern of the vessel as it moves away from us. Now we can see the plume rising from the bottom of the “amphitheater.” In the last segment of the video, the viewing angle continues to pan around the plume. When the angle is perpendicular to the track of the Okeanos Explorer, we can see the segments of the multibeam image, sort of like slices of an onion, each produced by a single cycle of pulses from the multibeam transducers. The assembled “slices” produce the three dimensional image of the plume.
The Okeanos Explorer returned to the plume site in July, and found that the plume was still active, and discovered several other plumes ranging in height from 700 m to 1400 m in a 15 km area around the site.
The BRIDGE Connectionwww.vims.edu/bridge/ – Click on “Ocean Science Topics” in the menu on the left side of the page, then select “Geology” or “Habitats” for activities and links about plate tectonics and chemosynthetic ecosystems.
The “Me” ConnectionHave students write a first-hand account of an exploratory mission to a plume site or one of the sites investigated by the INSPIRE: Chile Margin 2010 Expedition, describing topographic features revealed by multibeam sonar surveys.
Connections to Other SubjectsEnglish/Language Arts, Earth Science, Mathematics
AssessmentWritten reports, modeling activities and class discussions provide opportunities for assessment.
ExtensionsVisit http://oceanexplorer.noaa.gov/explorations/10chile/welcome.html for the latest activities and discoveries by the INSPIRE: Chile Margin 2010 Expedition.

11
Image captions/credits on Page 2.
www.oceanexplorer.noaa.gov INSPIRE: Chile Margin 2010: Mapping the Deep OceanGrades 7-8 (Physical Science)
Other Relevant Lesson Plans from NOAA’s Ocean Exploration Program
I, Robot, Can Do That! (PDF, 315 kb) (from the Lost City 2005 expedition)http://oceanexplorer.noaa.gov/explorations/05lostcity/background/edu/media/lostcity05_i_robot.pdf
Focus: Underwater robotic vehicles for scientific exploration (Physical Science/Life Science)
In this activity, students will be able to describe and contrast at least three types of underwater robots used for scientific explorations, dis-cuss the advantages and disadvantages of using underwater robots in scientific explorations, and identify robotic vehicles best suited to carry out certain tasks.
Life is Weird (PDF, 315 kb) (from the 2003 Windows to the Deep expedition)http://oceanexplorer.noaa.gov/explorations/03windows/background/
education/media/03win_lifeisweird.pdf
Focus: Biological organisms in cold seep communities (Life Science)
In this activity, students will be able to describe major features of cold seep communities, and list at least five organisms typical of these communities. Students will also be able to infer probable trophic relationships among organisms typical of cold-seep communities and the surrounding deep-sea environment, and describe the process of chemosynthesis in general terms, and will be able to contrast chemosynthesis and photosynthesis.
How Does Your Magma Grow? (PDF, 224 kb) (from the 2005 GalAPAGos: Where Ridge Meets Hotspot
expedition)http://oceanexplorer.noaa.gov/explorations/05galapagos/
background/edu/media/05galapagos_magma.pdf
Focus: Hot spots and midocean ridges (Physical Science)
Students will identify types of plate boundaries associated with movement of the Earth’s tectonic plates, compare and contrast volcanic activity associated with spreading centers and hot spots, describe processes which resulted in the formation of the Galapagos Islands, and describe processes that produce hydrothermal vents.

12
Image captions/credits on Page 2.
www.oceanexplorer.noaa.gov INSPIRE: Chile Margin 2010: Mapping the Deep OceanGrades 7-8 (Physical Science)
One Tough Worm (PDF, 476 kb) (from the 2002 Gulf of Mexico Expedition)http://oceanexplorer.noaa.gov/explorations/02mexico/background/
edu/media/gom_toughworm.pdf
Focus: Physiological adaptations to toxic and hypoxic environments (Life Science)
Students will be able to explain the process of chemosynthesis, explain the relevance of chemosynthesis to biological communities in the vicinity of cold seeps, and describe three physiological adaptations that enhance an organism’s ability to extract oxygen from its environment. Students will also be able to describe the problems posed by hydrogen sulfide for aerobic organisms, and explain three strategies for dealing with these problems.
Sonar Simulation (PDF, 308 kb) (from the Bonaire 2008: Exploring Coral Reef
Sustainability with New Technologies Expedition)http://oceanexplorer.noaa.gov/explorations/08bonaire/background/
edu/media/sonarsim.pdf
Focus: Side scan sonar (Earth Science/Physical Science)
Students will describe side-scan sonar, compare and contrast side-scan sonar with other methods used to search for underwater objects, and make inferences about the topography of an unknown and invisible land-scape based on systematic discontinuous measurements of surface relief.
Other Resources The Web links below are provided for informational purposes only. Links outside of Ocean Explorer have been checked at the time of this page’s publication, but the linking sites may become outdated or non-operational over time.http://oceanexplorer.noaa.gov/explorations/10chile/welcome.html –
Web site for the INSPIRE: Chile Margin 2010 Expedition
http://celebrating200years.noaa.gov/edufun/book/welcome.html#book - A free printable book for home and school use introduced in 2004 to celebrate the 200th anniversary of NOAA; nearly 200 pages of lessons focusing on the exploration, understanding, and protection of Earth as a whole system
http://oceanexplorer.noaa.gov/explorations/02fire/logs/magicmountain/welcome.html – Links to virtual fly-throughs and panoramas of the Magic Mountain hydrothermal vent site on Explorer Ridge in the NE Pacific Ocean, where two tectonic plates are spreading apart and there is active eruption of submarine volcanoes
13
Image captions/credits on Page 2.
www.oceanexplorer.noaa.gov INSPIRE: Chile Margin 2010: Mapping the Deep OceanGrades 7-8 (Physical Science)
Gardner, J. V., Malik, M. A., Walker, S. 2009. Plume 1400 Meters High Discovered at the Seafloor off the Northern California Margin. EOS Transactions, American Geophysical Union, 90(32): 275 - 275
Doucet M., C. Ware, R. Arsenault, T. Weber, M. Malik, L. Mayer, and L. Gee. Advanced Mid-Water Tools for 4D Marine Data Fusion and Analysis. Paper presented at OCEANS 2009, Biloxi, Mississippi, October 26-29, 2009; available online at http://www.ivs3d.com/news/PID985675.pdf
http://ccom.unh.edu/NOAA_oceanexploration/ – Video simulations of the Okeanos Explorer discovering a midwater plume on May 17, 2009 using multibeam sonar; video formats are provided for PC and Macintosh users
National Science Education StandardsContent Standard A: Science As Inquiry
• Abilities necessary to do scientific inquiry • Understandings about scientific inquiry
Content Standard B: Physical Science• Motions and forces • Transfer of energy
Content Standard C: Life Science• Populations and ecosystems • Diversity and adaptations of organisms
Content Standard D: Earth and Space Science • Structure of the Earth system
Content Standard E: Science and Technology • Abilities of technological design • Understandings about science and technology
Content Standard F: Science in Personal and Social Perspectives • Natural hazards
Ocean Literacy Essential Principles and Fundamental Concepts
Essential Principle 1.The Earth has one big ocean with many features.Fundamental Concept b. An ocean basin’s size, shape and features (such as islands, trenches, mid-ocean ridges, rift valleys) vary due to the movement of Earth’s lithospheric plates. Earth’s highest peaks, deepest valleys and flattest vast plains are all in the ocean.

14
Image captions/credits on Page 2.
www.oceanexplorer.noaa.gov INSPIRE: Chile Margin 2010: Mapping the Deep OceanGrades 7-8 (Physical Science)
Essential Principle 2. The ocean and life in the ocean shape the features of the Earth. Fundamental Concept e. Tectonic activity, sea level changes, and force of waves influence the physical structure and landforms of the coast.
Essential Principle 4. The ocean makes Earth habitable.Fundamental Concept a. Most of the oxygen in the atmosphere originally came from the activities of photosynthetic organisms in the ocean.Fundamental Concept b. The first life is thought to have started in the ocean. The earliest evidence of life is found in the ocean.
Essential Principle 5. The ocean supports a great diversity of life and ecosystems.Fundamental Concept f. Ocean habitats are defined by environmental factors. Due to interactions of abiotic factors such as salinity, temperature, oxygen, pH, light, nutrients, pressure, substrate and circulation, ocean life is not evenly distributed temporally or spatially, i.e., it is “patchy”. Some regions of the ocean support more diverse and abundant life than anywhere on Earth, while much of the ocean is considered a desert.Fundamental Concept g. There are deep ocean ecosystems that are independent of energy from sunlight and photosynthetic organisms. Hydrothermal vents, submarine hot springs, and methane cold seeps rely only on chemical energy and chemosynthetic organisms to support life.
Essential Principle 6. The ocean and humans are inextricably interconnected.Fundamental Concept f. Coastal regions are susceptible to natural hazards (such as tsunamis, hurricanes, cyclones, sea level change, and storm surges).
Essential Principle 7. The ocean is largely unexplored.Fundamental Concept a. The ocean is the last and largest unexplored place on Earth—less than 5% of it has been explored. This is the great frontier for the next generation’s explorers and researchers, where they will find great opportunities for inquiry and investigation.Fundamental Concept b. Understanding the ocean is more than a matter of curiosity. Exploration, inquiry and study are required to better understand ocean systems and processes.Fundamental Concept d. New technologies, sensors and tools are expanding our ability to explore the ocean. Ocean scientists are relying more and more on satellites, drifters, buoys, subsea observatories and unmanned submersibles.

15
Image captions/credits on Page 2.
www.oceanexplorer.noaa.gov INSPIRE: Chile Margin 2010: Mapping the Deep OceanGrades 7-8 (Physical Science)
Fundamental Concept f. Ocean exploration is truly interdisciplinary. It requires close collaboration among biologists, chemists, climatologists, computer programmers, engineers, geologists, meteorologists, and physicists, and new ways of thinking.
Send Us Your FeedbackWe value your feedback on this lesson.Please send your comments to: [email protected]
For More InformationPaula Keener-Chavis, Director, Education ProgramsNOAA Ocean Exploration and Research ProgramHollings Marine Laboratory331 Fort Johnson Road, Charleston SC 29412843.762.8818843.762.8737 (fax)[email protected]
AcknowledgementsThis lesson was developed by Mel Goodwin, PhD, Marine Biologist and Science Writer. Layout and design by Coastal Images Graphic Design, Charleston, SC. If reproducing this lesson, please cite NOAA as the source, and provide the following URL: http://oceanexplorer.noaa.gov/

16
Image captions/credits on Page 2.
INSPIRE: Chile Margin 2010: Mapping the Deep OceanGrades 7-8 (Physical Science)
www.oceanexplorer.noaa.gov
Mapping the Deep Ocean
Midwater Plume Bathymetric Data
1,1 19001,2 19001,3 19001,4 17501,5 17501,6 17501,7 17501,8 19001,9 19001,10 19001,11 19001,12 19001,13 19001,14 15001,15 15001,16 15002,1 19002,2 19002,3 19002,4 18752,5 18002,6 15752,7 15752,8 15752,9 17502,10 17502,11 17502,12 18502,13 18502,14 15002,15 15002,16 15003,1 19003,2 19003,3 17503,4 18753,5 18753,6 17003,7 17003,8 16503,9 15753,10 15753,11 15753,12 1725
3,13 15003,14 15003,15 15003,16 15004,1 19004,2 17504,3 15754,4 16504,5 17004,6 18504,7 17504,8 17004,9 17004,10 16504,11 16504,12 15754,13 15004,14 15004,15 15004,16 15005,1 19005,2 17505,3 16505,4 15755,5 16505,6 17005,7 18255,8 18005,9 18005,10 17005,11 17005,12 15755,13 15005,14 15005,15 15005,16 15006,1 19006,2 17506,3 17006,4 16506,5 15756,6 16506,7 17006,8 1800
6,9 1750**6,10 18006,11 17006,12 16506,13 15756,14 15006,15 15006,16 15007,1 19007,2 18507,3 17507,4 17007,5 16507,6 15757,7 17007,8 18007,9 18007,10 18007,11 17257,12 16507,13 15757,14 15007,15 15007,16 15008,1 19008,2 19008,3 17508,4 17258,5 16508,6 15758,7 16508,8 17008,9 18008,10 18008,11 17008,12 16508,13 15758,14 15008,15 15008,16 15009,1 19009,2 19009,3 19009,4 1750
9,5 16509,6 15759,7 16509,8 16509,9 17009,10 17009,11 16509,12 16509,13 15759,14 15009,15 15009,16 150010,1 190010,2 190010,3 190010,4 190010,5 175010,6 165010,7 157510,8 157510,9 165010,10 165010,11 157510,12 150010,13 150010,14 150010,15 150010,16 150011,1 190011,2 190011,3 190011,4 190011,5 175011,6 165011,7 175011,8 175011,9 157511,10 157511,11 150011,12 150011,13 150011,14 150011,15 150011,16 1500
Grid Cell Depth (m)(row, column)
Grid Cell Depth (m)(row, column)
Grid Cell Depth (m)(row, column)
Grid Cell Depth (m)(row, column)
** -- The plume was emerging in this grid cell

17
Image captions/credits on Page 2.
INSPIRE: Chile Margin 2010: Mapping the Deep OceanGrades 7-8 (Physical Science)
www.oceanexplorer.noaa.gov
Mapping the Deep Ocean
Bathymetric Data Reduction Sheet
1 2 3 4 5 6 7 8 9 10 11
1
2
3
4
5
6
7
8
9
10
11
12
13
14
15
16
row (x-axis)
colu
mn
(y-a
xis)


