Embed Size (px)
Citation preview
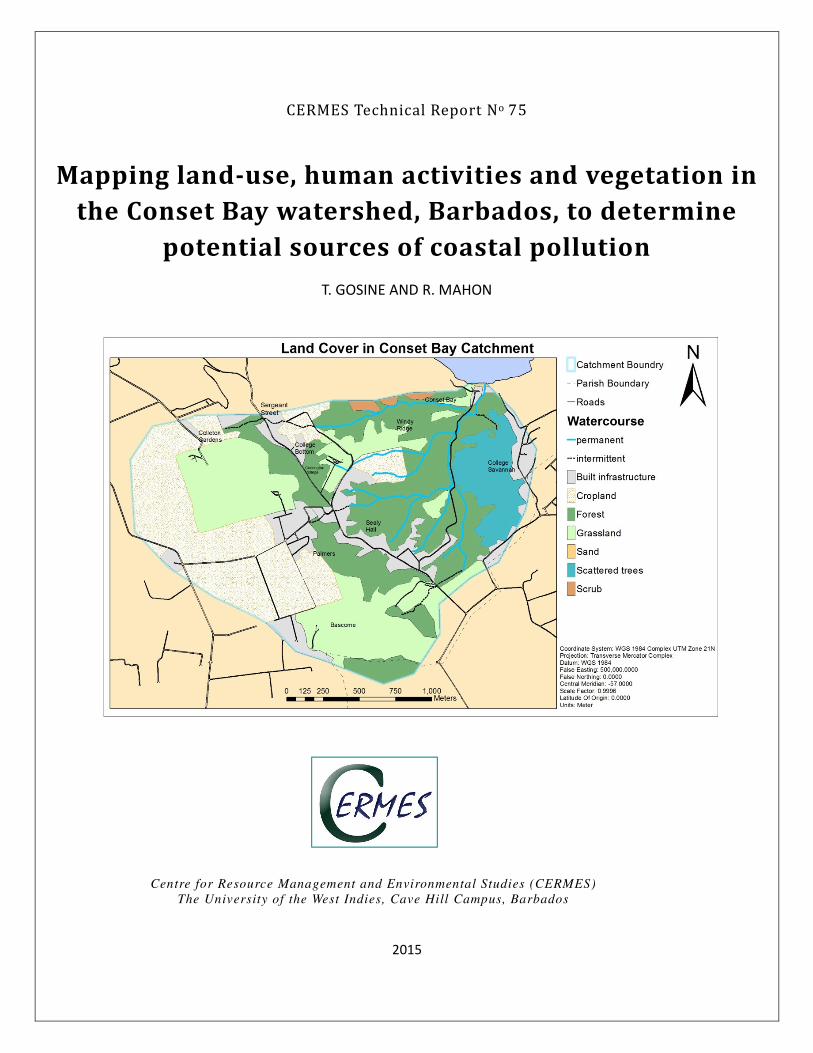
CERMES Technical Report No 75
Mapping land-use, human activities and vegetation in
the Conset Bay watershed, Barbados, to determine
potential sources of coastal pollution
T. GOSINE AND R. MAHON
Centre for Resource Management and Environmental Studies (CERMES)
The University of the West Indies, Cave Hill Campus, Barbados
2015

Mapping land-use, human activities and vegetation in the Conset Bay watershed,
Barbados, to determine potential sources of coastal pollution
Trisandhi Gosine and Robin Mahon
Centre for Resource Management and Environmental Studies (CERMES), University of the West Indies,
Cave Hill Campus, St. Michael, Barbados, 246-417-4570, Fax 246-424-4204, [email protected],
www.cavehill.uwi.edu/cermes
ACKNOWLEDGEMENTS
We would like to thank Renata Goodridge for her indispensable technical expertise and assistance. Our
gratitude is also due to Katherine Blackman, Neetha Selliah, Brandon Peterkin and Marium Alleyne for
their help in the data gathering process.
Citation:
Gosine, T. and R. Mahon. 2014. Mapping land-use, human activities and vegetation in the Conset Bay
watershed, Barbados, to determine potential sources of coastal pollution. Centre for Resource
Management and Environmental Studies, The University of the West Indies, Cave Hill Campus, Barbados,
CERMES Technical Report No 75: 49pp.
ii
CONTENTS
Acknowledgements ........................................................................................................................................ i
Contents ........................................................................................................................................................ ii
Summary ...................................................................................................................................................... iii
1 Introduction ........................................................................................................................................... 1
2 Background ............................................................................................................................................ 3
2.1 .............................................................................................................................................................. 3
2.2 Land-use/land cover impacts on watersheds ............................................................................... 3
2.2.1 Land-use and watershed scale .................................................................................................. 4
2.2.2 Land-use/Land cover and water quantity ................................................................................. 5
2.2.3 Land-use and water quality ....................................................................................................... 6
2.2.4 Riparian vegetation in watersheds ............................................................................................ 7
2.3 Water Quality ................................................................................................................................ 8
2.4 Benthic Reefs Ecosystem ............................................................................................................... 9
2.5 Existing Institutional and Policy Framework ................................................................................. 9
3 Study Area ............................................................................................................................................ 11
3.1 Geological Setting ....................................................................................................................... 13
3.2 Topography .................................................................................................................................. 13
3.3 Population Distribution ............................................................................................................... 16
3.4 Climate ........................................................................................................................................ 16
4 Methodology ....................................................................................................................................... 16
4.1 Watershed mapping .................................................................................................................... 16
4.2 Identifying potential sources of non-point source pollution due to land-use ............................ 17
4.3 Riparian vegetation assessment ................................................................................................. 18
4.4 Human activities survey .............................................................................................................. 18
4.5 Water quality data collection ...................................................................................................... 19
4.6 Water quality sample processing ................................................................................................ 20
5 Results .................................................................................................................................................. 20
5.1 Land cover ................................................................................................................................... 20
5.2 Land-use ...................................................................................................................................... 21
5.3 Riparian vegetation ..................................................................................................................... 22
5.4 Human Activities Survey ............................................................................................................. 25
5.5 Water quality ............................................................................................................................... 27
6 Discussion ............................................................................................................................................ 31
7 Conclusion ........................................................................................................................................... 33
8 References ........................................................................................................................................... 33
Appendix 1: Water Quality Standards ......................................................................................................... 37
Appendix 2: Field Assessment Sheet .......................................................................................................... 48
Appendix 3: Land-use Activities Questionnaire. ......................................................................................... 49

iii
SUMMARY
Watersheds and coastal zones in the insular Caribbean are home to some of the world’s most diverse
and productive land and marine ecosystems. These ecosystems act as food sources and support
economic activities such as fisheries, tourism, recreation and transportation. Such ecosystems provide a
number of important services including protection and stabilization of coastal areas, flood regulation,
water purification and climate regulation. The capacity of these areas to provide these services is
increasingly being compromised as they are subject to a number of external pressures such as pollutants
and habitat destruction. Sewage, hydrocarbons, sediments, nutrients, pesticides, litter and marine debris
have been identified as the land-based pollutants that pose the greatest threat to coastal and marine
environments in the Caribbean. These pollutants arise from land-based anthropogenic activities lead to
degradation of coastal and marine ecosystems.
The study was conducted to investigate how land-use practices might affect the quality of water entering
the marine environment in Conset Bay, Barbados. This watershed highlights strong interdependencies of
the terrestrial and marine environments. It also illustrates the potential for land-use to impact marine
productivity. The study aims to link terrestrial activities within the watershed with possible impacts on
the nearshore marine environment. In order to pursue this, land cover and land-use within the
watershed were characterised using GIS tools and site surveys. The riparian vegetation distribution and
spatial extent was assessed and characterised using rapid assessment techniques. Water quality data
were collected and analysed for microbial levels, nutrient levels and physical water quality parameters.
An activities survey was also conducted to gain a comprehensive understanding of how the location is
utilised.
The water quality data collected from the Conset Bay watershed suggest that levels of microbial and
nutrient pollutants entering the marine environment are higher than the prescribed discharge standards.
The data show the major land covers to be primarily forest (30%), grassland (24.6%) and cropland
(25.1%) with a small portion of built infrastructure (12.8%). The major land-uses were natural vegetation
(62%), agriculture (26%) and residential (12.3%). Eleven types of riparian vegetative cover were found
within the catchment. Riparian vegetation exists throughout the majority of stream network where only
5% flowed through built-up areas and bare ground. Closed forest was the most common representing
61% while open forest made up 20%. Grassland and cultivated land made up 4% and 3% respectively.
Scrub and marshy grassland made up 1% each. The main activities cited by respondents as taking place
in Conset Bay itself included swimming (20%), fishing (20%), farming (15%), fishing in rivers for crayfish
bait (10%) and kayaking (5%) while a small number of respondents utilise the streams directly for
irrigation of crops and crayfishing.

1 INTRODUCTION
The expansion of the world’s population primarily in coastal regions, coupled with environmental
stressors created by economic growth and climate change create complications in addressing marine
conservation (Miloslavich et al. 2010). Industrial activities, agriculture, sewage and solid waste have all
led to the rapid increase in input of contaminants and nutrients into watersheds and coastal areas
resulting in the degradation of coastal ecosystems (Yang and Zhi 2005).The vital ecosystem goods and
services that watersheds and coastal areas provide make it evident that these areas need to be
protected and managed in a sustainable manner. Already these environments are subject to terrestrial
and marine biodiversity loss, uncontrolled development, coastal erosion and pollution such as aquifer
and surface water quality degradation (UNEP et al. 2002).
Watersheds and coastal zones in the insular Caribbean are home to some of the world’s most diverse
and productive land and marine ecosystems. The region is home to approximately 13,000 plant species
50.4% of which are endemic to the islands (UNEP 2010). It also houses the highest concentration of
marine species in the Atlantic Ocean making it a global hotspot of marine biodiversity (Miloslavich et al.
2010). This diversity often occurs in watersheds and coastal areas which are home to unique complex
ecosystems such as coral reefs, sea-grass beds, mangroves and river deltas (UNEP 2010). As essential
ecosystems they provide a myriad of ecosystem functions that benefit human wellbeing. These
ecosystems act as food sources and support economic activities such as fisheries, tourism, recreation
and transportation (UNEP et al. 2002). Such environments are important for a number of factors
including protection and stabilization of coastal areas, flood regulation, water purification and climate
regulation (Millennium Ecosystem Assessment 2005; UNEP 2010). The capacity of these areas to provide
these functions is increasingly being compromised as they are subject to a number of external pressures.
For example two thirds of the Caribbean’s coral reefs are under threat as a result of coastal
development, sedimentation, water acidification, overfishing and toxic chemicals. Already 30% of coral
reefs have been destroyed or are under threat, while 20% more is expected to be lost over the next 10-
30 years (Burke and Maidens 2004; Sherman and Hempel 2009).
Pollution enters the marine environment in many ways. These include atmospheric deposition, marine-
based sources from ships and marine structures, and land-based sources which are the topic of this
study (UNEP-CEP 2001). Land-based sources of pollution can reach the sea either directly at the coast or
through rivers. Pollutants fall into two categories; point sources and non-point sources. The former
characterises pollutants entering the coastal environment at one definitive location such as the release
of industrial effluent or discharge from sewage treatment plants while the latter enters via mediums
such as storm water runoff, overflow discharges subsurface infiltration or surface run off (UNEP-CEP
2001). Pollutants such as sewage, oil, hydrocarbons, sediments, nutrients, pesticides, litter and marine
debris and toxic waters have been identified as the land-based pollutants that pose the greatest threat
to coastal and marine environments in the Caribbean (UNEP-CEP 2001). Land based anthropogenic
activities have been found to cause degradation of coastal and marine ecosystems in Barbados (Leitch
and Harbor 1999). Changes over time to the landscape such as removal of vegetation cover, intensive
farming practices and anthropogenic by-products such as sewage and solid wastes have impacted the
coastal and marine environment (Arriola 2008). This paper focuses on land based sources of pollution
entering the marine environment through coastal watersheds; in particular non-point source pollutants.
By identifying the locations, types and quantities of pollutants, efforts can be made to mitigate and
control pollution effects.
2
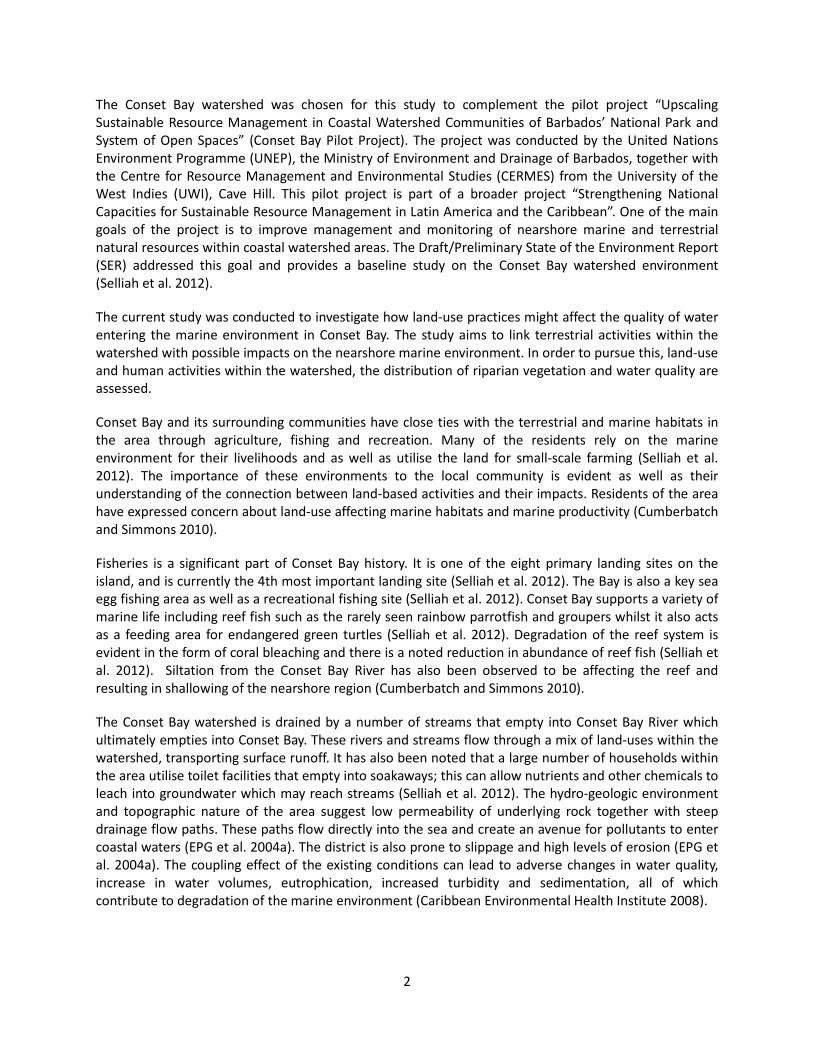
The Conset Bay watershed was chosen for this study to complement the pilot project “Upscaling
Sustainable Resource Management in Coastal Watershed Communities of Barbados’ National Park and
System of Open Spaces” (Conset Bay Pilot Project). The project was conducted by the United Nations
Environment Programme (UNEP), the Ministry of Environment and Drainage of Barbados, together with
the Centre for Resource Management and Environmental Studies (CERMES) from the University of the
West Indies (UWI), Cave Hill. This pilot project is part of a broader project “Strengthening National
Capacities for Sustainable Resource Management in Latin America and the Caribbean”. One of the main
goals of the project is to improve management and monitoring of nearshore marine and terrestrial
natural resources within coastal watershed areas. The Draft/Preliminary State of the Environment Report
(SER) addressed this goal and provides a baseline study on the Conset Bay watershed environment
(Selliah et al. 2012).
The current study was conducted to investigate how land-use practices might affect the quality of water
entering the marine environment in Conset Bay. The study aims to link terrestrial activities within the
watershed with possible impacts on the nearshore marine environment. In order to pursue this, land-use
and human activities within the watershed, the distribution of riparian vegetation and water quality are
assessed.
Conset Bay and its surrounding communities have close ties with the terrestrial and marine habitats in
the area through agriculture, fishing and recreation. Many of the residents rely on the marine
environment for their livelihoods and as well as utilise the land for small-scale farming (Selliah et al.
2012). The importance of these environments to the local community is evident as well as their
understanding of the connection between land-based activities and their impacts. Residents of the area
have expressed concern about land-use affecting marine habitats and marine productivity (Cumberbatch
and Simmons 2010).
Fisheries is a significant part of Conset Bay history. It is one of the eight primary landing sites on the
island, and is currently the 4th most important landing site (Selliah et al. 2012). The Bay is also a key sea
egg fishing area as well as a recreational fishing site (Selliah et al. 2012). Conset Bay supports a variety of
marine life including reef fish such as the rarely seen rainbow parrotfish and groupers whilst it also acts
as a feeding area for endangered green turtles (Selliah et al. 2012). Degradation of the reef system is
evident in the form of coral bleaching and there is a noted reduction in abundance of reef fish (Selliah et
al. 2012). Siltation from the Conset Bay River has also been observed to be affecting the reef and
resulting in shallowing of the nearshore region (Cumberbatch and Simmons 2010).
The Conset Bay watershed is drained by a number of streams that empty into Conset Bay River which
ultimately empties into Conset Bay. These rivers and streams flow through a mix of land-uses within the
watershed, transporting surface runoff. It has also been noted that a large number of households within
the area utilise toilet facilities that empty into soakaways; this can allow nutrients and other chemicals to
leach into groundwater which may reach streams (Selliah et al. 2012). The hydro-geologic environment
and topographic nature of the area suggest low permeability of underlying rock together with steep
drainage flow paths. These paths flow directly into the sea and create an avenue for pollutants to enter
coastal waters (EPG et al. 2004a). The district is also prone to slippage and high levels of erosion (EPG et
al. 2004a). The coupling effect of the existing conditions can lead to adverse changes in water quality,
increase in water volumes, eutrophication, increased turbidity and sedimentation, all of which
contribute to degradation of the marine environment (Caribbean Environmental Health Institute 2008).

3
The area highlights strong interdependencies of the terrestrial and marine environments. It also
emphasizes the potential for land-use to impact marine productivity. Mapping areas such as the Conset
Bay watershed can inform resource managers and communities of current conditions in the watershed
and allow for more informed decision-making and management actions.
This study focuses on mapping of a coastal watershed to:
• Characterise land cover and land-use within the watershed using GIS tools;
• Assess and characterise riparian vegetation distribution and spatial extent within the watershed;
• Identify potential sources of pollutants entering the coastal area via the watershed due to land-use and
other human activities within the area.
2 BACKGROUND
2.1 Land-use/land cover impacts on watersheds
Land cover relates to a physical description of space; it is defined as the observed (bio) physical cover of
the earth's surface (Di Gregorio and Jansen 2000; European Communities 2001). It is that which is spread
over the surface covering the ground. Using this definition, various biophysical categories can be
illustrated. Some of these include areas of vegetation such as trees or fields, areas of bare soil, hard
surfaces such as rocks or buildings and wet areas and bodies of water such as sheets of water,
watercourses and wetlands (European Communities 2001).
Land-use is described by the arrangements, activities and inputs people undertake in a certain land cover
type to produce, change or maintain it (Di Gregorio and Jansen 2000). This definition creates a link
between land cover and the utilisation of surroundings by individuals (Di Gregorio and Jansen 2000). A
sequential approach to land-use which has been developed specifically for agricultural purposes, relates
land-use to the interaction of the human element with the natural environment with the intention to
obtain products and/or benefits through using land resources (Mucher et al. 1993). However, from a
functional perspective it refers to the description of areas in terms of their socio-economic purpose,
whether this may be residential, industrial or commercial, agricultural or conservational (European
Communities 2001).
Whereas land cover may be observed by different methods, attempts to observe land-use on its own
would be a challenge. Difficulties are likely to occur as the decision-making process for the use of land
cover may require information which may not be readily available from a single “source of observation”,
such as by the human eye or aerial photographs (European Communities 2001). It was noted in the 2001
European Communities Report on Concepts of Land Cover and Land-use Information Systems that whilst
using a functional approach to land-use, inference of land cover may be helpful, a sequential approach
would often require a more in-depth collection of various attributes (European Communities 2001).
A watershed may be defined as an area in which water, sediments and dissolved material drain to a
common outlet such as a river, lake, bay or ocean (Environmental Protection Agency 1998). A drainage
basin refers to the area drained by a river and its tributaries; it is delineated by its watershed (Smithson
et al. 2008). The region enclosed by the watershed is referred to as the drainage area or catchment area
and is the fundamental land surface that produces river flow (Smithson et al. 2008). Drainage basins can
be considered environmental systems having both inputs (precipitation and ground water flowing into
the catchment) and outputs (discharge, evaporation, transpiration and any ground water that flows out
of the catchment through the rock) (Smithson et al. 2008). Water enters the drainage basin through
4
precipitation some of which enters water courses directly, some falls onto leaves and other surfaces
which prevent it from reaching the surface of the land (interception) while the remainder falls directly
unto the land surface. Initially in dry conditions water will be absorbed by the soil, referred to as
infiltration, water may then enter underlying rock where it is stored as groundwater. Once groundwater
stores are filled with water, further infiltration leads to the overlying soil becoming filled with water (soil
water) this is utilised by plants and soil organisms. When saturated further, precipitation results in sheets
of surface water washing over the water logged soil directly into water courses known as overland flow
as well as downward through the soil and into underlying rock; lateral flow also occurs within the soil
(throughflow) and the rock (baseflow). All these flows eventually reach water courses unless they are
taken up by biota or water is removed by evaporation. Flows reaching the watercourse together with the
channel precipitation contribute to the total river flow and are transferred downstream to the point of
discharge from the drainage basin (Smithson et al. 2008).
The impacts of land-use on water resources within a watershed are dependent on several factors.
Physical factors include topography, soil structure and climate. Socio-economic factors may include
economic ability and awareness of farmers, management practices and infrastructural development
(Kiersch 2001). The need for change in land cover from forested lands to croplands, housing, pastures,
plantations and other built environments stems from the growing demands of populations for food,
water, shelter, goods and services as well as developmental policy shifts (Foley et al. 2005; Stonestrom
et al. 2009).
In the insular Caribbean, land space is limited and the majority of development and expansion is
concentrated on the islands’ coasts. Increased human development in coastal watersheds can be
detrimental for nearshore environments as growth in coastal areas is a major contributor to changes in
hydrology and the level of non-point source pollution (Tang et al. 2005). Non-point source pollution can
be attributed to a number of land-based activities though it is difficult to define the specific location at
which the pollutant enters the waterways (Enivronmental Protection Agency 1994). For example
agricultural land has been known to introduce pollutants such as nutrients, chemicals and sediment into
riverine systems through surface runoff while urban areas have been known to contribute heavy metals
and rubber fragments to run off (Tong and Chen 2002). Built up areas can also contribute to an increase
in storm water discharge due to changes in permeability of the ground surface (Basnyat et al. 2000).
2.1.1 Land-use and watershed scale
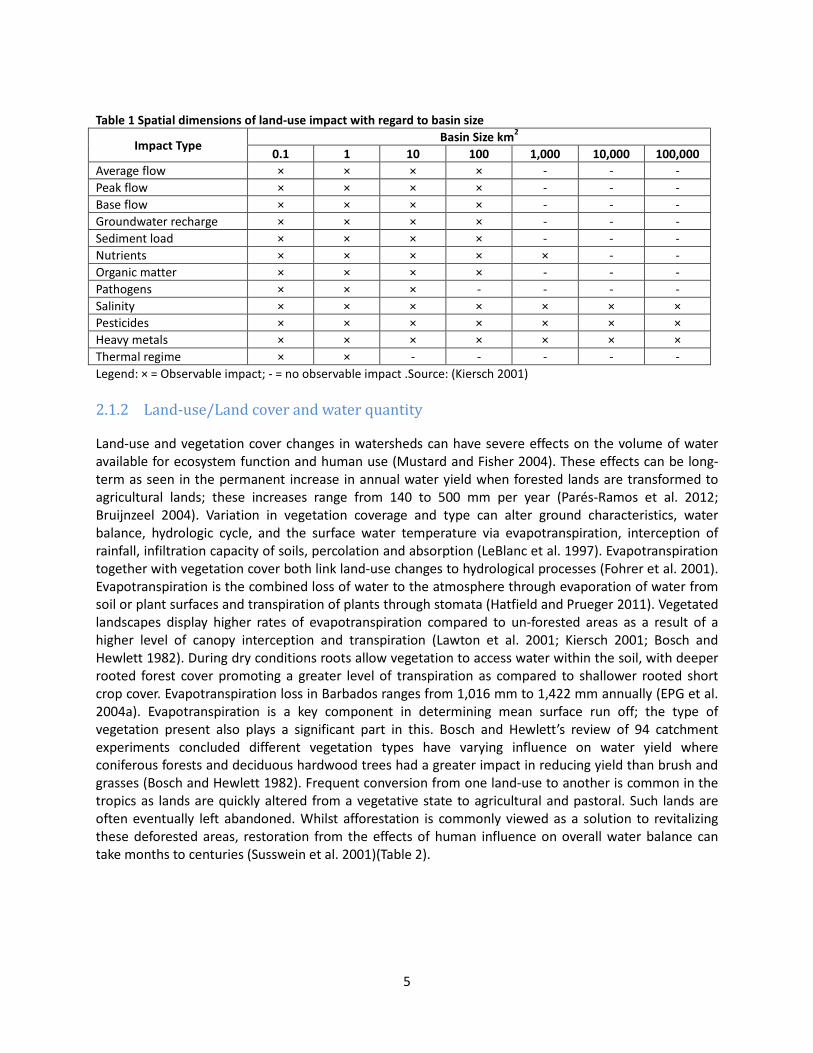
Land-use in watersheds has been noted to have an observable impact, especially in smaller watersheds.
The impacts of land-use decrease as watershed size increases due to offset effects such as storage
capacity of the river bed and the self-cleaning capacity of the river (Kiersch 2001).The spatial dimensions
of land-use effects are summarised in Table 1.
5
Table 1 Spatial dimensions of land-use impact with regard to basin size
Impact Type Basin Size km
2
0.1 1 10 100 1,000 10,000 100,000 Average flow × × × × - - -
Peak flow × × × × - - -
Base flow × × × × - - -
Groundwater recharge × × × × - - -
Sediment load × × × × - - -
Nutrients × × × × × - -
Organic matter × × × × - - -
Pathogens × × × - - - -
Salinity × × × × × × × Pesticides × × × × × × ×
Heavy metals × × × × × × ×
Thermal regime × × - - - - -
Legend: × = Observable impact; - = no observable impact .Source: (Kiersch 2001)
2.1.2 Land-use/Land cover and water quantity
Land-use and vegetation cover changes in watersheds can have severe effects on the volume of water
available for ecosystem function and human use (Mustard and Fisher 2004). These effects can be long-
term as seen in the permanent increase in annual water yield when forested lands are transformed to
agricultural lands; these increases range from 140 to 500 mm per year (Parés-Ramos et al. 2012;
Bruijnzeel 2004). Variation in vegetation coverage and type can alter ground characteristics, water
balance, hydrologic cycle, and the surface water temperature via evapotranspiration, interception of
rainfall, infiltration capacity of soils, percolation and absorption (LeBlanc et al. 1997). Evapotranspiration
together with vegetation cover both link land-use changes to hydrological processes (Fohrer et al. 2001).
Evapotranspiration is the combined loss of water to the atmosphere through evaporation of water from
soil or plant surfaces and transpiration of plants through stomata (Hatfield and Prueger 2011). Vegetated
landscapes display higher rates of evapotranspiration compared to un-forested areas as a result of a
higher level of canopy interception and transpiration (Lawton et al. 2001; Kiersch 2001; Bosch and
Hewlett 1982). During dry conditions roots allow vegetation to access water within the soil, with deeper
rooted forest cover promoting a greater level of transpiration as compared to shallower rooted short
crop cover. Evapotranspiration loss in Barbados ranges from 1,016 mm to 1,422 mm annually (EPG et al.
2004a). Evapotranspiration is a key component in determining mean surface run off; the type of
vegetation present also plays a significant part in this. Bosch and Hewlett’s review of 94 catchment
experiments concluded different vegetation types have varying influence on water yield where
coniferous forests and deciduous hardwood trees had a greater impact in reducing yield than brush and
grasses (Bosch and Hewlett 1982). Frequent conversion from one land-use to another is common in the
tropics as lands are quickly altered from a vegetative state to agricultural and pastoral. Such lands are
often eventually left abandoned. Whilst afforestation is commonly viewed as a solution to revitalizing
these deforested areas, restoration from the effects of human influence on overall water balance can
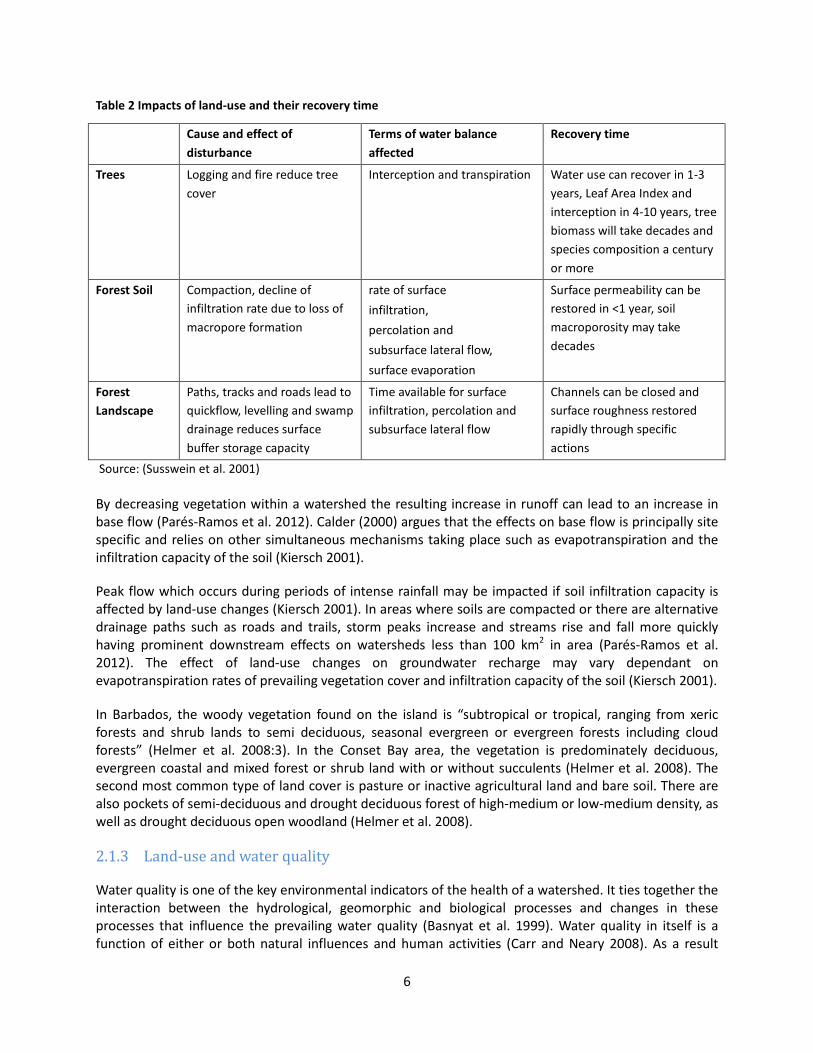
take months to centuries (Susswein et al. 2001)(Table 2).
6
Table 2 Impacts of land-use and their recovery time
Cause and effect of
disturbance
Terms of water balance
affected
Recovery time
Trees Logging and fire reduce tree
cover
Interception and transpiration Water use can recover in 1-3
years, Leaf Area Index and
interception in 4-10 years, tree
biomass will take decades and
species composition a century
or more
Forest Soil Compaction, decline of
infiltration rate due to loss of
macropore formation
rate of surface
infiltration,
percolation and
subsurface lateral flow,
surface evaporation
Surface permeability can be
restored in <1 year, soil
macroporosity may take
decades
Forest
Landscape
Paths, tracks and roads lead to
quickflow, levelling and swamp
drainage reduces surface
buffer storage capacity
Time available for surface
infiltration, percolation and
subsurface lateral flow
Channels can be closed and
surface roughness restored
rapidly through specific
actions
Source: (Susswein et al. 2001)
By decreasing vegetation within a watershed the resulting increase in runoff can lead to an increase in
base flow (Parés-Ramos et al. 2012). Calder (2000) argues that the effects on base flow is principally site
specific and relies on other simultaneous mechanisms taking place such as evapotranspiration and the
infiltration capacity of the soil (Kiersch 2001).
Peak flow which occurs during periods of intense rainfall may be impacted if soil infiltration capacity is
affected by land-use changes (Kiersch 2001). In areas where soils are compacted or there are alternative
drainage paths such as roads and trails, storm peaks increase and streams rise and fall more quickly
having prominent downstream effects on watersheds less than 100 km2 in area (Parés-Ramos et al.
2012). The effect of land-use changes on groundwater recharge may vary dependant on
evapotranspiration rates of prevailing vegetation cover and infiltration capacity of the soil (Kiersch 2001).
In Barbados, the woody vegetation found on the island is “subtropical or tropical, ranging from xeric
forests and shrub lands to semi deciduous, seasonal evergreen or evergreen forests including cloud
forests” (Helmer et al. 2008:3). In the Conset Bay area, the vegetation is predominately deciduous,
evergreen coastal and mixed forest or shrub land with or without succulents (Helmer et al. 2008). The
second most common type of land cover is pasture or inactive agricultural land and bare soil. There are
also pockets of semi-deciduous and drought deciduous forest of high-medium or low-medium density, as
well as drought deciduous open woodland (Helmer et al. 2008).
2.1.3 Land-use and water quality
Water quality is one of the key environmental indicators of the health of a watershed. It ties together the
interaction between the hydrological, geomorphic and biological processes and changes in these
processes that influence the prevailing water quality (Basnyat et al. 1999). Water quality in itself is a
function of either or both natural influences and human activities (Carr and Neary 2008). As a result
7
land-use and land cover characteristics can have profound effects on the prevailing water quality in a
watershed. Land-use and water quality have been inextricably linked through watershed hydrology,
sediment influx and chemical loads (Basnyat et al. 1999; Basnyat et al. 2000). Changes in land-use from
natural vegetation to agriculture or other human uses can result in an increase of pollutants in surface
run-off and in turn an increase in nonpoint source pollution (Maillard and Pinheiro Santos 2008). These
changes alter water quality in rivers and streams, lakes, wetlands, coastal areas and groundwater by
introducing pollutants such as:
• Excess fertilisers, herbicides and insecticides from agricultural lands and residential areas
• Oil, grease and toxic chemicals from urban runoff and energy production
• Sediment from improperly managed construction sites, crop and forest lands and eroding stream
banks
• Salt from irrigation practices and acid drainage from abandoned mines
• Bacteria and nutrients from livestock, pet wastes and faulty septic systems
(Enivronmental Protection Agency 1994).
Sediment enters waterways through natural processes as well as through a variety of human activities
such as agriculture, forestry, mining and urbanisation (Carr and Neary 2008). Increase in sediment load is
associated with the removal of vegetation, channelisation of rivers, and removal of natural land cover/
replacement with built land cover such as roads (Carr and Neary 2008).
The nutrient levels of nitrogen and phosphorus in watersheds can be affected by changes in land-use and
vegetation cover. Deforestation can contribute to higher nitrate levels due to a reduction in uptake by
plants or decomposition of organic material (Kiersch 2001). Changes in land-use from forested areas to
arable lands can also contribute to higher nutrient levels in water ways (Kiersch 2001).
Knowledge about land-use and land cover can be instrumental in addressing issues of water resource
management, flood prediction, soil degradation and nutrient loss. Landscape level environmental
indicators such as watershed land cover/use and riparian buffer zones can provide quantitative estimates
of coastal and estuarine habitat conditions and trends (Klemas 2001). Basnyat et al (1999) examines the
relationship between mixed land-use and non-point source pollution on the water quality of streams.
The models link three different spatial scales of land-use and land cover in a watershed; the entire basin,
the contributing zone defined for each stream based on a number of characteristics and the riparian
zone given by the proportion of stream length occupied by each vegetation cover type. The contributing
zone is identified as the area surrounding a stream that as a result of land-use practices and other
human activities contributes nutrients and other non-point source pollutants to surface and subsurface
waters and in turn streams (Basnyat et al. 1999). The study suggests forests are a transformation zone; as
the proportion of forest area increases within the contributing zone, nitrate levels downstream will
decrease. The study also suggests a significant relationship between water quality and riparian zone
land-use where non-invasive land-use has a positive effect on water quality while more intensive uses
such as agriculture and built-up areas impact negatively.
2.1.4 Riparian vegetation in watersheds
Riparian vegetation is defined as “plants and communities adjacent to and affected by surface or
groundwater of perennial or ephemeral water bodies” (James and Barnes 2011). The exact extent as to
what is considered “riparian” is undefined. Lowrance et al. (1985) define riparian buffers as:
8
“a complex assemblage of plants and other organisms in an environment adjacent to
water. Without definite boundaries, it may include stream banks, floodplain, wetlands as
well as sub-irrigated sites forming a transitional zone between upland and aquatic
habitat. Mainly linear in shape and extent, they are characterized by laterally flowing
water that rises and falls at least once within a growing season”.
Riparian vegetation forms a buffer which defends against bank erosion, upholds water quality and
shelters stream ecosystems (Osmond et al. 2002). These buffers exist in various land-use types ranging
from urban to forest and can consist of grasses, shrubs, trees or mixed vegetation (Osmond et al. 2002).
Dosskey et al. (2010) gives a detailed review of the processes by which riparian vegetation regulates
stream water quality as well as the ways different vegetation types affect riparian vegetation functions. It
is important to note the role riparian vegetation plays in protecting streams from non-point source
pollution by improving water quality through direct and indirect processes. This understanding is vital to
effectively use prevailing vegetation condition as a gauge of water quality protection and to determine
ways to improve water quality through restoration (Dosskey et al. 2010).
2.2 Water quality
Water quality is of utmost importance for aquatic environments to support life and sustain biodiversity.
The physical, chemical and biological composition of water and its availability affect the ability of aquatic
environments to sustain healthy ecosystems: as water quality and quantity are eroded, organisms suffer
and ecosystem services may be lost (Carr and Neary 2008). Various requirements exist for water quality
depending on its use, for example requirements for drinking water quality may be more stringent than
for recreation, agriculture and industrial uses. As water quality diminishes the volume of water available
for sustaining life diminishes (Carr and Neary 2008). Such changes in environmental quality may be
concomitant with water quality parameters such as sediment load, nutrient concentrations,
temperature, dissolved oxygen levels, and pH (Carr and Neary 2008). Other pollutants such as naturally
occurring or synthetic compounds such as oil and grease, pesticides, mercury and other trace metals,
and non-metallic toxins (Polycyclic aromatic hydrocarbons, PAHs and Polychlorinated biphenyls, PCBs)
are dangerous to biota and humans (Carr and Neary 2008). It can then be seen that water quality in
coastal ecosystems is of great importance when assessing ecosystem health.
Sediment within the water ways can have physical and chemical impacts on water quality and aquatic
ecosystem health. Excess sediment in water ways have negative effects on turbidity of streams reducing
the amount of sunlight penetration (Carr and Neary 2008; Kiersch 2001; Osmond et al. 2002). Increased
sediment load in rivers and streams can have negative downstream effects on agricultural lands and
irrigations systems (Kiersch 2001). Moreover siltation is a major issue associated with increased
sediment influx as it may result in reduction of reservoir capacity, smothering of coral reefs and loss of
spawning grounds for aquatic life (Carr and Neary 2008; Kiersch 2001; Osmond et al. 2002). Sediment
may also bring entrained with it absorbed chemicals such as metals, phosphorus and hydrophobic
organic compounds (Kiersch 2001). Increased sediment influx also negatively affects property values,
recreational uses such as boating, swimming and fishing, as well as navigation (Osmond et al. 2002).
Nutrients such as phosphates and nitrogen enter waterways resulting in harmful effects for both humans
and aquatic ecosystems. Phosphates enter streams most often through surface runoff attached to
sediments, while organic forms of nitrogen can enter water ways through surface flow attached to
sediments, as part of organic matter or through subsurface flow by forming nitrate-nitrogen; a mobile
form of nitrogen that readily moves with soil water (Osmond et al. 2002). Excess of these nutrients can

9
have detrimental effects on primary production in the marine and freshwater ecosystems resulting in
eutrophication, algal blooms, reduced transparency and fish kills (Martin et al. 2001; Osmond et al.
2002). The algal blooms can lead to loss of aquatic plants that require high levels of oxygen and in turn a
loss in biodiversity (Carr and Neary 2008). Groundwater may also be affected as surface water may
percolate into groundwater aquifers. The process of eutrophication can pose severe consequences for
human health as it can result in the production of cyanobacterial toxins in the water (Carr and Neary
2008). Eutrophication can also result in the infilling of irrigation channels, loss of recreational areas due
to slime, weed infestations and noxious odours and economic losses due to the disappearance of species
targeted in commercial and sport fisheries (Carr and Neary 2008).
Bacterial contamination occurs as a result of run-off from animal waste, septic tank systems, soakaways
and discharges from waste-water treatment plants. Microbial pollution poses severe health risks or even
death to humans and livestock due to microbial pathogens (Carr and Neary 2008). High levels of
microbial pollution can also impact tourism and the fishing industry as it may result in the closure of
beaches and contamination of filter feeders (Carr and Neary 2008; Osmond et al. 2002).
Barbados has established The Marine Pollution Act Proposed Discharge Standards seen in Appendix 1
(Environmental Protection Department 2004). The Environmental Protection Department (EPD) conducts
weekly sampling at 19 beaches on the North, South and West Coasts of Barbados (Environmental
Protection Department 2011). The samples are analysed for enterococci and faecal coliform organisms at
the Sir Winston Scott Polyclinic Laboratory, with quality standards determined by the proposed Marine
Pollution Control Discharge Standards. Information such as beach and water debris, cloud cover, rainfall
data, sea conditions, air and water temperatures and bather density are also collected (Environmental
Protection Department 2011). However this monitoring programme has not yet been expanded to
include Conset Bay or any other part of the east coast of the island (Selliah et al. 2012). No historic water
quality data were found for Conset Bay (Selliah et al. 2012).
2.3 Benthic reefs ecosystem
Selliah et al. (2012) give a detailed account of the benthic marine environment as described by a
Conset Bay fisherman. The area provides a nursery for juvenile fishes, sea cats (octopus) and sea
eggs (Tripneustes ventricosus). The reef also provides an environment for parrotfishes, angelfishes,
grunts, crevale, snappers, surgeonfishes, groupers, triggerfishes, filefishes, horse-eyes, jacks, tabios
and rainbow parrotfish (Selliah et al. 2012). The coastal benthic habitat in Conset Bay is diverse
comprising of sea-grass beds, hard coral, patch reefs and bars, brown algal pavements, coral rubble and
the gorgonian pavements as shown in Table 3 (Selliah et al. 2012).
2.4 Existing institutional and policy framework
The Coastal Zone Management Unit (CZMU) and the EPD are the bodies responsible for the marine and
coastal environment in Barbados. EPD is also responsible for the environmental monitoring and pollution
control of the land, air and water in the island (Environmental Protection Department 2013). The Marine
Pollution Control Act (1998) serves to, “prevent, reduce and control pollution of the marine environment
of Barbados from whatever source”. The legislation was enacted to facilitate action against progressively
deteriorating coastal water quality in some locations as a result of increased infrastructural development
in coastal areas over the past 30 years.

10
Table 3 Coverage of benthic habitat in Conset Bay
Composition of the benthic
habitat in Conset Bay Rank
Type Area Covered/ m2
1a Bare sand 2,800,000
1b Bare sand 27,950,000
2 The Gorgonian Pavement 13,240,000
3 Brown algal pavement 2,130,000
4a Large Sea grass Patch 80,000
4b Smaller Sea Grass Patch 70,000
5 Coral rubble 950,000
6 Hard coral 20,000
Source: (Selliah et al. 2012)
The CZMU was developed from the Coastal Conservation Project in 1983. It was officially established in
1996 performing a variety of coastal management functions such as coral reef monitoring, updating the
inventory of coastal resources, consultations with the Town and Country Development Planning Office
(TCDPO) regarding all coastal development, beach erosion and accretion monitoring and control,
updating the inventory of coastal structures, regulation of marine research, public education of ICZM,
coastal conservation project designs and management, and the review of any coastal projects.
The Coastal Zone Management Act (1998-39) provides for a more effective management of the coastal
resources of Barbados, for the conservation and enhancement of those resources. The Act specifically
deals with the preservation and enhancement of marine areas, beach and coral reef protection. CZMU
also presides over the designation of marine protected areas and marine parks. The Act also provides
the legal basis for the preparation of the Coastal Zone Management Plan. An Integrated Coastal
Management Plan for the Atlantic (East) and Caribbean coast (west and south coast) of the island has
been prepared. The plan provides for the conservation and management of coastal and marine
biodiversity. It provides for the conservation and management of Natural Heritage Conservation Areas
(OS 2) and Coastal Landscape Protection Zones (OS 3) established under the Physical Development Plan.
In addition, the Environmental Management and Land-use Planning for Sustainable Development Project
completed in 1998 sought the development of a draft 1998 Environmental and Natural Resources
Management Plan. The Plan proposed a number of institutional changes for a more streamlined and
integrated approach to natural resources management. It also embodied the Draft Environmental
Management Act which provides for the wise and sustainable use of the natural environment and
resources of Barbados. The draft has been in existence since the early 2000’s (Selliah et al. 2012).
The terrestrial environment is steered by various legislations and regulatory provisions. The National
Physical Development Plan makes provisions for the establishment of a National Park and System of
Open Spaces (NPSOS) to ensure the protection and conservation of natural and cultural assets, while
supporting the socio-economic development of communities within the park boundaries (Selliah et al.
2012). The NPSOS consists of six open space categories (Selliah et al. 2012):
• OS 1-The Barbados National Park-International Union (IUCN) Category 5 Protected
Landscape/Seascape (entire area of National Park)

11
• OS 2-National Heritage Conservation Areas
• OS 3-Coastal Landscape Protection Zone
• OS 4-Public Parks and Open Spaces
• OS 5-National Attractions
• OS 6-Barbados National Forest Candidate Sites
The objectives of the NPSOS are to encourage landscape preservation, ensure the conservation of
natural areas, fulfil the recreational needs of residents of Barbados and improve facilities for residents
and tourists alike (Government of Barbados 2003). The Natural Heritage Department (NHD) of the
Ministry of Environment and Drainage in charge of the NPSOS, focusing particularly on OS 1 and OS 4
(Selliah et al 2012). The Conset Bay watershed is situated within the Barbados National Park and as a
result development and activities within the area fall under the purview of NPSOS restrictions.
3 STUDY AREA
The Conset Bay watershed study area was delineated using watershed mapping data from the Gully
Ecosystem Management Study (EPG et al. 2004b)(Figure 1). The watershed data were verified using a
topographic contour map of the area. Conset Bay is located at 13.179783° N and 59.465883° S and as
defined by the Gully Ecosystem Management Study of 2002, is situated on the Atlantic Coast of Barbados
on the eastern side of the island in the Parish of St John. The watershed includes the communities of
Conset Bay, St. Marks, College Savannah, Sealy Hall and Sargeant Street (Figure 2). It covers
approximately 3.9 km2 and is located on the southern boundary of the Barbados National Park as seen in
Figure 3 (Government of Barbados 2003). According to the Physical Development Plan (2003), the use
and management of the land and marine resources within the Barbados National Park should be of a
sustainable manner and also supportive of the social and economic development of the local
communities (CERMES 2012).
Figure 1 Location map of Conset Bay catchment

12
Figure 2 Conset Bay catchment, watercourses and communities
13
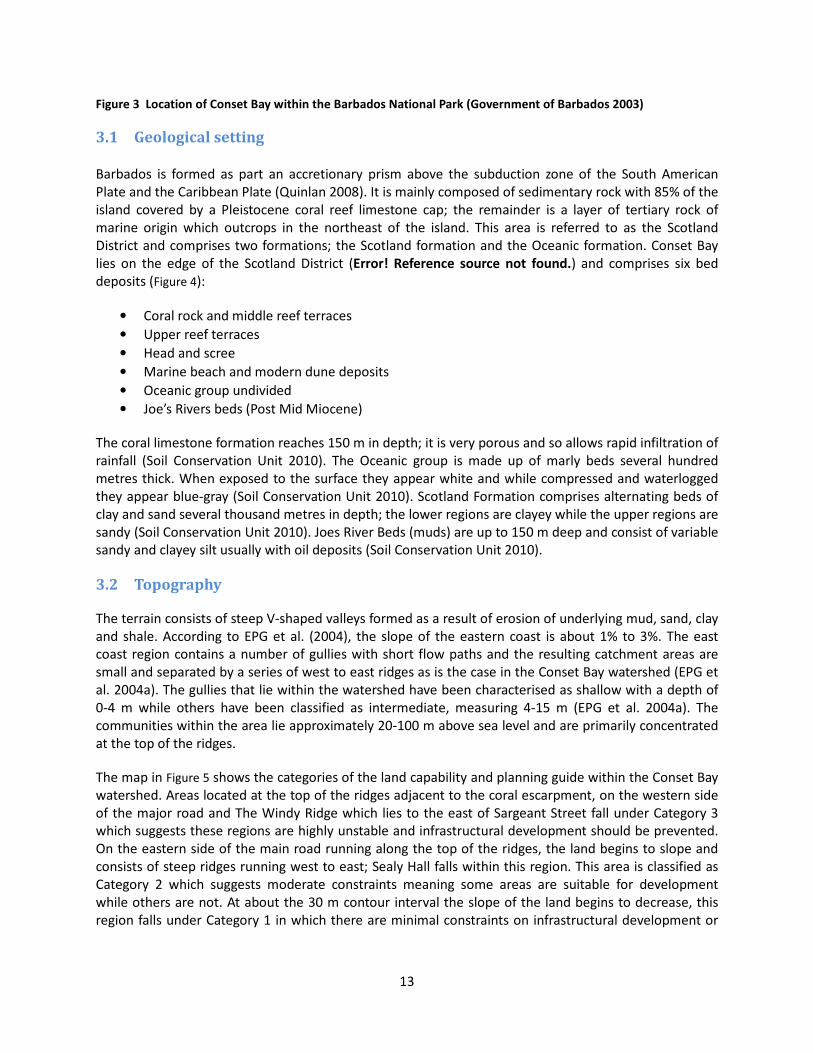
Figure 3 Location of Conset Bay within the Barbados National Park (Government of Barbados 2003)
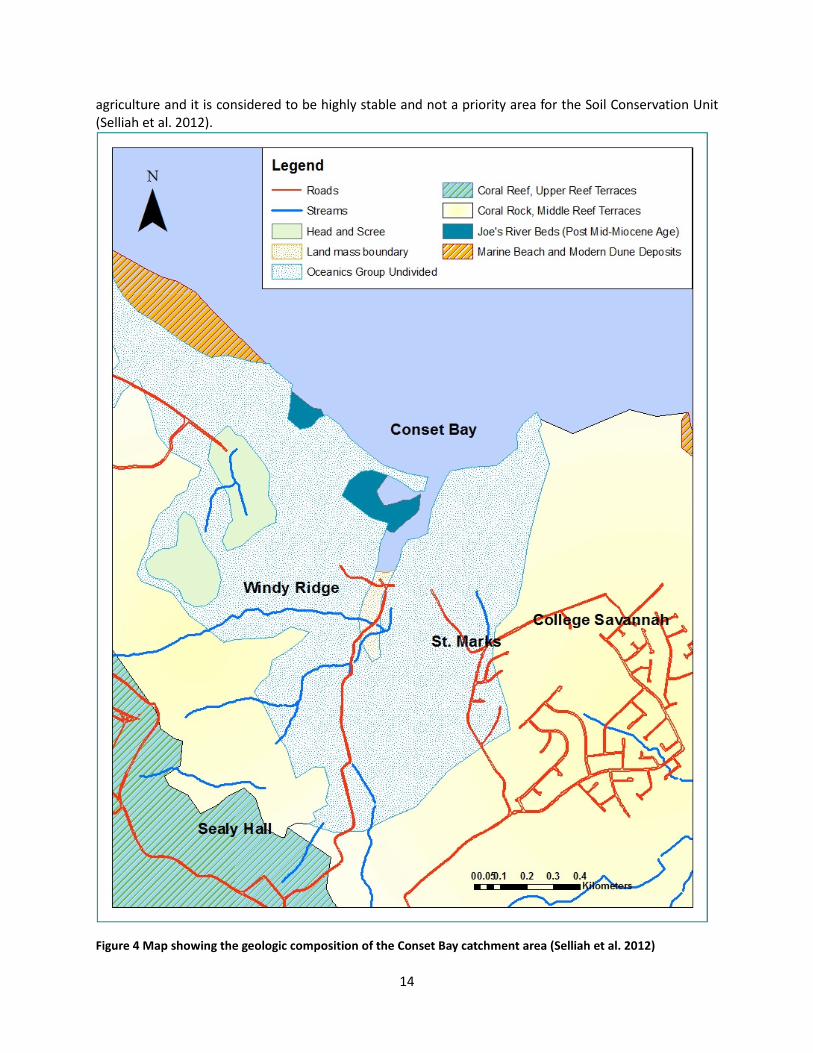
3.1 Geological setting
Barbados is formed as part an accretionary prism above the subduction zone of the South American
Plate and the Caribbean Plate (Quinlan 2008). It is mainly composed of sedimentary rock with 85% of the
island covered by a Pleistocene coral reef limestone cap; the remainder is a layer of tertiary rock of
marine origin which outcrops in the northeast of the island. This area is referred to as the Scotland
District and comprises two formations; the Scotland formation and the Oceanic formation. Conset Bay
lies on the edge of the Scotland District (Error! Reference source not found.) and comprises six bed
deposits (Figure 4):
• Coral rock and middle reef terraces
• Upper reef terraces
• Head and scree
• Marine beach and modern dune deposits
• Oceanic group undivided
• Joe’s Rivers beds (Post Mid Miocene)
The coral limestone formation reaches 150 m in depth; it is very porous and so allows rapid infiltration of
rainfall (Soil Conservation Unit 2010). The Oceanic group is made up of marly beds several hundred
metres thick. When exposed to the surface they appear white and while compressed and waterlogged
they appear blue-gray (Soil Conservation Unit 2010). Scotland Formation comprises alternating beds of
clay and sand several thousand metres in depth; the lower regions are clayey while the upper regions are
sandy (Soil Conservation Unit 2010). Joes River Beds (muds) are up to 150 m deep and consist of variable
sandy and clayey silt usually with oil deposits (Soil Conservation Unit 2010).
3.2 Topography
The terrain consists of steep V-shaped valleys formed as a result of erosion of underlying mud, sand, clay
and shale. According to EPG et al. (2004), the slope of the eastern coast is about 1% to 3%. The east
coast region contains a number of gullies with short flow paths and the resulting catchment areas are
small and separated by a series of west to east ridges as is the case in the Conset Bay watershed (EPG et
al. 2004a). The gullies that lie within the watershed have been characterised as shallow with a depth of
0-4 m while others have been classified as intermediate, measuring 4-15 m (EPG et al. 2004a). The
communities within the area lie approximately 20-100 m above sea level and are primarily concentrated
at the top of the ridges.
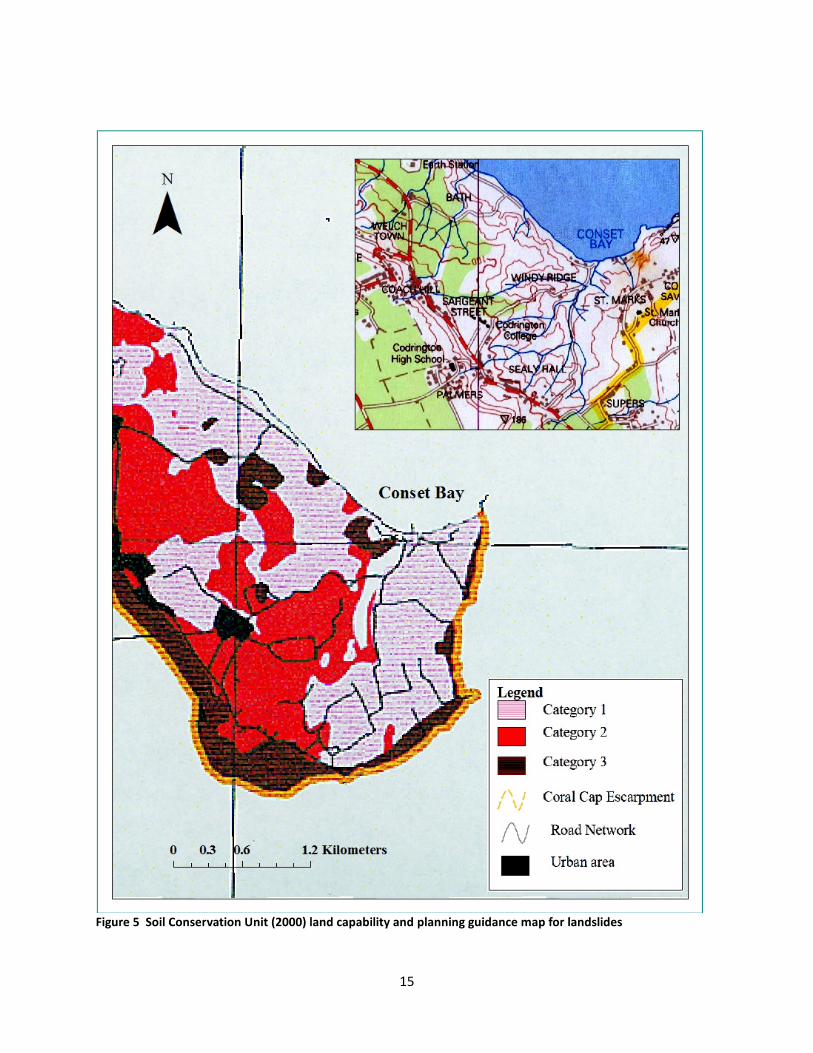
The map in Figure 5 shows the categories of the land capability and planning guide within the Conset Bay
watershed. Areas located at the top of the ridges adjacent to the coral escarpment, on the western side
of the major road and The Windy Ridge which lies to the east of Sargeant Street fall under Category 3
which suggests these regions are highly unstable and infrastructural development should be prevented.
On the eastern side of the main road running along the top of the ridges, the land begins to slope and
consists of steep ridges running west to east; Sealy Hall falls within this region. This area is classified as
Category 2 which suggests moderate constraints meaning some areas are suitable for development
while others are not. At about the 30 m contour interval the slope of the land begins to decrease, this
region falls under Category 1 in which there are minimal constraints on infrastructural development or
14
agriculture and it is considered to be highly stable and not a priority area for the Soil Conservation Unit
(Selliah et al. 2012).
Figure 4 Map showing the geologic composition of the Conset Bay catchment area (Selliah et al. 2012)
15
Figure 5 Soil Conservation Unit (2000) land capability and planning guidance map for landslides

16
3.3 Population distribution
Table 4 shows the population distribution of communities surrounding Conset Bay. The majority of the
population is concentrated in the College Savannah area representing 48%. College Land, Sargeant Street
and Sealy Hall represent 27%, 15% and 10%, respectively. The map in Figure 5Error! Reference source
not found. shows the relation of the communities to the drainage basin of the watershed. It can be seen
that these communities lie along the head waters of the streams within the watershed.
Table 4 Population distribution in communities around Conset Bay (Selliah et al. 2012)
Male Female Total Percentage
College Land 120 124 244 26.5
College Savannah 238 207 445 48.3
Sargeant Street 68 74 142 15.4
Sealy Hall 48 43 91 9.9
Total 474 448 922 100.0
Percentage 51.4 48.6 100.0
3.4 Climate
The climate of the Conset Bay area is similar to the rest of the island, which experiences a moderate
tropical marine climate. Rainfall is seasonal and occurs mainly during the wet season from the period
June to October. The island also experiences tropical depressions during this time. During December to
March, the island experiences the effects of northerly swells which generate long period waves; some of
the wave energy is refracted around the northern headland and so initially impacts communities along
the eastern coast including Conset Bay (Selliah et al. 2012).
4 METHODOLOGY
The current study was conducted to investigate how land-use practices might affect the quality of water
entering the marine environment in Conset Bay. The study aims to link terrestrial activities within the
watershed with possible impacts on the nearshore marine environment. In order to pursue this, land
cover and land-use within the watershed were characterised using GIS tools and site surveys. The
riparian vegetation distribution and spatial extent was assessed and characterised using rapid
assessment techniques. Water quality data were collected and analysed for microbial levels, nutrient
levels and physical water quality parameters. An activities survey was also conducted to gain a
comprehensive understanding of how the location is utilised.
4.1 Watershed mapping
Land cover was assessed via satellite imagery using an Ortho-image licensed by Digital Globe dated
2007. The image was compared to more recent satellite imagery available on Google Earth to determine
if any major land-use changes had occurred between 2007 and the present. The image was imported
and assessed using ESRI’s ArcView software. The catchment was delineated using watershed mapping
data from the Barbados Gully Ecosystem Management Study 2004. Images were analysed at a scale of
17
1:10000 and a land cover data set was created to categorise usage using the editing tool. Site visits were
also conducted for ground-truthing and confirming consistency with that of the imagery.
Land cover was mapped for the entire watershed in order to characterise the landscapes’ vegetation
cover. Land-use was mapped for the purpose of determining potential contributing areas to non-point
source pollution. The spatial arrangement of land cover within watersheds is an important indicator of
stream ecosystem health (King et al. 2005). In depth analysis of land cover spatial relation to streams by
correlative techniques is covered by King et al. (2005) and addresses a number of considerations while
undertaking these analyses. This study only goes as far as to characterise the land cover within the
watershed due to time constraints.
Land cover categories were adapted from the Biodiversity Conservation section of the Barbados Gully
Ecosystem Management Study (Carrington et al. 2003) categories for vegetation cover/land-use in the
broad scale biodiversity survey and consisted of:
• Cropland: land currently in cultivation
• Grassland: natural rangeland, livestock pasture land and agricultural land not in recent cultivation
• Built infrastructure: general areas of settlement
• Forest: closed forest, open forest
• Scattered trees: Less than 25% tree cover
• Scrub: vegetation dominated by shrubs usually less than 5 m tall
• Sand: coastal area
Land-use was assessed via site visit observations and digitised using the Ortho-image utilised for land
cover assessment and categorised as follows:
• Agriculture
• Natural vegetation
• Recreation
• Residential
• Commercial
4.2 Identifying potential sources of non-point source pollution due to land-use
In order to identify potential sources of non-point source pollution due to runoff, the ArcView hydrology
spatial tool set was used. Using contour data provided by CERMES, a digital elevation model (DEM) was
created for the watershed area. The model was then filled to remove any sinks or pockets to create a
depression-less DEM. Sinks must be removed as they do not drain within the watershed and hinder the
determination of the drainage path network. Using the smooth filled DEM, flow direction was calculated
to produce a flow direction raster. The grid created contains an eight directional code for the direction in
which each grid cell drains. This is necessary to determine the flow characteristics of each cell in the grid
and provide drainage characteristic data for the entire watershed.
“For every 3x3 cell neighbourhood the grid processor finds the lowest neighbouring cell from the
centre. Each number in the matrix below corresponds to a flow direction – that is, if the centre cell
flows due north, its value will be 64, if it flows NE its value will be 128. These numbers have no
numeric meaning but are simply a coded directional value that indicates the steepest descent
based on elevation” (Trent University 2009).
18
The flow direction raster was created using the Flow Direction Tool. Using the flow direction raster a flow
accumulation raster was created using the Flow Accumulation Tool. The geographic extent of a
watershed is set by the drainage. A drainage network is created to calculate the definitive drainage path
of the cells within the grid. Flow accumulation produces a drainage pattern of cells that experience the
highest flow levels which correspond to stream channels and valleys (Trent University 2009). A feature
data set was created containing the location of the water quality measurement sites and used for
analysis. Key sites were selected and used as pour points throughout the watershed. The sites
represented the point at which stream branches met the main channel. The pour points were snapped
to the flow accumulation raster using the Snap Pour Point tool. Pour points occur in areas of high flow
accumulation within the drainage network and can be utilised to determine the water flow to that given
point. In instances where pour point data do not correspond to cells with high flow accumulation due to
differences in data sources the Snap Pour Point tool can be used to snap the pour points to the nearest
high flow accumulation path using a measured threshold distance. The threshold distance is measured
using the measure tool to determine the furthest distance away of the furthest pour point from the high
flow accumulation path. Here a threshold distance of 80 m was used. Watersheds were then delineated
for each pour point to determine the spatial contribution to each site. This was done using the
Watershed tool inputting the flow direction raster grid and the snapped pour point raster data. The
percentage of each land-use type within each watershed created was then calculated to determine the
relationship between land-use and water quality data at the corresponding water quality sampling site.
Correlation was done between the three most abundant land-use types (natural vegetation, residential,
and agriculture) and the water quality data to determine any relationship that may exist. Scatter-grams
were created to determine the relationship between land-use area contributing zone to corresponding
pour point nutrient concentration levels.
4.3 Riparian vegetation assessment
Riparian vegetation was assessed throughout the watershed to map changes in type of vegetation along
watercourses. The assessment primarily recorded information on vegetation types, size of channel,
dominant tree and shrub species and adjacent land-use. Vegetation was initially observed using the
Ortho-image satellite imagery and Google imagery. Secondly, site visits were conducted to (1) collect
data along accessible watercourses and (2) view the watershed from vantage points to assess vegetation
in inaccessible areas. Data was collected using rapid assessment field sheets seen in Appendix 2. A GPS
hand-held unit was used to record data points along the water courses where changes in vegetation
were observed or significant observations noted. Vegetation was classified using the vegetation
cover/land-use categories seen in the Biodiversity Conservation Section of the Gully Ecosystem
Management Study (Carrington et al. 2003).
4.4 Human activities survey
In order to gain a comprehensive understanding of the land-use practices in the area, a human activities
survey was conducted during site visits. Surveys were conducted on six days, 10th of August, 11th of
August, 17th of August, 18th of August, 24th of August and 25th of August, as well as via online survey
techniques. Participants were approached and asked to answer a number of quantitative questions seen
in the survey questionnaire in Appendix 3. The survey used was adapted from the Barbados Coastal
Conservation Programme (Phase 1), Final Report for Coastal Projects land-use assessment survey
(Alleyne et al. 1999).

19
4.5 Water quality data collection
Water quality data were collected on two occasions at a number of sites within the watershed. Figure 6
shows the location of the water quality collection sites. Sites were selected to reflect the contribution of
streams before and after pour points within the watershed as well as at the stream mouth and marine
outfall. Two site visits were conducted on the 25th of August 2013 and the 28th of August 2013;
sampling took place between 2pm -6pm. The first site visit was conducted after a four-day period of no
rainfall to determine dry weather run-off concentrations whereas the second site visit was conducted
the day after a torrential rain fall of 6 cm to determine wet weather runoff concentrations. Each site was
tested for the nutrients nitrate and phosphate as well as enterococci bacteria concentrations. Physical in
situ readings were also conducted for pH, temperature, total dissolved solids, salinity, dissolved oxygen
and electric conductivity. Apparatus for data collection was obtained from the CERMES water quality lab
and included: 1 sterilised glass sample bottle per site, 2x plastic sample bottles per site, YSI meter,
Oakton meter, cooler, and ice.
Figure 6. Watercourses within Conset Bay Watershed along with water quality sites, and the main channel
sections (MC1, MC2, MC3).
Micro bacteria samples were collected in sterile glass bottles - the first sample set consisted of 500 ml
bottles while the second sample set consisted of 100 ml bottles. This was due to the results obtained
from the initial sample test; less of the sample was necessary to obtain observable readings. While in the
field, bottles were filled using a beaker to collect samples from the stream with care taken to not
contaminate the inside of the bottle caps or bottles. Care was taken to not expose the inside of the
bottle for extended periods to reduce contamination of airborne bacteria. Nutrient samples were filled

20
in stream, 2 samples were taken at each site. The sample bottle was first rinsed out 2-3 times with
sample water and then filled and capped. Samples were kept in a cooler of ice overnight and tested the
next day.
In the field, physical water quality parameters were measured using a YSI Model 85 meter. The meter
was initially calibrated in the field according to calibration directions. Temperature, dissolved oxygen and
conductivity were measured. The Oakton multiparameter tester PCSTester 35 was used to measure pH,
electrical conductivity, total dissolved solids and salinity. Care was taken to allow readings to stabilise
before values were recorded. In some instances readings proved difficult to obtain from the YSI Model
85 meter as the meter failed to stabilise.
4.6 Water quality sample processing
Samples were taken to the lab on the following day after each collection and placed in the freezer. The
micro bacteria samples were pippeted into sterile sample bottles and the Enterolert enzyme added and
shaken. For the first sample set 10 ml, 50 ml and 100 ml samples were tested, whereas the second
sample set consisted of 10 ml, 5 ml, and 1 ml sample dilutions. Samples were diluted with distilled water
to produce 100 ml. For marine water samples at sites 10 and 11 only, 10 ml samples were pippeted and
diluted to 100 ml as recommended by test instructions. During both sample collection days, the tide was
high and mixing of stream water and marine water was occurring during sampling. The solution was
poured into Quanti Trays and sealed in the IDEXX Quanti Tray sealer. Samples were placed in an
incubator at 41oC for 24 hours. The samples were then read according to test instructions with a black
UV light.
Nutrient tests were also carried out on the day following sampling. Samples were initially filtered to
remove any debris and sediment in the bottles. Care was taken to shake each sample before filtering.
Samples were measured for turbidity using a Hach 2000P IS Turbidimeter. Samples were then tested for
nitrogen and phosphate concentrations using Hach DR.820 Portable Colorimeter according to testing
directions.
5 RESULTS
5.1 Land cover
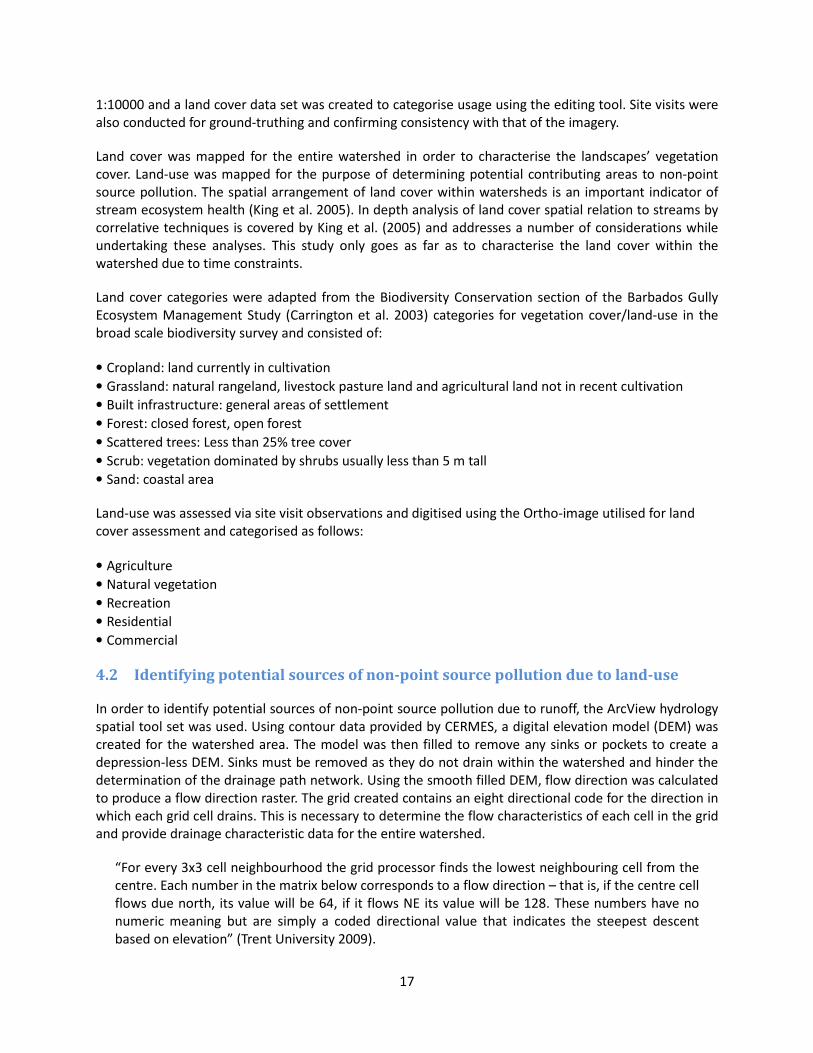
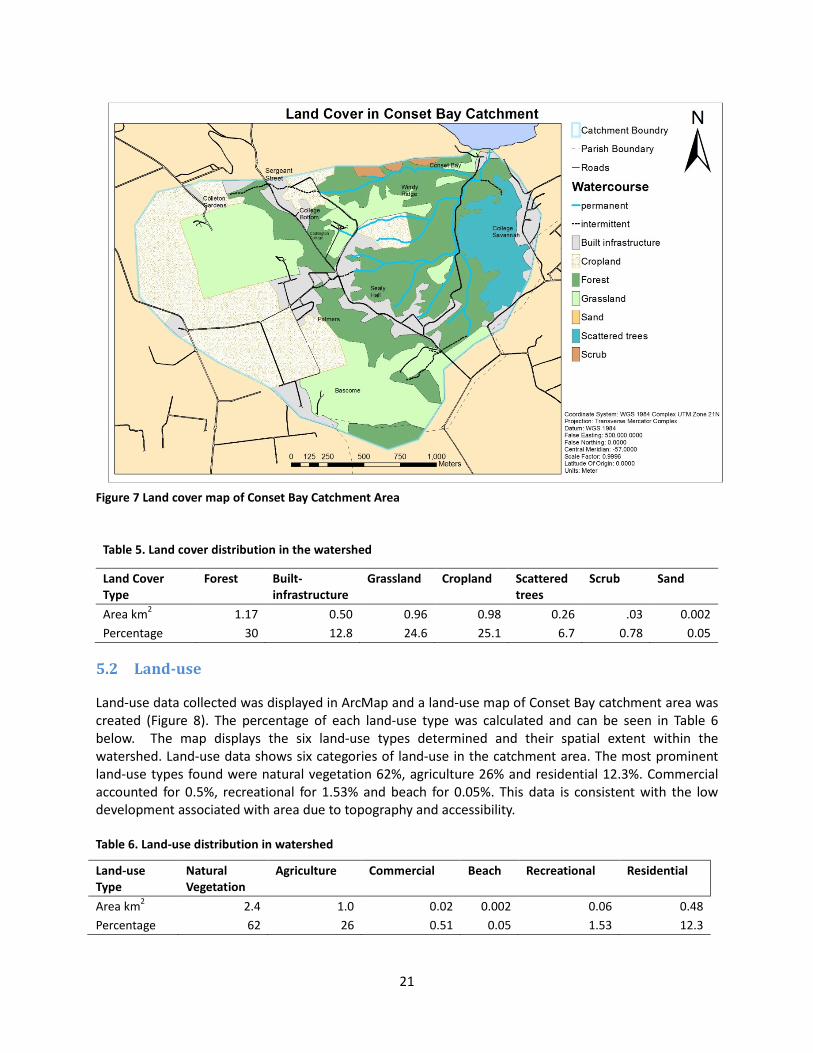
A land cover map was created for the Conset Bay Watershed (Figure 7). The percentage land cover for
each type was calculated and can be seen in Table 5. The map shows the various land covers present in
the catchment and their spatial extent. Data collected for land cover shows seven categories of land
cover throughout the watershed. The major land cover types consisted of Forest which was equivalent to
30%, Grassland 24.6% and Cropland 25.1%. Built infrastructure accounted for 12.8% while Scrub and
Sand accounted for 0.78% and 0.05%, respectively. It is noted that much of the Grassland present may
have also served as small scale Cropland prior to the survey.
21
Figure 7 Land cover map of Conset Bay Catchment Area
Table 5. Land cover distribution in the watershed
Land Cover
Type
Forest Built-
infrastructure
Grassland Cropland Scattered
trees
Scrub Sand
Area km2 1.17 0.50 0.96 0.98 0.26 .03 0.002
Percentage 30 12.8 24.6 25.1 6.7 0.78 0.05
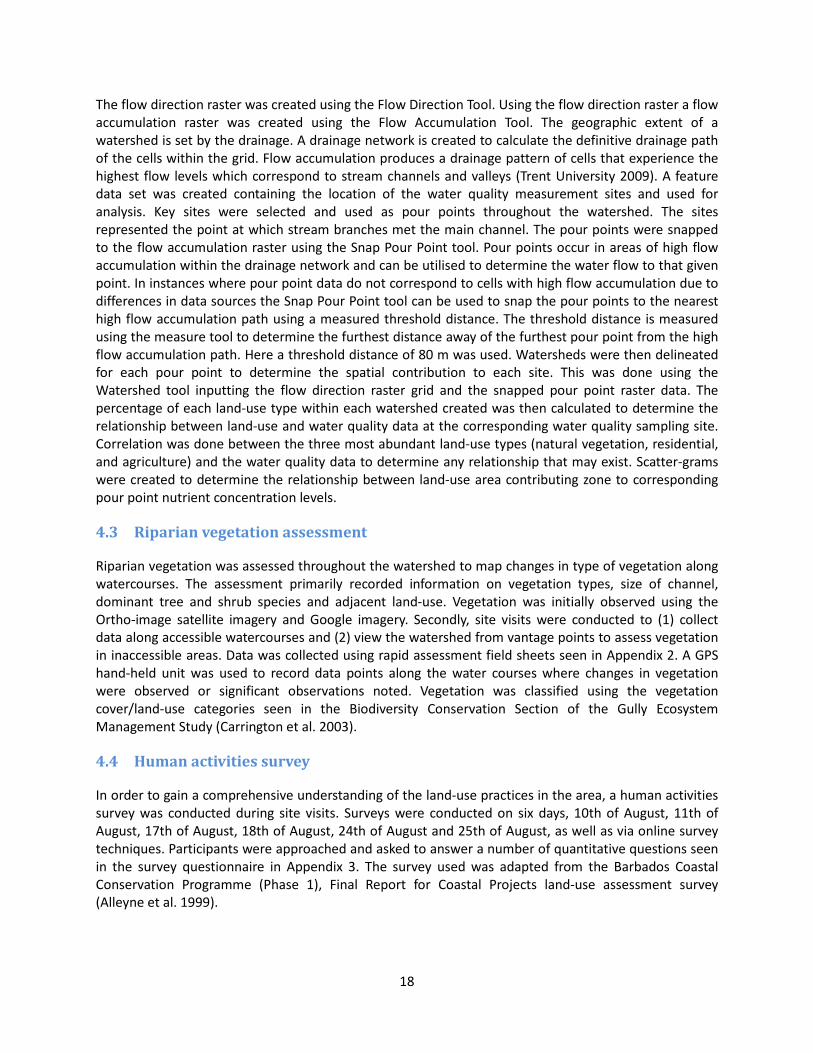
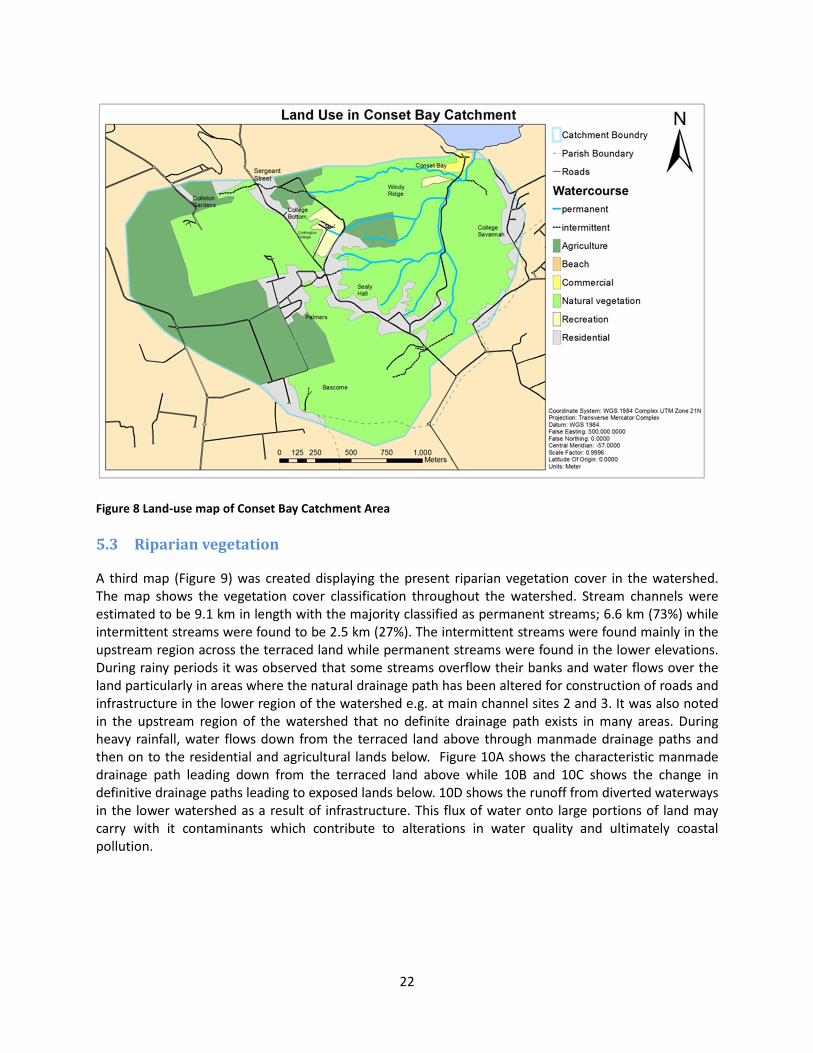
5.2 Land-use
Land-use data collected was displayed in ArcMap and a land-use map of Conset Bay catchment area was
created (Figure 8). The percentage of each land-use type was calculated and can be seen in Table 6
below. The map displays the six land-use types determined and their spatial extent within the
watershed. Land-use data shows six categories of land-use in the catchment area. The most prominent
land-use types found were natural vegetation 62%, agriculture 26% and residential 12.3%. Commercial
accounted for 0.5%, recreational for 1.53% and beach for 0.05%. This data is consistent with the low
development associated with area due to topography and accessibility.
Table 6. Land-use distribution in watershed
Land-use
Type
Natural
Vegetation
Agriculture Commercial Beach Recreational Residential
Area km2 2.4 1.0 0.02 0.002 0.06 0.48
Percentage 62 26 0.51 0.05 1.53 12.3
22
Figure 8 Land-use map of Conset Bay Catchment Area
5.3 Riparian vegetation
A third map (Figure 9) was created displaying the present riparian vegetation cover in the watershed.
The map shows the vegetation cover classification throughout the watershed. Stream channels were
estimated to be 9.1 km in length with the majority classified as permanent streams; 6.6 km (73%) while
intermittent streams were found to be 2.5 km (27%). The intermittent streams were found mainly in the
upstream region across the terraced land while permanent streams were found in the lower elevations.
During rainy periods it was observed that some streams overflow their banks and water flows over the
land particularly in areas where the natural drainage path has been altered for construction of roads and
infrastructure in the lower region of the watershed e.g. at main channel sites 2 and 3. It was also noted
in the upstream region of the watershed that no definite drainage path exists in many areas. During
heavy rainfall, water flows down from the terraced land above through manmade drainage paths and
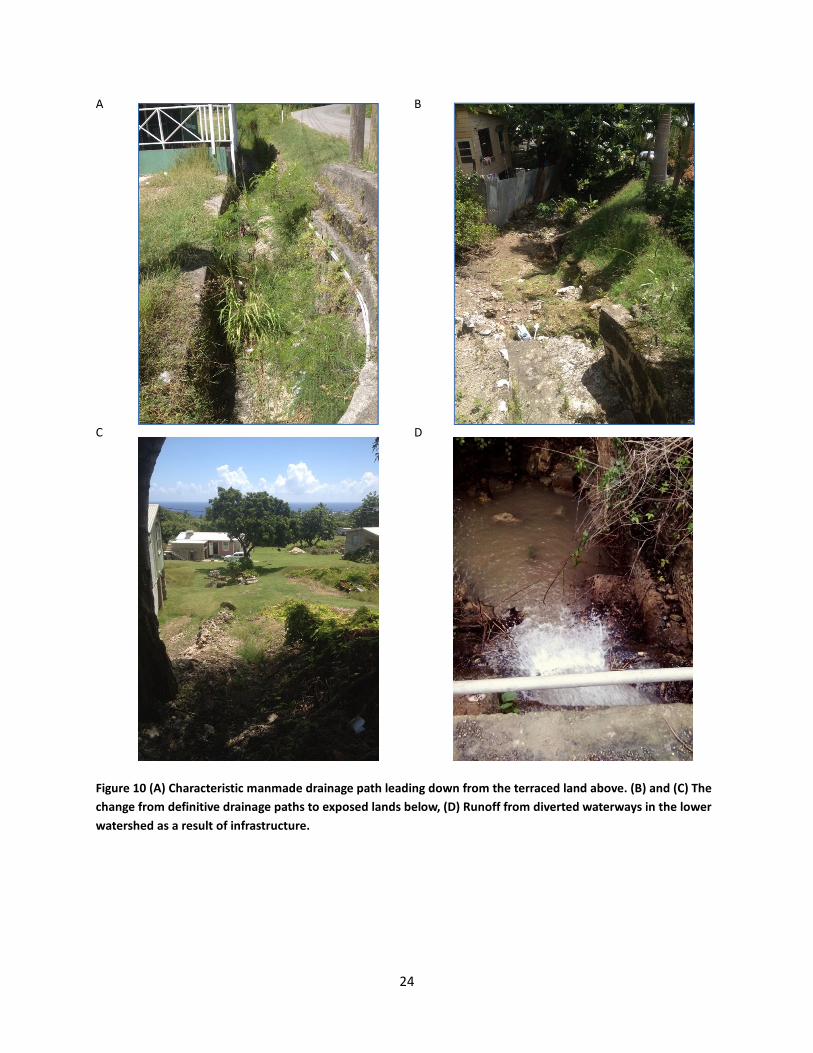
then on to the residential and agricultural lands below. Figure 10A shows the characteristic manmade
drainage path leading down from the terraced land above while 10B and 10C shows the change in
definitive drainage paths leading to exposed lands below. 10D shows the runoff from diverted waterways
in the lower watershed as a result of infrastructure. This flux of water onto large portions of land may
carry with it contaminants which contribute to alterations in water quality and ultimately coastal
pollution.

23
Figure 9 Riparian vegetation spatial distribution in Conset Bay Watershed
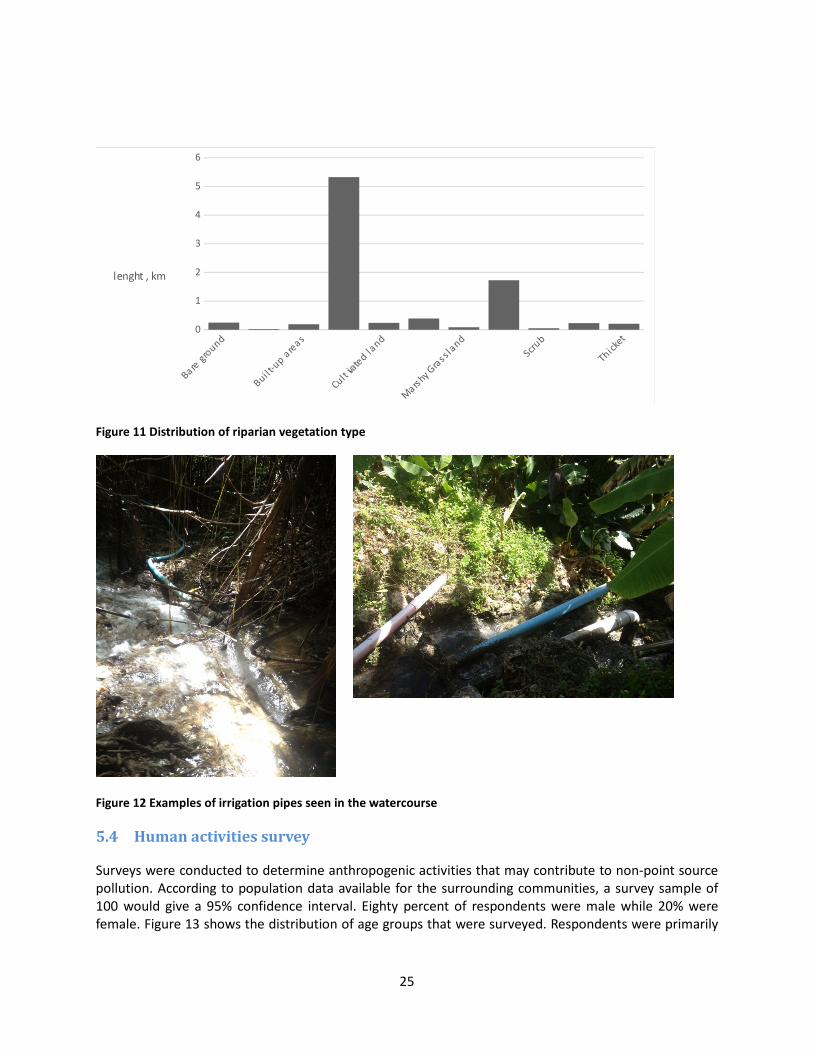
Data collected from the riparian vegetation survey shows the extent, distribution and type of vegetation
within the riparian zone (Figure 11). Eleven types of riparian vegetative cover were found within the
catchment. Riparian vegetation exists throughout the majority of stream network where only 5% flowed
through built-up areas and bare ground. Closed forest was the most common representing, 61% while
open forest made up 20%. Grassland and cultivated land made up 4% and 3%, respectively. Scrub and
marshy grassland made up 1% each. In the lower region of the catchment; MC3 vegetation consisted
primarily of coconut trees and marshy grassland. As the streams go further inland along the MC 2 and
MC1, changes in vegetation are observed where clammy cherry and river tamarind are the dominant
tree type and shrub. As the streams deviate into branches, dominant vegetation also changes. The
dominant shrub appeared to be the white willow while the dominate tree appeared to be almond. At
the head waters of the streams, vegetation became more closely related to adjacent land-use and
human activities. Adjacent lands are cleared for agriculture housing and the extent of riparian buffer is
reduced. Dominant tree vegetation ranges from crop trees such as coconuts and bananas while the
dominant shrub is river tamarind. In these areas it was also noted that water from the streams was
diverted to irrigate adjacent crop lands through pipe fixtures. The pictures seen in Figure 12 show an
example of these irrigation fixtures.
24
A B
C D
Figure 10 (A) Characteristic manmade drainage path leading down from the terraced land above. (B) and (C) The
change from definitive drainage paths to exposed lands below, (D) Runoff from diverted waterways in the lower
watershed as a result of infrastructure.
25
Bare g
round
Bui lt-u
p are
as
Cul tiva
ted la
nd
Mars
hy G
rass la
nd
Scrub
Thicke
t0
1
2
3
4
5
6
lenght , km
Figure 11 Distribution of riparian vegetation type
Figure 12 Examples of irrigation pipes seen in the watercourse
5.4 Human activities survey
Surveys were conducted to determine anthropogenic activities that may contribute to non-point source
pollution. According to population data available for the surrounding communities, a survey sample of
100 would give a 95% confidence interval. Eighty percent of respondents were male while 20% were
female. Figure 13 shows the distribution of age groups that were surveyed. Respondents were primarily

26
in the 40-49 age group (35%) and 50-59 age group (30%). The 21-29 and 30-39 categories each
represented 15% of respondents while 18-20 represented 5%.
Figure 14 shows the location distribution of respondents. The majority (40%) of those surveyed were
from areas other than the surrounding communities of Conset Bay: 30% from College Savannah; 10%
from Sealy Hall and 10% from Conset Bay while St. Marks and Sargeant Street represent 5% each. The
main activities cited by respondents as taking place in Conset Bay (Figure 15) included swimming (20%),
fishing at sea (20%), farming (15%), fishing in rivers for crayfish bait (10%) and kayaking (5%) . Figure 16
shows a small number of respondents utilise the streams directly. The streams are primarily utilised for
irrigation of crops and crayfishing.
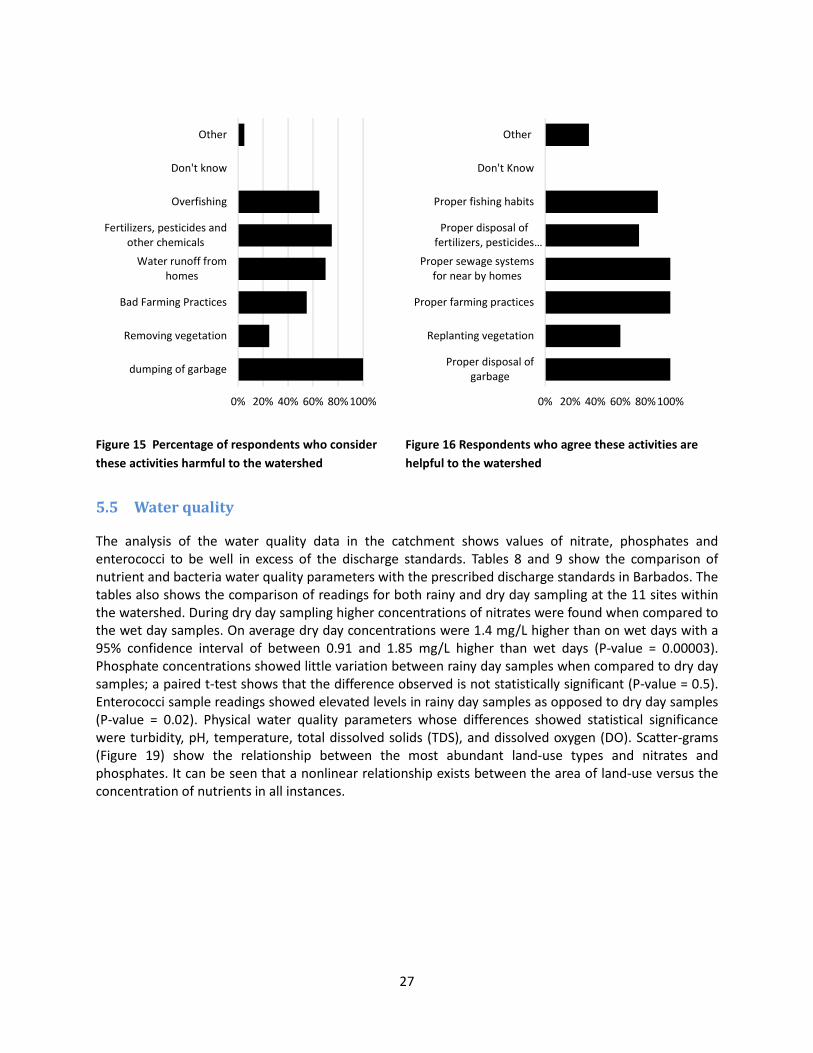
Dumping of garbage was the primary concern of respondents regarding activities that could harm the
watershed (Figure 17). Fertilisers and water runoff from homes also proved to be a concern followed by
overfishing and bad farming practices. Of least concern was the removal of vegetation. Others cited the
establishment of golf courses and resorts as a threat to the watershed. The majority of respondents
agreed with the suggested proposals to help the watershed (Figure 18). Only 60% of respondents agreed
with replanting of vegetation as a helpful activity for the watershed. Other respondents suggested
educational programs and tours to be another alternative while some suggested upgrades to the fishing
complex and fishing facilities.
Figure 11 Age distribution of survey participants Figure 12 Distribution of communities surveyed
Figure 13 Activities within Conset Bay Figure 14 Utilisation of the streams
0%
5%
15%
15%
35%
30%
0%
0% 10% 20% 30% 40%
<17
18-20
21- 29
30-39
40-49
50-59
>60
10%
5%
30%
10%
5%
40%
0% 10% 20% 30% 40% 50%
Conset bay
St Marks
College Savannah
Sealy Hall
Sargeant Street
Other
020%
5%20%
10%0%
15%0%
boating
kayaking
fishing in rivers
farming
other
0% 5% 10% 15% 20% 25%
10%
15%
0%
0%
0%
0% 5% 10% 15% 20%
Irrigation
fishing
drinking
household use
other
27
Figure 15 Percentage of respondents who consider
these activities harmful to the watershed
Figure 16 Respondents who agree these activities are
helpful to the watershed
5.5 Water quality
The analysis of the water quality data in the catchment shows values of nitrate, phosphates and
enterococci to be well in excess of the discharge standards. Tables 8 and 9 show the comparison of
nutrient and bacteria water quality parameters with the prescribed discharge standards in Barbados. The
tables also shows the comparison of readings for both rainy and dry day sampling at the 11 sites within
the watershed. During dry day sampling higher concentrations of nitrates were found when compared to
the wet day samples. On average dry day concentrations were 1.4 mg/L higher than on wet days with a
95% confidence interval of between 0.91 and 1.85 mg/L higher than wet days (P-value = 0.00003).
Phosphate concentrations showed little variation between rainy day samples when compared to dry day
samples; a paired t-test shows that the difference observed is not statistically significant (P-value = 0.5).
Enterococci sample readings showed elevated levels in rainy day samples as opposed to dry day samples
(P-value = 0.02). Physical water quality parameters whose differences showed statistical significance
were turbidity, pH, temperature, total dissolved solids (TDS), and dissolved oxygen (DO). Scatter-grams
(Figure 19) show the relationship between the most abundant land-use types and nitrates and
phosphates. It can be seen that a nonlinear relationship exists between the area of land-use versus the
concentration of nutrients in all instances.
0% 20% 40% 60% 80%100%
dumping of garbage
Removing vegetation
Bad Farming Practices
Water runoff from
homes
Fertilizers, pesticides and
other chemicals
Overfishing
Don't know
Other
0% 20% 40% 60% 80%100%
Proper disposal of
garbage
Replanting vegetation
Proper farming practices
Proper sewage systems
for near by homes
Proper disposal of
fertilizers, pesticides…
Proper fishing habits
Don't Know
Other
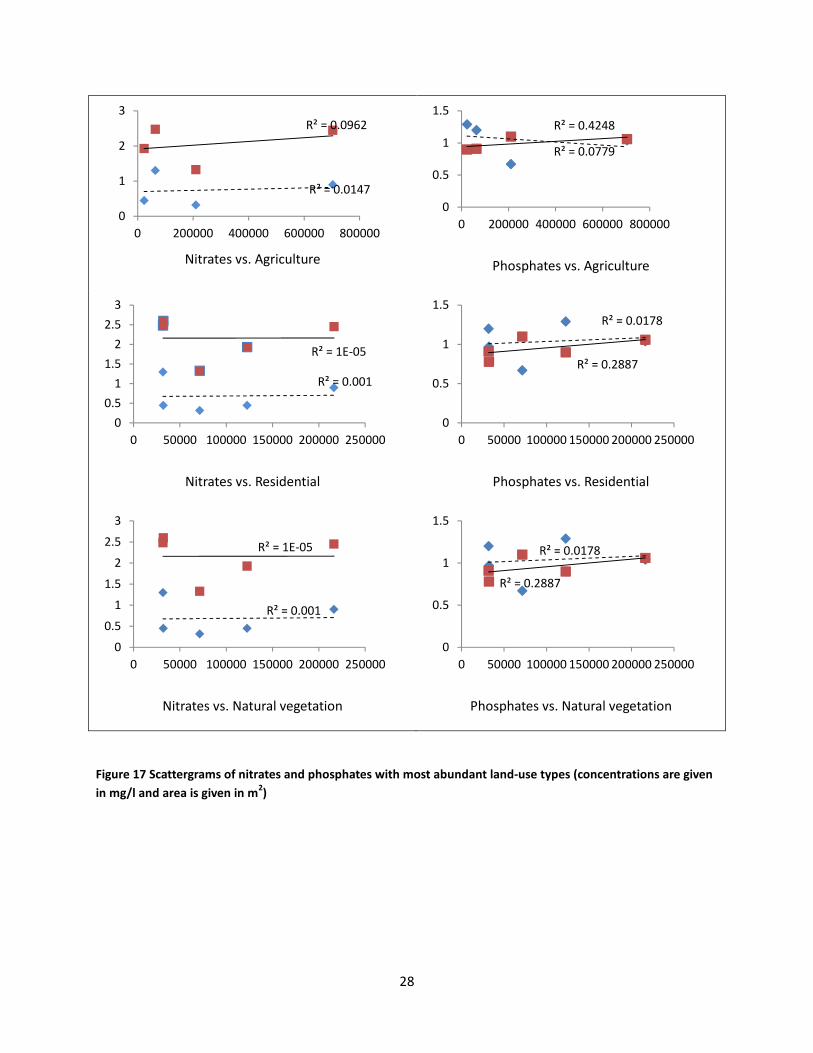
28
Nitrates vs. Agriculture
Phosphates vs. Agriculture
Nitrates vs. Residential
Phosphates vs. Residential
Nitrates vs. Natural vegetation
Phosphates vs. Natural vegetation
Figure 17 Scattergrams of nitrates and phosphates with most abundant land-use types (concentrations are given
in mg/l and area is given in m2)
R² = 0.0962
R² = 0.0147
0
1
2
3
0 200000 400000 600000 800000
R² = 0.0779
R² = 0.4248
0
0.5
1
1.5
0 200000 400000 600000 800000
R² = 1E-05
R² = 0.001
0
0.5
1
1.5
2
2.5
3
0 50000 100000 150000 200000 250000
R² = 0.0178
R² = 0.2887
0
0.5
1
1.5
0 50000 100000 150000 200000 250000
R² = 0.001
R² = 1E-05
0
0.5
1
1.5
2
2.5
3
0 50000 100000 150000 200000 250000
R² = 0.0178
R² = 0.2887
0
0.5
1
1.5
0 50000 100000 150000 200000 250000
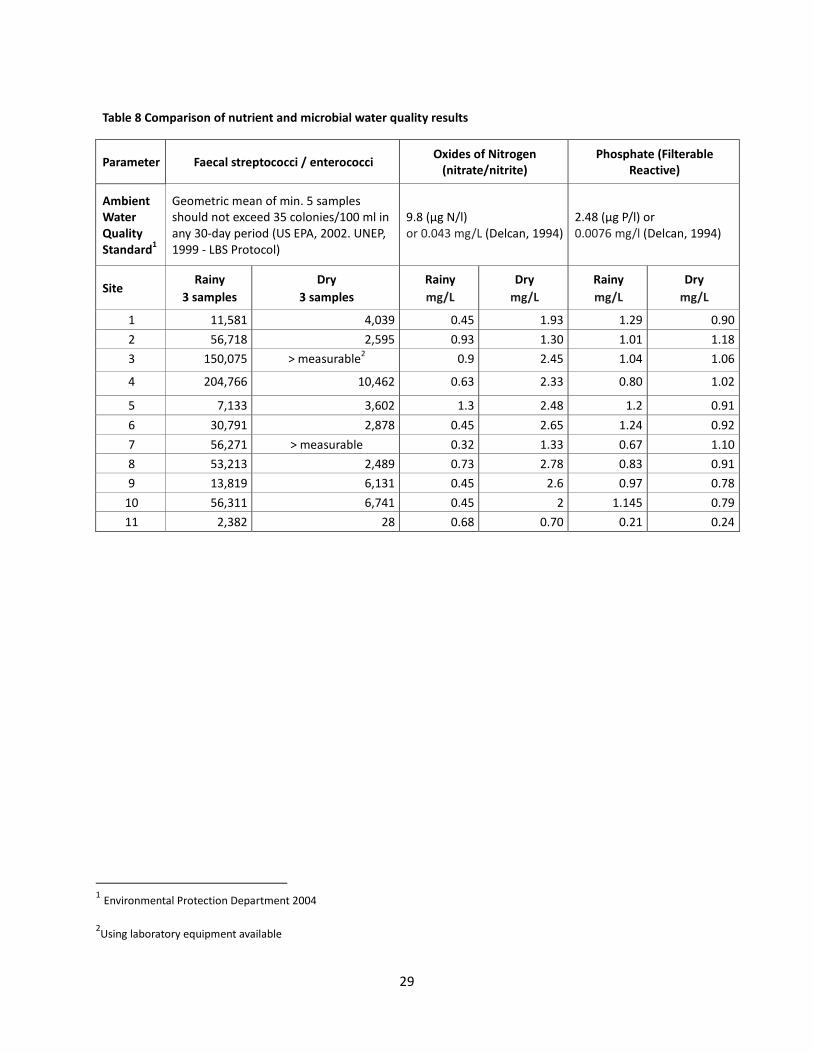
29
Table 8 Comparison of nutrient and microbial water quality results
Parameter Faecal streptococci / enterococci Oxides of Nitrogen
(nitrate/nitrite)
Phosphate (Filterable
Reactive)
Ambient
Water
Quality
Standard1
Geometric mean of min. 5 samples
should not exceed 35 colonies/100 ml in
any 30-day period (US EPA, 2002. UNEP,
1999 - LBS Protocol)
9.8 (µg N/l)
or 0.043 mg/L (Delcan, 1994)
2.48 (µg P/l) or
0.0076 mg/l (Delcan, 1994)
Site Rainy
3 samples
Dry
3 samples
Rainy
mg/L
Dry
mg/L
Rainy
mg/L
Dry
mg/L
1 11,581 4,039 0.45 1.93 1.29 0.90
2 56,718 2,595 0.93 1.30 1.01 1.18
3 150,075 > measurable2 0.9 2.45 1.04 1.06
4 204,766 10,462 0.63 2.33 0.80 1.02
5 7,133 3,602 1.3 2.48 1.2 0.91
6 30,791 2,878 0.45 2.65 1.24 0.92
7 56,271 > measurable 0.32 1.33 0.67 1.10
8 53,213 2,489 0.73 2.78 0.83 0.91
9 13,819 6,131 0.45 2.6 0.97 0.78
10 56,311 6,741 0.45 2 1.145 0.79
11 2,382 28 0.68 0.70 0.21 0.24
1 Environmental Protection Department 2004
2Using laboratory equipment available
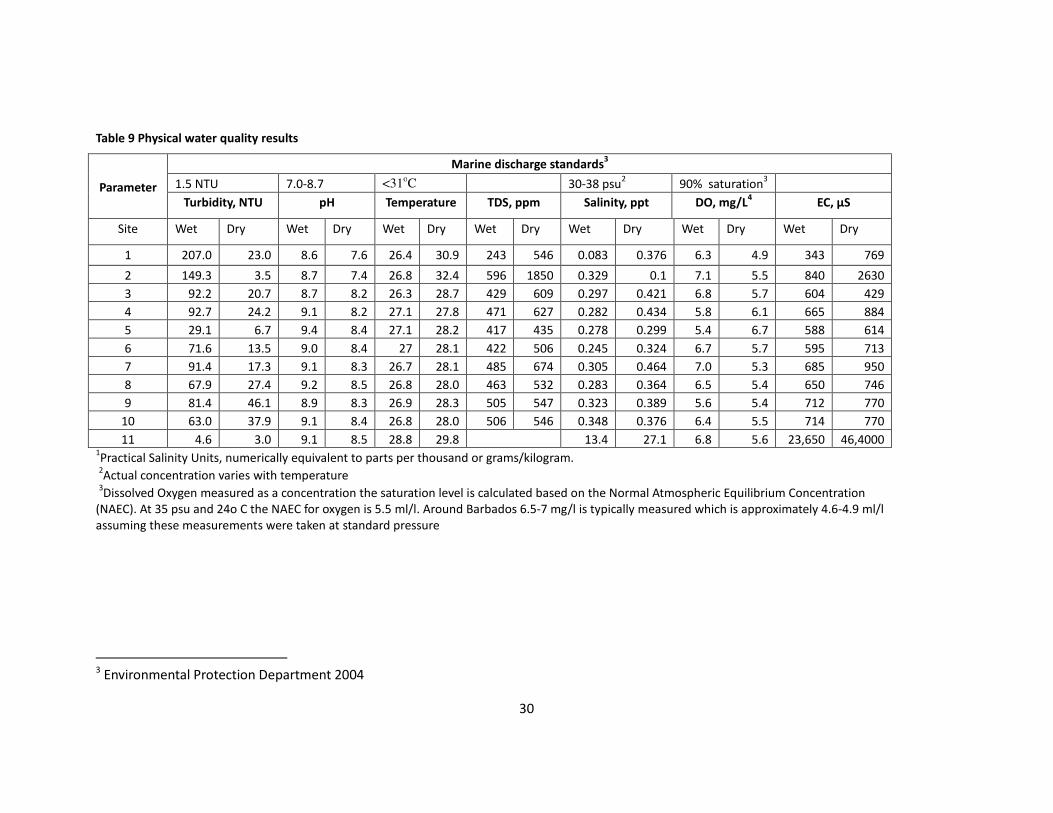
30
Table 9 Physical water quality results
Parameter
Marine discharge standards3
1.5 NTU 7.0-8.7 <31oC 30-38 psu
2 90% saturation
3
Turbidity, NTU pH Temperature TDS, ppm Salinity, ppt DO, mg/L4 EC, µS
Site Wet Dry Wet Dry Wet Dry Wet Dry Wet Dry Wet Dry Wet Dry
1 207.0 23.0 8.6 7.6 26.4 30.9 243 546 0.083 0.376 6.3 4.9 343 769
2 149.3 3.5 8.7 7.4 26.8 32.4 596 1850 0.329 0.1 7.1 5.5 840 2630
3 92.2 20.7 8.7 8.2 26.3 28.7 429 609 0.297 0.421 6.8 5.7 604 429
4 92.7 24.2 9.1 8.2 27.1 27.8 471 627 0.282 0.434 5.8 6.1 665 884
5 29.1 6.7 9.4 8.4 27.1 28.2 417 435 0.278 0.299 5.4 6.7 588 614
6 71.6 13.5 9.0 8.4 27 28.1 422 506 0.245 0.324 6.7 5.7 595 713
7 91.4 17.3 9.1 8.3 26.7 28.1 485 674 0.305 0.464 7.0 5.3 685 950
8 67.9 27.4 9.2 8.5 26.8 28.0 463 532 0.283 0.364 6.5 5.4 650 746
9 81.4 46.1 8.9 8.3 26.9 28.3 505 547 0.323 0.389 5.6 5.4 712 770
10 63.0 37.9 9.1 8.4 26.8 28.0 506 546 0.348 0.376 6.4 5.5 714 770
11 4.6 3.0 9.1 8.5 28.8 29.8 13.4 27.1 6.8 5.6 23,650 46,4000 1Practical Salinity Units, numerically equivalent to parts per thousand or grams/kilogram.
2Actual concentration varies with temperature
3Dissolved Oxygen measured as a concentration the saturation level is calculated based on the Normal Atmospheric Equilibrium Concentration
(NAEC). At 35 psu and 24o C the NAEC for oxygen is 5.5 ml/l. Around Barbados 6.5-7 mg/l is typically measured which is approximately 4.6-4.9 ml/l
assuming these measurements were taken at standard pressure
3 Environmental Protection Department 2004
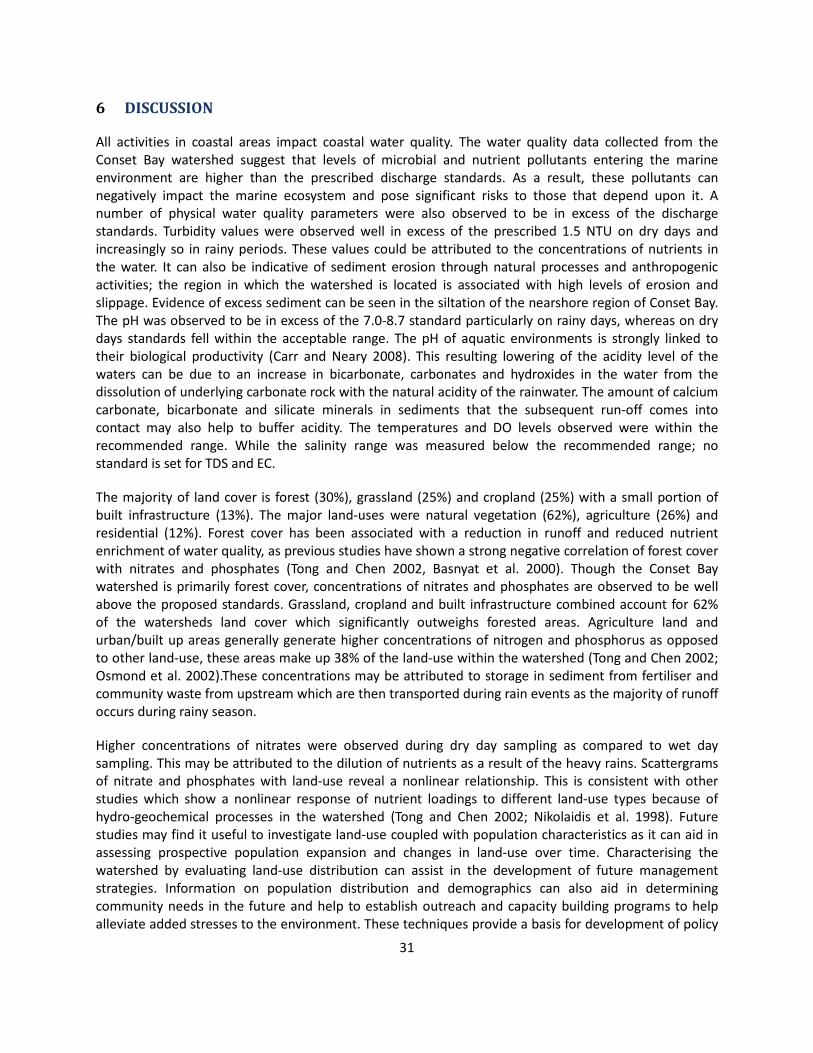
31
6 DISCUSSION
All activities in coastal areas impact coastal water quality. The water quality data collected from the
Conset Bay watershed suggest that levels of microbial and nutrient pollutants entering the marine
environment are higher than the prescribed discharge standards. As a result, these pollutants can
negatively impact the marine ecosystem and pose significant risks to those that depend upon it. A
number of physical water quality parameters were also observed to be in excess of the discharge
standards. Turbidity values were observed well in excess of the prescribed 1.5 NTU on dry days and
increasingly so in rainy periods. These values could be attributed to the concentrations of nutrients in
the water. It can also be indicative of sediment erosion through natural processes and anthropogenic
activities; the region in which the watershed is located is associated with high levels of erosion and
slippage. Evidence of excess sediment can be seen in the siltation of the nearshore region of Conset Bay.
The pH was observed to be in excess of the 7.0-8.7 standard particularly on rainy days, whereas on dry
days standards fell within the acceptable range. The pH of aquatic environments is strongly linked to
their biological productivity (Carr and Neary 2008). This resulting lowering of the acidity level of the
waters can be due to an increase in bicarbonate, carbonates and hydroxides in the water from the
dissolution of underlying carbonate rock with the natural acidity of the rainwater. The amount of calcium
carbonate, bicarbonate and silicate minerals in sediments that the subsequent run-off comes into
contact may also help to buffer acidity. The temperatures and DO levels observed were within the
recommended range. While the salinity range was measured below the recommended range; no
standard is set for TDS and EC.
The majority of land cover is forest (30%), grassland (25%) and cropland (25%) with a small portion of
built infrastructure (13%). The major land-uses were natural vegetation (62%), agriculture (26%) and
residential (12%). Forest cover has been associated with a reduction in runoff and reduced nutrient
enrichment of water quality, as previous studies have shown a strong negative correlation of forest cover
with nitrates and phosphates (Tong and Chen 2002, Basnyat et al. 2000). Though the Conset Bay
watershed is primarily forest cover, concentrations of nitrates and phosphates are observed to be well
above the proposed standards. Grassland, cropland and built infrastructure combined account for 62%
of the watersheds land cover which significantly outweighs forested areas. Agriculture land and
urban/built up areas generally generate higher concentrations of nitrogen and phosphorus as opposed
to other land-use, these areas make up 38% of the land-use within the watershed (Tong and Chen 2002;
Osmond et al. 2002).These concentrations may be attributed to storage in sediment from fertiliser and
community waste from upstream which are then transported during rain events as the majority of runoff
occurs during rainy season.
Higher concentrations of nitrates were observed during dry day sampling as compared to wet day
sampling. This may be attributed to the dilution of nutrients as a result of the heavy rains. Scattergrams
of nitrate and phosphates with land-use reveal a nonlinear relationship. This is consistent with other
studies which show a nonlinear response of nutrient loadings to different land-use types because of
hydro-geochemical processes in the watershed (Tong and Chen 2002; Nikolaidis et al. 1998). Future
studies may find it useful to investigate land-use coupled with population characteristics as it can aid in
assessing prospective population expansion and changes in land-use over time. Characterising the
watershed by evaluating land-use distribution can assist in the development of future management
strategies. Information on population distribution and demographics can also aid in determining
community needs in the future and help to establish outreach and capacity building programs to help
alleviate added stresses to the environment. These techniques provide a basis for development of policy
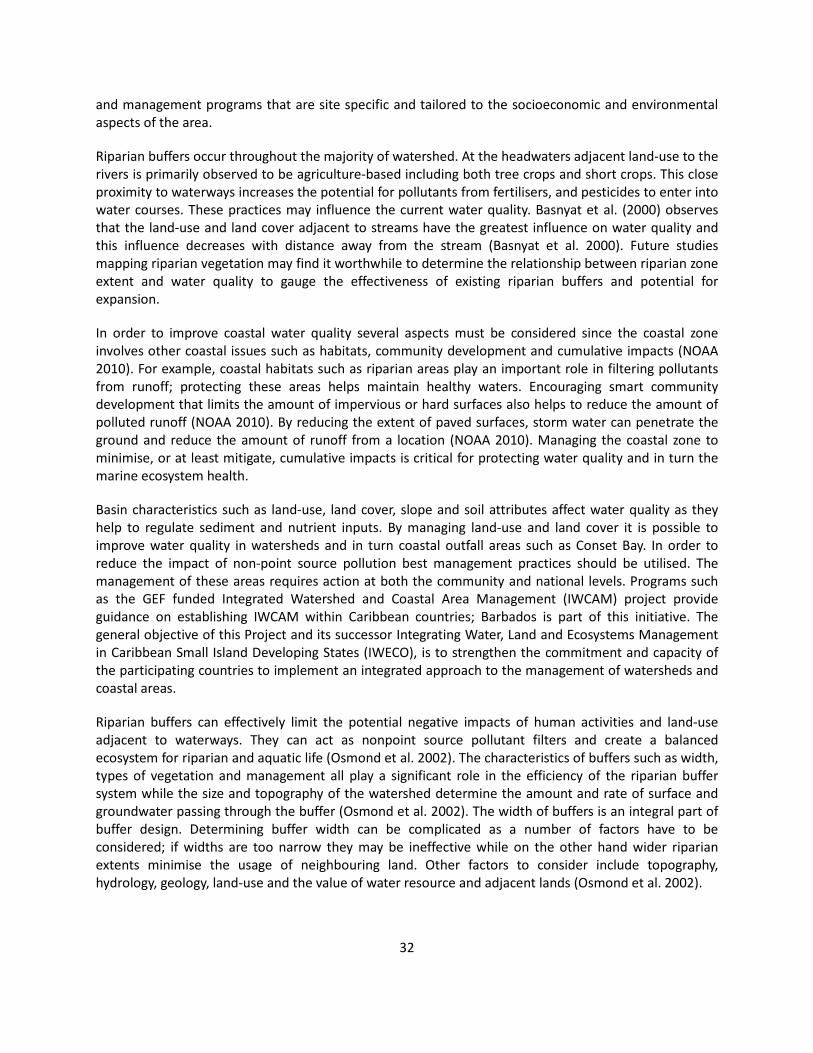
32
and management programs that are site specific and tailored to the socioeconomic and environmental
aspects of the area.
Riparian buffers occur throughout the majority of watershed. At the headwaters adjacent land-use to the
rivers is primarily observed to be agriculture-based including both tree crops and short crops. This close
proximity to waterways increases the potential for pollutants from fertilisers, and pesticides to enter into
water courses. These practices may influence the current water quality. Basnyat et al. (2000) observes
that the land-use and land cover adjacent to streams have the greatest influence on water quality and
this influence decreases with distance away from the stream (Basnyat et al. 2000). Future studies
mapping riparian vegetation may find it worthwhile to determine the relationship between riparian zone
extent and water quality to gauge the effectiveness of existing riparian buffers and potential for
expansion.
In order to improve coastal water quality several aspects must be considered since the coastal zone
involves other coastal issues such as habitats, community development and cumulative impacts (NOAA
2010). For example, coastal habitats such as riparian areas play an important role in filtering pollutants
from runoff; protecting these areas helps maintain healthy waters. Encouraging smart community
development that limits the amount of impervious or hard surfaces also helps to reduce the amount of
polluted runoff (NOAA 2010). By reducing the extent of paved surfaces, storm water can penetrate the
ground and reduce the amount of runoff from a location (NOAA 2010). Managing the coastal zone to
minimise, or at least mitigate, cumulative impacts is critical for protecting water quality and in turn the
marine ecosystem health.
Basin characteristics such as land-use, land cover, slope and soil attributes affect water quality as they
help to regulate sediment and nutrient inputs. By managing land-use and land cover it is possible to
improve water quality in watersheds and in turn coastal outfall areas such as Conset Bay. In order to
reduce the impact of non-point source pollution best management practices should be utilised. The
management of these areas requires action at both the community and national levels. Programs such
as the GEF funded Integrated Watershed and Coastal Area Management (IWCAM) project provide
guidance on establishing IWCAM within Caribbean countries; Barbados is part of this initiative. The
general objective of this Project and its successor Integrating Water, Land and Ecosystems Management
in Caribbean Small Island Developing States (IWECO), is to strengthen the commitment and capacity of
the participating countries to implement an integrated approach to the management of watersheds and
coastal areas.
Riparian buffers can effectively limit the potential negative impacts of human activities and land-use
adjacent to waterways. They can act as nonpoint source pollutant filters and create a balanced
ecosystem for riparian and aquatic life (Osmond et al. 2002). The characteristics of buffers such as width,
types of vegetation and management all play a significant role in the efficiency of the riparian buffer
system while the size and topography of the watershed determine the amount and rate of surface and
groundwater passing through the buffer (Osmond et al. 2002). The width of buffers is an integral part of
buffer design. Determining buffer width can be complicated as a number of factors have to be
considered; if widths are too narrow they may be ineffective while on the other hand wider riparian
extents minimise the usage of neighbouring land. Other factors to consider include topography,
hydrology, geology, land-use and the value of water resource and adjacent lands (Osmond et al. 2002).
33
In riparian buffers, grass and forested sections help to reduce water velocity allowing sediment to settle
out of the surface runoff. The grassed portion of the buffer functions as a grass vegetated filter strip
(Osmond et al. 2002). Phosphates are in turn removed as they are closely associated with the sediment
entrained in runoff. Riparian buffers also help to reduce nitrate concentrations. Though is important to
note that not all buffers are effective for nitrate removal and this is primarily dependant on the
prevailing hydrology of the area (Osmond et al. 2002).The ideal criteria for nitrate removal by a riparian
buffer system suggest that “an aquatard is present at relatively shallow depth (>5 m in upper part of
field; <1.5 m in riparian area)” (Osmond et al. 2002). Before the soil water reaches the waterways the
water must pass through an area allowing for roots to take up nitrates as well as provide sources of
carbon for denitrifying bacteria to act (Osmond et al. 2002). The most ineffective condition for nitrate
removal occurs when all of the groundwater passing through the riparian zone has very little or no
interaction with the roots of vegetation (Osmond et al. 2002).
7 CONCLUSION
This study demonstrates the value of a quantitative spatial approach to watershed assessment. It shows
the major land covers to be primarily forest (30%), grassland (24.6%) and cropland (25.1%) with a small
portion of built infrastructure (12.8%); while the major land-uses were natural vegetation (62%),
agriculture (26%) and residential (12.3%).Water quality values for nitrates and phosphates together with
enterococci within the watershed were found to greatly exceed the proposed standards for Barbados
and this can have serious impacts on the marine ecosystem and the health of humans that depend upon
it. By managing land-use and land cover it is possible to improve water quality in watersheds and in turn
coastal outfall areas such as Conset Bay. In order to reduce the impact of non-point source pollution best
management practices should be utilised such as reafforestation to establish an effective system of
riparian buffers. Integrated water and coastal area management can help to better manage the
interactions and impacts terrestrial activity has on the marine and coastal environment. By developing
policies and community-based management strategies to monitor water quality together with
implementing mechanisms to control unrestricted development, land-based sources of pollution can be
controlled and mitigated.
8 REFERENCES
Alleyne , Y., K. Atherley, R. Mahon, S.S. Carter, J. Cumberbatch, A. Fields, C. Parris, I. Boyce, C. Forde, J.E.
Riley, C.A. Jordan and J. Small. 1999. Government of Barbados, Barbados Coastal Conservation
Programme (Phase 1) Demonstration Projects. Coastal Watershed Management. Technical
appendix: Surveys, issues and action plan for the Long Pond Watershed. Coastal Management
Unit, Barbados 65 pp.
Arriola, S.G. 2008. Implementation of a spatial decision support system for water quality protection and
management in the Holetown Watershed, Barbados: A case for the establishment of a NSDI for
environmental management, McGill University.
Basnyat, P., L.D.Teeter, K.M. Flynn and B.G. Lockaby. 1999. Relationships Between Landscape
Characteristics and Nonpoint Source Pollution Inputs to Coastal Estuaries. Environmental
Management 23 (4): 539-549.
Basnyat, P., L.D. Teeter, B.G. Lockaby and K.M.Flynn. 2000. The use of remote sensing and GIS in
watershed level analyses of non-point source pollution problems. Forest Ecology and
Management 128 (1): 65-73.
34
Bosch, J. M., and J.D. Hewlett. 1982. A review of catchment experiments to determine the effect of
vegetation changes on water yield and evapotranspiration. Journal of Hydrology 55 (1): 3-23.
Bruijnzeel, L. A. 2004. Hydrological functions of tropical forests: not seeing the soil for the trees?
Agriculture, Ecosystems & Environment 104 (1): 185-228.
Burke, L. and J. Maidens. 2003. Reefs at risk in the Caribbean. Washington, DC: World Resources
Institute.
Calder, I.R. 2000. Land use impacts on water resources. Background paper 1. FAO Electronic Workshop
on Land-Water Linkages in Rural Watersheds. 18 September – 27 October 2000.
http://www.fao.org/ag/agl/watershed/
Caribbean Environmental Health Institute. 2008. Road Map Towards Integrated Water Resources
Management Planning for Barbados. Government of Barbados. November 200. 117pp.
Carr, G. M., and J.P. Neary. 2008. Water quality for ecosystem and human health. United Nations
Environment Programme Global Environment Monitoring System/ Water Programme.
Carrington, C. M. S., J. Horrocks and R. Mahon. 2003. Report on the biodoverity subcomponent. In Gully
Ecosystem Management Study. The Government of Barbados, Ministry of Physical Development
and the Environment
CERMES (Centre for Resource Management and Environmental Studies). 2012. Stakeholder engagement
plan. In Up-Scalling sustainable resource management in coastal watershed communities of
Barbados's National Park and System of Open Spaces: Conset Bay Pilot Project. CERMES for
Government of Barbados and UNEP.
Cumberbatch, J. and B. Simmons. 2010. Report of a sustainable fishing roundtable. Conset Bay,
Barbados: Prepared for Ministry of Environment, Water Resources and Drainage.
Di Gregorio, A. and L.J.M. Jansen. 2000. Land cover classification system: LCCS: classification concepts
and user manual: Food and Agriculture Organization of the United Nations Rome.
Dosskey, M. G, P.Vidon, N. P. Gurwick, C. J. Allan, T.P. Duval, and R. Lowrance. 2010. The role of riparian
vegetation in protecting and improving chemical water quality in streams. JAWRA Journal of the
American Water Resources Association 46 (2): 261-277.
Environmental Protection Agency. 1994. Polluted ed. Office of Water. Washington DC, United States.
Environmental Protection Agency. 1998. Estuaries and Your Coastal Watershed. Office of Water.
Washington DC, United States.
Environmental Protection Department. 2011. Water Quality Managment. http://www.epd.gov.bb
(accessed 7th December, 2013)
Environmental Protection Department. 2004. Draft marine pollution control standards: list of prohibited
concentrations, Barbados, 16pp.
EPG, PDA, and SEMS. 2004a. Gully Ecosystem Management Study. Storm water management and
groundwater augmentation. The Government of Barbados, Ministry of Housing, Lands and
Environment
EPG, PDA, and SEMS. 2004b. Gully Ecosystem Management Study: Report on the board-scale survey and
development of the GIS database.: The Government of Barbados, Ministry of Housing, Lands and
The Environment.
European Communities. 2001. Manual of concepts on land cover and land-use information systems
edited by Office for Official Publications of the European Communities. Luxembourg: European
Commission
Fohrer, N, S. Haverkamp, K. Eckhardt, and H-G Frede. 2001. Hydrologic response to land-use changes on
the catchment scale. Physics and Chemistry of the Earth, Part B: Hydrology, Oceans and
Atmosphere 26 (7): 577-582.
35
Foley, J. A., R. DeFries, G. P. Asner, C. Barford, G.Bonan, S. R. Carpenter, F. S. Chapin, M.T. Coe, G. C. Daily,
and H. K. Gibbs. 2005. Global consequences of land-use. Science, 309 (5734): 570-574.
Government of Barbados. 2003. Physical Development Plan (Amended 2003). Prepared for Town and
Country Development Planning Office
Hatfield, J. L., and J. H. Prueger. 2011. Spatial and temporal variation in evapotranspiration. Edited by
Giacomo Gerosa, Evapotranspiration- From Measurements to Agricultural and Environmental
Applications: InTech.
Helmer, E., T. Kennaway, D. Pedreros, M. Clark, H. Marcano, L. Tieszen, T. Ruzycki, S. Schill and S.
Carrington. 2008. Distribution of land cover and forest formations for St. Kitts, Nevis, St.
Eustatius, Grenada and Barbados from satellite imagery. Caribbean Journal of Science 44(2):
175:198.
James, C.S., and A. Barnes. 2011. Hydro-ecological relationships and thresholds to inform environmental
flow management. In Appendix 1: Riparian vegetation-flow relationships and responses to flow
regime alteration: a review of evidence from south-east Queensland streams Austraila
International WaterCentre.
Kiersch, B. 2001. Land-use Impacts On Water Resources: A Literature Review. In Discussion Paper No.1.
Land-water linkages in rural watersheds. Electronic Workshop. Rome, Italy: Food and Agriculture
Organization of the United Nations.
King, R. S., M. E. Baker, D. F. Whigham, D. E. Weller, T. E. Jordan, P. F. Kazyak, and M. K. Hurd. 2005.
Spatial considerations for linking watershed land cover to ecological indicators in streams.
Ecological Applications 15 (1):137-153.
Klemas, V. V. 2001. Remote sensing of landscape-level coastal environmental indicators. Environmental
Management 27 (1):47-57.
Lawton, R.O., U. S. Nair, R.A. Pielke Sr, and R. M. Welch. 2001. Climatic impact of tropical lowland
deforestation on nearby montane cloud forests. Science 294 (5542): 584-587.
LeBlanc, R. T., R. D. Brown, and J. E. FitzGibbon. 1997. Modeling the effects of land-use change on the
water temperature in unregulated urban streams. Journal of Environmental Management 49 (4):
445-469.
Leitch, C., and J. Harbor. Impacts of land use change on freshwater runoff into the near-coastal zone,
Holetown Watershed, Barbados: Comparisons of long-term to single-storm effects. Journal of
soil and water conservation 54, no. 3 (1999): 584-592.
Lowrance, R., R. Leonard, and J. Sheridan. 1985. Managing riparian ecosystems to control nonpoint
pollution. Journal of soil and water conservation 40 (1): 87-91.
Maillard, P., and N. A. Pinheiro Santos. 2008. A spatial-statistical approach for modeling the effect of non-
point source pollution on different water quality parameters in the Velhas river watershed–
Brazil. Journal of Environmental Management 86 (1): 158-170.
Martin, J.H., G.A. Knauer, D.M. Karl, and W.W. Broenkow. 2001. The influence of watershed land-use on
lake N: P in a predominantly agricultural landscape. Limnol. Oceanogr 46 (4): 970-975.
Millenium Ecosystem Assessment. 2005. Ecosystems and human well-being: Biodiversity synthesis. A
report of the Millennium Ecosystem Assessment, World Resources Institute, Washington DC.
Miloslavich, P., J. M. Díaz, E. Klein, J. J. Alvarado, C. Díaz, J. Gobin, E. Escobar-Briones, J. J.Cruz-Motta, E.
Weil, and J. Cortes. 2010. Marine biodiversity in the Caribbean: Regional estimates and
distribution patterns. PLoS One 5 (8): e11916.
Mucher, C.A., T.J. Stomph, and L.O. Fresco. 1993. Proposal for a global land-use classification FAO. Rome.
Mustard, J. F., and T. R. Fisher. 2004. Land-use and hydrology. In Land Change Science, 257-276. Springer.
Nikolaidis, N.P., H. Heng, R. Semagin, J.C. Clausen. 1998. Non-Linear response of a mixed land use
watershed to nitrogen loading. Agriculture, Ecosystems and Environment no. 67 (2-3):251-265.

36
NOAA, 2010. Coastal Issues: Water Quality. March 15th 2010.
http://coastalmanagement.noaa.gov/water_quality.html (accessed 31 Dec, 2012).
Osmond, D.L., J.W. Gilliam, and R.O. Evans. 2002. Riparian buffers and controlled drainage to reduce
agriculture nonpoint source pollution. In North Carolina Agricultural Research Service Technical
Bulletin 318. Raleigh, NC: North Carlina State University.
Parés-Ramos, I. K., A. F. White, and X. Zou. 2012. Water Quality and Landscape Processes of Four
Watersheds in Eastern Puerto Rico.
Quinlan, G. 2008. Subduction Zones. Class lecture, Plate tectonics from Memorial University of
Newfoundland, St. John’s, Newfoundland.
Selliah, N., K. Blackman, R. Mahon, P. McConney, L. Nurse, M. Alleyne, and S. Cox. 2012. Upscalling
Sustainable Resource Management in Coastal Watershed Communities of Barbados' National
Park and System of Open Spaces. Barbados: Centre for Resource Management and
Environmental Studies for Government of Barbados and United Nations Environment
Programme
Sherman, K., and G. Hempel. 2009. The UNEP Large Marine Ecosystem Report: A perspective of changing
conditions in LME's of the world's Regional Seas. In UNEP Regional Seas Report and Studies No.
182. Nairobi: UNEP.
Smithson, P., K. Addison and K. Atkinson. 2008. Fundamentals of the physical environemt, 4th edition.
Routledge, London.
Soil Conservation Unit. 2010. Geology of Scotland District edited by Ministry of Agriculture. Barbados.
Stonestrom, D. A., B. R. Scanlon, and L. Zhang. 2009. Introduction to special section on impacts of land-
use change on water resources. Water Resources Research 45 (7).
Susswein, P. M., M. van Noordwijk, and B. Verbist. 2001. Forest conversion and watershed functions in
the humid Tropics. In ASB Lecture Note 07: ASB Partnership.
Tang, Z., B.A. Engel, B.C. Pijanowski, and K.J. Lim. 2005. Forecasting land-use change and its
environmental impact at a watershed scale. Journal of Environmental Management 76 (1): 35-
45.
Tong, S. T.Y., and W. Chen. 2002. Modeling the relationship between land-use and surface water quality.
Journal of Environmental Management 66 (4): 377-393.
Trent University. 2009. Delineating stream catchments Maps Data and Government Information Centre
Trent University.
UNEP-CEP. 2001. An Overview of Land Based Sources of Marine Pollution, August 21st 2001 2001 [cited
23rd December 2013]. Available from http://www.cep.unep.org/issues/lbsp.html.
UNEP. 2010. Environmental Outlook of Latin America and Caribbean.
UNEP, UNDP, and IWCAM. 2002. Integrating watershed and coastal area management insmall island
developing states of the caribbean gef project summary.
Yang, X. and L. Zhi. 2005. Using satellite imagery and GIS for land‐use and land‐cover change mapping in
an estuarine watershed. International Journal of Remote Sensing 26 (23): 5275-5296.

37
APPENDIX 1: WATER QUALITY STANDARDS

38
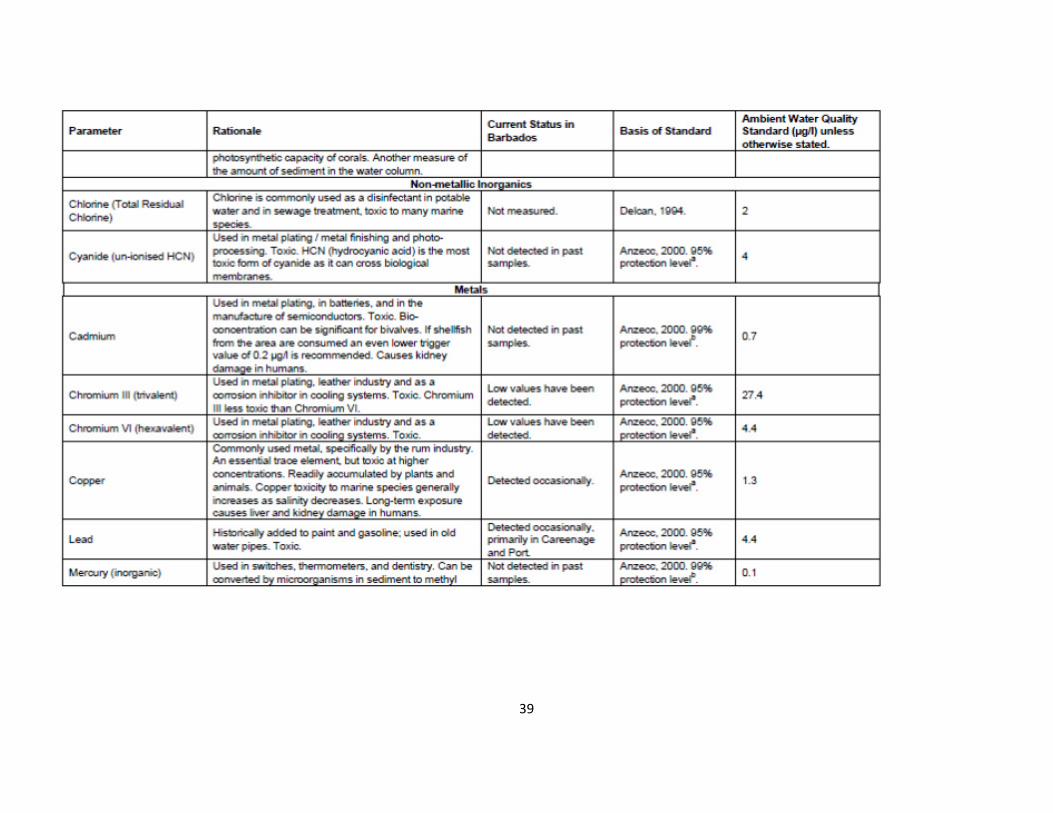
39

40

41
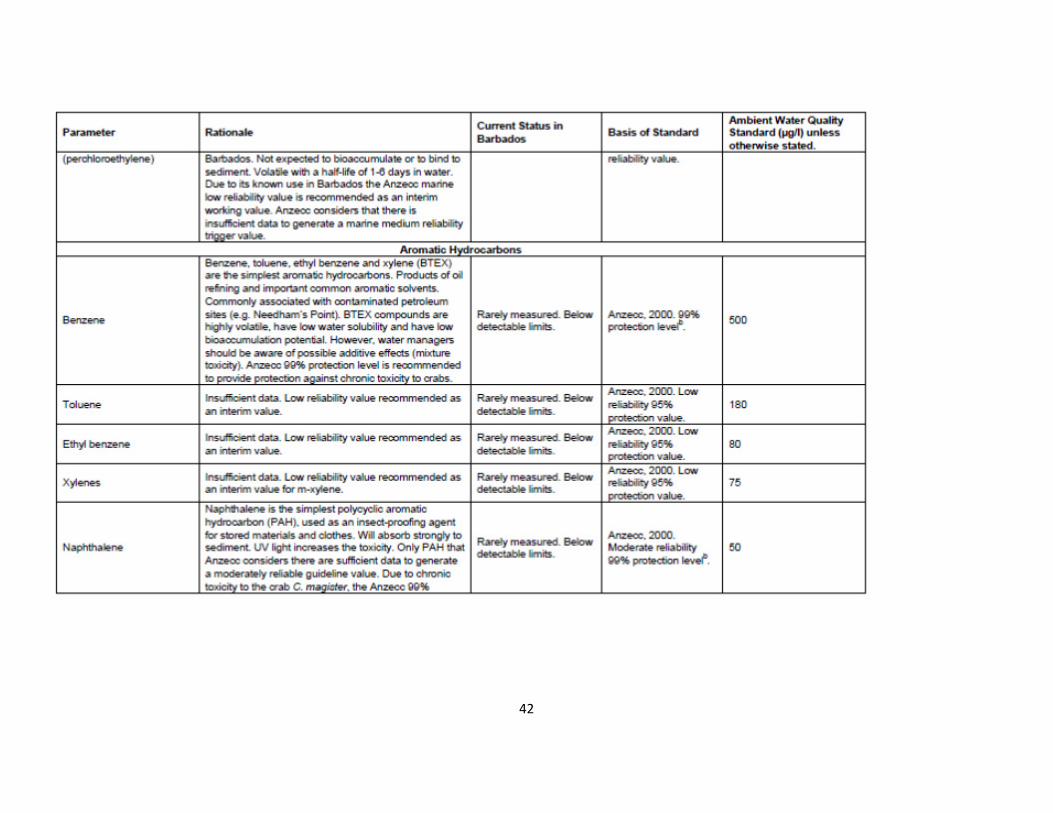
42

43

44
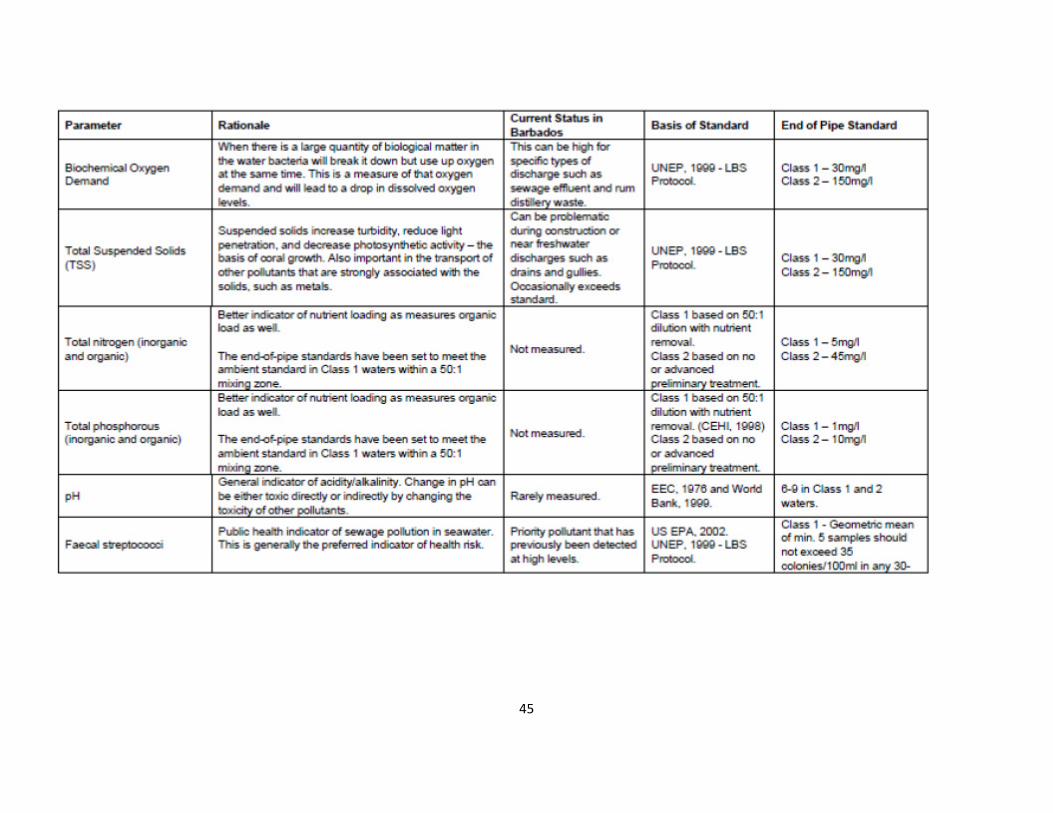
45

46
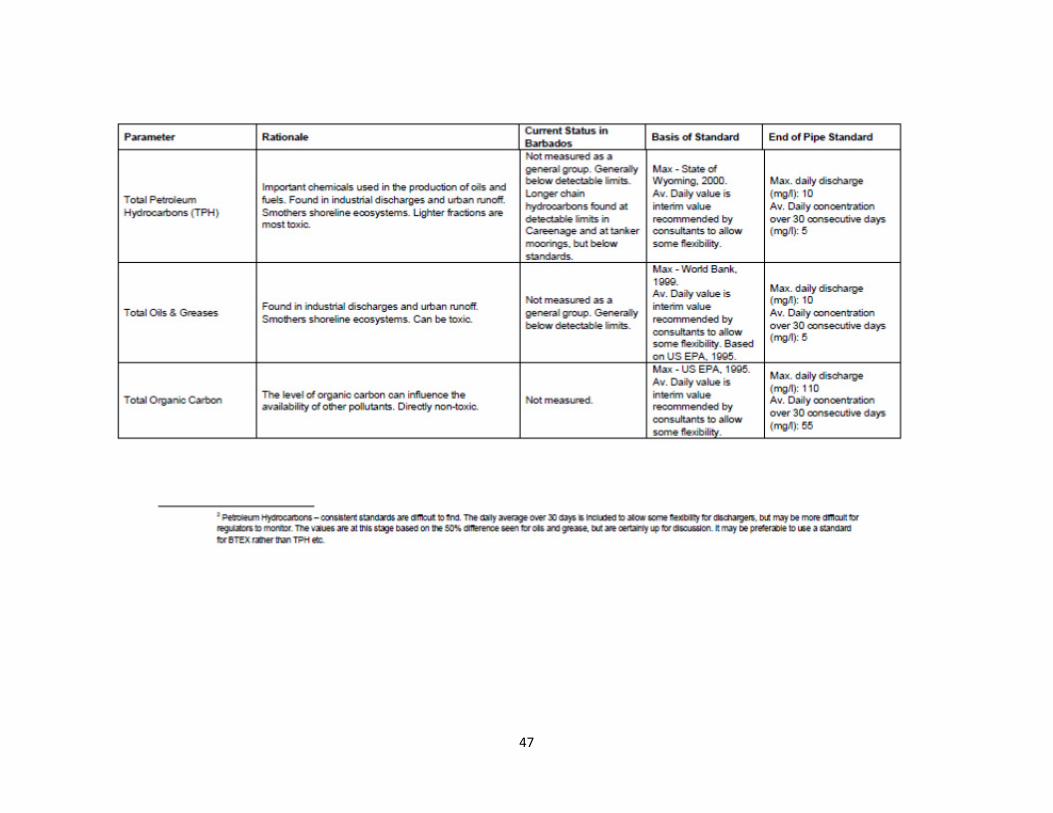
47
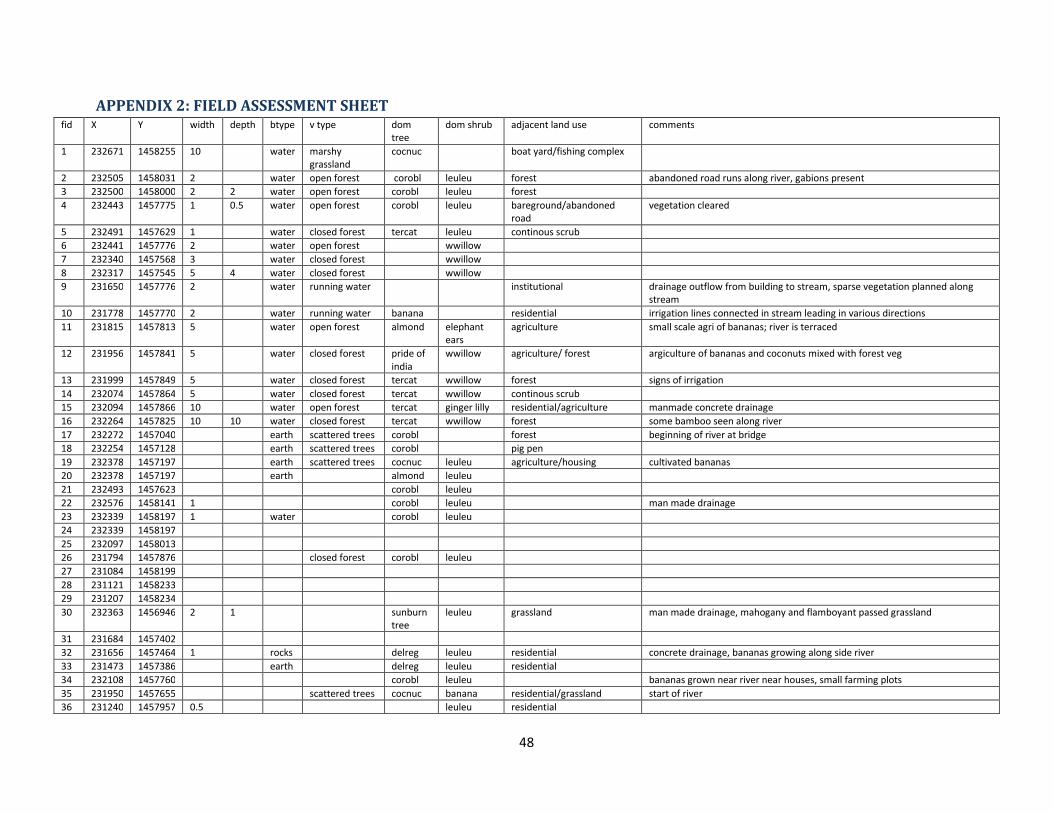
48
APPENDIX 2: FIELD ASSESSMENT SHEET fid X Y width depth btype v type dom
tree
dom shrub adjacent land use comments
1 232671 1458255 10 water marshy
grassland
cocnuc boat yard/fishing complex
2 232505 1458031 2 water open forest corobl leuleu forest abandoned road runs along river, gabions present
3 232500 1458000 2 2 water open forest corobl leuleu forest
4 232443 1457775 1 0.5 water open forest corobl leuleu bareground/abandoned
road
vegetation cleared
5 232491 1457629 1 water closed forest tercat leuleu continous scrub
6 232441 1457776 2 water open forest wwillow
7 232340 1457568 3 water closed forest wwillow
8 232317 1457545 5 4 water closed forest wwillow
9 231650 1457776 2 water running water institutional drainage outflow from building to stream, sparse vegetation planned along
stream
10 231778 1457770 2 water running water banana residential irrigation lines connected in stream leading in various directions
11 231815 1457813 5 water open forest almond elephant
ears
agriculture small scale agri of bananas; river is terraced
12 231956 1457841 5 water closed forest pride of
india
wwillow agriculture/ forest argiculture of bananas and coconuts mixed with forest veg
13 231999 1457849 5 water closed forest tercat wwillow forest signs of irrigation
14 232074 1457864 5 water closed forest tercat wwillow continous scrub
15 232094 1457866 10 water open forest tercat ginger lilly residential/agriculture manmade concrete drainage
16 232264 1457825 10 10 water closed forest tercat wwillow forest some bamboo seen along river
17 232272 1457040 earth scattered trees corobl forest beginning of river at bridge
18 232254 1457128 earth scattered trees corobl pig pen
19 232378 1457197 earth scattered trees cocnuc leuleu agriculture/housing cultivated bananas
20 232378 1457197 earth almond leuleu
21 232493 1457623 corobl leuleu
22 232576 1458141 1 corobl leuleu man made drainage
23 232339 1458197 1 water corobl leuleu
24 232339 1458197
25 232097 1458013
26 231794 1457876 closed forest corobl leuleu
27 231084 1458199
28 231121 1458233
29 231207 1458234
30 232363 1456946 2 1 sunburn
tree
leuleu grassland man made drainage, mahogany and flamboyant passed grassland
31 231684 1457402
32 231656 1457464 1 rocks delreg leuleu residential concrete drainage, bananas growing along side river
33 231473 1457386 earth delreg leuleu residential
34 232108 1457760 corobl leuleu bananas grown near river near houses, small farming plots
35 231950 1457655 scattered trees cocnuc banana residential/grassland start of river
36 231240 1457957 0.5 leuleu residential

49
APPENDIX 3: LAND-USE ACTIVITIES QUESTIONNAIRE. Gender of respondent: ( ) Male ( ) Female
Age of respondent: ( ) 11 – 18 ( ) 19 – 30 ( ) 31 – 45 ( ) 45 – 65 ( ) 65 +
Do you know what a watershed
area is?
(If yes) Please tell me in your own
words what the words “watershed
area” means to you
( ) Yes ( ) No
In which community do you live? Conset Bay[] St. Marks[] College Savannah[]Sealy Hall[]Sargeant St.[]
Other[] (if Other please specify in which parish) …………………………..
What types of activities do you do
in the area?
( ) Boating ( ) Fishing ( ) Swimming ( ) Farming ( ) Staking out animals ( )
Hunting ( ) Other (please specify) ………………………………….
What types of activities do you
use the streams in the watershed
for?
Irrigation[] Fishing[] Drinking Water[] Household Uses [] Other [] (please
specify)
In which of the numbered areas
do your activities take place?
Please list activity in
corresponding area
Area1:........................................
Area2:........................................
Area3:........................................
Area4:........................................
Area5:........................................
What types of activities do you
think could be harmful to Conset
Bay?
Dumping of garbage [] Removing vegetation [] Bad farming practices []
Water run-off from homes [] Agro-chemicals, pesticides and other
chemicals [] Don’t know [] Other [] (please specify)……….................
What types of activities could be
helpful to Conset Bay?
Proper disposal of garbage [] Re-planting the vegetation [] Proper farming
practices [] Proper sewage systems for the nearby homes [] Proper
disposal of agro-chemicals, pesticides and other chemicals [] Don’t know
[] Other (please specify)……………………………………