Embed Size (px)
Citation preview

Mapping Health FacilitiesAugust 2021

List of Acronyms
Executive Summary
Introduction
GRID3’s Approach to Health Facility Data
Applications in Nigeria and the Democratic Republic of the Congo
Expanding GRID3’s Country Portfolio for Health Facility Data
Conclusion
Attribution
Table of Contents
3
5
7
2
10
21
26
27
1 | 27
27

List of Acronyms
2 | 27
BMGFBill & Melinda Gates Foundation
DHIS2District Health Information Software 2
DPPIDirectorate of Planning, Policy, and Information
DRCDemocratic Republic of the Congo
DSNISDivision of the National Health Information System
EPI Expanded Programme on Immunization (EPI)
GIS Geographic Information System
GTS Geospatial Tracking System
LGA Local Government Area
M4HGRID3 Mapping For Health
MCSPMaternal and Child Survival Program
MoH Ministry of Health
MoPH Ministry of Public Health
NASRDA National Space Research and Development Agency
NPHCDA National Primary Health Care Development Agency
NSDI National Spatial Data Infrastructure
ODK Open Data Kit
PHSS Public Health Services and Solutions
POIs Points of Interest
QA/QCQuality analysis and quality control
RI Routine immunisation
SARA Service Availability and Readiness Assessment
USAIDUnited States Agency for International Development
VTS Vaccination Tracking System
WHO World Health Organization
WPV Wild poliovirus
ZamStats Zambia Statistics Agency

Executive Summary
3 | 27
Health facilities data are a crucial resource in any country’s drive to deliver the timely and effective healthcare services its population requires. The more comprehensive these data are, the better, and the most comprehensive form available today is geospatial. And yet, while the benefits of this type of data are well understood, much work remains to be done to realise its full potential. Accordingly, GRID3 (Geo-Referenced Infrastructure and Demographic Data for Development) aims to foster creative approaches to mapping health facilities that capitalise on recent technological advances as well as utilise the deep knowledge of stakeholders in the countries where GRID3 works.
There is no single overarching definition for what constitutes a health facility; different countries often use different names for the same resource. For this and other reasons, GRID3’s approach to producing comprehensive and accurate infrastructure maps is contingent on the specific context and needs of a given country. That said, generally speaking there is a standard set of steps GRID3 undertakes to clean, collect, and validate health facility data. GRID3 works with a country’s ministry of health to help produce a master health facility list that includes the latitude and longitude for health facilities. While most countries have lists of their health facilities in tabular form, they do not necessarily have spatial data associated with those lists to locate the facilities. GRID3 gathers and consolidates point data, with the goal of matching these data to the country’s master health facility list; creating a list of all known health facilities with their locations; and conducting any supplementary fieldwork that is necessary to create the most complete list possible.
GRID3’s in-country assistance can come in several forms: collecting primary data; consolidating data that already exists and working those data into the best possible shape; or identifying existing fieldwork and expanding the uses of the data that are being collected during those initiatives.
In Nigeria, GRID3’s geodatabase and portal are hosted by the National Space and Research Development Agency (NASRDA) and consist of datasets relating to population, subnational boundaries, settlements, and key infrastructure. These datasets inform microplan maps that focus chiefly on the ward-level locations of settlements where targeted populations can be reached for health interventions, such as polio vaccination campaigns. Health facilities are included on these maps, since they serve as reference points (along with helping to orient teams in the field, these facilities are where microplans are coordinated and vaccines are stored). In addition to supporting polio vaccination campaigns, GRID3 Nigeria is now supporting COVID-19 routine vaccination campaigns by producing digitised health facility catchment area maps that will help ensure the efficacy of these interventions. Geographic Information System (GIS) maps will ensure that the microplans are evidence-based by utilising GRID3 population estimates, and will also estimate accurate health facility catchment area distances.
In partnership with the government of the Democratic Republic of the Congo (DRC), GRID3 has worked to create more comprehensive datasets on the country’s health facilities. In 2018, GRID3 and Bluesquare began collaborating on a project to match various spatial sources on health facilities to the government’s tabular master health facility list; the project has increased the number of geo-referenced facilities from fewer than 2,000 to more than 6,000. In another effort to consolidate existing data, Acasus and GRID3 have been collaborating to support the Ministry of Health’s Expanded Programme on Immunization (EPI); Acasus is working closely with the EPI to equip management teams at the district level with smartphones to collect basic information on the frequency and quality of the fixed

4 | 27
vaccination sessions in targeted provinces. Another major aspect of GRID3’s DRC work is facilitating primary data collection through collaboration with local GIS technicians and health teams. In one such effort, GRID3 worked alongside the Bill & Melinda Gates Foundation and Novel-T in 2019 to collect health facility data by leveraging polio vaccination campaigns that were already scheduled to be in the field. In a separate initiative, GIS technicians with the GRID3 Mapping For Health (M4H) project work with local health teams to map their health catchment areas; GRID3 subsequently coordinates with local, provincial, and central authorities to receive the necessary validation of the data.
GRID3 has made significant strides in improving health facility data in several other countries, including Zambia and Sierra Leone. In Zambia, GRID3 obtained permission from government bodies to access, clean, and standardise existing health facility data and publish it in the public domain. These data were combined with the health facility list from the ministry of health to produce a comprehensive dataset containing not only information on the location of health facilities, but also additional data on health-affiliated infrastructure. In Sierra Leone, GRID3 has supported the creation of a geo-referenced master health facility list; the programme is now working with national and international partners to analyse and refine existing data, as well as to collect new data.
Health facilities are a major type of infrastructure mapped by GRID3, though by no means the only one; the programme also maps sector-specific buildings and landmarks such as schools, warehouses, and wells. GRID3’s infrastructure mapping work, in turn, is part of a larger tapestry of geospatial data that includes information on population, settlements, and subnational boundaries. By integrating these data, GRID3 is facilitating comprehensive assessments of needs, the appropriate locating of new interventions, and the effective monitoring of results.

Introduction
5 | 27
Health facilities are a critical type of infrastructure in all countries, making the data about those facilities an especially important tool for policymakers, healthcare providers, and other stakeholders. The more comprehensive these data are, the better, and the most comprehensive form available today is geospatial.1
The uses for geospatial data on health facilities are extensive, and include:
Determining a target population’s access to health servicesOnce location information (such as coordinates) are attached to health facility data (e.g. a master facility registry), geospatial analyses can be performed to highlight marginalised populations that are characterised by poor access to health facilities.
Mapping district infrastructureGeospatial facility data can improve the comprehensiveness of district or health area maps, as well as improve the mapping of health services with respect to the locations of populations.
Identifying travel timesGeospatial facility data can improve the identification of access gaps, and thus improve service delivery. Combined with other spatial data, geospatial health facility data can lead to improved planning of services and resources by identifying realistic travel times that account for terrain (i.e. natural barriers or poor roads) and typical modes of transportation.
Improving outreachOnce the location of facilities is available and population data are added, service areas for community health workers that cater to a set number of people and within a set distance to the health facility can be calculated. This can be used to plan the number and location of community health workers.
Locating settlementsIn some contexts, villages and settlements have changing or multiple names, while settlements on rural lands are rarely mapped. This makes it difficult to know where people have come from and where outreach activities (such as contact tracing or surveillance) need to take place. People often know how far they live from the health facility or can name their nearest health post; having these mapped can help healthcare providers plan targeted outreach activities.
Improving interventions outcomesA sustainable, standardised, and integrated use of geospatial health facility data and technologies can result in the improved effectiveness of interventions, saving lives and improving well-being through improved delivery of vaccination services in the areas where they are most needed.
1. The following partially draws upon UNICEF. Guidance on the Use of Geospatial Data and Technologies in Immunization Programs: Overview and Managerial Considerations for In-Country Strengthening. October 2018.

6 | 27Health facilities in Nigeria and the DRC

7 | 27
While the uses and benefits of geospatial health facility data are well known, there is much work that remains to be done to fully realise the data’s potential. In many circumstances, lists of health facilities already exist, but they either do not include precise spatial data or provide incomplete and/or inaccurate information. Some countries possess multiple separate spatial health facility datasets which, due to various incompatibilities (technological, methodological, or capacity-related), cannot be used in tandem; this leads to wasted effort and/or gaps in interventions.
The challenges extend to the organisational structure of the bodies that oversee the mapping of health facilities. These bodies tend to be separate from the practitioners who are putting that data to use and, as a consequence, the data are not tailored as effectively as they could be. This makes it difficult for health practitioners in the field to provide corrections and updates to the health facility data, even though these practitioners are in the best position to know where a given facility is, what kind of facility it is, and other information about it.
With these challenges in mind, GRID3 is working to create improved, standardised, and more flexible approaches to mapping health facilities that aim to maximise the accessibility, compatibility, and usability of related geospatial data.
GRID3's Approach to Health Facility Data
GRID3's backgroundGRID3 (Geo-Referenced Infrastructure and Demographic Data for Development) is a programme funded by a grant from the Bill & Melinda Gates Foundation (BMGF) and the United Kingdom’s Foreign, Commonwealth & Development Office. It is implemented by Columbia University’s Center for International Earth Science Information Network, the United Nations Population Fund, WorldPop at the University of Southampton, and the Flowminder Foundation. GRID3’s primary mission is to build spatial data solutions that make development goals achievable. To accomplish this, GRID3 draws on the expertise of its partners in government, the United Nations, academia, and the private sector to design adaptable and relevant geospatial solutions that are based on developing countries’ capacity and development needs.
GRID3 works with local stakeholders and data collectors to build capacity for the production and management of geospatial data on health facilities. There is no single, overarching definition for what constitutes a health facility; different countries often use different names for the same resource.2 For this and other reasons, GRID3’s approach to producing comprehensive and accurate infrastructure maps is contingent on the specific context and needs of a given country.
2. Examples of facility names that might hold different meanings from country to country include: hospitals, clinics, pharmacies, health posts, dispensaries, and vaccine cold storage facilities.

8 | 27
Next, GRID3 places all the datasets in a single, extensive list that adheres to a standard data format. From this list of spatial data, GRID3 creates clusters of health facilities within a given distance of each other (i.e. within 100m), allowing for the confirmation of those points’ spatial accuracy. GRID3 evaluates these clusters and examines whether the names within them correspond to each other; this helps GRID3 to define the attribute quality of the data. By establishing these clusters, GRID3 can start to evaluate those points’ accuracy (the more points within a cluster that have the same, or very similar, health facility name, the higher the confidence in the spatial accuracy; this is especially true when points are from multiple independent sources). This evaluation enables GRID3 to identify the most accurate spatial location for a health facility and an accurate name for that facility. It also allows GRID3 experts to answer questions such as:
Do all points in a cluster agree on a name? Do none of the points in a cluster agree on a name? Is there one outlier that should be ignored?
3. Health facilities are usually categorised into different types based on the services they provide. These classifications vary by country. See above footnote.
3. Health facilities are usually categorised into different types based on the services they provide. These classifications vary by country. See above footnote.is
4. Settlement extents are produced by aggregating Ecopia’s individual building footprints (produced through a machine learning process that extracts features from satellite imagery) to polygons, which results in the production of operational settlement extent boundaries.his last point is dataset
5. This last point is dataset-dependent. Some datasets include information gathered at regular intervals; these data are maintained, since each point was independently collected.ependent. Some datasets include information gathered at regular
GRID3’s approach If possible, GRID3 works with a country’s ministry of health to produce a master health facility list that includes the latitude and longitude for health facilities. While most countries have lists of their health facilities in tabular form, they do not necessarily have spatial data associated with those lists that can make the facilities’ locations more accurate. GRID3 collects this second type of data, in point form. The goal of this approach is to match these point data to the country’s master health facility list; create a list of all known health facilities; and conduct any supplementary fieldwork data collection that is necessary to create the most complete list possible.
While most countries have lists of their health facilities in tabular form, they do not necessarily have spatial data associated with those lists that can make the facilities’ locations more accurate. GRID3 collects this second type of data, in point form.
To accomplish this, GRID3 first works to identify datasets that have a clear provenance; these are provided by the government and/or collected in the field by GRID3, another NGO, or a UN body. Once in hand, GRID3 performs standard quality analysis and quality control (QA/QC) checks and cleans the datasets. This involves standardising health facility names and types3 so that there are consistent fields across all the datasets (having consistent types across the datasets is an important means of avoiding confusion); removing points that fall outside of the geographic area of interest; performing further cleaning by examining whether the point falls in the district/country/etc. where it should be found; identifying points that do not fall within a settlement extent;4 and removing duplicate points within a dataset.5

Two clusters exist for the Kanteba (DRC) health facility. The GRID3 approach dictates that if a cluster has multiple points that fall within a settlement and exhibit the same name and location, this cluster supersedes a cluster with a single point outside the settlement. In this instance, the cluster on the right would be chosen.
Figure 1. Kanteba health facility clusters, Democratic Republic of the Congo
Kanteba
Kanteba
Kanteba
9 | 27
GRID3 compares these clusters to the country’s tabular data list6 and subsequently takes the facility name and the district it resides in and “fuzzy matches” them to the point layer.7 Once GRID3 has identified the best matches possible, it identifies areas where data are missing. Finally, depending on need and availability of resources, GRID3 may conduct fieldwork to fill in that missing data and can also use this fieldwork to confirm the data it already has.
There are some limitations to GRID3’s methods. Field collection is not always possible; even when it is conducted, some facilities may still be missing. Errors may still occur after validation of the spatial accuracy and the fuzzy matching to the master facility list. Health facility data or the master facility list may be out of date. Health facilities may no longer be open or new facilities may go unaccounted for. Given these circumstances, it is important to have the data validated by the country’s ministry of health and/or by regional health workers.
6. When making decisions about the best location, GRID3 is noting how many individual datasets agree as to where the health facility is found. If two or more independent datasets agree on a health facility location, GRID3 trusts that data more than if a single dataset says a health facility exists in a given location.
7. “Fuzzy matching” is a process that compensates for minor spelling errors between datasets.

10 | 27
Applications in Nigeria and the Democratic Republic of the CongoGRID3’s support for mapping health facilities differs from case to case. GRID3 assistance can come in the form of collecting new primary data; in this scenario, GRID3 will work with local health teams to collect health facility data that can be seamlessly integrated into what data already exist and refine them into the best possible shape by performing QA/QC, cleaning, and integrating them into existing systems with an eye towards facilitating their interoperability across different data platforms. As another form of support, GRID3 will identify pre-existing efforts to go into the field (e.g. supervision for a routine vaccination) and use these opportunities to expand the uses of the data that are being collected.
The following section provides examples of how GRID3 has used these approaches in Nigeria and the Democratic Republic of the Congo (DRC).
Nigeria
Background
In 2011, the number of cases of wild poliovirus (WPV) infection in Nigeria was on the rise. The cases were predominantly in 11 states in northern Nigeria, leading the government to designate those states as high risk. Campaign monitoring data indicated that many children were being chronically missed by vaccination efforts, and that supervision of vaccination teams and overall accountability in the programme needed attention. During an investigation of on-the-ground activities, vaccination teams discovered inaccuracies with the paper-based microplan maps, which are used to locate settlements and the population to be vaccinated.8 Often, these maps did not identify critical settlements and therefore children in these locations were not being vaccinated.
In an effort to improve the accuracy of the microplan maps, geospatial datasets on settlements, population, and points of interest (POIs)9 for the country’s 11 northern states were collected by field officers from Public Health Services and Solutions (PHSS) (and later by eHealth Africa); these datasets were used by healthcare workers (ward focal persons) at the ward level (the smallest administrative unit in Nigeria) to create digitised microplans for the deployment of vaccinators to ensure coverage of all settlements and under-5 children within the ward. In addition to the digitisation of the data, utilisation of the Vaccination Tracking System (VTS) proved to be another essential tool for the vaccination teams; the VTS was used to identify the location of settlements and the target populations within them; track the delivery of vaccines; determine which settlements were missed; and identify areas that should be revisited for additional coverage efforts.
8. A microplan is a population-based set of quantitative and qualitative data for delivering healthcare interventions. It contains technical details and can be adapted as needed at every level, whether by national institutions, health care workers, or community participants. See World Health Organization. Best Practices in Microplanning for Polio Eradication. 2018. Available at http://polioeradication.org/wp-content/uploads/2018/12/Best-practices-in-innovations-in-mircoplanning-for-polio-eradication.pdf9. Points of interest (POI) refer to point features, or geo-referenced points, that depict infrastructure, buildings, and landmarks.

11 | 27
The application of geospatial data, digital maps, and GIS tracking of vaccination teams led to significant outcomes.10 Results from the 2013-2015 polio campaigns in northern Nigeria demonstrated that there was an improvement in the geographic coverage of settlements and an overall reduction in the number of missed settlements. VTS devices used by the vaccinators and the high-resolution geospatial data collected allowed vaccinators' movements to be monitored within the settlements; accountability improved, which increased coverage, as well as improved resource management (by knowing how many children were actually vaccinated, managers could know how many vaccine vials were used and how many more were needed, as indicated in the tally sheets). The enhanced maps could not only ensure that each settlement was included in vaccination plans, but also enabled significant improvements in plan efficiency. Equipped with spatially precise, accurate data, planners could better allocate vaccine supplies and better design vaccinator travel routes.
The success of the initiative in the northern states led to the formation of GRID3 in 2018; the programme was founded in part to scale up the WPV mapping interventions to all of Nigeria and also extend it to other countries. GRID3 facilitated the production of geospatial data in Nigeria’s southern states and generated improved population estimates that were integrated into the microplans. Again, through the continued application of these data, GIS maps, and the VTS, polio cases decreased over time. Wild polio outbreaks thereafter fell to zero and have remained so since; in 2020, the WHO declared the country “wild polio free.”
Since the programme’s inception, GRID3 has substantially expanded its efforts to use geospatial mapping to support other vaccine and health-related interventions across Nigeria. The following sections describe this work.
Non-routine vs. routine vaccination campaigns
In Nigeria, immunisation campaigns fall into two broad categories: routine and non-routine. Health facilities are important components of each of these campaigns, although the maps produced to support them are different.
Non-routine campaigns in Nigeria (e.g. the WPV vaccination effort described above) utilise microplan maps that focus chiefly on the ward-level locations of settlements where targeted populations are to be reached. Health facilities are included on these maps, since they serve as reference points; in addition to helping orient the teams in the field, health facilities are the locations where microplans are coordinated and vaccines are stored.
While GRID3 has long supported polio vaccination campaigns in Nigeria, the programme is now preparing to also support RI campaigns by producing digitised catchment area maps that will help ensure that the microplans and other interventions are as effective as possible.
10. See Touray et al. Tracking Vaccination Teams During Polio Campaigns in Northern Nigeria by Use of Geographic Information System Technology: 2013–2015. The Journal of Infectious Diseases. Vol. 213, Issue Suppl. 3, May 2016.

Source: Sokoto State Primary Health Care Development Agency
Figure 2. Health facility catchment area map, Sokoto State, Nigeria (February 2020)
12 | 27
By contrast, routine campaigns in Nigeria (i.e. routine immunisation, or “RI”, programmes) for vaccines such as yellow fever, measles, and meningitis, have health facilities as their point of focus. The maps produced for these campaigns show health facilities, the settlements surrounding them, and the number of children who would be vaccinated in that area, as well as the health facility where they would receive their routine vaccinations. Specifically, the maps show the health facility and indicate the number of children who live within 2km of it (and so could reasonably be expected to have access to that facility); the number who live between 2km and 5km from the facility and need to be the targets of an outreach strategy to bring them there; or the number who live more than 5km from the facility and need a mobile health facility that will travel to their areas to vaccinate them. These are nationally designated distances that provide the Primary Health Care Agencies with guidance on how to carry out routine vaccinations.
GRID3 data have been utilised in some RI campaigns in the country and in the process have supported successful efforts to reach more people in need of vaccination. For example, in 2019, through funding from the United States Agency for International Development (USAID), the Maternal and Child Survival Program (MCSP) piloted the use of GIS maps for RI microplanning in three LGAs in Bauchi State and Sokoto State. GRID3 population estimates were used to identify the target population for the three LGAs in each state.11 Using these more-comprehensive data, GIS microplans projected approximately 194,000 and 157,000 more required vaccines than was anticipated using traditional methodology in Bauchi and Sokoto, respectively; the additional number of vaccinations required was nearly 113,000 in Bauchi and about 47,000 in Sokoto.12
11. See GRID3 Nigeria. Available at https://grid3.gov.ng/12. See Ali, Disha et al. A cost-effectiveness analysis of traditional and geographic information system-supported microplanning approaches for routine immunization program management in northern Nigeria. Vaccine. Vol. 38, Issue 6, 5 February 2020. Available at https://www.sciencedirect.com/science/article/pii/S0264410X19316421#b0120

Figure 3. Ward map for polio microplanning in Bauchi State, Nigeria (November 2020)
Source: Bauchi State Primary Health Care Development Agency
13 | 27
In a new phase of support for RI, Novel-T, in partnership with GRID3 and NPHCDA, is developing a Geospatial Microplanning Toolkit (GMT) that will enable the efficient production and customisation of digitised catchment area maps for the entire country. The GMT will ensure that the microplans are evidence-based by utilising the GRID3 population estimates, demonstrate accurate estimates of health facility catchment area distances, and allow for microplans to be digitally maintained and easily updated over time.
COVID-19
GRID3’s approach to health facilities mapping has already contributed to the ongoing effort to fight COVID-19 in Nigeria. At the outset of the pandemic, GRID3 provided web maps for 11 LGAs with the highest burden of COVID-19 to NPHCDA; the agency used these maps to site locations for community support centres that treated suspected cases of COVID-19. These maps relied on GRID3’s health facility and junior secondary schools datasets; when a suspected case was reported, the patient was taken to a school that was being used as a community support centre and tested there. If the result came back positive, the patient was moved to an isolation centre; if negative, they were taken to a nearby health facility and treated for other diseases (which may have symptoms similar to COVID-19).
In another effort, GRID3’s Nigeria population estimates and health facility dataset were used by Fraym to create risk profiles for identifying vulnerable populations that have difficulty accessing health facilities at different administrative levels. The data showed health facility locations and used access to health facilities as an indicator of vulnerability to COVID-19. So far, this risk layer has been used at national and subnational levels.13
13. Risk layers available at https://data.grid3.org/search?categories=risk%20layers&tags=NGA

14 | 27
GRID3 has also contributed to Nigeria’s COVAX initiative, part of a global effort to provide equitable access to COVID-19 vaccines.14 In March 2021, NPHCDA again enlisted GRID3’s support to improve vaccine delivery and access strategies across the country. Specifically, GRID3 supported the development of microplans; through NASRDA, the programme produced and printed GIS-based maps for all 774 LGAs. These maps were delivered to the National Emergency Operations Centre (EOC) of NPHCDA, which then distributed them to the states and subsequently to the LGAs. The maps display the locations of vaccination sites and their surrounding 2km, 5km, and 10km areas. They also show the locations of other healthcare facilities and infrastructure (such as schools, prisons, and internally displaced persons’ camp survey points), settlement names, and gridded population estimates. These maps include tables summarising total population per ward, total population for those 50 years or older (who will be targeted in the second phase of the vaccination process), and comorbidity risk per ward. Based on national vaccination strategies, these maps can be used to shape registration plans and identify eligible populations, determine vaccination supply-chain requirements in a given LGA (e.g. vaccines, number of teams for house-to-house registration and vaccinations, number of devices, PPEs, and other supplies), or be used to inform the location of additional vaccination sites or temporary fixed posts. In addition, the maps can help pinpoint wards that have the highest comorbidity risks that may require special teams deployment. The maps have been utilised to identify populations in need and to more efficiently allocate vaccines.
The Democratic Republic of the Congo Background
Efforts to gather data on health facilities in DRC face several distinct challenges. The geographic size of the country and the remote locations of many of its communities make accessibility difficult, and can also make fieldwork prohibitively expensive. No single organisation has the capacity to conduct a health facility data collection project at the national scale, nor is there an accepted, standard set of attributes/variables to collect or methodology to approach data collection. As a result, datasets cover different geographic scopes and have different attributes and degrees of quality, inhibiting interoperability. DRC’s data governance structures are limited and fragmented, posing yet another challenge to producing, maintaining, and disseminating high quality data at significant volumes.
In partnership with the DRC government, GRID3 has begun work to address these various challenges with the aim of creating more comprehensive datasets on health facilities. Broadly speaking, this work falls into two categories: 1) consolidation of existing data, and 2) collection of new (primary) data via working with local stakeholders.
Consolidation of existing data
The lack of an accessible, comprehensive, and georeferenced official repository for health facilities data means that what relevant information exists in DRC is often distributed among many different sources, in varying states of quality. It is left to the DRC government and partners to identify these sources, extract the relevant data, and clean them, with the ultimate goal of either producing data that are tailored to meet the needs of projects/emergencies, or make the data publicly available. GRID3 has contributed to two such efforts, described below.
14. See https://www.who.int/initiatives/act-accelerator/covax
15 | 27
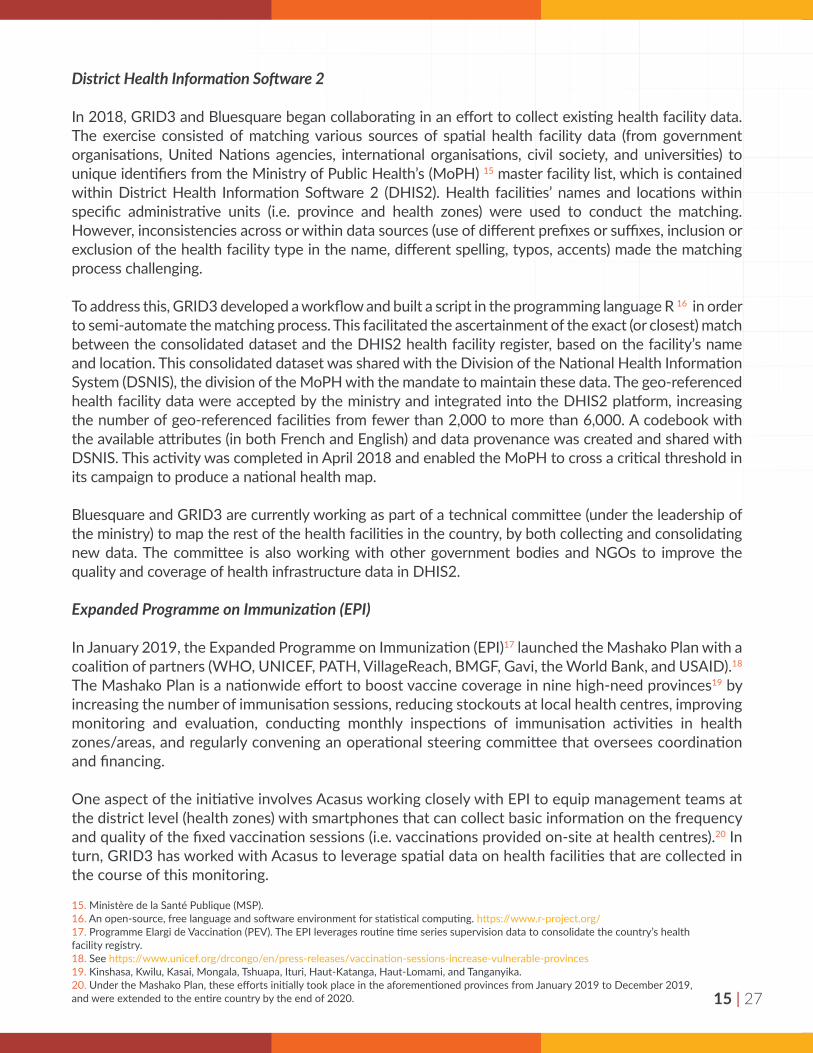
District Health Information Software 2
In 2018, GRID3 and Bluesquare began collaborating in an effort to collect existing health facility data. The exercise consisted of matching various sources of spatial health facility data (from government organisations, United Nations agencies, international organisations, civil society, and universities) to unique identifiers from the Ministry of Public Health’s (MoPH) 15 master facility list, which is contained within District Health Information Software 2 (DHIS2). Health facilities’ names and locations within specific administrative units (i.e. province and health zones) were used to conduct the matching. However, inconsistencies across or within data sources (use of different prefixes or suffixes, inclusion or exclusion of the health facility type in the name, different spelling, typos, accents) made the matching process challenging.
To address this, GRID3 developed a workflow and built a script in the programming language R 16 in order to semi-automate the matching process. This facilitated the ascertainment of the exact (or closest) match between the consolidated dataset and the DHIS2 health facility register, based on the facility’s name and location. This consolidated dataset was shared with the Division of the National Health Information System (DSNIS), the division of the MoPH with the mandate to maintain these data. The geo-referenced health facility data were accepted by the ministry and integrated into the DHIS2 platform, increasing the number of geo-referenced facilities from fewer than 2,000 to more than 6,000. A codebook with the available attributes (in both French and English) and data provenance was created and shared with DSNIS. This activity was completed in April 2018 and enabled the MoPH to cross a critical threshold in its campaign to produce a national health map.
Bluesquare and GRID3 are currently working as part of a technical committee (under the leadership of the ministry) to map the rest of the health facilities in the country, by both collecting and consolidating new data. The committee is also working with other government bodies and NGOs to improve the quality and coverage of health infrastructure data in DHIS2.
Expanded Programme on Immunization (EPI)
In January 2019, the Expanded Programme on Immunization (EPI)17 launched the Mashako Plan with a coalition of partners (WHO, UNICEF, PATH, VillageReach, BMGF, Gavi, the World Bank, and USAID).18 The Mashako Plan is a nationwide effort to boost vaccine coverage in nine high-need provinces19 by increasing the number of immunisation sessions, reducing stockouts at local health centres, improving monitoring and evaluation, conducting monthly inspections of immunisation activities in health zones/areas, and regularly convening an operational steering committee that oversees coordination and financing.
One aspect of the initiative involves Acasus working closely with EPI to equip management teams at the district level (health zones) with smartphones that can collect basic information on the frequency and quality of the fixed vaccination sessions (i.e. vaccinations provided on-site at health centres).20 In turn, GRID3 has worked with Acasus to leverage spatial data on health facilities that are collected in the course of this monitoring.
15. Ministère de la Santé Publique (MSP).16. An open-source, free language and software environment for statistical computing. https://www.r-project.org/17. Programme Elargi de Vaccination (PEV). The EPI leverages routine time series supervision data to consolidate the country’s health facility registry. 18. See https://www.unicef.org/drcongo/en/press-releases/vaccination-sessions-increase-vulnerable-provinces19. Kinshasa, Kwilu, Kasai, Mongala, Tshuapa, Ituri, Haut-Katanga, Haut-Lomami, and Tanganyika.20. Under the Mashako Plan, these efforts initially took place in the aforementioned provinces from January 2019 to December 2019, and were extended to the entire country by the end of 2020.

16 | 27
On average, each health zone receives 3 smartphones and is responsible for covering an average of 35 health facilities. Each month, the supervisors from the health zone21 oversee a sample of fixed vaccination sessions in health centres (3,500 health facilities were visited every month in 201922), during which they collect GPS locations, along with other important data on vaccination. A considerable number of data points are collected periodically for the same facility. With support from Acasus, the EPI implemented this monitoring in the Mashako Plan’s 9 original target provinces (5,140 health facilities in 191 health zones) before scaling up to cover 23 out of the country’s 26 provinces.23
This approach has enabled GRID3 to integrate the existing data on different points in time for the same facility, allowing for the consolidation and validation of the facility’s location. While the spatial data collected by supervisors are not always accurate (due to GPS malfunctions, and also because supervisors sometimes fill in the information remotely), the time series format has allowed GRID3 to identify patterns and outliers, increasing confidence in the accuracy of the health facilities’ locations. Data are then matched against the master facility list in order to associate additional attribute information (including important vaccination data) for the EPI.
Once the data are in hand, the workflow follows the one described in the Nigeria section. Acasus built a dashboard to provide an easy-to-use interface that local teams can use to give feedback. The spatial data are shared with Acasus, allowing Acasus to use more-precise health facility location information in its monitoring efforts. The data are also integrated into DHIS2 and the Iaso data management platform (powered by Bluesquare) for easy access and dissemination.
Collaborating with local health teams to collect primary data
In addition to supporting governmental efforts to locate and refine existing data, GRID3 is contributing to efforts to generate new data that can further enrich DRC’s health facilities knowledge base. In its work in the GRID3 Mapping for Health (M4H) project 24 and its collaboration with Novel-T and BMGF, GRID3 facilitates data collection by local healthcare providers.
GRID3 Mapping for Health
GRID3 M4H has partnered with the MoPH to work directly with local health teams and head nurses in charge of health facilities to collect data, an approach designed to take advantage of these practitioners’ on-the-ground expertise.
Before undertaking data collection, health teams (head nurses/community health workers) are trained by a team of GIS technicians to use the Geospatial Tracking System (GTS), enabling data collection and the tracking of field staff via smartphones.25 A digital form embedded in the application allows the user to choose from a list of health facilities from the master health facility list during data collection, helping to prevent possible errors introduced through manual data entry and to facilitate the seamless integration of the data into DHIS2. The data collected are checked against the master health facility list and discrepancies are fed back to the central level for any necessary adjustments to the list. Health facility locations are collected along with other relevant geospatial data (settlements, boundaries, and other POIs). Finally, GRID3 coordinates with the district, provincial, and central health authorities (starting at the district level) to receive the necessary feedback on validation of the data before they are published by the ministry.
21. Equipe Cadre de la Zone de Santé (ECZS).22. Acasus made approximately 1,000 visits in 2018, 42,000 in 2019, and 21,000 (up to May) in 2020.23. The three outstanding provinces will be covered in the near future. Approximately 18,000 health facilities are reported in DHIS2 in 519 health zones.24. GRID3 Mapping for Health in DRC is a Ministry of Health initiative, delivered through GAVI’s Infuse programme, in partnership with Flowminder and CIESIN. The project is a continuation of previous work conducted and/or supported in DRC by GRID3.25. The GTS is a more versatile version of the VTS described in the Nigeria section. See https://gts.health/

Collecting primary dataTo obtain primary data on health facilities in the field, GRID3 M4H technicians work with local health teams to collect this information through the Geospatial Tracking System smartphone application.
Step 2b
A head nurse who regularly works in a particular health area visits a health facility (in urban areas, nurses also visit health area boundaries).
Step 1
If needed, other relevant geospatial information (settlements, boundaries, and other POIs) can be recorded by the nurse, such as the extent of a health area boundary, based on their movements.
This information is sent to GRID3 in the form of a digital map, providing a comprehensive picture of where health facilities, settlements, boundaries, and other POIs are. Data are also used in combination with a participatory mapping exercise to delineate health area boundaries.
On their smartphone, the nurse records the location of the health facility and takes a photo, when applicable.
Step 2a
Step 3
17 | 27

18 | 27

Figure 4. Snapshot of a health catchment map for Kingandu health zone in Kwilu Province, DRC
Sources: Esri, USGS, NOAA
Health area
Health centre (3km buffer)Outreach (3km buffer)
Outreach locationGeneral hospitalHealth facilityHealth postLocalityHealth zone
Population estimates
PrimarySecondaryTertiaryTrack/path/various
Route RiverRiverStreams/various
Railroad tracks
Protected areas
19 | 27

In October 2020, GRID3 M4H, under the direction of the project’s steering committee, inaugurated its technical committee. This committee consists of members representing some 26 governmental organisations and NGOs that work in health and/or health-related mapping in DRC. The technical committee aims to strengthen the coordination and standardisation of mapping efforts by consolidating existing datasets, standardising procedures, and making recommendations on how to integrate geospatial data into existing and new systems. In close collaboration with Bluesquare (the focal point for health facility master lists and locations), GRID3 M4H supports the sub-groups that are tasked with 1) improving the national master health facility list and 2) ensuring that all of these health facilities have accurate geospatial data points.
Bill & Melinda Gates Foundation and Novel-T
In its work with BMGF and Novel-T, GRID3 leveraged polio vaccination campaigns that are already scheduled to be in the field to also collect health facility data. At the same time GRID3 was working with stakeholders in Haut-Lomami and Tanganyika provinces to improve maps of health districts, there were vaccinators in the field collecting data on health facilities. Each data point collected during the campaign also identified its corresponding health zone and health area, as known by the local healthcare worker. 26 This not only allowed GRID3 to piggyback on existing initiatives for data collection, reducing costs. and demands on human resources, but also increased the odds for correct health facility identification. Polio campaigns are rolled out 2 to 3 times a year (with 200 to 300 vaccinators per health district); if this collaboration continues in future campaigns, the master health facility dataset can likewise be improved across the country and remain up-to-date in places that already have comprehensive data coverage.
There are shortcomings to this approach that should be kept in mind. This exercise was undertaken in select health districts where GRID3 was already involved in related work and has not been conducted at the national scale; it was costly to equip the vaccinators; the timing (simultaneously in numerous areas) made it difficult to efficiently allocate resources; it required time- and resource-intensive training on how to use smartphones/the data collection app; and only very basic attribute data (health facility name, type, and administrative information) were collected, as vaccination is the primary focus of the vaccinators and the timeframe of the campaign was brief.
Conclusion
GRID3’s work in DRC has already achieved several important milestones. Various datasets have been made available to the public, ensuring that stakeholders can easily access the information and use the data as a planning tool. GRID3 contributed significant detail to the MoPH’s master facility list, including the addition of health district information; what type of facility a given structure is (making it easier to filter the data in case a data user only wants to see certain types of facilities); standardised names (making labelling easier); and additional information such as available services. Overall, the data GRID3 have contributed are cleaner and easier to read, and because they are now published on the HDX and DHIS2, easy to access; this is especially important as the country ramps up efforts to address the impacts of COVID-19.27
26. A “health area” is the smallest administrative unit of health service delivery in DRC and is usually made up of one or more health facilities. Health areas that are grouped into larger administrative health units are referred to as “health zones.”27. United Nations Office for the Coordination of Humanitarian Affairs. “GRID3 DRC Haut-Lomami and Tanganyika Health Facilities, Version 01 (Beta)”. Available at https://data.humdata.org/dataset/grid3-drc-haut-lomami-and-tanganyika-health-facilities-version-01-beta
20 | 27

GRID3 has made significant strides in improving health facility data in several other countries, including Zambia and Sierra Leone.
ZambiaUntil recently, data on health facilities locations were neither easily accessible nor available for download on Zambia’s National Spatial Data Infrastructure (NSDI) data platform. GRID3 helped to address this by obtaining permission from various government bodies to access, clean, and standardise existing health facility data and publish it in the public domain, making it open-access and easily downloadable.28
Consolidation of existing data
GRID3 obtained existing health facility locations data from government sources (including the Ministry of Health, MOH) and the Zambia Statistics Agency (ZamStats) to assess coverage and produce a standardised health facility dataset. The 2010 census cartography from ZamStats provided additional information on health-affiliated infrastructure (such as health offices, health centres, doctors’ offices, health facility wells, and compounds). These data points were combined with the health facility list from MoH to produce a comprehensive dataset containing not only information on the location of health facilities, but also data on health-affiliated infrastructure. GRID3 developed a workflow in Python to review existing data sources and remove overlapping locations of health facilities (duplicates) that were present among government data sources, prioritising the location recorded by MoH. The health facility names were standardised for consistency and ease of labelling, with type and subtype attributes added to distinguish among various health facility types and health-affiliated infrastructure. Location attributes were also added to the dataset to provide information about which province and district each point is located within. The initial release of the dataset is being widely used by government and non-government stakeholders. GRID3 is working with district planning teams (such as vaccination groups and local district planners) who are helping to validate the dataset by identifying missing facilities or by flagging those that should be removed due to identification of further duplicates or if the health facility is no longer operational.
Expanding GRID3's Country Portfolio for Health Facility Data
21 | 2728. The dataset is accessible on the Zambia Data Hub managed by the NSDI, available at https://zambia-open-data-nsdi-mlnr.hub.arcgis.com/

Potential use for disease outbreaks
Zambia is primarily rural and comprised overwhelmingly of traditionally owned lands. A small percentage of these lands has been officially mapped. To complicate matters further, it can be difficult to know what to map in the first place; a Zambian village can sometimes be as small as a single household. To address these challenges, GRID3 has worked closely with the Zambian government to create a comprehensive settlement layer that will serve as an operational repository for the country’s settlement names and locations. To create a layer that has the endorsement of the NSDI, GRID3 gathered point data from various governmental sources. The majority of settlement names was extracted from a 2010 government mapping exercise, during which POIs nationwide were collected. GRID3 decided that adding POIs, including health facilities, could help to improve the identification of the locations of residences when settlement names are not available; other reference points (such as health facilities) are used instead. Field teams often know the names of schools or health facilities rather than the village names (which can have several name variations and/or spellings).
Health facilities’ names (as well as school names and names of other POIs) can be used as an approximation to locate settlements. Health facilities’ names are not subject to the same inconsistencies as settlement names; if someone gives the name of the health facilities they live closest to, identifying their home area can be more consistently successful. These health facilities and other POIs can be combined with the settlement extents GRID3 created in order to locate the given village on a map. GRID3 has an open data sharing agreement with the government’s data custodians, making operational data publicly available. “The settlement data GRID3 provided helped us understand where health facilities are located. It was easy for us to analyse accessibility. The national standard is that health facilities should be within a five-kilometre zone of a settlement, and we discovered people don’t have adequate access to health facilities because approximately 60 percent are located outside of the buffer zone.”
- Josephine Chiila, District Planning Officer at Zimba Town Council
29. Zimba is mainly under traditional leadership and ownership; the district planner’s only role there is to provide guidance to the chiefs, with the chiefs ultimately making all decisions. The maps are proving to be very helpful to the district officer, as they serve as visuals that can be shown to chiefs whose areas are in need/effectively illustrate the challenges at hand. Such community buy-in for these data is crucial.
Looking ahead
In Zimba District, GRID3 settlement extents and health facility maps have begun to be used as an additional operational resource for planning the locations of health facilities. Zimba District Planning Head Josephine Chiila stated that the health facility dataset enabled the new district to compare its list (containing all health resources) to the data obtained from GRID3. The district is now using an updated layer and the settlement extents to search for areas that are underserved in healthcare. Such maps are shown to the community and traditional leaders in order to involve the citizens in the district’s development efforts.29 Chiila stated that, “The settlement data GRID3 provided helped us understand where health facilities are located. It was easy for us to analyse accessibility. The national standard is that health facilities should be within a five-kilometre zone of a settlement, and we discovered people don’t have adequate access to health facilities because approximately 60 percent are located outside of the buffer zone. Going forward, this information will help us to understand and address gaps in service provision.”
22 | 27

Over the next year, GRID3 will seek out more ways in which the compiled health facility data can be used for operational purposes by the government. In addition, GRID3 is doing work around the geographic access of women of reproductive age to health facilities that provide modern contraception methods for family planning services, as well as assisting Chinsali District health teams with the generation of maps showing population distribution and approximate distance to health facilities (which will assist with planning for health service provision).
Sierra Leone During a series of meetings with government officials in January 2020, GRID3 learned that Sierra Leone’s Directorate of Planning, Policy, and Information (DPPI, the body within the Ministry of Health and Sanitation responsible for the country’s tabular and geospatial health data) had an incomplete geo-referenced master health facility list. GRID3 was asked to support creating that list, and over 2020 the programme worked in conjunction with DPPI and UNICEF to analyse and refine existing data, as well as collect new data.
Figure 5: Spatial analysis of health facilities in Zimba district, Zambia
In the map above, health facilities are spaced at a radius greater than the national accessibility standards (the current standard is that health facilities should be within a 5km zone of a settlement). For instance, in order for the farthest person to access a health facility, they need to travel around 40km (in Kanyanga Ward) to the nearest health centre. This makes it difficult for people to access health services. Inadequate and uneven distribution of health services signifies a need for more health facilities to be constructed to cater for the district’s increasing population.
23 | 27
Source: Zimba Town Council
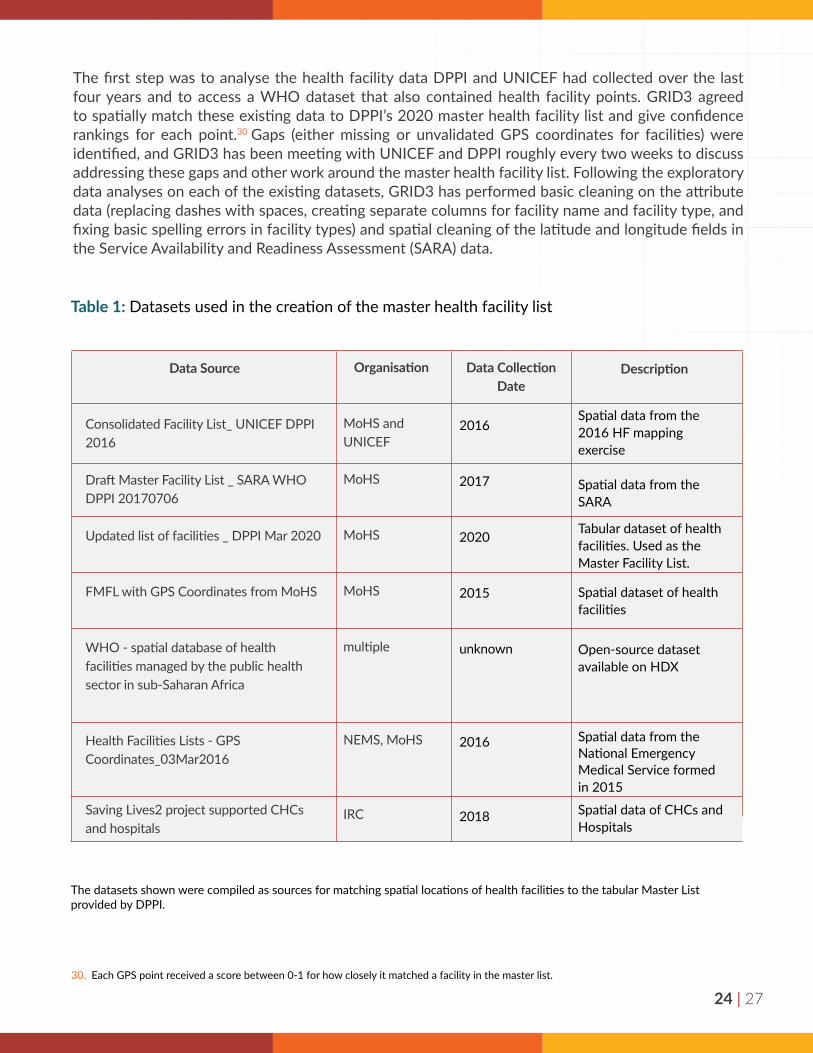
The first step was to analyse the health facility data DPPI and UNICEF had collected over the last four years and to access a WHO dataset that also contained health facility points. GRID3 agreed to spatially match these existing data to DPPI’s 2020 master health facility list and give confidence rankings for each point.30 Gaps (either missing or unvalidated GPS coordinates for facilities) were identified, and GRID3 has been meeting with UNICEF and DPPI roughly every two weeks to discuss addressing these gaps and other work around the master health facility list. Following the exploratory data analyses on each of the existing datasets, GRID3 has performed basic cleaning on the attribute data (replacing dashes with spaces, creating separate columns for facility name and facility type, and fixing basic spelling errors in facility types) and spatial cleaning of the latitude and longitude fields in the Service Availability and Readiness Assessment (SARA) data.
Table 1: Datasets used in the creation of the master health facility list
The datasets shown were compiled as sources for matching spatial locations of health facilities to the tabular Master List provided by DPPI.
Data Source
Consolidated Facility List_ UNICEF DPPI 2016
Draft Master Facility List _ SARA WHO DPPI 20170706
Updated list of facilities _ DPPI Mar 2020
FMFL with GPS Coordinates from MoHS
WHO - spatial database of health facilities managed by the public health sector in sub-Saharan Africa
Health Facilities Lists - GPS Coordinates_03Mar2016
Saving Lives2 project supported CHCs and hospitals
Organisation
MoHS and UNICEF
MoHS
MoHS
MoHS
multiple
NEMS, MoHS
IRC
2016
2017
2020
2015
unknown
2016
2018
Description
Spatial data from the 2016 HF mapping exercise
Spatial data from the SARA
Tabular dataset of health facilities. Used as the Master Facility List.
Spatial dataset of health facilities
Open-source dataset available on HDX
Spatial data from the National Emergency Medical Service formed in 2015
Spatial data of CHCs and Hospitals
30. Each GPS point received a score between 0-1 for how closely it matched a facility in the master list.
Data Collection Date
24 | 27

As there were multiple independently collected datasets available, GRID3 has been able to confirm spatial location and attribute data, match spatial datasets to the master facility list, and perform quality checks. GRID3 has succeeded in spatially matching 1,203 of 1,392 facilities to the master health facility list, 1,038 of which are high confidence (at least two independent datasets confirming location), 165 that GRID3 has one point for but cannot be verified with a second independent point, and 189 that are missing coordinates entirely. GRID3 is now strategising how to address the facilities in the latter two categories and is working with Premise, UNICEF, and DPPI to discuss fieldwork that can help to make the master health facility list more complete. GRID3, in partnership with the Ministry of Health and Sanitation, intends to support health facility validation workshops with district-level health teams (Admin 2 level) and subsequently publish the data and integrate them into other initiatives at the Ministry of Health and Sanitation.
Figure 6: Spatial matching of health facilities by district in Sierra Leone
The results of the spatial match of existing health facility coordinates to the Master Health Facility List created by DPPI. The match is broken down by district.
Matched facilities Missing/unvalidated facilities
25 | 27

26 | 27
Figure 7: Spatial view of health facilities in Sierra Leone
ConclusionKnowing the location of critical infrastructure helps to ensure that governments and humanitarian organisations are able to plan interventions effectively and streamline the delivery of goods and services.
Health facilities are a major type of infrastructure that GRID3 maps, though by no means the only one; GRID3 also maps sector-specific buildings and landmarks such as schools, warehouses, and wells, among many others. GRID3’s infrastructure mapping work, in turn, is part of a larger tapestry of geospatial data that includes data on population, settlements, and subnational boundaries. By integrating these data, GRID3 is supporting comprehensive assessments of needs, appropriate locating of new interventions, and effective monitoring of results.
In the master list, these types of health facilities were included:
Maternal and child health postsThis facility provides basic healthcare services to
around 5,000 people.
Community health posts (CHP)At CHPs, community health workers, maternal and child health workers, and state enrolled
nurses diagnose and treat simple ailments. Community health posts provide services
to roughly 5,000-10,000 people.
Community health centres (CHCs)Servicing roughly 10-20,000 people, CHCs resolve emergencies, perform
deliveries, and monitor disease trends/patterns in chiefdoms.
HospitalsEach district has a district hospital that services
20,000+ people. All referrals within the district come to this type of facility. Hospitals perform surgical operations and attend to emergencies.

27 | 27
License and Copyright
Copyright ©️2021. The Trustees of Columbia University in the City of New York. This document is licensed under the Creative Commons Attribution 4.0 International License.
Recommended Citation
Center for International Earth Science Information Network (CIESIN), Columbia University; Flowminder Foundation; United Nations Population Fund (UNFPA); WorldPop, University of Southampton. 2021. Mapping Health Facilities. Palisades, NY: Geo-Referenced Infrastructure and Demographic Data for Development (GRID3). doi:10.7916/d8-eznv-2a42. Accessed DAY MONTH YEAR.
GRID3 (Geo-Referenced Infrastructure and Demographic Data for Development) works with countries to generate, validate, and use geospatial data on population, settlements, infrastructure, and subnational boundaries. GRID3 combines the expertise of partners in government, United Nations, academia, and the private sector to design adaptable and relevant geospatial solutions based on capacity and development needs of each country.
About the partners: The GRID3 programme is funded by a grant from the Bill & Melinda Gates Foundation and the United Kingdom’s Foreign, Commonwealth & Development Office. It is managed by Columbia University’s Center for International Earth Science Information Network (CIESIN) and implemented by the United Nations Population Fund (UNFPA), WorldPop at the University of Southampton, and the Flowminder Foundation.
@GRID3Global
grid3.org
Attribution