Embed Size (px)
DESCRIPTION
Mapping Earth’s Physical Features. Presentation by Robert L. Martinez Primary Source Content: Geography Alive!. In the winter, snowboarders look for a snowy mountain to practice their sport on. In the summer, vacationers seek to cool off by a lake or river. - PowerPoint PPT Presentation
Citation preview

Mapping Earth’s Physical Features
Presentation by Robert L. MartinezPrimary Source Content: Geography Alive!

In the winter, snowboarders look for a snowy mountain to practice their sport on.

In the summer, vacationers seek to cool off by a lake or river.

These are just three landforms and bodies of water that you
might see on a physical features map.

Geographers have given names to the many landforms found on
Earth. Some landforms have distinctive shapes when viewed
from above.

A long, narrow peninsula, for example, juts out from a
continent into the ocean and is surrounded by water on three
sides.

Other landforms have distinct shapes when viewed from
ground level. Mountain ranges tower over low, flat plains.

A plateau is a raised, flat area of land.
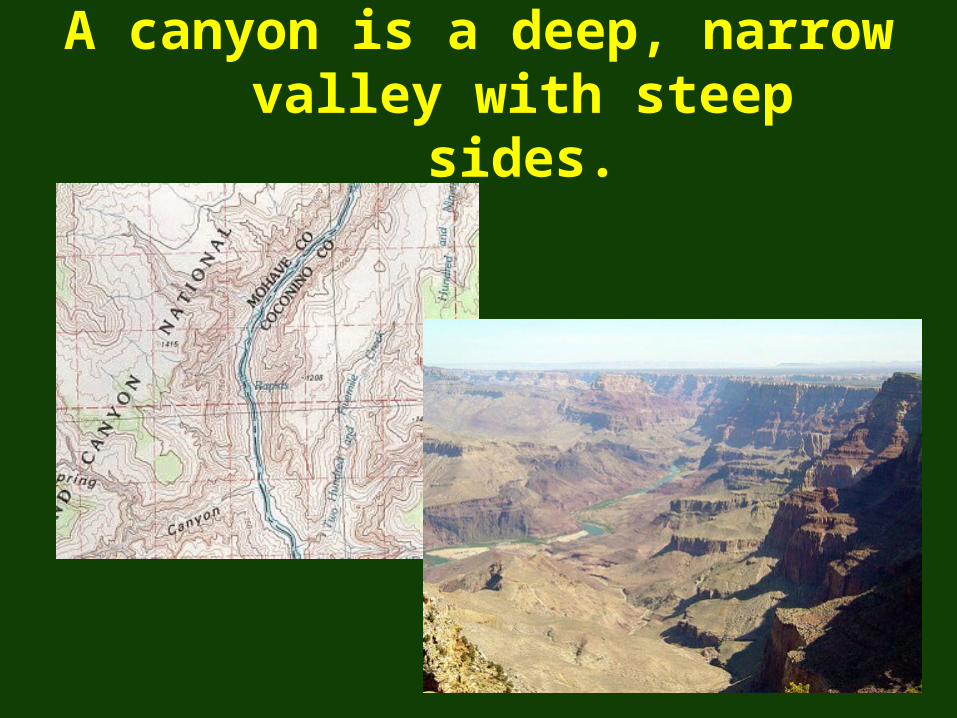
A canyon is a deep, narrow valley with steep sides.

Physical features maps show the shape of features as seen
from above.

They also show the elevation, or height above sea level, of
various features.

Theses maps typically use colors and shading to show
changes in elevation.

Geographers also label bodies of water on physical features maps.
Many kinds of water bodies appear on continents.

For instance, rivers flow down from mountains and make
their way to the sea.

Lakes are entirely surrounded by land.

Other bodies are created where oceans and seas meet continents. A
bay is part of an ocean that is enclosed by an inward-curving
stretch of coastline.

A gulf is a body of water that cuts deeply into the shoreline
and is enclosed by land on three sides.

Climate Zones
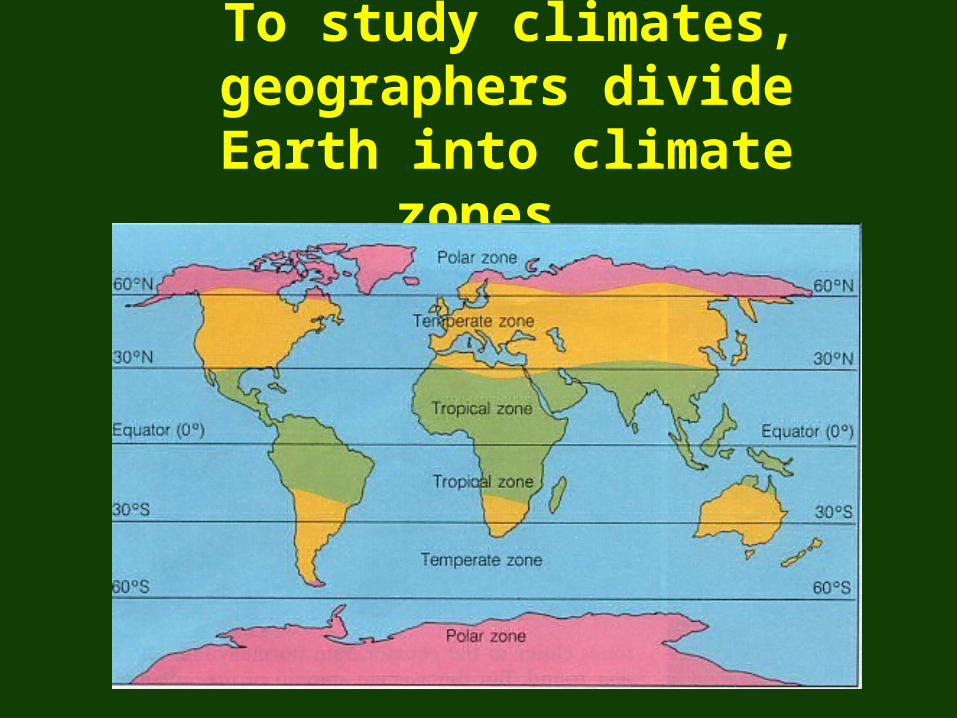
To study climates, geographers divide Earth into
climate zones.

Each zone has a particular pattern of temperature and precipitation;
rain, snow, or other forms of moisture.

This pattern is often shown on a climagraph. A climagraph shows the
average temperature and precipitation in a place over a year.

The letters at the bottom of the graph stand for the months
of the years.

The curved line indicates the average monthly temperatures…
…..while the bars show the average monthly precipitation.

Many factors affect a location’s climate, but none is more
important than latitude. Places at high elevations have colder
climates than those lower down.

Large bodies of water can also affect an area’s climate.
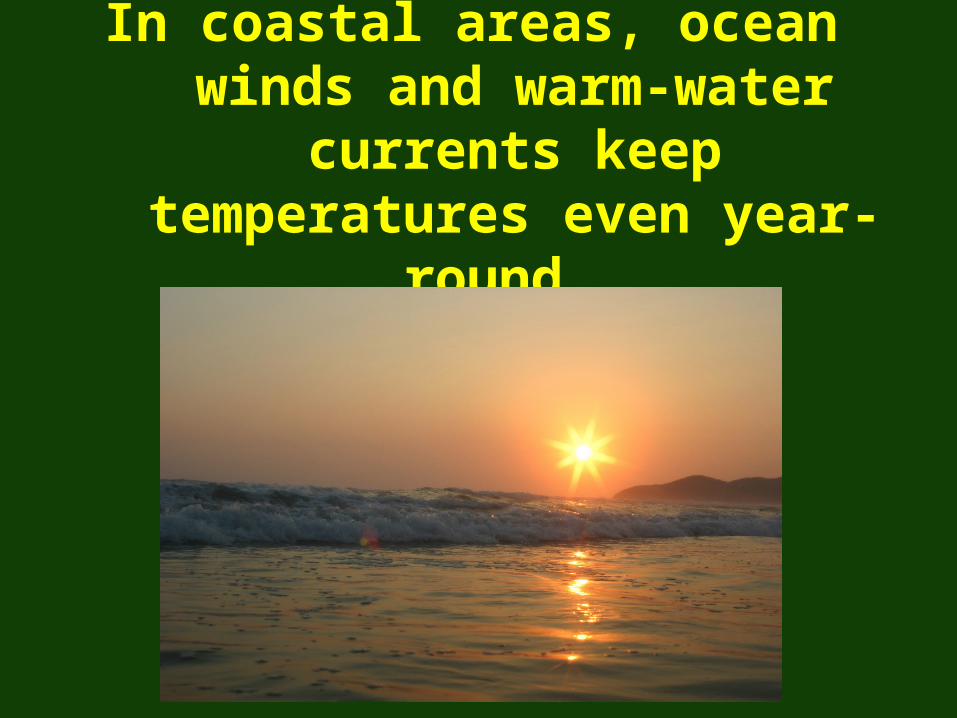
In coastal areas, ocean winds and warm-water currents
keep temperatures even year-round.

Places farther inland have more extreme climates, with hotter summers and colder
winters.

Australia has seven climate zones.