Embed Size (px)
Citation preview

JB Malone, P Nieto, P Mischler, M Martins, JC McCarrollLouisiana State University, USA
Penelope Vounatsou, Ronaldo ScholteSwiss TPH, Switzerland
ME BaviaUniversidade Federal da Bahia, Brazil
Mapping and Modeling Neglected Tropical Diseases and Poverty in Brazil, Bolivia and Colombia
International Society for Photogrammetry and Remote Sensing 2nd Symposium on Advances in Geospatial Technologies for Health
Arlington, VA, August 25-29, 2013

Objectives
• Data Portal – A resource data base accessible by FTP was developed for 6 NTD in Brazil, Bolivia and Colombia (Chagas disease, Leishmaniasis, Schistosomiasis, Leprosy, Lymphatic Filariasis and Soil-Transmitted Helminths), with relevant climatic, environmental, population and poverty data
• Risk Modeling – Maximum Entropy, Bayesian and GIS methodologies were used to map and model environmental and socioeconomic risk of 6 NTD
• Course Development – A 4-day short course was developed for training use by PAHO on data portal access and geospatial analysis using ArcGIS 9.3.1, Maximum Entropy (Maxent) and Bayesian modeling

Data Portal
All data clipped to the country boundary; WGS84 projection, 1 km spatial resolution; in ASCII format for Maxent or Bayesian modeling
This example shows the data available for Colombia
Worldclim (global coverage, Ikmresolution) used for ecological Niche modeling and by the climate change community
MODIS EVI, LST annual composites for 2005-2009
Socioeconomic Data at the Municipality level
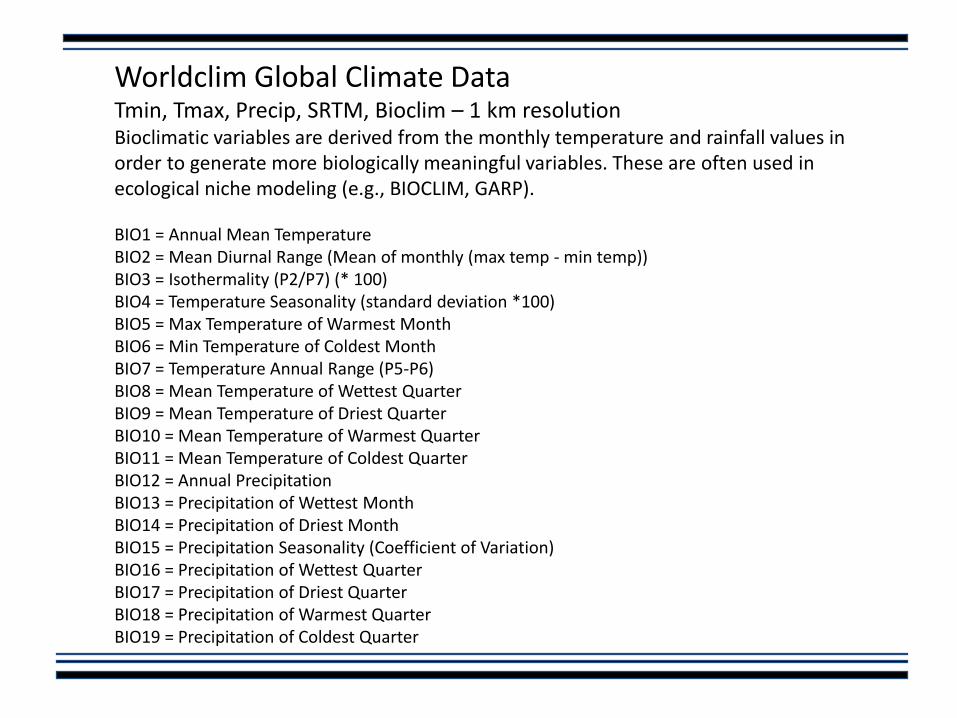
Worldclim Global Climate DataTmin, Tmax, Precip, SRTM, Bioclim – 1 km resolutionBioclimatic variables are derived from the monthly temperature and rainfall values in order to generate more biologically meaningful variables. These are often used in ecological niche modeling (e.g., BIOCLIM, GARP).
BIO1 = Annual Mean TemperatureBIO2 = Mean Diurnal Range (Mean of monthly (max temp - min temp))BIO3 = Isothermality (P2/P7) (* 100)BIO4 = Temperature Seasonality (standard deviation *100)BIO5 = Max Temperature of Warmest MonthBIO6 = Min Temperature of Coldest MonthBIO7 = Temperature Annual Range (P5-P6)BIO8 = Mean Temperature of Wettest QuarterBIO9 = Mean Temperature of Driest QuarterBIO10 = Mean Temperature of Warmest QuarterBIO11 = Mean Temperature of Coldest QuarterBIO12 = Annual PrecipitationBIO13 = Precipitation of Wettest MonthBIO14 = Precipitation of Driest MonthBIO15 = Precipitation Seasonality (Coefficient of Variation)BIO16 = Precipitation of Wettest QuarterBIO17 = Precipitation of Driest QuarterBIO18 = Precipitation of Warmest QuarterBIO19 = Precipitation of Coldest Quarter

MODIS Mean annual composites for 2005-2009:Enhanced Vegetation index (EVI), Normalized difference Vegetation Index (NDVI) Land surface temperature (LST) day and night and dT
Climate GRIDLong term normal (LTN) climate grid (18x18 km cell size) – Precip, Tmax, Tmin, PET, PPE
EnvironmentalWorld Wildlife Fund EcoregionsLocations of springs, dams, rivers, small streams
Health DataBolivia: Ministerio de Salud y Deportes/ Sistema Nacional de información en SaludBrazil: Ministerio da Saude, SINANColombia: Instituto Nacional de salud/Estadísticas de la Vigilancia en Salud Pública Ministerios de la protección Social (SIVIGILA) , literature reports.
InfrastructureRoads, airfields/airports, rail road lines layer, utility lines
Political BoundariesCounties, major cities, States/Departments, Municipalities
Contents of Data Portal/FTP Site

Socioeconomical Variables at Municipality Level Used for Risk Analysis of NTDs in Colombia
Area of municipalityFloors: carpet, marmol, hardwood,
tabletGarbage: in the river, stream, lake, lagoon
Displacement (just COL) Floors: carpet, brick , vinyl, Garbage: in another way
Population Floors: cement Drinking water from: running water service
Extension Km2Floors: tough wood, other vegetal
materialDrinking water from: well, pump
Human development index Floors: soil, sand Drinking water: rain fall
Unsatisfied basic needs * UBN Walls: block, brick, stones, hardwood Drinking water: public tank
Miseria ( 2 or more *UBN) Walls: adobe, bahareque Drinking water: car-tank
Un adequate housing * UBN Walls: rough woodDrinking water from: river, stream, lake ,
lagoon
Unsatisfied services* UBN Wall: pre fabricated walls Drinking water from: bottles, bag
Overcrowding * UBN Walls: cane, bamboo, vegetal material Infant mortality
Educational needs* UBN Walls: zinc, fabric, cardboard, plastic Life expectancy
Economical dependency*UBN No walls Attendance educational institution YES
Sewage Electricity: yes Attendance /educational institution NO
Running water Electricity: no
Toilet connected to sewage Garbage collection services
Toilet connected to septic tank Burrow the garbage
Latrine Burn the garbage
No sanitary service Garbage: patio, back yard, ditch
Table 1. Socioeconomical variables (47) selected for risk analysis of NTDs in Colombia
*UBN: http://www.dane.gov.co/files/investigaciones/boletines/censo/Bol_nbi_censo_2005.pdf

Steven J. Phillips, Robert P. Anderson, Robert E. Schapire.Maximum entropy modeling of species geographic distributions.Ecological Modelling, 190:231-259, 2006.
Opennlp.maxent package is a mature Java package for training and using maximum entropy models.
Check out the Sourceforge page for Maxent for the latest news. You can also ask questions and join in discussions on the forums.Download the latest version of Maxent.
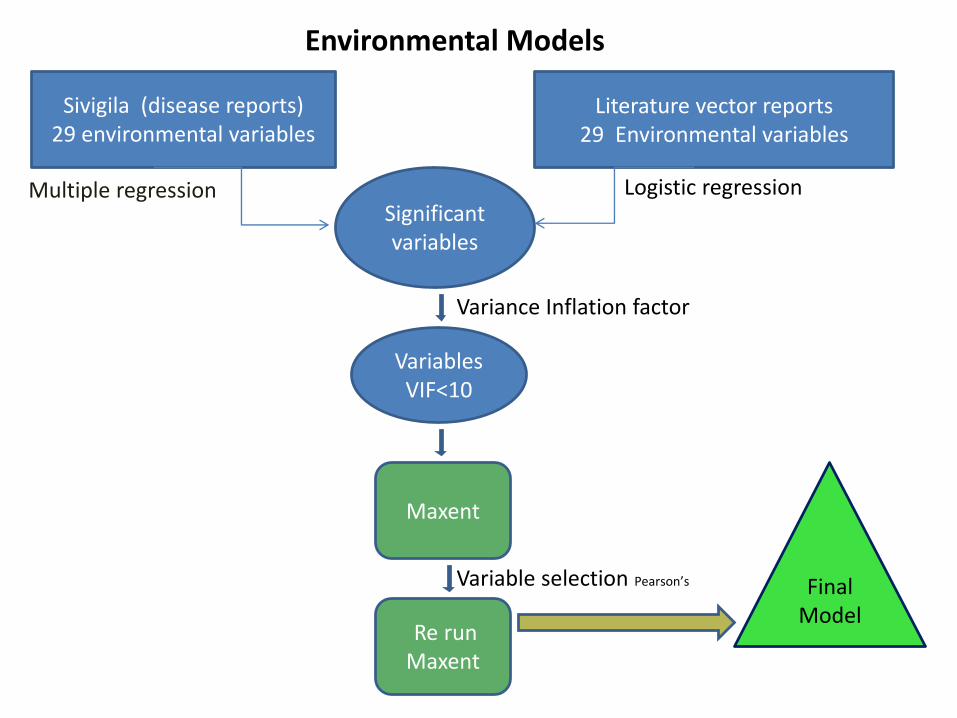
Sivigila (disease reports)29 environmental variables
Multiple regressionSignificant variables
VariablesVIF<10
Maxent
Re runMaxent
Final Model
Literature vector reports29 Environmental variables
Logistic regression
Variance Inflation factor
Variable selection Pearson’s
Environmental Models

Chagas Disease Trypanosoma cruzi - 20 million infected in
the Americas - Chronic Cardiomyopathy
Circulating Trypomastigote and Tissue
Amastigote forms in mammals
Triatomid ‘kissing’ bug vectors
Romana’s Sign
Tissue amastigote form

Chagas Vector Distribution
Ü Rhodnius prolixusEnvironmental Model
9.3
.1
Triatoma dimidiataEnvironmental Model
8.7
.1 Ü

Chagas vectors - Environmental Niche model

Chagas Environmental Niche Model

Socio-Economical Model
Hdi, ubn, dispIfm , epz
Mis, viv, ser, hac, ins, dep
Acd, poz, llu, pub , tan, queb, bot
Acu, slu, ase, acl Ino, let, nos, insp, Ent, que, pat, rioMar,bal,
cem,mad,tier, blo, tap, tan, pref, veg, zin
Multiple Regression and VIF
Choose variables for weighted models
Combined (Socio economical –
environmental)
final model
41 socio economical variables divided in 8 groups
Weighted model:
SocioEc 1
SocioEc 2
SocioEc 3
Re-classify
MaxentEnviron Model
weighted
SocioEcFinal
model
Re-classify
Re-classify
ReclassifyRe-classify
weighted
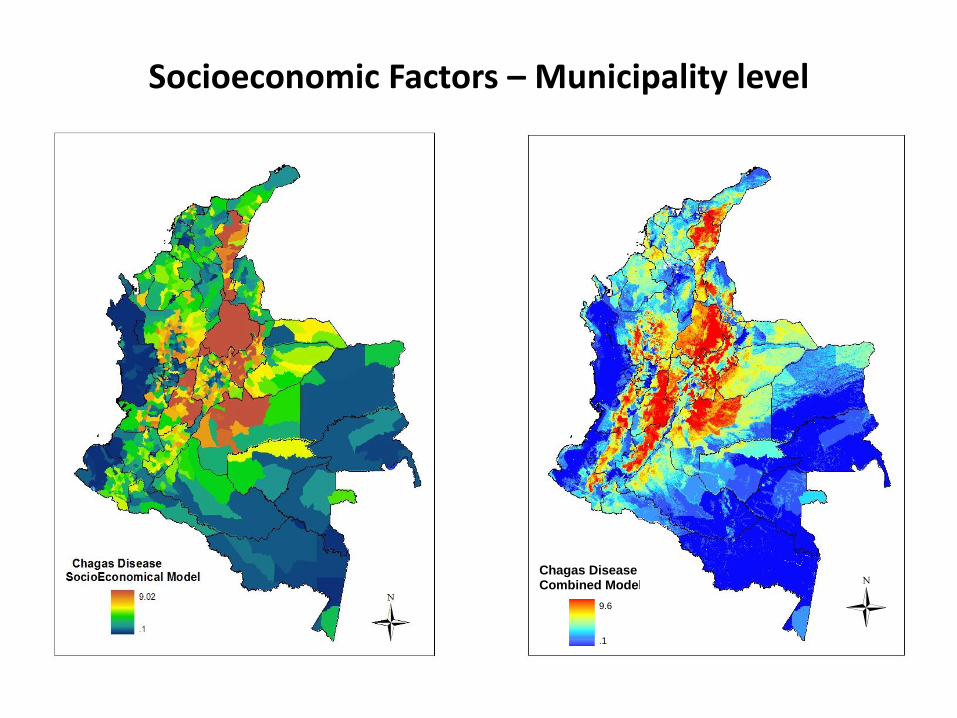
Socioeconomic Factors – Municipality level
Chagas DiseaseCombined Model
9.6
.1
Ü

Variable Percent contribution
prec02_brazil 75.3
bio14_brazil 13.1
alt01_brazil 5.4
lstnight_2008_brazil 4.5
brazil_ubn24 1.1
brazil_gdp1 0.7

Visceral Leishmaniasis
Caused by protozoans of the genus Leishmania
• Amastigote form – mammals
• Promastigote form – arthropod vector
Sandfly vector (Lutzomyia)

Leishmania spp.
Maxent Environmental Model using Worldclim dataCutaneous Leishmaniasis
Maxent Environmental Model using Worldclim dataVisceral Leishmaniasis
VL - precipitation of October (11.6%) ;
mean temperature of warmest quarter (14.5%) (AUC 0.948)
CL - precipitation of September (26.2%); annual precipitation (17.3%)(AUC 0.80)
Leishmaniasis – Visceral and Cutaneous

The predicted risk map of leprosy overlaid with
2010 leprosy occurrence data.
Maxent predictive model showing the distribution probability of leprosy occurrence. Red indicates a higher probability of occurrence, while blue indicates a low probability of occurrence.
Leprosy in Brazil

Schistosomiasis

Hookworm in Bolivia

Conclusions and Recommendations
1. Maxent Ecological Niche Modeling is a useful tool to guide surveillance and control programs for NTD, particularly where health surveillance data are scarce
2. Extrapolation of risk surfaces is of limited validity where representative survey data are absent in a given ecosystem
3. Socioeconomic data or poverty indicators should be at the census tract level; Municipality level data is typically too heterogeneous
4. Results of Maxent ecologic niche mapping and modeling should be validated by alternative methods eg. biology based GDDxWB climate models

Future Work
Maxent generated risk surfaces extracted for Bahia from national scale maps on visceral leishmaniasis (a) and cutaneous leishmaniasis (b) using MODIS environmental satellite annual composite data on vegetation index (EVI) and land surface temperature (LST).

Local Intervention
Scenarios
Environmental( 15-30 m2)
Vulnerability (census block)
CommunityProfile modeling
System
Climate Hydrology Landuse PovertyPopulation #/Density/migration
Exposure/occupation
Reservoir Hosts
Vectors
E
Vector Control
Select High, Medium, Low Risk municipalities (5 each) using SINAN case reports, vector records
Reservoir control
Surveillance Planning