Embed Size (px)
Citation preview

Using Multi-spectral Imagery in MapInfo Pro Advanced
MapInfo Pro Advanced
Tom Probert, Global Product Manager

MapInfo Pro Advanced: Intuitive interface for using multi-spectral / hyper-spectral imagery
Pitney Bowes | MapInfo Pro Advanced 2

Example use:
Pitney Bowes | MapInfo Pro Advanced 3
Walk-through of using an image with the goal of extracting areas of healthy vegetation.
Landsat 8 data is used:
http://earthexplorer.usgs.gov

Combine the different imagery bands into a single MRR
Pitney Bowes | MapInfo Pro Advanced 4

Use the Grid Calculator to remove the grid border
Pitney Bowes | MapInfo Pro Advanced 5

Display Band 1
Pitney Bowes | MapInfo Pro Advanced 6
• Highlights coastal aerosols
• Useful for imaging shallow water features - can see shallow water sea floor features.

Display Band 2
Pitney Bowes | MapInfo Pro Advanced 7
• Blue light wave lengths.• Also good for coastal areas.

Display Band 3
Pitney Bowes | MapInfo Pro Advanced 8
• Green light wave lengths.
• More detail on land.

Display Band 4
Pitney Bowes | MapInfo Pro Advanced 9
• Red wavelengths
• Adds more detail to land.

Display Band 5
Pitney Bowes | MapInfo Pro Advanced 10
• Near infrared wavelengths.
• Leaves from vegetation tend to scatter this light back into the sky
• Can be used to produce indexes like NDVI (Normalized Difference Vegetation Index) which help measure plant health.

Display Band 6 and 7
Pitney Bowes | MapInfo Pro Advanced 11
• Bands 6 and 7 cover different segments of the short wave infrared spectrum.
• Useful for distinguishing wet from dry earth and geology for different rock types.
• Different types of soil and rocks have strong contrasts in short wave infrared.

Use RGB mode
Pitney Bowes | MapInfo Pro Advanced 12
• Switch to RGB mode for control over what bands to use.

Template – Landsat 8 natural color
Pitney Bowes | MapInfo Pro Advanced 13
• Built in templates make it easy to take advantage of various ways to use Landsat 8 (and other) imagery.
Landsat 8 natural color template clipped by 2% to brighten it up

Template – False color vegetation
Pitney Bowes | MapInfo Pro Advanced 14
• Uses the short wave infrared, near infrared and green bands to highlight healthy vegetation and areas of higher moisture in the brighter green colours.
• Dry soil and bare earth or rock will be shown in the duller brown-red colours.
• Clays and moist ground in blueish colours.

Template – Healthy vegetation
Pitney Bowes | MapInfo Pro Advanced 15
• Uses the near and short wave infrared plus the blue
• The more vibrant vegetation with green foliage will show up in the reddish colours as they will reflect or scatter more infrared light.

Calculate Normalized Difference Vegetation Index (NVDI)
Pitney Bowes | MapInfo Pro Advanced 16

Pitney Bowes | MapInfo Pro Advanced 17
Healthy vegetationNormalized Difference
Vegetation Index
Natural color (brightened) Band 5 – Near infrared
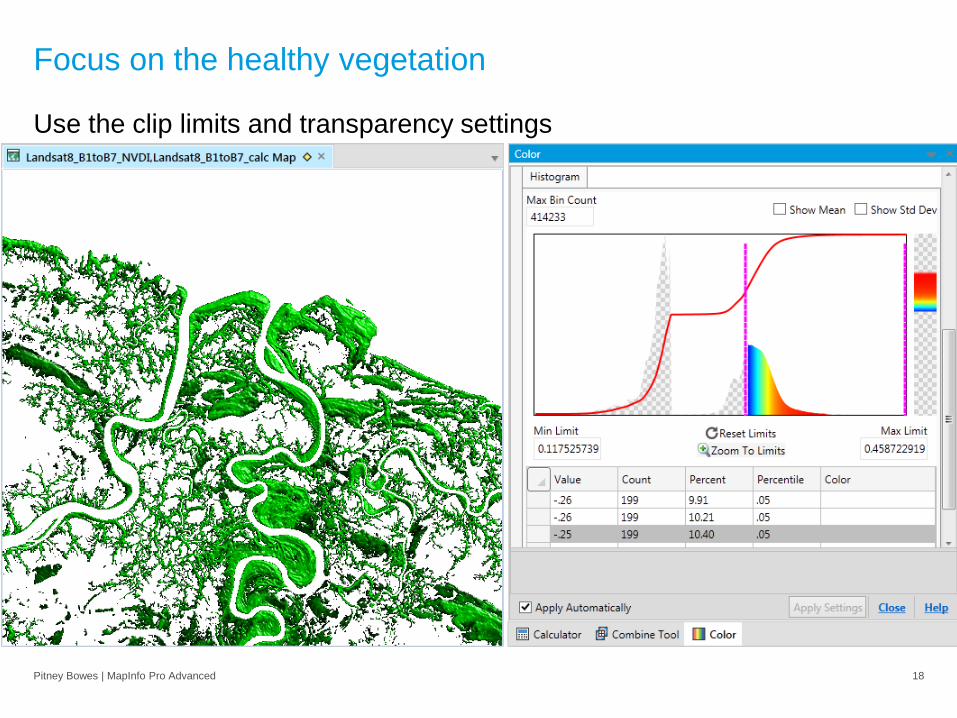
Focus on the healthy vegetation
Pitney Bowes | MapInfo Pro Advanced 18
Use the clip limits and transparency settings

Next steps…
Pitney Bowes | MapInfo Pro Advanced 19
Grids from different time periods can be compared to see the change in vegetation.• Grid calculator
The areas representing the healthy vegetation can be filtered.• Contour regions can be created to allow for
calculating the area.
Parcel data can be overlaid on the data so as to identify those parcels with areas of healthy vegetation.• Region statistics capability.

Support for using multi-spectral/hyper-spectral imagery (Landsat 8)
Pitney Bowes | MapInfo Pro Advanced 20
Landsat 8 data is freely downloadable
Multiple sensors pick up wavelengths of radiation in visible and non-visible parts of the spectrum.
Different features on the earth (and in the air) reflect light of different wavelengths in different ways.
http://earthexplorer.usgs.gov

Example uses for Landsat 8 (and other satellite data sources)
Pitney Bowes | MapInfo Pro Advanced 21
• Environmental monitoring – Vegetation health over time– Changes driven by climate change– Changes in short/long term surface water content. – Coastal erosion
• Public sector organisations can monitor the health of parks and trees
• Bush fire intensity and spread as well as recovery and regrowth.
• Agriculture (crop mapping and harvest yield).
– Imagery taken by drones is facilitating this – quick and cheap data acquisition.
– Near real-time ability to monitor the health, growth rate and yield potential of crops and plan irrigation, fertilizer and pest control to best effect.
• Urbanization
• Ground surface and water surface temperature.
• Monitor air pollution

Try MapInfo Pro Advanced
Pitney Bowes | MapInfo Pro Advanced 22
MapInfo Pro Advanced is part of the MapInfo Pro free trial download.
http://web.pb.com/miprov15-2
To help you learn how to use MapInfo Pro Advanced:
• Articles in “The MapInfo Pro” journal: http://web.pb.com/mapinfopro-archive/
• Video tutorials on our YouTube channel• http://www.youtube.com/mapinfo

Thank you
Pitney Bowes | MapInfo Pro Advanced 23
Tom Probert
MapInfo Pro Global Product Manager