Embed Size (px)
Citation preview

MAP and OAR Methods: Techniques for Developing Core Assets for Software Product Lines from Existing Assets Liam O�Brien Dennis Smith April 2002 Product Line Practice Initiative Unlimited distribution subject to the copyright.
Technical NoteCMU/SEI-2002-TN-007

The Software Engineering Institute is a federally funded research and development center sponsored by the U.S. Department of Defense.
Copyright 2002 by Carnegie Mellon University.
NO WARRANTY
THIS CARNEGIE MELLON UNIVERSITY AND SOFTWARE ENGINEERING INSTITUTE MATERIAL IS FURNISHED ON AN "AS-IS" BASIS. CARNEGIE MELLON UNIVERSITY MAKES NO WARRANTIES OF ANY KIND, EITHER EXPRESSED OR IMPLIED, AS TO ANY MATTER INCLUDING, BUT NOT LIMITED TO, WARRANTY OF FITNESS FOR PURPOSE OR MERCHANTABILITY, EXCLUSIVITY, OR RESULTS OBTAINED FROM USE OF THE MATERIAL. CARNEGIE MELLON UNIVERSITY DOES NOT MAKE ANY WARRANTY OF ANY KIND WITH RESPECT TO FREEDOM FROM PATENT, TRADEMARK, OR COPYRIGHT INFRINGEMENT.
Use of any trademarks in this report is not intended in any way to infringe on the rights of the trademark holder.
Internal use. Permission to reproduce this document and to prepare derivative works from this document for internal use is granted, provided the copyright and �No Warranty� statements are included with all reproductions and derivative works.
External use. Requests for permission to reproduce this document or prepare derivative works of this document for external and commercial use should be addressed to the SEI Licensing Agent.
This work was created in the performance of Federal Government Contract Number F19628-00-C-0003 with Carnegie Mellon University for the operation of the Software Engineering Institute, a federally funded research and development center. The Government of the United States has a royalty-free government-purpose license to use, duplicate, or disclose the work, in whole or in part and in any manner, and to have or permit others to do so, for government purposes pursuant to the copyright license under the clause at 252.227-7013.
For information about purchasing paper copies of SEI reports, please visit the publications portion of our Web site (http://www.sei.cmu.edu/publications/pubweb.html).

Contents
Abstract................................................................................................................vii
1 Introduction....................................................................................................1
2 Role of the MAP and OAR Methods in Applying the Product Parts Pattern ......................................................................................................3
3 The MAP and OAR Methods .........................................................................5 3.1 The MAP Method....................................................................................5
3.1.1 Details of the MAP Method .........................................................6 3.2 The OAR Method....................................................................................7
3.2.1 Overview of OAR Activities .........................................................7
4 An Example Use of the MAP and OAR Methods.......................................10 4.1 Scenario ...............................................................................................10 4.2 Solution Using the MAP Method...........................................................10 4.3 Results of Applying the MAP Method in the Example........................... 11
4.3.1 Component View.......................................................................11 4.3.2 Architectural Styles and Attributes ............................................12 4.3.3 Execution View .........................................................................13 4.3.4 Data-Flow View.........................................................................14 4.3.5 Analysis of Styles and Attributes...............................................15
4.4 Extended Example Showing the OAR Method .....................................15 4.4.1 Results of Applying the OAR Method to the Example
Scenario....................................................................................16
5 Conclusion ...................................................................................................19
References...........................................................................................................21
CMU/SEI-2002-TN-007 i

ii CMU/SEI-2002-TN-007

List of Figures
Figure 1: The Product Parts Pattern ......................................................................3 Figure 2: Steps in the MAP Method........................................................................7 Figure 3: Overview of OAR Activities .....................................................................8 Figure 4: Feedback Process-Control Environment ..............................................10 Figure 5: Calls Relations in Product P1 ...............................................................12 Figure 6: Styles and Attributes of Products P1, P2, and P3 .................................13 Figure 7: Blackboard Environment of Products P1, P2, and P3...........................14
CMU/SEI-2002-TN-007 iii

iv CMU/SEI-2002-TN-007

List of Tables
Table 1: Component Table..................................................................................16 Table 2: Options Table ........................................................................................18
CMU/SEI-2002-TN-007 v

vi CMU/SEI-2002-TN-007

Abstract
While it is commonly recognized that legacy assets are, in most cases, an important contributor to the core assets for software product lines, systematic methods for making decisions on when to incorporate legacy assets (versus building new assets) have not been available. Two methods developed by the Software Engineering Institute fill this gap: the Mining Architectures for Product Lines (MAP) method and the Options Analysis for Reengineering (OAR) method.
Both of these methods, which are described in this report, support different aspects of the Product Parts Pattern, which is applied to develop the core assets for a product line. The MAP method provides a suitability analysis of existing systems' software architectures as candidates for a product line architecture. After an architecture has been developed or chosen, the OAR method provides a disciplined approach for making decisions on rehabilitating legacy assets that may be incorporated into the product line asset base.
This technical note describes both the MAP and OAR methods, the activities that each involves, and examples of applying them.
CMU/SEI-2002-TN-007 vii

viii CMU/SEI-2002-TN-007
1 Introduction
Software product lines1 have delivered substantial improvements in productivity and quality, as well as savings in cost and time to market. Clements and Northrop [Clements 01] present a software product line framework that identifies 29 essential practice areas that are required to successfully implement a product line.
In addition, Clements and Northrop apply the concept of patterns to help organizations decide which groupings of practice areas to apply in specific situations. Patterns are a way of expressing common contexts and problem/solution sets. When used in a product line context, patterns identify common problems that organizations encounter in implementing product lines and a set of practice areas and the relations between them, which will enable the organization to address the problem. This enables an organization to quickly focus on the practices that are required for the task at hand.
One of these patterns, the Product Parts Pattern, is applied to develop the core assets for a product line. In developing core assets, it is often desirable to mine assets from existing systems. However, it is difficult to make informed decisions on the relevance of existing assets and the types of changes that would be required to make them suitable for inclusion in the product line asset base.
This technical note focuses on two methods developed by the Software Engineering Institute (SEI) that can be used to support the application of the Product Parts Pattern in making decisions about using existing assets as potential core assets for product lines. The Mining Architectures for Product Lines (MAP) method addresses assets at the architecture level [O�Brien 01],2 while the Options Analysis for Reengineering (OAR) method addresses assets at the component level [Bergey 01].
Section 2 of this document describes the role of the MAP and OAR methods within the Product Parts Pattern. Section 3 describes the MAP and OAR methods. Section 4 summarizes
1 A software product line is set of software-intensive systems sharing a common, managed set of
features that satisfy the specific needs of a particular market segment or mission and that are developed from a common set of core assets in a prescribed way [Clements 01].
2 The MAP method can also be used to support other product line patterns. For example, in the What to Build Pattern, there is a need to determine the commonalities among existing products so you can decide which products to include in the product line. Also, in the Forced March Pattern, a similar understanding of an organization�s existing systems is required to distill out the commonalities and variations. These uses of the MAP method are not explored in this technical note.
CMU/SEI-2002-TN-007 1

an example in which the MAP and OAR methods are used together. Section 5 provides conclusions and suggests possible next steps.
2 CMU/SEI-2002-TN-007

2 Role of the MAP and OAR Methods in Applying
the Product Parts Pattern
In developing a product line, a number of core assets are required including the product line requirements, architecture, components, and testing artifacts. These assets can be built from scratch, bought or contracted for, or mined from existing assets. The Product Parts Pattern suggests how to use the practice areas and other patterns in developing or acquiring these assets. Figure 1 illustrates what practice areas work together in the Product Parts Pattern to develop the core assets.
Requirements
COTSUtilization
Each Asset
TestingSoftwareSystemsIntegration
Each AssetArchitecture
Components
Testing
Data Flow
Make/Buy/Mine/Commission Analysis
Each Asset
MiningExistingAssets
Developingan Acquisition
Strategy
ArchitectureEvaluation
Each Asset
Informs Requirements
COTSUtilization
Each Asset
TestingSoftwareSystemsIntegration
Each AssetArchitecture
Components
Testing
Data Flow
Make/Buy/Mine/Commission Analysis
Each Asset
MiningExistingAssets
Developingan Acquisition
Strategy
ArchitectureEvaluation
Each Asset
Informs Informs
Figure 1: The Product Parts Pattern
As shown in Figure 1, the product line requirements drive the product line architecture and component definition. The Each Asset Pattern for architecture delivers the product line architecture that specifies the components. In performing an Each Asset analysis for architecture, it is often relevant to analyze the role that existing architectures may play in satisfying the needs for variability and commonality that are required for the product line.
The MAP method [O�Brien 01] analyzes the architectures of existing systems and the commonalities and variabilities across these architectures. It determines whether a product line is feasible and whether some of the knowledge already gained from the analysis can be
CMU/SEI-2002-TN-007 3

reused. The MAP method can be used to analyze multiple systems to understand their architectures. Because the MAP method performs an analysis of the existing systems, including the identification of existing components, it also provides information on where to look for legacy components.
After an architecture is selected or developed, components need to be developed to implement the product line�s architecture. Figure 1 shows that the �Make/Buy/Mine/Commission� practice area determines whether these components will be built, purchased, mined, or commissioned.
The Make/Buy/Mine/Commission analysis determines how individual assets come to be. As a result of the MAP method, the organization will have knowledge of the existing components. This knowledge can be used as input to choosing the asset-sourcing approach. Once these decisions are made, other technical practice areas and patterns are used to develop the assets, mine them, acquire commercial off-the-shelf (COTS) assets, or create or commission the assets.
If the components are to be mined from one or more existing systems, the �Mining Existing Assets� practice area will be required. You must know which assets are appropriate for mining, how to rehabilitate them, and how much the changes will cost. The OAR method provides a disciplined approach for making detailed technical decisions in support of the �Mining Existing Assets� practice area, such as whether it is feasible to mine certain components.
To demonstrate how the MAP and OAR methods fill a role in the Product Parts Pattern, each is described briefly in Section 3. Section 4 outlines a product line scenario and summarizes how the MAP and OAR methods could be used to support the scenario. The results are then related to other practice areas within the Product Parts Pattern.
4 CMU/SEI-2002-TN-007

3 The MAP and OAR Methods
This section gives an overview of the MAP and OAR methods and describes the activities involved in each one.
3.1 The MAP Method As mentioned earlier, the goal of the Product Parts Pattern is to develop core assets for a product line. An existing software architecture can provide strong leverage if it can evolve to be the product line architecture, or if parts of the architectures of existing systems can be reused in the development of the product line architecture. However, many existing software architectures were not originally constructed to be reused in the development of multiple products; they do not have robust variation mechanisms to address needed variability in the required features and quality attributes. In addition, most current architectures don�t have enough documentation to determine whether and how they may be suitable. An analysis is necessary to determine the usefulness of the legacy architectures.
The MAP method [O�Brien 01] provides such analysis. It determines whether the architectures are similar and whether the corresponding systems have the potential of becoming a software product line. These systems can be from the same domain, such as engine controller, or from similar domains, such as window lifter and sunroof.
The MAP method analyzes the architectural styles and attributes of a set of systems. This analysis determines if there are similar components and connections between the components within these systems and examines their commonalities and variabilities. It combines techniques for architecture reconstruction (extracting information from the source code and building architectural views of the system) and product line analysis (examining the quality attributes and determining their commonalities and variabilities).
The MAP method provides a detailed understanding of the architectures and components of a set of existing products. It may be possible to reuse parts of the architecture when developing the product line architecture. Identifying the set of components within these systems can also assist in the mining process (discussed in Section 4.4).
CMU/SEI-2002-TN-007 5

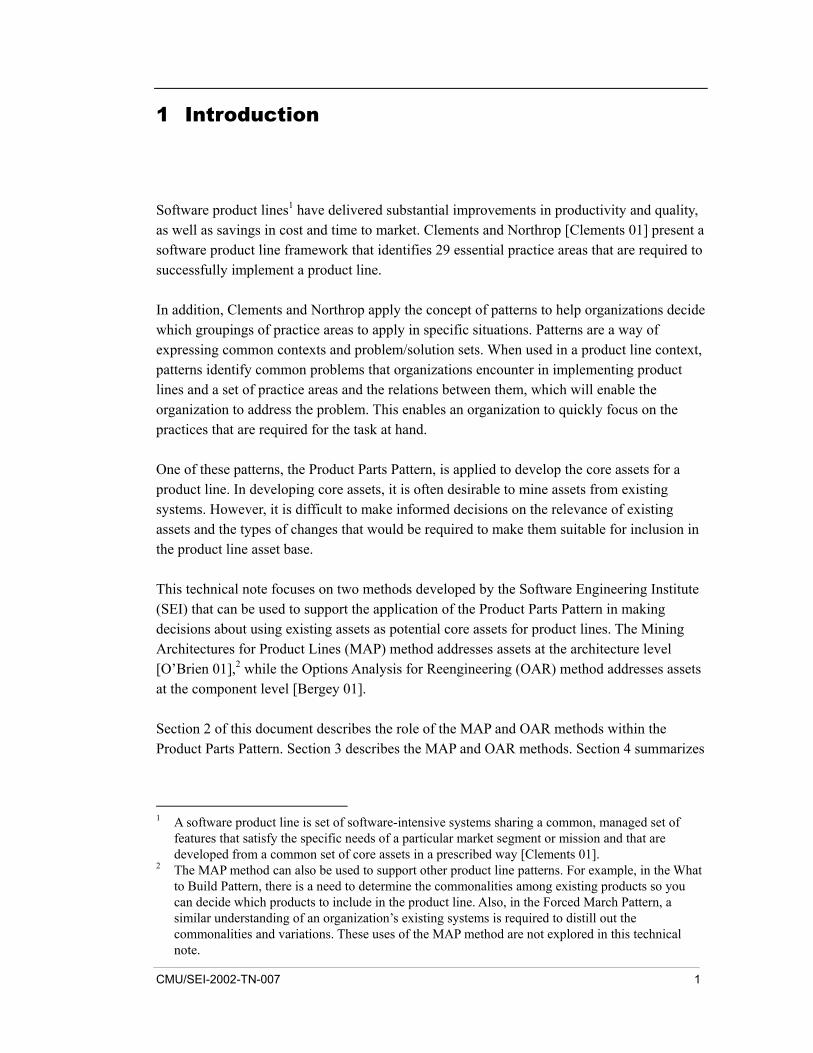
3.1.1 Details of the MAP Method The MAP method involves the following six steps, which are illustrated in Figure 2:
1. Preparation�identifying the organizational and technical issues (such as the motivations for moving to a product line approach and the people who are available to assist in the analysis effort) and selecting the candidate systems to be analyzed. These systems should be representative of the overall set of systems from which the organization wants to create a product line. And these systems may be from the same domain or related domains as noted above.
2. Extraction�extracting information from the source code of each system and putting it into a database for further manipulation. This information consists of a set of elements (functions, files, variables, etc.) and relations between these elements (calls, uses_variable, etc.). Along with the static information from the source code, dynamic information (such as the actual set of functions called or dynamic configuration details) may be used if available. In many cases, it is not. Kazman and associates discuss this in more depth [Kazman 01].
3. Composition�establishing several component views of the system. Abstracting the source information to identify components and the relationships among them generates these views. This is the key step for capturing candidate structures for the commonality and variability evaluation.
4. Qualification�mapping known architectural styles and quality attributes (performance, safety, etc.) to the system and its components
5. Evaluation�evaluating the candidate architectures and systems to determine their commonalities, variabilities, and other attributes. Evaluations could involve
• analyzing customer- and system-specific features • variation points in customer features, protocols, operating systems, and
hardware • domain vocabulary, such as vocabularies for requirements, design, and
implementation; and specialized vocabularies, such as customer-specific terminology
• product evolution, such as the evolution of a system from an autonomous system to a network device
• quality attributes, such as safety, performance, and timing constraints 6. Follow-on�recommending next steps and follow-up activities
The outputs of applying the MAP method make up a detailed analysis of the architectures of several systems and identify their commonalities, variabilities, and other quality attributes. This information can lead to the development of a product line architecture for these systems.
6 CMU/SEI-2002-TN-007
Preparation
Evaluation
Follow-on
Commonalities and Variabilities
Components, Views, Styles, and Attributes
For Each Candidate
Extraction
Qualification Composition
Product Candidates
Preparation
Evaluation
Follow-on
Commonalities and Variabilities
Components, Views, Styles, and Attributes
For Each Candidate
Extraction
Qualification Composition
Product Candidates
Figure 2: Steps in the MAP Method
3.2 The OAR Method Referring back to Figure 1 and the Product Parts Pattern, a product line architecture must be populated with components. The Make/Buy/Mine/Commission analysis is used to decide how to get the product line assets, including the components. The OAR method can be used to inform this analysis. In addition, if mining is selected, the OAR method can be used to identify potential reusable components (to satisfy the component needs defined in the architecture) and to analyze the changes that would be needed to rehabilitate them for the product line. The OAR method identifies mining options, and the cost, effort, and risks associated with each one.
Because of the difficulty of identifying potential components to mine, projects have often deferred mining decisions indefinitely or gone to an �all or nothing� approach. The lack of discrimination based on sound decision criteria is surely not good business practice, let alone good product line practice. The OAR method addresses this problem by establishing a more formalized approach to making decisions about mining software components.
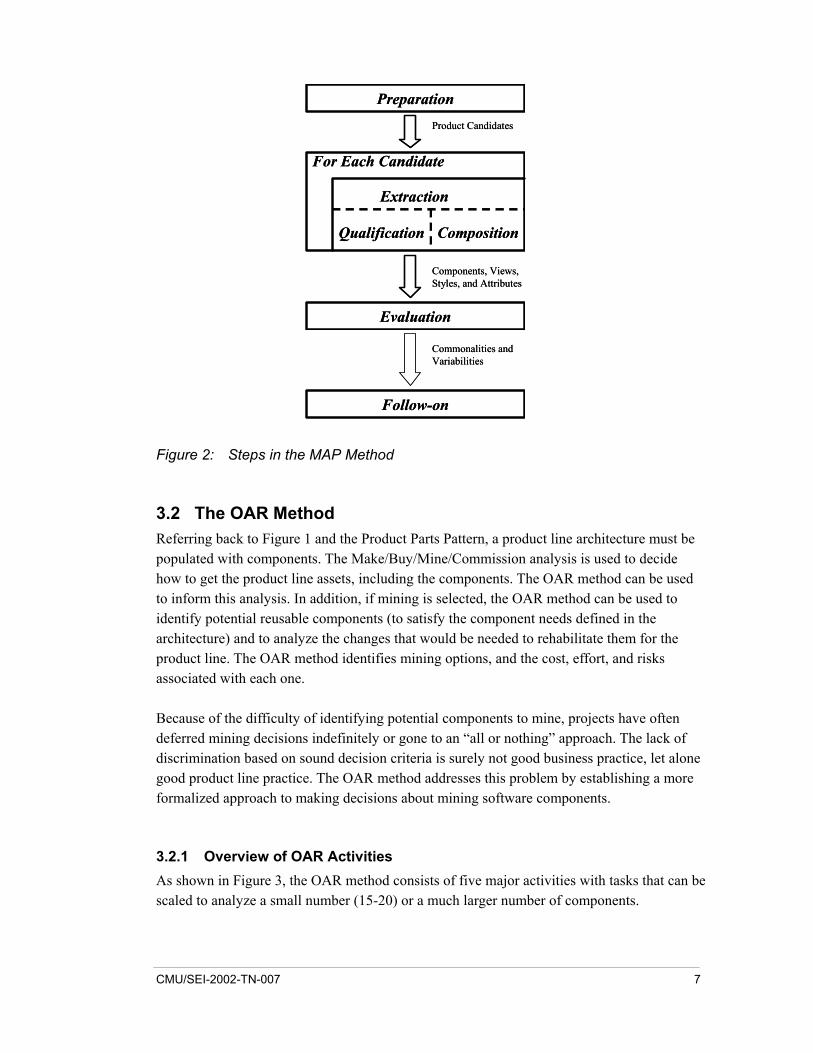
3.2.1 Overview of OAR Activities As shown in Figure 3, the OAR method consists of five major activities with tasks that can be scaled to analyze a small number (15-20) or a much larger number of components.
CMU/SEI-2002-TN-007 7

EstablishMiningContext
EstablishMiningContext
InventoryComponents
InventoryComponents
AnalyzeCandidate
Components
AnalyzeCandidate
Components
PlanMining
Options
PlanMining
Options
SelectMiningOption
SelectMiningOption
Context-Driven Activities
PerformSpecialized
Task(s)
PerformSpecialized
Task(s)
PerformSpecialized
Task(s)
PerformSpecialized
Task(s)
KeyActivity Specialized
TaskInformation Flow
EstablishMiningContext
EstablishMiningContext
InventoryComponents
InventoryComponents
AnalyzeCandidate
Components
AnalyzeCandidate
Components
PlanMining
Options
PlanMining
Options
SelectMiningOption
SelectMiningOption
Context-Driven Activities
PerformSpecialized
Task(s)
PerformSpecialized
Task(s)
PerformSpecialized
Task(s)
PerformSpecialized
Task(s)
EstablishMiningContext
EstablishMiningContext
InventoryComponents
InventoryComponents
AnalyzeCandidate
Components
AnalyzeCandidate
Components
PlanMining
Options
PlanMining
Options
SelectMiningOption
SelectMiningOption
EstablishMiningContext
EstablishMiningContext
InventoryComponents
InventoryComponents
AnalyzeCandidate
Components
AnalyzeCandidate
Components
PlanMining
Options
PlanMining
Options
SelectMiningOption
SelectMiningOption
Context-Driven Activities
PerformSpecialized
Task(s)
PerformSpecialized
Task(s)
PerformSpecialized
Task(s)
PerformSpecialized
Task(s)
PerformSpecialized
Task(s)
PerformSpecialized
Task(s)
PerformSpecialized
Task(s)
PerformSpecialized
Task(s)
KeyActivity Specialized
TaskInformation Flow
Figure 3: Overview of OAR Activities
Each activity, described below, has a set of tasks and subtasks that enables it to meet its goals.
3.2.1.1 Establish Mining Context Activity
The Establish Mining Context activity establishes an understanding of the organization�s product line or new single-system needs, legacy base, and expectations for mining legacy components. This activity develops a baseline of the goals and expectations (such as what the organization hopes to achieve from mining assets and how doing so relates to other product line activities) for the mining project and the component needs that mining will address. It also determines the programmatic and technical drivers for making decisions, reviews legacy systems and documentation, and selects a set of potential candidate components for mining.
3.2.1.2 Inventory Components Activity
The Inventory Components activity identifies the legacy system components that meet product line needs and have the potential to be mined for use as product line components, but that will require more detailed analysis.
In this activity, the characteristics of the product line components� needs are identified, such as the programming language in which the components are implemented and the need for a component to satisfy particular quality attributes. Legacy components are evaluated based on these criteria; those that don�t meet the criteria are screened out. This activity results in an inventory of candidate legacy components that fulfill component needs.
8 CMU/SEI-2002-TN-007
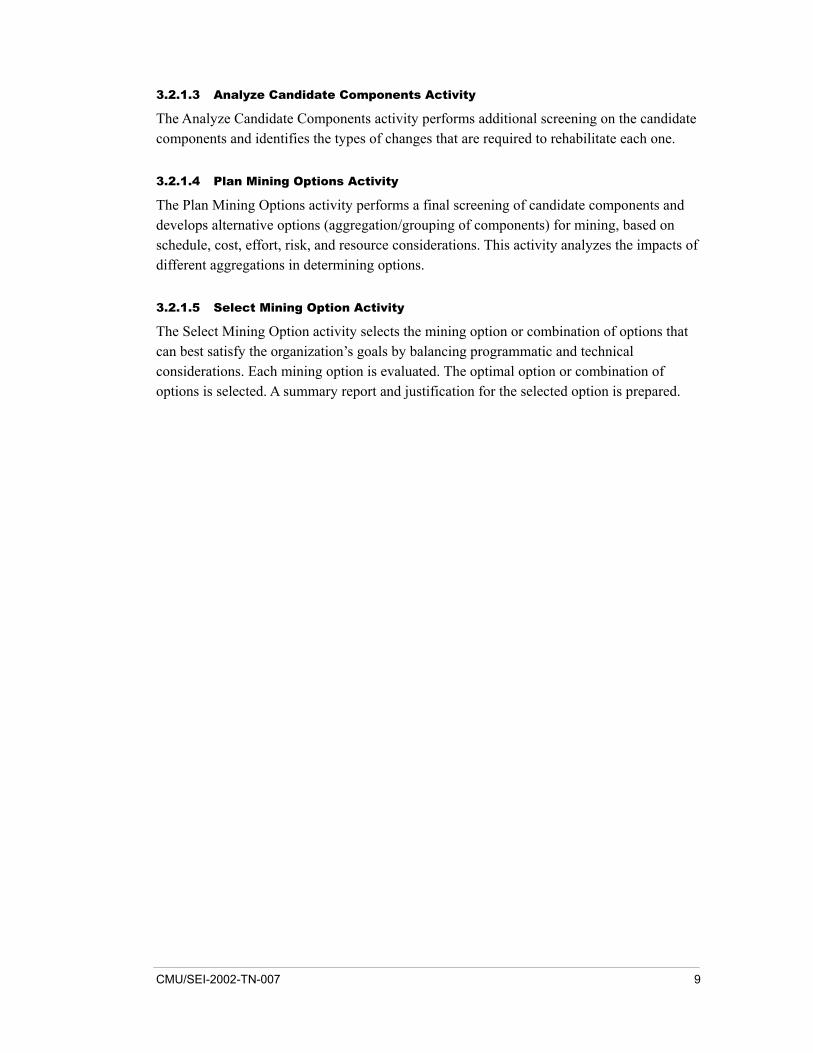
3.2.1.3 Analyze Candidate Components Activity
The Analyze Candidate Components activity performs additional screening on the candidate components and identifies the types of changes that are required to rehabilitate each one.
3.2.1.4 Plan Mining Options Activity
The Plan Mining Options activity performs a final screening of candidate components and develops alternative options (aggregation/grouping of components) for mining, based on schedule, cost, effort, risk, and resource considerations. This activity analyzes the impacts of different aggregations in determining options.
3.2.1.5 Select Mining Option Activity
The Select Mining Option activity selects the mining option or combination of options that can best satisfy the organization�s goals by balancing programmatic and technical considerations. Each mining option is evaluated. The optimal option or combination of options is selected. A summary report and justification for the selected option is prepared.
CMU/SEI-2002-TN-007 9

4 An Example Use of the MAP and OAR Methods
4.1 Scenario An automotive organization is considering the development of a software product line for the software that controls some of its automotive systems.
The organization wants to analyze several of its legacy automotive systems to determine the commonalities and variabilities across these systems and to determine whether, from a technical viewpoint, it should undertake a software product line approach.
The legacy systems run in a small, embedded system that�s characterized by a feedback process-control environment. In this environment, the rotation of a motor moves an object, such as a power window or sunroof, depending on a desired object position (see Figure 4). A sensor provides pulses as a feedback to the process control.
4.2 Solution Using the MAP Method Two similar domains, sunroof and window lifter, were selected for analysis. Two products (P1, P2) were selected from the sunroof domain, and one product, P3, was selected from the window-lifter domain. Due to the two domains� similarity, if the structure of product P3 could be mapped to products from other domains, the product line architecture could be extended to include products from both domains and a broader range of potential products than had been initially planned.
Desired
Position
Process Control Motor
Rotation
Pulses
Desired
Position
Process Control Motor
Rotation
Pulses
Figure 4: Feedback Process-Control Environment
The MAP method was used to identify whether the two products from the sunroof domain have commonalities that would make it feasible to create a common product line architecture for these products and to determine if the window-lifter product could also be moved to this common architecture. The results of applying the MAP method are summarized below.
10 CMU/SEI-2002-TN-007

After the architecture has been designed, the OAR method can be used to determine if some of the components in the existing systems can be reused as assets in the new product line. The OAR method can be applied to assist the organization in making that determination. In Section 4.4.1, the results of a possible application of the OAR method in this scenario are outlined.3
4.3 Results of Applying the MAP Method in the Example In the Extraction step, a set of elements and relations were extracted from the source code and loaded into the Dali Workbench [SEI 02]. A set of abstractions was applied to this information to aggregate elements into components. Several views of the components showing different relations were generated. By analyzing the views, it was possible to identify the use of several known architectural styles within the software including the blackboard style, the cyclic executive style, and some layering (though it was not strict).
After completing the Extraction, Composition, and Qualification steps, O�Brien and Stoermer compared the different reconstructed architectures and evaluated them for their application to a potential product line [O�Brien 01].
4.3.1 Component View The commonalities and variabilities that are an important attribute of a product line architecture are captured at a component level. Architectures that don�t address commonalities and variabilities are not suitable candidates for migration to a product line.
First, the component views were represented. Figure 5 illustrates one of the component views for product P1. In this case, the view shows a set of components that has been aggregated from a set of functions, variables, and files. The relation shown between the components is the aggregation of the calls between functions in the components.
The analysis of the components� calls relations and interface and syntax semantics revealed that products P1 and P2 are similar from a structural perspective because
• They have almost the same set of components.
• Those components have very similar calls relations.
• Those components exhibit similar data usage.
On the other hand, product P3 has substantial structural differences from the other two products. Although product P3 shares a number of the same components, it has a number of 3 The example using the MAP method reflects work that was performed on an automotive system.
The example using the OAR method is taken from an application of the OAR method in a different domain that has been modified to support the automotive scenario and that represents a hypothetical extension of the MAP example.
CMU/SEI-2002-TN-007 11

Aggregated calls relations
Component KeyKeyKey
Aggregated calls relations
Component Aggregated calls relations
Component
additional unique components as well. Product P3 also has extra relationships between components and a similar data usage within and across components.
Figure 5: Calls Relations in Product P1
4.3.2 Architectural Styles and Attributes O�Brien and Stoermer also examined the architectural styles of the reconstructed systems to determine whether they were similar enough to be combined in a common product line architecture [O�Brien 01].
The styles and attributes used in all three products are illustrated in Figure 6.
The main architectural style used in products P1, P2, and P3 was a feedback process-control style. Feedback process-control styles are used in reactive systems. Such systems are confronted mostly with disparate, discrete events that require the systems to switch between different behavior modes (e.g., between controlling motions and adjusting the base position). In their report, O�Brien and Stoermer summarize the execution4 and data-flow5 views because these views offered substantial input into the decision to migrate to a product line. Other views, such as code or logical views, can be produced. However, O�Brien and
12 CMU/SEI-2002-TN-007
4 An execution view describes the dynamic structure of a system. 5 A data-flow view shows how data flows among the major software components in a system.

Stoermer found that the execution and data flow, along with other analysis, provided the information needed to support the move to a product line.
Cyclic Executive
State Machine
Feedback Process Control
Blackboard
Performance
Safety
Communication
Execution
Data Exchange
Control Attributes
Functional View
Data-Flow View
Execution View
State-Transition View
Functional View
Data-Flow View
Style
Attributes
Key
Cyclic Executive
State Machine
Feedback Process Control
Blackboard
Performance
Safety
Communication
Execution
Data Exchange
Control Attributes
Functional View
Data-Flow View
Execution View
State-Transition View
Functional View
Data-Flow View
Style
Attributes
Key
Figure 6: Styles and Attributes of Products P1, P2, and P36
4.3.3 Execution View To establish the execution view, O�Brien and Stoermer asked the following questions:
• In which sequence are tasks executed?
• Are critical and less critical operations distinguished?
Figure 5 shows that the MAIN component calls all other components. By examining the MAIN component�s code (identified as the main function) and analyzing the calls from the main function to functions in the other components, O�Brien and Stoermer found that the MAIN component uses a cyclic executive style. And by analyzing that executive, they identified three execution levels that are common for products P1, P2, and P3:
1. interrupt level
2. critical events level
3. less critical level
CMU/SEI-2002-TN-007 13
6 The label for the Communication circle in this figure is blank because it represents information
proprietary to the organization for which the MAP method was applied.

The cyclic executive handles the safety and performance attributes to give these critical qualities the highest priority. By talking with the developers and maintainers and looking at existing documentation, O�Brien and Stoermer obtained other information about these products. For example, while all three systems use a cyclic executive, product P3 uses a different timing approach in its executive.
4.3.4 Data-Flow View The variables accessed in the implementation model showed the central position of the Blackboard architecture style in each of the systems.
In a blackboard environment, there are typically no direct algorithmic solutions to a problem. The problem has to be divided into several computational steps, each of which is a knowledge source and which together form the solution through a set of rules.
The same blackboard environment, shown in Figure 7, is common in products P1, P2, and P3. It occupies shared data space where a set of global variables is defined in several files and used in various functions throughout the systems.
cyclic executive
less critical
critical events
interrupt
Blackboard
sync data
non-sync
statesvariables
cyclic executive and data
exec functions
Key
Executes
Accesses and Sets
cyclic executive
less critical
critical events
interrupt
Blackboard
sync data
non-sync
statesvariables
cyclic executive and data
exec functions
Key
Executes
Accesses and Sets
Figure 7: Blackboard Environment of Products P1, P2, and P3
14 CMU/SEI-2002-TN-007

4.3.5 Analysis of Styles and Attributes Based on this evidence and other data they reported, O�Brien and Stoermer concluded that the styles and attributes (e.g., timing requirements) of products P1 and P2 are identical [O�Brien 01]. Product P3 uses a similar blackboard style, and uses the cyclic executive style, but has a different timing mechanism for the cyclic executive.
O�Brien and Stoermer also analyzed the variable names in terms of their generality and potential usefulness for a product line. They found that
• The terminology used for variable and function names is predominantly at a physical level (e.g., port_123 for speed).
• User activities are hardwired to a specific feature (e.g., button_500ms_pressed for calibrate position). This makes decoupling certain customer requirements from system features difficult.
Based on the results of the evaluation, they recommended the following:
• A migration towards a product line architecture for products in the sunroof domain makes sense from an architectural point of view. There should be an attribute-driven design (ADD) effort at the organization to fully define the product line architecture and to transfer further products into a product line [Bachmann 00]. ADD is a method for designing the software architecture of a product line to ensure that the resulting products have the desired qualities. Parts of the existing products� architectures may be reused in defining the product line architecture.
• Because of the similarities of architecture styles and comparable functionality, a prototype effort based on the ADD method should investigate a common product line for products in the sunroof and window-lifter domains.
Based on this analysis, a prototype product line architecture was implemented, and a successful prototype system was developed that reused parts of the existing products� architectures and some of their components. Thus, the MAP method provided important input on making decisions for the reuse of existing architectures in support of the Product Parts Pattern.
4.4 Extended Example Showing the OAR Method To extend this example, we define a scenario where the organization decides to move towards a product line and develop a product line architecture for the products in the sunroof domain. The organization wants to determine if parts of the existing sunroof products can be reused to satisfy the component needs of the new product line. The OAR method can be used to make decisions on mining components. The following section outlines the results of such a scenario.
CMU/SEI-2002-TN-007 15

4.4.1 Results of Applying the OAR Method to the Example Scenario During the Establish Mining Context activity, a set of drivers for making decisions on candidate components was established, including interface flexibility, the satisfaction of real-time constraints, portability and interoperability, and the high level of code quality (i.e., high cohesion, low coupling).
Four types of component needs for the new product line were selected for investigation during the application of the OAR method:
1. clock
2. position determination
3. user interface
4. anti-trap capabilities
During the Inventory Components activity, six legacy system components were selected as mining candidates to satisfy these needs. These components were selected by examining the existing sunroof components and matching them to the product line component needs. The selected components include two clocks (Clock-A and Clock-B), a position determination (PTION), two user interfaces (UI-1 and UI-2, based on different customer configurations), and an anti-trap subsystem (Anti-Trap).
During the Analyze Candidate Components activity, the identified components were analyzed to evaluate their potential for use in the new architecture. As the analysis proceeds throughout each activity, a Component Table is filled out, such as Table 1.
Legacy System Black-Box / Level Support Level Level Mining Mining New New Comp.2 Comp.Software White-Box of Software of of Effort Cost Devel. Devel. Cost of Effort of
Components Suitability Changes Required Diff Risk (mm)1 Effort (mm) Cost Mining Mining
Clock-A BB None S&D Files3 1 Low 0.1 $1,000 7.7 $76,567 1% 1%Clock-B BB None S&D Files 1 Low 0.1 $1,000 16.3 $162,567 1% 1%
PTION BB None S&D Files 1 Low 0.1 $1,000 14.0 $139,533 1% 1%
UI-1 WB (minor) Minor (10%) S&D Files 2 High 2.2 $22,000 30.7 $306,733 7% 7%UI-2 WB (minor) Minor (10%) S&D Files 2 High 1.3 $13,000 14.7 $147,067 9% 9%
Anti-Trap WB (major) Major (50%) S&D Files 4 Low 8 $80,000 18.1 $180,567 44% 44%
1 mm means man month 12 $118,000 101 $1,013,033 12% 12%2 Comp. Means Comparative3 S&D are Script and Data Files
TOTALs
Table 1: Component Table
16 CMU/SEI-2002-TN-007

Table 1 shows that three potential legacy components were identified for wrapping (the two clocks and the position determination). These components would not require changes to their internal programs. The other three components (the two user interface components and the anti-trap subsystem) were identified as potential white-box components where changes inside the programs would be required.
The components were analyzed and the basic types of changes required to rehabilitate these components were identified. Cost and effort estimates were made for developing the candidate components from scratch as opposed to mining them.
The activities up to and including the Analyze Candidate Components activity provided an analysis of the effort required to rehabilitate individual components. The next activity, Planning Mining Options, groups components to enable management decisions that can best satisfy the organization�s goals by balancing programmatic and technical considerations.
During the Planning Mining Options activity, three options containing aggregations of components were developed. These options are summarized in Table 2. The three options were
1. The clock and position determination components were aggregated as one option. However, since these components depend on interfaces that are yet to be defined, this aggregation may change.
2. The user interface components were grouped as an option.
3. The anti-trap subsystem had self-contained functionality and was treated as a separate option.
The aggregated levels of difficulty and risk for each option were determined. The aggregated level of difficulty is calculated as a weighted average of the individual component�s difficulty level. The level of risk for an aggregation is the highest level of risk for any of the individual components within the option.
CMU/SEI-2002-TN-007 17

Option Legacy System Support Level Level Mining Mining New New Comparative ComparativeNo. Software Software of of Effort1 Cost1 Development Development Cost of Effort of
Components Required Risk Difficulty (mm) Effort (mm) Cost Mining Mining
1 Anti-Trap S&D Files Low 4 8 $80,000 18.1 $180,567 44% 44%
Option Summation Low 4 8 $80,000 18.1 $180,567 44% 44%
2 UI-1 S&D Files High 2 2.2 $22,000 30.7 $306,733 7% 7%UI-2 S&D Files High 2 1.3 $13,000 14.7 $147,067 9% 9%
Option Summation High 2 3.5 $35,000 45.4 $453,800 8% 8%
3 Clock-A S&D Files Low 1 0.1 $1,000 7.7 $76,567 1% 1%Clock-B S&D Files Low 1 0.1 $1,000 16.3 $162,567 1% 1%PTION S&D Files Low 1 0.1 $1,000 14 $139,533 1% 1%
Option Summation Low 1 0.3 $3,000 38 $378,667 1% 1%
1 Mining Effort and Cost do not include the effort and cost required to convert the support software's scripts and data files.
Table 2: Options Table
During the next activity, Select Mining Option, the three options were prioritized, and each was analyzed based on the organization�s goals for the mining effort. The rest of Table 2 was then filled out.
The results showed that the components should be mined according to all three options and then be folded into the new product line. The OAR method thus provides an essential analysis of the technical effort and resources required for the mining of existing assets in support of the Product Parts Pattern.
18 CMU/SEI-2002-TN-007
5 Conclusion
While legacy assets need to be an important part of core assets for product lines, systematic methods for deciding when to incorporate legacy assets have not been available. We have shown how two methods, MAP and OAR, fill this gap.
Each method supports different aspects of the Product Parts Pattern, which is applied to develop the core assets for a product line. Within the Each Asset Pattern for architecture, the MAP method provides a suitability analysis of the existing systems� architectures as candidates for a product line architecture. It also provides an analysis of multiple systems to provide information about potential legacy components.
The OAR method provides a disciplined approach for deciding how to rehabilitate components that may be inserted into a product line. It informs the �Make/Buy/Mine/Commission Analysis� practice area and provides systematic support for decision making in the �Mining Existing Assets� practice area.
Though the MAP and OAR methods have not yet been applied together in the same product line effort, the potential for their combination is promising and part of the SEI�s future plans to mature product line technology.
CMU/SEI-2002-TN-007 19

20 CMU/SEI-2002-TN-007

References
[Bachmann 00] Bachmann, F.; Bass, L.; Chastek, G.; Donohoe, P.; & Peruzzi, F. The Architecture Based Design Method (CMU/SEI-2000-TR-001, ADA375851). Pittsburgh, PA: Software Engineering Institute, Carnegie Mellon University, 2000. <http://www.sei.cmu.edu/publications /documents/00.reports/00tr001.html>.
[Bergey 01] Bergey, J.; O�Brien, L.; & Smith, D. Options Analysis for Reengineering (OAR): A Method for Mining Legacy Assets (CMU/SEI-2001-TN-013, ADA395201). Pittsburgh, PA: Software Engineering Institute, Carnegie Mellon University, 2001. <http://www.sei.cmu.edu/publications /documents/01.reports/01tn013.html>.
[Clements 01] Clements, P. & Northrop, L. Software Product Lines: Practices and Patterns. Reading, MA: Addison-Wesley, 2001.
[Kazman 01] Kazman, R.; O�Brien, L.; & Verhoef, C. Architecture Reconstruction Guidelines (CMU/SEI-2001-TR-026, ADA395198). Pittsburgh, PA: Software Engineering Institute, Carnegie Mellon University, 2001. <http://www.sei.cmu.edu/publications/documents/01.reports /01tr026.html>.
[O�Brien 01] O�Brien, L. & Stoermer, C. �MAP: Mining Architectures for Product Line Evaluations,� 35-44. Proceedings of the Third Working IFIP Conference on Software Architecture (WICSA1). Amsterdam, Netherlands, August 28-31, 2001. Los Alamitos, CA: IEEE Computer Society, 2001.
[SEI 02] Software Engineering Institute. �The Dali Architecture Reconstruction Workbench� [online]. <http://www.sei.cmu.edu/ata/products_services /dali.html> (2002).
CMU/SEI-2002-TN-007 21

22 CMU/SEI-2002-TN-007

REPORT DOCUMENTATION PAGE Form Approved OMB No. 0704-0188
Public reporting burden for this collection of information is estimated to average 1 hour per response, including the time for reviewing instructions, searching existing data sources, gathering and maintaining the data needed, and completing and reviewing the collection of information. Send comments regarding this burden estimate or any other aspect of this collection of information, including suggestions for reducing this burden, to Washington Headquarters Services, Directorate for information Operations and Reports, 1215 Jefferson Davis Highway, Suite 1204, Arlington, VA 22202-4302, and to the Office of Management and Budget, Paperwork Reduction Project (0704-0188), Washington, DC 20503. 1. AGENCY USE ONLY
(Leave Blank) 2. REPORT DATE
April 2002 3. REPORT TYPE AND DATES COVERED
Final 4. TITLE AND SUBTITLE
MAP and OAR Methods: Techniques for Developing Core Assets for Software Product Lines from Existing Assets
5. FUNDING NUMBERS
F19628-00-C-0003
6. AUTHOR(S)
Liam O�Brien and Dennis Smith 7. PERFORMING ORGANIZATION NAME(S) AND ADDRESS(ES)
Software Engineering Institute Carnegie Mellon University Pittsburgh, PA 15213
8. PERFORMING ORGANIZATION REPORT NUMBER
CMU/SEI-2002-TN-007
9. SPONSORING/MONITORING AGENCY NAME(S) AND ADDRESS(ES) HQ ESC/XPK 5 Eglin Street Hanscom AFB, MA 01731-2116
10. SPONSORING/MONITORING AGENCY REPORT NUMBER
11. SUPPLEMENTARY NOTES
12A DISTRIBUTION/AVAILABILITY STATEMENT
Unclassified/Unlimited, DTIC, NTIS 12B DISTRIBUTION CODE
13. ABSTRACT (MAXIMUM 200 WORDS)
While it is commonly recognized that legacy assets are, in most cases, an important contributor to the core assets for software product lines, systematic methods for making decisions on when to incorporate legacy assets (versus building new assets) have not been available. Two methods developed by the Software Engineering Institute fill this gap: the Mining Architectures for Product Lines (MAP) method and the Options Analysis for Reengineering (OAR) method.
Both of these methods, which are described in this report, support different aspects of the Product Parts Pattern, which is applied to develop the core assets for a product line. The MAP method provides a suitability analysis of existing systems' software architectures as candidates for a product line architecture. After an architecture has been developed or chosen, the OAR method provides a disciplined approach for making decisions on rehabilitating legacy assets that may be incorporated into the product line asset base.
This technical note describes both the MAP and OAR methods, the activities that each involves, and examples of applying them.
14. SUBJECT TERMS
mining, architecture analysis, product lines 15. NUMBER OF PAGES
32 16. PRICE CODE
17. SECURITY CLASSIFICATION OF
REPORT
Unclassified
18. SECURITY CLASSIFICATION OF THIS PAGE
Unclassified
19. SECURITY CLASSIFICATION OF ABSTRACT
Unclassified
20. LIMITATION OF ABSTRACT
UL
NSN 7540-01-280-5500 Standard Form 298 (Rev. 2-89) Prescribed by ANSI Std. Z39-18 298-102