Embed Size (px)
Citation preview

MSO.v2.25 (03/29/2017) Page 1 of 105
LINCS: Leveraging, Integrating, Networking, Coordinating Supplies
MANUFACTURING AND SERVICE OPERATIONS
CERTIFICATION TRACK
for Entry- to Mid-Level Professionals in Supply Chain Management
Developed by the LINCS in Supply Chain Management Consortium, comprised of the following educational institutions:
Broward College (Lead Institution) Long Beach City College
Columbus State Community College Northwestern University Essex County College Rutgers, the State University of New Jersey
Florida State College at Jacksonville San Jacinto College Georgia Institute of Technology St. Petersburg College
Harper College Union County College
In partnership with the Council of Supply Chain Management Professionals.

MSO.v2.25 (03/29/2017) Page 2 of 105
Title Page
LINCS in Supply Chain Management Consortium Broward College, Lead Institution 1930 S.W. 145th Avenue, Suite 224 Miramar, FL 33027 (954) 201-8440
Author: LINCS in Supply Chain Management Consortium
Title: Manufacturing and Service Operations Certification Track
Release Date: 03/29/2017
Version: v2.25
Website: www.LINCSeducation.org
To learn more about LINCS, visit www.LINCSeducation.org
Content was developed and produced by LINCS in Supply Chain Management Consortium and is licensed under a Creative Commons Attribution 4.0 International License. Under this license, any user of this content herein must provide proper attribution as follows:
Use of this document as a bibliographic reference should employ the following citation: Manufacturing and Service Operations Certification Track. LINCS in Supply Chain Management Consortium. March 2017 Version: v2.25. www.LINCSeducation.org.
Disclaimer: The photos used within this document may only be used with this content. The license does not include copying photos for use with any other content.
Unless otherwise noted, this work is licensed under the Creative Commons Attribution 4.0 International License. To view a copy of this license, visit http://creativecommons.org/licenses/by/4.0/.

MSO.v2.25 (03/29/2017) Page 3 of 105
Preface
The information in this Preface is an overview of LINCS in Supply Chain Management.
Supply Chain Management (SCM) as a paradigm is nothing new to business and industry. However, academia and employers have recently seen SCM become a major focus. There are currently several industry-recognized certifications in SCM, largely focused on individuals with experience in management through the executive level. The curriculum in the certification tracks listed below is directed at those who have entry- to mid-level experience.
The curriculum for these certification tracks include eight topics in SCM:
1. SCM Principles 2. Customer Service Operations 3. Transportation Operations 4. Warehousing Operations 5. Supply Management and Procurement 6. Inventory Management 7. Demand Planning 8. Manufacturing and Service Operations
Each certification track can be taken on its own to earn one certification; multiple certifications can be earned in any order. Each certification track covers the basic elements of the primary certification track, which allows the learner to obtain a foundational understanding of the best practices and processes associated with each topic.
Common Learning Blocks accompany each certification track, providing an overview of SCM. It is highly recommended that both the standalone Common Learning Blocks document and the certification track document be thoroughly reviewed prior to taking a national certification examination.
The content provided within this certification track relates specifically to Manufacturing and Service Operations. The national certification examination will include questions on both the Manufacturing and Service Operations content and the Common Learning Blocks content.*
*NOTE: Materials listed under Optional Supplemental Resources sections (in some certification track documents only) are not included on the national certification examination.

MSO.v2.25 (03/29/2017) Page 4 of 105
Manufacturing and Service Operations Certification Track Table of Contents
Title Page .................................................................................................................. 2
Preface ..................................................................................................................... 3
Manufacturing and Service Operations Certification Track Table of Contents ............................ 4
Abstract .................................................................................................................... 9
Learning Block 1: Manufacturing and Services Operations Overview ....................................... 10
Learning Block 1 Description ......................................................................................... 10
Learning Block 1 Learning Objectives .............................................................................. 10
Unit 1: Role of Operations ............................................................................................ 10
Unit 2: Satisfying Market Requirements ............................................................................ 12
Make-to-Stock (MTS) ................................................................................................ 13
Assemble-to-Order (ATO) .......................................................................................... 13
Make-to-Order (MTO) ............................................................................................... 14
Unit 3: Manufacturing Processes ..................................................................................... 14
Discrete ............................................................................................................... 15
Repetitive ............................................................................................................ 15
Job Shop .............................................................................................................. 16
Continuous ........................................................................................................... 17
Batch .................................................................................................................. 17
Learning Block 1 Summary ............................................................................................ 18
Learning Block 1 Optional Supplemental Resources .............................................................. 19
Learning Block 1 Practice Questions ................................................................................ 19
Learning Block 2: Strategic Decisions in Manufacturing ....................................................... 21
Learning Block 2 Description ......................................................................................... 21
Learning Block 2 Learning Objectives .............................................................................. 21

MSO.v2.25 (03/29/2017) Page 5 of 105
Unit 1: Operations Infrastructure .................................................................................... 21
Unit 2: Facility Location and Layout Strategies ................................................................... 22
Facility Location ..................................................................................................... 22
Facility Layout ....................................................................................................... 23
Product-Focused Layouts .......................................................................................... 24
Job Shop Layouts .................................................................................................... 25
Cellular Layouts ..................................................................................................... 26
Fixed-Position Layouts ............................................................................................. 26
Layout Relationship with Process Type ......................................................................... 27
Unit 3: Manufacturing Postponement Strategies .................................................................. 27
Design and Make-to-Order ......................................................................................... 29
Assemble-to-Order .................................................................................................. 29
Make-to-Stock/Using the Supply Chain .......................................................................... 30
Unit 4: Customization ................................................................................................. 30
Unit 5: Managing Risk in Manufacturing ............................................................................ 31
Disruption, Risks, and Impacts .................................................................................... 31
The Risk Management Mitigation Process ....................................................................... 32
Supplier Risk in the Supply Chain ................................................................................ 33
Contingency Planning............................................................................................... 34
Learning Block 2 Summary ............................................................................................ 34
Learning Block 2 Practice Questions ................................................................................ 35
Learning Block 3: Manufacturing Planning and Control ........................................................ 37
Learning Block 3 Description ......................................................................................... 37
Learning Block 3 Learning Objectives .............................................................................. 37
Unit 1: Types of Manufacturing Plans ............................................................................... 37
Level (Push) Production Plan...................................................................................... 37
Chase (Pull) Production Plan ...................................................................................... 38
Mixed Strategy ....................................................................................................... 38

MSO.v2.25 (03/29/2017) Page 6 of 105
Unit 2: Planning and Control Processes and Systems ............................................................ 38
Demand Estimation and Capacity Planning ..................................................................... 39
Aggregate Production Planning ................................................................................... 40
Master Production Scheduling (MPS) ............................................................................. 41
Capacity Requirements Planning (CRP) ......................................................................... 42
Final Assembly Schedule (FAS) .................................................................................... 43
Materials Requirements Planning (MRP) ........................................................................ 43
MRP Records ......................................................................................................... 44
Scheduling Considerations ......................................................................................... 46
Production Control .................................................................................................. 46
Learning Block 3 Summary ............................................................................................ 47
Learning Block 3 Practice Questions ................................................................................ 48
Learning Block 4: Operational Improvement ..................................................................... 50
Learning Block 4 Description ......................................................................................... 50
Learning Block 4 Learning Objectives .............................................................................. 50
Unit 1: Continuous Improvement .................................................................................... 50
Unit 2: Lean ............................................................................................................. 51
Lean Objectives ..................................................................................................... 52
Elements of Lean Operations ..................................................................................... 53
Unit 3: Quality Improvement Tools and Techniques ............................................................. 59
Statistical Process Control (SPC) ................................................................................. 60
Six Sigma Methodology ............................................................................................. 61
DMAIC Improvement Process ...................................................................................... 61
Learning Block 4 Summary ............................................................................................ 62
Learning Block 4 Practice Questions ................................................................................ 63
Learning Block 5: Performance Metrics............................................................................ 65
Learning Block 5 Description ......................................................................................... 65
Learning Block 5 Learning Objectives .............................................................................. 65

MSO.v2.25 (03/29/2017) Page 7 of 105
Unit 1: Understanding Metrics ....................................................................................... 65
Performance Measurement ........................................................................................ 66
Unit 2: Performance Metrics and Categories ...................................................................... 67
Manufacturing and Service Operations Metric Examples ..................................................... 67
Learning Block 5 Summary ............................................................................................ 68
Learning Block 5 Practice Questions ................................................................................ 69
Learning Block 6: Systems and Technology ....................................................................... 71
Learning Block 6 Description ......................................................................................... 71
Learning Block 6 Learning Objectives .............................................................................. 71
Unit 1: Role of Technology ........................................................................................... 71
Unit 2: Types of Systems .............................................................................................. 72
Enterprise Resource Planning (ERP) ............................................................................. 72
Condition Monitoring Systems ..................................................................................... 73
Computer-Aided Design (CAD) .................................................................................... 74
Computer-Integrated Manufacturing ............................................................................ 74
Unit 3: Automation ..................................................................................................... 74
Automation in Supply Chain ....................................................................................... 75
Unit 4: Emerging Technologies ....................................................................................... 76
3D Printing ........................................................................................................... 76
Responsive Web Design ............................................................................................ 77
Use of Cloud Technologies......................................................................................... 77
Learning Block 6 Summary ............................................................................................ 78
Learning Block 6 Optional Supplemental Resources .............................................................. 78
Learning Block 6 Practice Questions ................................................................................ 78
Learning Block 7: Maintenance and Quality ...................................................................... 81
Learning Block 7 Description ......................................................................................... 81
Learning Block 7 Learning Objectives .............................................................................. 81
Unit 1: Maintenance Service Operations ........................................................................... 81

MSO.v2.25 (03/29/2017) Page 8 of 105
The Maintenance Function ........................................................................................ 82
Various Maintenance Functions ................................................................................... 82
Unit 2: Types of Maintenance ........................................................................................ 83
Preventive Maintenance Tasks .................................................................................... 83
Services and Lubrication ........................................................................................... 84
Equipment and Machinery Failure ................................................................................ 84
Consequences of Failure ........................................................................................... 85
Unit 3: Total Productive Maintenance (TPM) ...................................................................... 86
Elements of TPM .................................................................................................... 86
Equipment Installation and Upgrade Services .................................................................. 87
Unit 4: Maintenance Spares........................................................................................... 88
Unit 5: Housekeeping .................................................................................................. 88
What is Housekeeping? ............................................................................................. 88
Unit 6: Manufacturing and Service Quality ........................................................................ 88
Quality Assurance vs. Quality Control ........................................................................... 89
Learning Block 7 Summary ............................................................................................ 89
Learning Block 7 Optional Supplemental Resources .............................................................. 90
Learning Block 7 Practice Questions ................................................................................ 90
References ............................................................................................................... 92
Practice Questions Answer Key ...................................................................................... 93
Manufacturing and Service Operations Certification Track Glossary........................................ 94
Notes Page .............................................................................................................. 104
Addendum .............................................................................................................. 105

MSO.v2.25 (03/29/2017) Page 9 of 105
Abstract
The role of the operations department in a company is to supply and manage resources to provide services to customers and convert materials into finished products. This certification track is intended to train students in the basics of manufacturing and service operations, so they can become effective contributors in the operations of an organization and interface effectively with the other elements across the supply chain.
Key elements of this certification track include the role of manufacturing and service operations, linking market requirements, the selection of manufacturing processes, facility layout strategies, facility location, the importance of production planning, control in synchronizing operations, the importance of quality management, performance measurement, and the role of emerging technologies in operations.
The goal of this certification track is to prepare students to successfully pass the manufacturing and service operations national certification examination. The content of the certification track was developed by LINCS in Supply Chain Management Consortium. SCPro™ Fundamentals Certification examinations are owned and administered by the Council of Supply Chain Management Professionals (CSCMP).

MSO.v2.25 (03/29/2017) Page 10 of 105
Learning Block 1: Manufacturing and Services Operations Overview
Learning Block 1 Description Manufacturing and service operations are elements of a broader operations management function within a supply chain organization. The charter of operations management is to provide value-added services to produce finished goods that can be sold and to deliver technical, repair, and other services for customers. Operations management is dependent on demand planning, procurement, inventory, and warehousing to provide inputs; the outputs from manufacturing and service operations are to generate revenues and profits for a company.
Learning Block 1 Learning Objectives Upon completing this learning block, the learner will be able to:
• Define the role of the operations function • Understand differences between manufacturing operations and service operations • Apply manufacturing and service operations to other supply chain elements • Analyze various market requirements • Evaluate production process options
Unit 1: Role of Operations Operations management is a core function at almost every company, regardless of industry, size, type of manufacturer, or services provided. It interfaces with other elements of the supply chain, undertakes planning, and manages resources to produce a company’s goods and services.
Manufacturing operations are held accountable for producing tangible goods; tangible products are physical products that can be seen, held, transported, and delivered to customers. Manufacturing includes the work required to convert inputs (which may be raw materials or components) into products demanded by customers. These customers may be external (i.e., outside the company) or internal (i.e., inside the company).
Figure 1. Role of operations. Developed by LINCS in Supply Chain Management Consortium.

MSO.v2.25 (03/29/2017) Page 11 of 105
Service operations, on the other hand, are accountable for providing intangible products that are not as easy to identify as manufactured (tangible) products. Service operations that are familiar to everyone include banking, consulting, product repair, hospitality, and insurance.
To perform manufacturing operations, resources are needed to create goods from raw materials. Operations personnel work with warehousing and inventory personnel to store the required raw materials, work-in-process, and finished goods. They are also responsible for optimizing manufacturing processes and final product quality. The resources required to perform this type of work are a combination of employees, equipment, facilities, materials (e.g., raw materials, spares, and consumables), utilities (i.e., electricity, water, and communication), information, and finances.
In contrast with manufacturing operations, service operations personnel schedule employees to satisfy customer demands for services along with the training and mentoring needed to provide that service at an excellent level.
For instance…
The automotive industry shows the contrast between manufacturing and service operations. Ford, General Motors, Chrysler, and other companies are in the business of assembling sheet metal, glass, tires, interiors, and other parts into a finished automobile that is made available for retail sale. Those same companies have retail dealer networks that offer aftermarket services that keep vehicles operational by providing a broad array of repair services and replacement parts. Since it is not feasible to return an automobile all the way to the factory for repair, these service facilities provide consumers with an invaluable benefit.
While there are distinct differences between manufacturing and service operations, there are also similarities. Both require a process to quantify customer demand, a strategy to stay competitive, and a continuous process for controlling costs. Figure 2 summarizes one high-level operational process.
Figure 2 depicts resources, also called inputs, being consumed in a work process that provides an output. Generally, each broad resource category listed is needed for every process, though at times that may not be obvious. For example, in an automated manufacturing process using robots, people may not be an obvious part of the process; however, the robots need to be programmed and maintained, which requires human resources. Likewise, the role of financial resources may not be obvious in this process, but funds are required to pay for human resources, materials, and equipment.
As a core function in the supply chain, operations cannot operate in a vacuum, and is critically linked to the other supply chain elements for the required inputs and to functions that have a more direct role with
Figure 2. Operational process model. Developed by LINCS in Supply Chain Management Consortium.

MSO.v2.25 (03/29/2017) Page 12 of 105
delivery of product and service outputs, as depicted in Figure 3.
As Figure 3 makes clear, operations depends on other functions for the plans and materials needed to organize work flows, materials and labor developed in the demand planning function, and the materials provided by procurement. Materials are received from suppliers, staged, stored, and controlled by warehousing operations and inventory management.
The operations function adds value to inputs to create products and services that are processed to warehousing operations and inventory management to control work-in-process and finished products. The finished products are eventually processed and delivered to customers due to interactions with customer service and transportation operations. Services are also scheduled and provided based on customer demands as coordinated by customer service.
Manufacturing and service operations are designed to satisfy market requirements in a variety of ways, depending on the industry, type of product, and level of service. These options are further explored in Unit 2.
Unit 2: Satisfying Market Requirements Choosing an appropriate production strategy is an important decision that is made by operations personnel to satisfy a wide range of market requirements. Production strategies determine how equipment, staffing, and facilities will be aligned over a long–term period to make products and provide services for customers. In determining the production strategy to satisfy market requirements, one important consideration is deciding when to start production. Production timing falls into one of three general categories:
• Make-to-Stock: In anticipation of customer demand • Assemble-to-Order: Partially assembled prior to receiving an order, with final assembly
occurring after an order is received • Make-to-Order: Make after an order is received
Production strategies can be common across firms in a given industry. For example, aircraft manufacturers typically do not build an airplane without having a contract from a customer, while a computer memory hardware manufacturer may constantly produce memory devices with a high degree of confidence that there will always be customer demand and without paying any attention to specific customer orders that may have been placed.
Figure 3. Supply chain operations. Developed by LINCS in Supply Chain Management Consortium.

MSO.v2.25 (03/29/2017) Page 13 of 105
Make-to-Stock (MTS)
In a make-to-stock (MTS) production strategy, products are made in advance of anticipated customer demand, normally guided by some form of sales and marketing forecast. One example of MTS is a manufacturer of consumer products such as orange juice. From a customer perspective, high volumes of a fairly low variety of products will be required from a given manufacturer. A common product (such as 96-ounce Tropicana Pure Premium Orange Juice) can be produced for a wide variety of retailers selling the same product.
In MTS, the mass-produced good is manufactured and immediately used to fill incoming customer orders or stocked in a warehouse until sufficient orders are received.
Companies that use the MTS production strategy are often found in industries where customers are generally not willing to wait for the product. For example, if Tropicana orange juice is not available, customers may simply purchase Minute Maid orange juice, so it is critically important to have the desired product readily available for the end customer or supply chain channel partner.
Assemble-to-Order (ATO)
In an assemble-to-order (ATO) production strategy, goods are produced quickly by a manufacturer once a customer order has been received. ATO production strategies often involve a certain amount of customization to tailor the final product to a specific customer’s requirements. The ATO strategy requires that the basic parts or components required to create the final product are already manufactured and easily accessible, but not yet released for final assembly. According to Gartner Inc. (2015) ATO manufacturing strategy allows a product or service to be made to specific order in a context where a large number of products can be assembled in particular forms from common components.
One interesting example of the ATO production strategy is found in the personal computer industry. Personal computer manufacturers offer consumers customized computers that are finalized in the ATO style, because that market has a very high variety of options that can be incorporated into customized products. Customers usually specify product requirements according to their preferences as to screen size, case color, memory capacity, and various processing speed.
Small local computer manufacturers also vie for business using an ATO model. These small firms often stock the various components like hard drives and screens that are required to assemble a finished personal computer. However, they may not actually perform the final assembly until they receive a firm order from a specific customer.

MSO.v2.25 (03/29/2017) Page 14 of 105
Make-to-Order (MTO)
In a make-to-order (MTO) environment, products are made according to orders received and are normally very specialized or highly customized products. A particular product is only made once an order has been received from a customer and meets that customer’s precise specifications.
The luxury yacht market is an excellent example of MTO production, with a wide variety of options available to customize each yacht to a specific customer’s requirements. In this scenario yacht parts will be made or adapted to that customer’s specifications and combined with some standard parts to facilitate customization.
Yachts are typically targeted to a niche market of high-income customers, who are generally willing to wait, even a year or more, for final delivery for this type of product. These customers are not sensitive to price.
The three strategies presented previously, all depend on manufacturing processes to transform inputs into outputs. The primary manufacturing processes are presented in the next unit.
Unit 3: Manufacturing Processes Manufacturing processes are a combination of interrelated steps that are utilized to transform numerous resources into product and service outputs that ultimately satisfy a customer demand or need. The resources include buildings, people, machinery, computers, materials handling automation, raw materials, and components. There are numerous options for implementing manufacturing processes that depend on the desired outputs. A process is like a roadmap that shows how resources are best deployed to attain the desired output.
As companies develop their business and strategic plans, questions about what products will be made in what quantities will be answered. Those answers enable the operations department to begin plans to develop specific manufacturing processes that will satisfy an organization’s goals.
At the big-picture level, there are at least five process choices that can be used to facilitate the desired outputs for the type of products and quantities to be made. In many cases, a combination of these processes may be used in by manufacturing to achieve the final output. The process choices include the following options and a representative process output is depicted in Figure 4:
Discrete
Repetitive
Job Shop
Continuous
Batch

MSO.v2.25 (03/29/2017) Page 15 of 105
Discrete
Discrete processes are designed and implemented to enable the production of tangible items. In this environment, a part or parts defined on a bill of material move from one manufacturing workstation to the next workstation; value is added to make the item more desirable as additional work is performed. In a discrete process flow, each part used in the manufacturing process retains a unique identity.
The automotive assembly line, also called product layout, offers a good example of a manufacturing assembly operation that uses discrete processes. The automotive frame, tires and wheels, body, engine and drivetrain, interior, and other required components all keep their individual identity even as they are combined into a completed vehicle. A final product that can be taken apart into its original parts and components is one way of distinguishing discrete manufacturing, although it would of course take significant effort to disassemble an automobile completely.
Discrete processes are used to manufacture distinct products that are measured in units, each of which can be inspected for quality control purposes. These products can be easily distinguished from each other because they are nearly but not completely identical. Using the automobile example of a discrete process again, while one model (e.g., a Ford 150 truck) is constantly produced, each truck can be distinguished from others based on paint colors, wheels and tires choices, and other options such as interiors and electronics.
To see a short video of trucks being manufactured using discrete processes, see the references section at the end of this learning block and watch the video on how a Ford F150 is made.
Repetitive
Repetitive processes are often confused with discrete processes because they have many similarities. Repetitive processes are used when a dedicated manufacturing operation produces an output of the same item with little to no variability. The process is designed to deliver a continuous steam of standard output units, with the number of outputs increased or decreased based on differences in customer demand. Once a repetitive process is established, there is need for machine retooling until that unit or model is retired.
Figure 4. Manufacturing process outputs. Developed by LINCS in Supply Chain Management Consortium.

MSO.v2.25 (03/29/2017) Page 16 of 105
The production of plastic bags serves as a good example of a manufacturing operation using a repetitive process. Repetitive process manufacturing lines have been established to produce the same material of bags, but in various sizes. Each line produces a constant output that is eventually sold to retailers or other manufacturers in various quantities.
Repetitive processes, like discrete processes, are used to manufacture distinct products that can be measured in units, each of which can be inspected for quality control purposes. Unlike discrete process outputs, however, repetitive process outputs are almost always exactly the same in color, functionality, and operation.
To see a short video of plastic bags being manufactured using repetitive processes, see the references section at the end of this learning block and watch the video on how the plastic bags are made.
Job Shop
A job shop, as the name implies, is a shop or facility established to manufacture a limited number of products to satisfy a specific customer project or program. Job shops typically do not employ discrete or repetitive process lines; they are better characterized as assembly areas. These areas assemble one version of a product in small quantities. If demand grows, the product might well be transitioned to a discrete or repetitive process flow. Because these unique products may only be required in small quantities, automated assembly equipment cannot be justified financially and general equipment that can execute a variety of operations is used by skilled personnel who are also trained in performing a wide array of manufacturing tasks.
A window replacement company can help to demonstrate a job shop operation. Windows are needed to satisfy a wide variety of opening sizes, operational types (double hung, casement, slider, etc.), and glass types (safety, tempered, energy-rated, impact, etc.). A window company that specializes in the replacement market needs to operate as a job shop to satisfy specific customer order requirements in small quantities while using standard materials, equipment, and personnel.
Again, like discrete and repetitive process outputs, job shops manufacture distinct products that can be measured in units, each of which can be inspected for quality control purposes. However, unlike discrete and repetitive process outputs, once a specific customer order is completed, the process changes to create a similar output (a window) based on an entirely different set of requirements. A cellular manufacturing layout is also a good candidate for job shop production or when there is a high degree of variability in a similar product offering (see Figure 5).
To see a short video of windows being manufactured using job shop processes, see the references section at the end of this learning block and watch the video on how Anderson windows are made.
Figure 5. Cellular layout. Developed by LINCS in Supply Chain Management Consortium

MSO.v2.25 (03/29/2017) Page 17 of 105
Continuous
The previous three process choices are implemented to manufacture items like cars, pens, and windows. Continuous processes utilize raw materials to ensure a steady flow of materials through various stages of equipment and achieve a constant output. Process manufacturing relies on mixing formulas, recipes, and ingredient reactions that cannot be undone or taken apart.
Products made in bulk quantities such as paint, beverages, and pharmaceuticals are good examples of products that are outputs of continuous flow manufacturing. They consume a variety of ingredients that are chemically mixed and treated to form an output. Unlike repetitive, discrete, and job shop processes that produce items that can be inspected physically, products manufactured using continuous lot processes must have each lot inspected at all critical blending or mixing operations to ensure adequate quality control throughout the process. To achieve maximum efficiency, paint manufacturers produce mostly white paint in a variety of sheens (flat, eggshell, gloss, and semi-gloss) that is shipped to retail outlets. The retail outlets then become job shops by mixing pigments to the white base to achieve the precisely desired colors and quantities for each customer order.
To see a short video of paint being manufactured using continuous processes, see the references section at the end of this learning block and watch the video on how Sherwin Williams paint is made.
Batch
In a continuous process environment, the flow of materials may continue to make exactly the same product for weeks and even months to meet customer demand. A batch process, on the other hand, involves defined quantities of product outputs, called batches. In a batch process, a manufacturer will begin by processing raw materials to achieve the desired product quantity and then clean up and reconfigure the line to start the process over again to make a different product. For example, a micro-brewery might produce a batch of a new craft lager, and then reconfigure the equipment and choose different ingredients to make a batch of craft ale, etc. Each batch could be as little as a few gallons or a few hundred gallons, depending on the anticipated customer demand for those products at a particular time.
Generally, batch processing is used to manufacture a stable line of products in defined quantities. Batch processing is also a hybrid process, meaning that it can be implemented within discrete, job shop, and continuous process environments when significant emphasis is placed on batch quality control. This process is routine in the food industry, in which frequent testing is performed as products are being made. Once the batch is accepted and approved, a unique batch number is assigned and applied to the packaging, along with a date code or expiration date. This is especially useful during a product recall to enable companies and consumers to focus on a quarantine of specific products.
Batch outputs can be measured by units or volume, depending on the process. However, product quality and testing is accomplished at certain pre-determined manufacturing steps, since the desired result might not be adequately addressed by inspecting only the final product.
To see a short video of beer being manufactured using batch processes, see the references section at the end of this learning block and watch the video on how Genesee craft beer is made.
The various types of manufacturing process types and their respective product outputs are depicted in Figure 4. For each process type, the corresponding manufacturing outputs are shown from left to right in the order in which they occur. The shapes shown for each process category are representative of the output for that process. For example, in a repetitive process making the exact same product like the plastic bags discussed before, production occurs without variation. Using a discrete process, similar
MSO.v2.25 (03/29/2017) Page 18 of 105
products are produced with some variation, like different colors and options for the same model automobile. When employing job shop processes, various products are made in small quantities tailored to customer requirements. Manufacturing could be set up with a continuous process to produce paint in large volumes and then packaged in smaller unit containers around customer preferences. Finally, batch processing is used to produce a stable product, like craft beer, in several variations.
Figure 4. Process types for manufacturing product outputs. Developed by LINCS in Supply Chain Management Consortium.
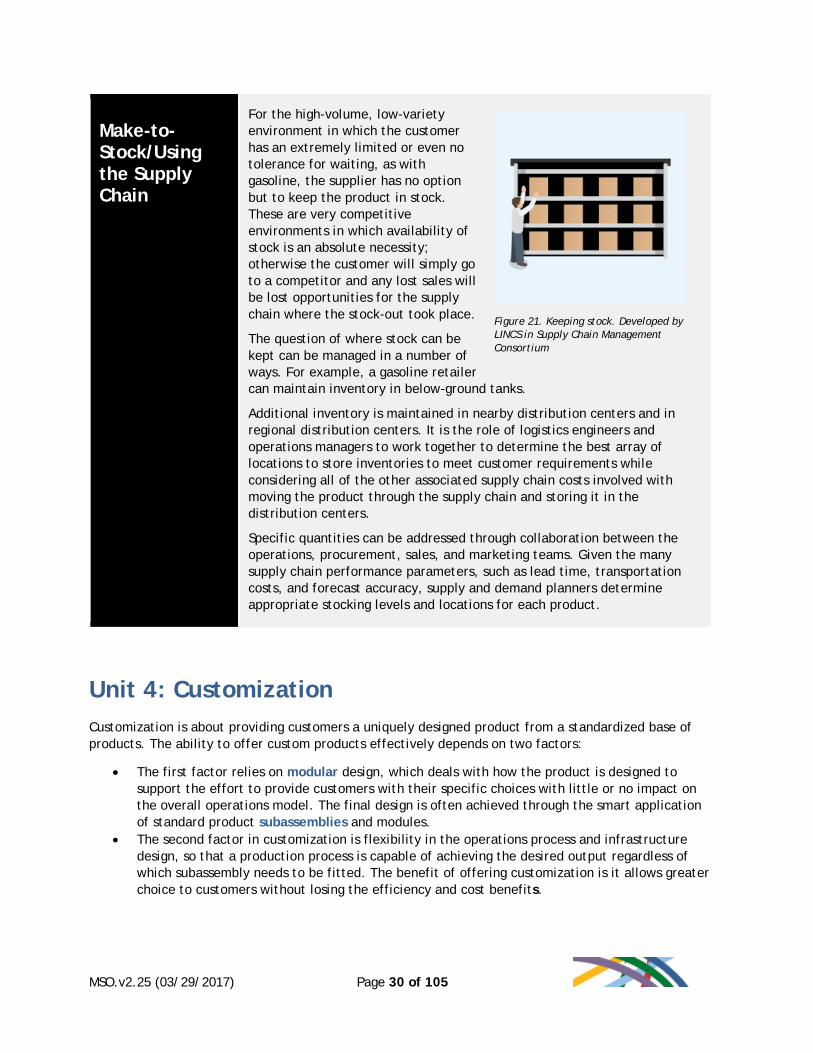
Learning Block 1 Summary Operations is the function within an organization where products (which may be finished goods, components, parts, or materials) are made or services are performed. In order to conduct operations work, resources are needed. Manufacturing is the making of products that can be stored, whereas services are concerned with delivering value to the customer that cannot be stored; with services like legal or banking advice, production and consumption has to take place simultaneously.
Production strategies can be classified into different categories that define the nature of the operational system. These consist of making products to stock (MTS), assembling products to order (ATO), or making products to order (MTO). With an MTS manufacturing strategy, goods are produced ahead of anticipated customer demand, normally based on some form of sales forecast. In an ATO manufacturing environment, goods are produced ahead of anticipated customer demand, with some type of sales forecast also usually involved. In an MTO environment, products are made according to orders received and are normally for very specialized, one-off types of products. MTO products are only made once an order has been received from a customer and to the customer’s specifications.
Figure 6. Manufacturing and service operations. Developed by LINCS in Supply Chain Management Consortium.

MSO.v2.25 (03/29/2017) Page 19 of 105
The five primary types of production processes are repetitive, discrete, job shop, continuous, and batch. Each process type has a corresponding manufacturing product output that is based on product characteristics, volume, quantity, and unique customer requirements.
Learning Block 1 Optional Supplemental Resources The optional supplemental resources listed below may be used to reinforce the content covered within this learning block.
YouTube Video – Example of a discrete process: How the Ford F150 Truck is made: https://www.youtube.com/watch?v=g5HuWSUxT_k
YouTube Video – Example of a repetitive process: Plastic bag manufacturing processes: https://youtu.be/AZyq3TqskAY
YouTube Video – Example of a job shop process: How Anderson windows are made: https://www.youtube.com/watch?v=7pjrc3zQq2A
YouTube Video – Example of a continuous process: How Sherwin Williams makes paint: https://www.youtube.com/watch?v=O9Kx3V40bao
YouTube Video – Example of batch processing: How Genesee makes craft beer: https://www.youtube.com/watch?v=nsCt3VkWjV0
Learning Block 1 Practice Questions 1. Manufacturing operations is held accountable to:
a. Produce tangible goods and products b. Determine the amount of raw material to order c. Exist solely on work-in-progress d. Determine the tangibility of the end product or service
2. Which is an example of a company that follows an assemble-to-order strategy?
a. Cement manufacturer b. Electricity provider c. Personal computer provider d. Shipyard producing cruise liners
3. When are products produced in a make-to-stock strategy?
a. Only when an order is placed b. Ahead of anticipated customer demand c. After the invoice is paid d. When material is received from suppliers

MSO.v2.25 (03/29/2017) Page 20 of 105
4. Continuous flow manufacturing is appropriate for which of the following?
a. Highway construction b. Aircraft assembly c. Custom print shops d. Paint manufacturing
5. Using a make-to-order strategy, when are products made?
a. As inventory quantities are consumed b. Subsequent to labor union approval c. According to orders received d. In anticipation of a customer order
6. Which production process would likely be used to produce automobiles?
a. Discrete b. Low volume c. Low volume for standard operations d. Job shop
7. An organization running which type of production will have the closest contact with
customers?
a. Job shop b. Mass production c. Continuous d. Discrete
8. What is required for manufacturing and service operations to create outputs?
a. Projects b. Resources c. Reliable transportation networks d. Access to large markets
9. Which one is NOT a resource requirement for manufacturing and service operations?
a. People b. Materials c. Information d. Large sales force
10. The best process choice for producing pharmaceutical drugs is probably:
a. Job shop b. Discrete c. Garage shop d. Continuous

MSO.v2.25 (03/29/2017) Page 21 of 105
Learning Block 2: Strategic Decisions in Manufacturing
Learning Block 2 Description A strategic business plan is a long-term, detailed guide that a company creates to achieve its overall business goals and objectives. It often defines the company’s vision and plans for the upcoming 12 to 18 months. Manufacturing assists in developing the plan by ensuring that capital equipment, labor skills, and other key resources are available to implement the plan.
Operations personnel, working with other functions, need to make a variety of key decisions to carry out the strategic intent and business plan of the organization as a whole. An operational strategy cannot exist in isolation, and manufacturing and service operations are highly dependent on numerous resources to transform inputs into outputs that satisfy the business plan and sustain a profitable company.
Learning Block 2 Learning Objectives Upon completing this learning block, the learner will be able to:
• Understand operations infrastructure • Differentiate facility locations and options for facility layouts • Explain postponement as a manufacturing strategy • Recognize customization as a service to customers • Interpret managing risk and uncertainties
Unit 1: Operations Infrastructure The term operations infrastructure is a reference to the combination of the facilities, equipment, and utilities required for manufacturing and services operations. Operational infrastructure provides the framework that enables products to be manufactured or services to be delivered.
The establishment of an operations infrastructure requires a financial investment that takes time to pay dividends. The three broad types of investments are:
• Facilities infrastructure includes buildings, factories, offices, laboratories, and warehouses • Equipment infrastructure refers to machines, tools, vehicles, computer systems and software,
materials handling equipment, and furniture. • Utility infrastructure refers to the provision of utilities within the organization such as
electricity, water, telecommunications, compressed air, Internet, and waste management

MSO.v2.25 (03/29/2017) Page 22 of 105
Unit 2: Facility Location and Layout Strategies
Facility Location
The decision to locate and design a facility is very important because it requires both immediate and long-term financial commitments that cannot be easily modified. Listed next are a number of considerations for making the location decision:
Figure 7. Investment incentive. Developed by LINCS in Supply Chain Management Consortium.
Economic considerations such as investment incentives, tax rebates or incentives, and political considerations such as government policies, labor laws, political stability, and quotas
Figure 8. Transportation. Developed by LINCS in Supply Chain Management Consortium.
The availability of supporting infrastructure like transportation carriers, roads, harbors, electricity supply, and telecommunication networks
Figure 9. Location. Developed by LINCS in Supply Chain Management Consortium.
Initial and future investments requirements. Considerations for a factory in an inland location may require a totally different investment than one to be built on or near the coast; one may require different investments for a structural foundation due to different geological conditions. Temperature and humidity may also play a role in making location decisions.
Figure 10. Cost of operations. Developed by LINCS in Supply Chain Management Consortium.
The cost of operations, which depends on the cost of raw materials, support services, and labor and the skill pools at a specific location or in the general vicinity
Figure 11. Lead time. Developed by LINCS in Supply Chain Management Consortium.
Service levels required by the customers. These typically relate to lead time and required date performance requirements, which are influenced by the distance from the location to the customer

MSO.v2.25 (03/29/2017) Page 23 of 105
Facility Layout
Facility layout is another component of a firm’s overall operational strategy. An effective manufacturing facility layout is essential to maximize the effectiveness of production processes and to meet the needs of employees working in the facility. The basic objective of manufacturing facility layout is to ensure a smooth flow of work, material, and information throughout a manufacturing process, while also ensuring productivity and safety. The specific layout of space has an impact on how work is carried out through the flow of work, materials, and information through the system. The key to good facility layout and design is the integration of the needs of people, materials (raw, in-process, and finished), and equipment in such a way that they create productive, safe, and profitable processes.
Facilities layout is typically the responsibility of facilities engineers working in conjunction with operations managers that provide input on process requirements and strategic growth projections. Considerations in facility layout include:
The flow of input materials and components, work-in-process, and finished goods: The facility design should reflect the recognition of the importance of smooth process flow. A number of specific layouts can meet these requirements. However, the nuances of the specific products being made need to be incorporated in the decision process.
Designs that they can be easily expanded or adjusted to meet changing production and business needs. For example, a facility might initially be designed using discrete process and later converted to repetitive processes, based on market demands.
The ability to process materials in an orderly, safe, and efficient manner
Maximizing space utilization to include considerations of specific space requirements, contingencies, and the tradeoff of building and equipment costs to store everything needed to support production processes
Accounting for receiving materials and shipping products: These tasks need to be carefully designed as part of facility layout to ensure that there are no bottlenecks that will hamper the in-out conversion processes.
Enabling safe operation in accordance with Occupational Safety and Health Administration (OSHA) guidelines and other legal restrictions
Figure 12. Consideration for layout facilities. Developed by LINCS in Supply Chain Management Consortium.

MSO.v2.25 (03/29/2017) Page 24 of 105
Product-Focused Layouts
Assembly lines employing discrete, repetitive, and continuous processes are dedicated to manufacturing outputs in which the products follow identical or similar sequences. Inflexibility is a common drawback of this type of layout, but many options are available to customers as long as a given option does not have a negative influence on the process time. When using discrete processes in automotive manufacturing, for example, it takes the same amount of time to paint a vehicle regardless of the color. Similarly, it takes the same amount of time, equipment, and labor to fit a six-cylinder gasoline engine or a four-cylinder diesel engine. Robotics and conveyors are most often the methods of choice to move products from one workstation to the next at a constant, predetermined speed through a sequence of workstations, as shown in Figure 13. A workstation is a group of machines or operators performing one or more operations on as part of the overall production process.
Figure 13. A typical product-focused layout. Developed by LINCS in Supply Chain Management Consortium.
In Figure 13, the main product—the automobile in this example—is moving by robotics and conveyors from raw material (RM) at the start to finished auto (FG) at the end, while each workstation is supplied with the necessary items for its role in assembling the vehicle.
When the manufacturing process is in the initial planning stages, the capacity of each workstation must be defined. Workstation capacity is the measure of tasks that can be generated in a defined period of time. Once each workstation’s capacity is defined, the flow between workstations can be evaluated to ensure that one workstation will not hold up workstations down the line. Finally, workstations must be staffed with skilled workers to perform required tasks within the allotted time.
In a continuous process layout, the typical around-the-clock type of operation is employed for mass production of extremely high volumes of goods with very limited variety. A representative continuous process layout is shown in Figure 14. The manufacture of paint described in the previous learning block is an example of this kind of process, in which chemicals and ingredients are converted using a continuous process to create end products.

MSO.v2.25 (03/29/2017) Page 25 of 105
Figure 14. A typical continuous process layout. Developed by LINCS in Supply Chain Management Consortium.
Job Shop Layouts
In a job shop layout, similar functional capabilities are clustered together in the same general area. In order for the product to be manufactured or the service to be delivered, materials move from one cluster to the next in a defined sequence. For example, when manufacturing replacement windows, similar operations like framing, painting, glass cutting, and glass installation are grouped together, even though the size and type outputs vary widely from customer to customer. Figure 15 shows an example.
Figure 15. Job shop layout. Developed by LINCS in Supply Chain Management Consortium.

MSO.v2.25 (03/29/2017) Page 26 of 105
Cellular Layouts
A cellular (cell) process layout groups the necessary capabilities together in each cell to manufacture a specific product in small quantities. Cellular layout is often used when there is insufficient demand to justify the economic investment in a full production line.
When variants—similar but not identical goods— are required, new cells are established with the capabilities needed specifically for each variant. This cell layout process can be repeated multiple times to satisfy the full variety of product offerings. A cell layout can also be a good choice for a job shop process or when there is a high degree of variability in a similar product offering, such as an aftermarket automotive parts manufacturer. This layout offers the capability to build similar parts in a common family, such as several different models of replacement fuel pumps; see Figure 5.
Fixed-Position Layouts
A fixed-position layout is the preferred layout when it is impractical to move a product due to its weight, size, or fragility, or when it is simply impossible to move. Fixed position refers to the location of the product or the service, with the implication that the required inputs such as inventory, equipment, and people are placed in fixed positions around the product to perform the work and removed when their work has been completed.
Large aircraft and ship manufacturers build their products using this approach, since it is impractical, expensive, and often impossible to move the product as value is added during the manufacturing process.
Figure 5. Cellular layout. Developed by LINCS in Supply Chain Management Consortium
Figure 16. Large sea-faring vessels such as this one are too large to move around during construction. Hence, the workers and supplies come to it. By ComradeWolf at en.wikipedia.org [Public domain], via Wikimedia Commons.

MSO.v2.25 (03/29/2017) Page 27 of 105
Layout Relationship with Process Type
Although the relationships between facility type and process type have been addressed in previous units, Figure 17 expands Figure 4 in Learning Block 1 by providing an added column to show the alignment of process types with facility layouts.
Figure 17. Facility location and layout factors aligned with process choices. Developed by LINCS in Supply Chain Management Consortium
It is important to note that these relationships are generally true but not absolute rules. For every individual case, a proper and tailored analysis must be performed to ensure that all facility and layout factors are were taken into account before final decisions are made.
Unit 3: Manufacturing Postponement Strategies Manufacturing postponement strategies are used to provide additional operational flexibility that allow for adjusting specific manufacturing configurations to meet uncertainties associated with demand forecasts and actual customer demand. Demand forecasts are used to plan what needs to be manufactured.
The reality of forecasting is that demand forecasts and actual customer demands are never perfectly aligned; the future is always uncertain. Higher levels of error are associated with forecasts that have longer time frames than shorter-term predictions, due to technological changes and the evolution of customer tastes and preferences.
The level of product specificity of a given forecast also impacts its accuracy. For example, a forecast for an entire product family like LED televisions will be more accurate than forecasts for the different individual members of that family: LED televisions of specific sizes.
One problem with heavy reliance on demand forecasts is that a manufacturer may end up with too many unwanted finished goods if actual demand falls below what was predicted. This situation leads to excessive and often obsolete inventory, increased warehousing needs and costs, materials handling and
MSO.v2.25 (03/29/2017) Page 28 of 105
inventory management requirements, reduced cash flow, and ultimately lower net profits and return on investment. Quantifying the financial effects of having too much product (oversupply) is fairly straightforward, since the exact quantity of oversupply relative to actual demand is known.
A second potential problem is that actual demand is more, sometimes much more, than the forecast. This leads to shortages, customer complaints, lost sales and ultimately less revenue than might have been possible. Ove the long term, it has a negative effect on cash flow, net profits, and return on investment. Unlike oversupply, quantifying the financial effects of underestimating demand is very difficult, because the company does not know exactly how much more of the product could have been sold.
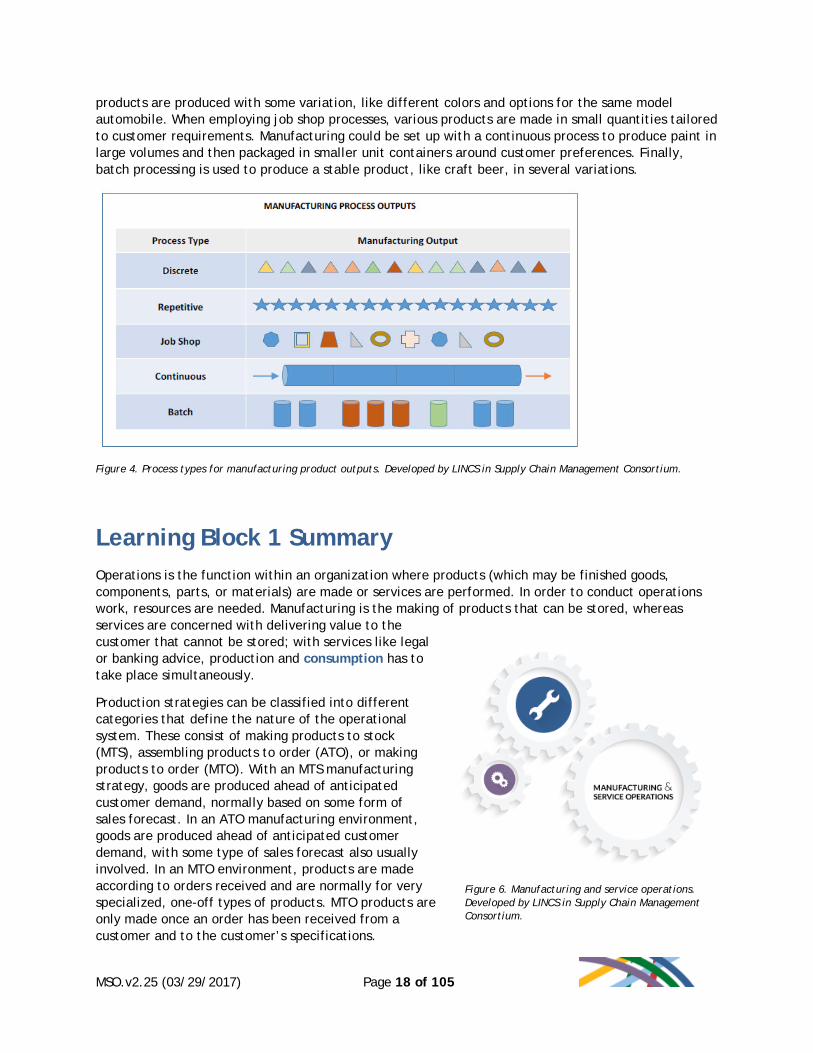
Postponement refers to the idea that actual production takes place as late as possible without exceeding the customer’s willingness to wait, which is also known as the customer’s tolerance for waiting. There are typically three postponement strategies employed; again, they relate to the process choice that an organization selects to serve its chosen market segment best. These different strategies and how they support process choices are shown in Figure 18.
Figure 18. Postponement strategies for different process choices. Developed by LINCS in Supply Chain Management Consortium.

MSO.v2.25 (03/29/2017) Page 29 of 105
Design and Make-to-Order
Design and MTO is the most ideal postponement strategy, as it ensures that no work takes place until absolutely needed, but it only succeeds when the customer has a sufficiently large tolerance for waiting and does not need the product immediately. This is typical of the project environment in which the customer provides unique specifications of what is required and is willing to wait for what is not readily available. Since a project environment is characterized by very high variety and very low volume, making any kind of forecast carries an exceptionally high risk.
In a project environment, the organization is not exposed to inaccurate forecast costs, since no work will begin unless the specifications of a clear customer order are available. Raw materials and components unique to a specific product might be kept in stock but will not be processed unless the design has been finalized. For example, the replacement window manufacturer might keep inventory on hand for wood and metal framing, glass, and insulation materials, which would be used in all window orders.
Assemble-to-Order
ATO as a postponement strategy is normally used with discrete processes for standard products that are delivered to a specific market segment, when the customer has some tolerance for waiting, but will not wait nearly as long than in cases when a design and MTO strategy can be employed. The time a customer is willing to wait under ATO will not allow for procurement of raw materials, making of components, and final assembly, but as long as the overall time from order to delivery is less than the customer’s maximum waiting tolerance, then ATO as a postponement strategy can be employed.
Automobile production is a good example of this strategy. The primary manufacturing and assembly plant builds vehicles and delivers them to their dealer networks. The dealers have the option to install options to satisfy specific customer requirements as part of the buying process. Customer preferences might include a bed liner in a pickup truck interior or trunk mats in an automobile.
Figure 19. Make-to-order. Developed by LINCS in Supply Chain Management Consortium
Figure 20. Assemble-to-order. Developed by LINCS in Supply Chain Management Consortium
MSO.v2.25 (03/29/2017) Page 30 of 105
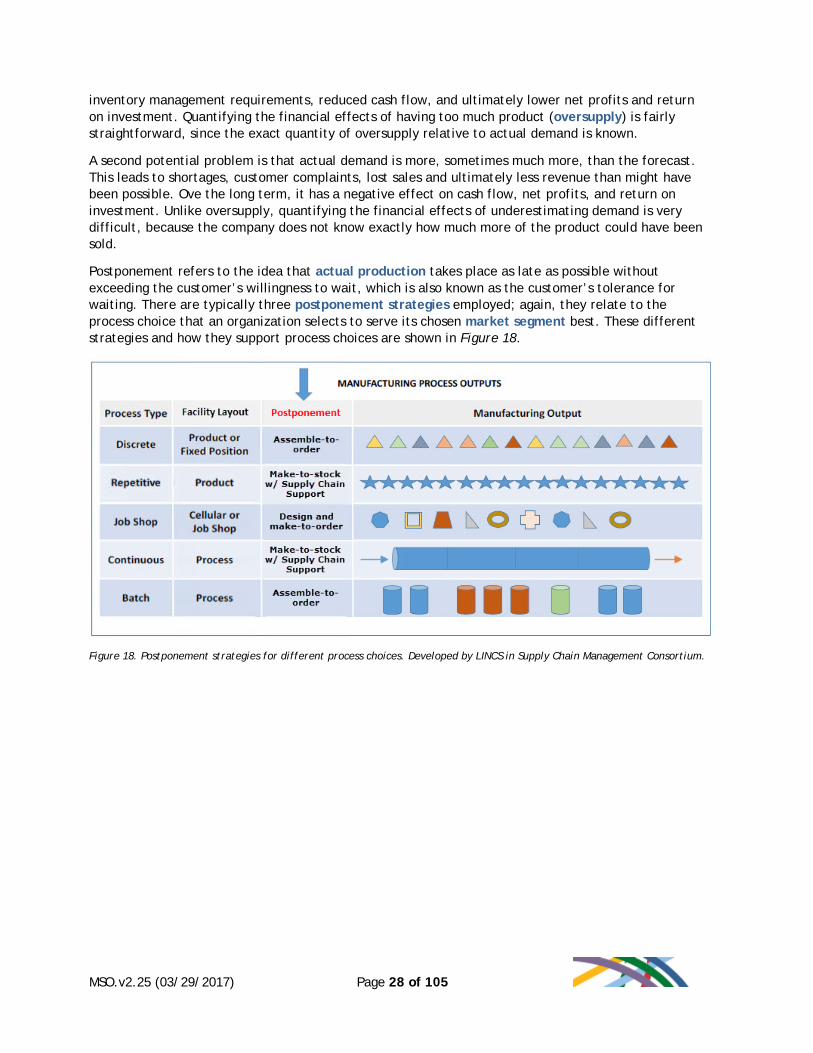
Make-to-Stock/Using the Supply Chain
For the high-volume, low-variety environment in which the customer has an extremely limited or even no tolerance for waiting, as with gasoline, the supplier has no option but to keep the product in stock. These are very competitive environments in which availability of stock is an absolute necessity; otherwise the customer will simply go to a competitor and any lost sales will be lost opportunities for the supply chain where the stock-out took place.
The question of where stock can be kept can be managed in a number of ways. For example, a gasoline retailer can maintain inventory in below-ground tanks.
Additional inventory is maintained in nearby distribution centers and in regional distribution centers. It is the role of logistics engineers and operations managers to work together to determine the best array of locations to store inventories to meet customer requirements while considering all of the other associated supply chain costs involved with moving the product through the supply chain and storing it in the distribution centers.
Specific quantities can be addressed through collaboration between the operations, procurement, sales, and marketing teams. Given the many supply chain performance parameters, such as lead time, transportation costs, and forecast accuracy, supply and demand planners determine appropriate stocking levels and locations for each product.
Unit 4: Customization Customization is about providing customers a uniquely designed product from a standardized base of products. The ability to offer custom products effectively depends on two factors:
• The first factor relies on modular design, which deals with how the product is designed to support the effort to provide customers with their specific choices with little or no impact on the overall operations model. The final design is often achieved through the smart application of standard product subassemblies and modules.
• The second factor in customization is flexibility in the operations process and infrastructure design, so that a production process is capable of achieving the desired output regardless of which subassembly needs to be fitted. The benefit of offering customization is it allows greater choice to customers without losing the efficiency and cost benefits.
Figure 21. Keeping stock. Developed by LINCS in Supply Chain Management Consortium

MSO.v2.25 (03/29/2017) Page 31 of 105
For instance…
The home building industry offers a good example of customization. Many builders focus on volume or track building outputs around standard designs and configurations that allow prospective buyers the final choices for certain materials and colors. With true customization, however, home builders, architects, and the actual buyer collaborate around site selection and design ideas that are converted to a final design that satisfies the layout, room number and size, and all other options that the customer desires.
In the custom home design process, the builder and architect will recommend standard subassemblies and modules like kitchen cabinet sizes, door sizes, and window sizes to control costs while still ensuring achievement of the final desired layout and configuration.
Unit 5: Managing Risk in Manufacturing
Disruption, Risks, and Impacts
A disruption is an event that interrupts one or more processes and the achievement of an organization’s goals. Depending on the nature of a disruption, it may have a largely localized impact on an organization or a ripple effect that leads to much broader impacts throughout the organization.
For instance…
In 2011, a major tsunami struck Japan. The tsunami caused severe disruptions to organizations across the globe. For example, suppliers of automotive parts in Japan had their operations damaged directly by the tsunami and were not able to meet the needs of their customers, not only in Japan but also around the world. This impacted the ability of automotive manufacturers worldwide to build cars and achieve their production, sales, and customer relations goals.
Risk is defined as the probability of disruption and therefore deals with the uncertainty of an undesirable event. Operational risks can include:
• Demand risk: Changes in demand can leave available production processes overloaded or totally underutilized
• Supply risk: Incoming materials and supplies can be impacted due to supplier problems, problems with third-party logistics, and poor-quality materials
Figure 22. Customization. Developed by LINCS in Supply Chain Management Consortium

MSO.v2.25 (03/29/2017) Page 32 of 105
• Technical risk: Machine malfunctions, manufacturing process complexity, and safety problems due to inherently or intermittently dangerous processes and locations
• Human risk: Poorly trained personnel, labor shortages, strikes, mistrust, and loss of key personnel
• Infrastructure risk: Unreliable or intermittent utility supply and road and rail infrastructure deterioration
• Legal risk: Non-compliance with operational legal requirements • Management risk: Poor decision-making
The Risk Management Mitigation Process
The basic process of mitigate and manage risk includes the following key steps:
Risk identification to find possible disruptions
Risk assessment to determine the probability and severity of possible disruptions
.
Risk classification to evaluate the seriousness of the risk
Risk response planning, which includes risk capacity planning
Executing a risk plan to respond to, prevent, or eliminate identified risks
Figure 23. Mitigation process. Developed by LINCS in Supply Chain Management Consortium.
The risk management process should not be viewed as a one-time effort that leads to a static plan. An effective risk management process requires periodic review and updating to incorporate any changes needed in current and best practices. Following this process will permit the understanding and acceptance of the identified disruption and its associated risks, leading to risk avoidance, risk mitigation, and ideally avoiding risks altogether.

MSO.v2.25 (03/29/2017) Page 33 of 105
Supplier Risk in the Supply Chain
A key objective of the operations department is to maintain the desired flow of products, materials, or services so that the organization as a whole will reap benefits more quickly when an order flows through the system more rapidly.
The best use of resources comes from eliminating problems that interrupt or slow down these flows. Figure 24 represents a serial flow in the supply chain, beginning with suppliers (depicted as S1 and S2) and demonstrates that any broken or dysfunctional link in the chain may cause disruptions that affect the entire chain.
Figure 24. Flow of materials and information up and down the supply chain from S1 to EU. S1, S2 = Suppliers; M = manufacturer; D1, D2 = Distributors; EU = End User. Developed by LINCS in Supply Chain Management Consortium
Given that suppliers are links in the supply chain, the manufacturer’s (M) performance is wholly dependent on the performance of its suppliers. Any disruption anywhere in the supply chain will affect the entire chain, including distributors (D1 and D2) and the end user (EU).
Considerations are also made for manufacturing items internally as opposed procuring those same items from a supplier, also called make-or-buy decisions. Choosing one process over the other can have the implications outlined next:
• The reliability of a supplier is as important to market success as is any internal process capability.
• Procurement versus making items internally does not simply solve internal process problems; it only exchanges the set of problems in managing the variability of internal processes for a new set of problems in managing the variability of the supplier’s processes from a distance through contracts. When making use of suppliers rather than internal processes, it is important to make sure that the personnel interface capability exists to deal with the possibility of this new set of challenges.
• Cost should never be the sole reason to choose outsourcing. Due consideration must be given to customer requirements like quality, lead times, due date performance, variety, and consistency. Outsourcing can be a source of variability in the system that hampers consistent, reliable product and material flow.
• If outsourcing is chosen as a strategy for certain work, the relationship with the supplier must be a partnership rather than an adversarial relationship.

MSO.v2.25 (03/29/2017) Page 34 of 105
Contingency Planning
Contingency planning refers to making provisions for potential disruptions to operations. Planning activities require operations personnel to develop plans with the awareness that disruptions may take place at some point in an uncertain future, with potentially higher degrees of uncertainty and potentially different suppliers than exist when planning activities take place.
The implication of planning means that more manufacturing process capacity—the ability to create more outputs over a given period of time—will be required than when no variability exists, which may require investment in machinery, staffing, and facilities to be increased. The additional capacity should not be thought of as excess or wasted capacity, but rather as protective or contingency capacity. By providing additional output flexibility, this capacity provides protection against the variability that exists inherently across manufacturing processes, supply chain partners, and customer demands. Having protection against variability in the system helps to ensure that the desired flow throughout the system is maintained and that customer expectations like on-time delivery are met.
Learning Block 2 Summary Operational infrastructure consists of physical and often fixed-capacity resources. Different process choices will have different implications for the specific infrastructure required to ensure proper support of market requirements. Different process choices require different types of facility layouts. Facility layouts include product, process, job shop, and cellular layout. Postponement strategies are needed to offset the exposure to uncertain demand forecasts. The goal of these strategies is to defer production as long as possible without exceeding the customer’s tolerance for waiting. Postponement strategies include MTO, ATO, and MTS. An MTS postponement strategy also requires supply support to strive for low inventory levels to avoid oversupply while also providing high levels of customer service by preventing shortages.
Customization allows for unique customer designs and requirements to be manufactured effectively and efficiently. It works for standard processes that are used to achieve highly specialized outcomes.
Due to the variability within organizational and business systems and the inability to predict future events accurately, contingency plans must be developed. Contingency planning involves considering the full range of risks and developing contingency plans to mitigate them.
Figure 6. Manufacturing and service operations. Developed by LINCS in Supply Chain Management Consortium.
Figure 25. Contingency plans. Developed by LINCS in Supply Chain Management Consortium with image from pixabay.com.
MSO.v2.25 (03/29/2017) Page 35 of 105
Learning Block 2 Practice Questions 1. Which of the following is NOT an element of operational infrastructure?
a. Buildings b. Equipment c. Utilities d. Raw materials
2. Which of the following is NOT true about operations infrastructure?
a. It requires large investments with a long pay-back period. b. There is no consideration of maintenance requirements. c. Decisions commit an organization to a given production process and strategy for a long
period of time. d. Decisions can only be made after a market segment has been chosen.
3. A product layout is best suited for which of the following?
a. Assembly lines employing discrete, repetitive, and continuous processes b. Job shops c. A supplier site project environment d. A customer site project environment
4. Cellular layout design is best used for which of the following?
a. Fixed-position layout b. Process layout c. Layout to group capabilities in order to manufacture in small quantities d. Fully automated assembly lines
5. Fixed-position layout is a good choice when:
a. It is impractical to move the product during manufacturing b. The product will be manufactured using a high-output, repetitive process c. The product will be made using a continuous process d. It is an option to reduce assembly line costs
6. Which of the following is NOT a valid postponement strategy?
a. Design and make-to-order b. Assemble-to-order c. Make-to-stock with supply chain support d. Make-to-stock without supply chain support
7. Which of the following is true about describing forecasts?
a. Longer forecast periods have more inaccuracies than shorter forecast periods. b. More historical data always results in more accurate forecasts. c. Detailed forecasts have more inaccuracies than general forecasts. d. Demand forecasts always match actual customer demands.

MSO.v2.25 (03/29/2017) Page 36 of 105
8. Which of the following is a good example of a postponement strategy?
a. Placing stock close to the source of production and replenishing as needed b. Moving stock as close to the customer as possible c. Using assemble-to-order when the customer is not willing to wait d. Design and make-to-order when the customer is not willing to wait
9. Developing contingency plans enable an organization to:
a. Prevent stock-outs b. Manufacture safety stock c. Make provisions for potential disruptions d. Procure excessive raw materials
10. Which of the following is an example of customization?
a. Standard-model automobile b. A laptop that includes selectable components c. A fast-food meal at a well-known franchise d. A yacht built precisely to customer requirements

MSO.v2.25 (03/29/2017) Page 37 of 105
Learning Block 3: Manufacturing Planning and Control
Learning Block 3 Description Plans and controls are major parts of manufacturing operations processes. Firms that are proficient at planning and control are better positioned to fulfill their commitments to customers in a cost-efficient manner.
This learning block provides a structure that describes several different planning and execution modules and a hierarchy of planning systems within the manufacturing operations environment.
Learning Block 3 Learning Objectives Upon completing this learning block, the learner will be able to:
• Recognize the key 2 production plans • Understand the hierarchy of planning and control processes and systems • Implement job sequencing, or scheduling • Analyze the importance of production control
Unit 1: Types of Manufacturing Plans In manufacturing planning, there is no single system or approach that will satisfy all firms’ needs. Three categories of manufacturing plans exist and they are explained further as:
Level (Push) Production Plan
The first is called a level production plan or push production plan, in which a firm plans to produce a relatively constant amount of product during each planning period, such as a constant amount each month. One way to determine the production plan is to take an expected annual demand and divide by 12 to arrive at a monthly rate; this assumes that the average production rate will satisfy the demand over the early periods of the demand schedule.
For example, a plan that calls for producing 10,000 units per month starting in January is not likely to work if the combined January and February customer demand calls for 30,000 units, unless the company has safety stock to cover the 10,000-unit shortfall between
Figure 26. In this level production plan, the production remains constant while the demand fluctuates. Developed by LINCS in Supply Chain Management Consortium.

MSO.v2.25 (03/29/2017) Page 38 of 105
production output quantity and customer demand quantity. Safety stocks are stocks allocated to cover for forecast error and lead time variation which is the allowance made for variations in lead time, beyond the promised lead time, from suppliers. A level production plan usually results in inventory being used to satisfy demand during periods where it is higher than the constant production rate. Automakers typically assemble vehicles at a relatively constant rate, which is indicative of a level strategy.
Chase (Pull) Production Plan
The second type of production plan is called a chase production plan or pull production plan. This approach maintains a stable inventory level while varying production to meet demand; the company chases the demand. A company that practices MTO, for example, will produce goods only when actual customer orders are received. In a chase environment, buildup of finished goods inventory ideally should not occur, as production is increased only when demand increases.
Some industries practice a chase strategy because they have no other choice. Agriculture is a good example, as crops must be harvested when they ripen. A farmer cannot develop a plan to harvest strawberries over a 12-month period. While some crops may be stored and fully processed later according to a different production plan, the actual harvesting of the crop involves a pure chase strategy.
Mixed Strategy
The third type of production planning strategy is called a mixed strategy. This approach recognizes that it might be best to produce at a level rate for a period of time with some accumulation of inventory, and then that rate to respond to expected demand changes. This represents a combination of level planning and chase planning.
Crayola provides a good example of a mixed strategy. The iconic maker of crayons produces at a relatively constant rate during a year with some buildup of inventory but will make production plan adjustments in anticipation of back-to-school demand. Companies for which seasonality affects demand patterns to a significant degree often employ a mixed strategy that features production adjustments over the year.
Unit 2: Planning and Control Processes and Systems Manufacturing planning and control systems make up a significant part of the operations infrastructure. Implementation involves a series of planning steps for effective execution that starts as long-term but moves progressively to shorter-term, more accurate planning timeframes. Figure 29 highlights the
Figure 27. In this chase production plan, the production is always the same value as the demand. Developed by LINCS in Supply Chain Management Consortium.
Figure 28. In this mixed strategy, the production increases with demand, but never drops below a certain value when demand is low. Developed by LINCS in Supply Chain Management Consortium.

MSO.v2.25 (03/29/2017) Page 39 of 105
elements that comprise traditional manufacturing planning and control systems, with associated explanations.
Figure 29. Production and planning. Developed by LINCS Supply Chain Management Consortium.
Demand Estimation and Capacity Planning
Estimating demand is part of a sales and operations planning (S&OP) process that involves the development of a prediction or estimate of the amount of resources required for a product or service. Demand estimates are often limited to a particular period of time, such as a month, quarter, or year. This process can be used to come up with fairly accurate estimates if the input assumptions are correct.
A number of input assumptions may be incorporated in developing a demand estimate:
Forecasts of anticipated finished product customer demand: A prediction of what customer demand will be in future time periods
Actual orders: Customer commitments or orders that must be fulfilled in a given time period
Figure 30. Demand estimation and capacity planning in production and planning. Developed by LINCS In Supply Chain Management Consortium.

MSO.v2.25 (03/29/2017) Page 40 of 105
Service and spare part requirements: Many products have aftermarket requirements like service and repair that require inventory to be available. Providing this inventory represents a demand for manufacturing output.
Inventory level adjustments: Firms may occasionally adjust their inventory levels to reflect changes in their policies or processes. These changes may have an impact on increasing or decreasing the manufacturing output in a given time period. For example, increasing safety stock to guard against risk requires an increase in manufacturing to produce the additional safety stock. Conversely, a new system that facilitates more accurate planning could reduce the need for safety stock.
Promotional items for sales and marketing purposes: These sample products used by the sales and marketing functions create a demand on manufacturing output
Product recalls: Recalled products may need to be replaced; these replacement items consume manufacturing capacity.
Once the demand for an item or service is understood over given time periods, capacity planning can be performed, which generally consists of plant, utility, and equipment requirements. It is important to recognize that capacity is dynamic, meaning that it is constantly changing and evolving. In the short term a firm can affect the amount of capacity it has available by scheduling overtime, adding shifts, or even subcontracting work to a third party. Beyond the short term, however, capacity will only change if new plants and equipment are added.
Aggregate Production Planning
Aggregate planning is a type of medium-range capacity planning that typically covers three to 18 months (BusinessDictionary.com, 2015). It is used in the manufacturing environment to determine planned overall output levels and the appropriate resources that are needed to make those groups of products. Its primary objective is to balance supply and demand. Aggregate plans are time-phased, meaning that they project different requirements for specific time periods in the future.
Aggregate planning involves developing monthly, quarterly, or yearly production requirements for product groups or families that will meet demand estimates; it requires an accurate demand estimation as an input, and accurate demand estimations usually arise from the use of historical demand data.
The plan considers overall capacity requirements to meet the demand plan expressed in aggregate measures such as tons, gallons, or units. These measures represent the amount of equipment, machinery, and labor capacity required to meet the demand plan.
Figure 31. Aggregate production planning in production and planning. Developed by LINCS in Supply Chain Management Consortium.

MSO.v2.25 (03/29/2017) Page 41 of 105
Aggregate plans usually consider relevant costs, such as hiring, layoff, inventory carrying, overtime, and under-time costs. Many companies develop their aggregate plans with sophisticated techniques that provide optimized plans by using software tools to help to automate and to support the planning process.
There are three primary reasons why a company engages in aggregate planning:
• To balance production supply with production demand. • To plan for future demand and identify potential resource constraints. • To help plan for orderly shifts of production capacity to meet the peaks and valleys of expected
customer demand. The aggregate plan provides a future view of demand and allows a company the opportunity to ensure; for example, that it has a sufficient supply of raw materials and components from suppliers to meet anticipated demand and production requirements to meet this demand. The resource constraints involved in aggregate planning can include labor, equipment, materials, and financial constraints. Since many companies have products with demands that are affected by seasonality, the aggregate planning process also helps to manage demand shifts in an orderly fashion. This is accomplished through understanding when demand is expected to increase or decrease because of seasonality and allows a company to increase and decrease its supply of raw materials and its manufacturing of products to meet this demand in an orderly and cost-effective fashion.
Master Production Scheduling (MPS)
A master production schedule (MPS) is a time-phased schedule for individual product requirements, not the components, subsystems, or assemblies which make up these products. MPS depends on the aggregate production plan as a primary source of input. The schedule usually provides weekly requirements over six to 12 months. Figure 32 shows the interrelationship between aggregate plans and MPS.
Figure 33 shows that the aggregate plan reports the total number of refrigerators and dishwashers that must be produced to meet anticipated customer demand, broken down by quarter. This is used as an input to the MPS, in which the total numbers of refrigerators and dishwashers are broken down into the specific models of refrigerator and dishwasher that need to be produced in each week of each quarter to meet that anticipated demand.
The MPS serves as a primary input to the materials requirements planning (MRP) system, which is addressed in this section. Figure 34 shows the interrelationship between aggregate planning and the MPS. Earlier periods in the MPS will likely be divided into weeks or even days, while later periods might appear as months. Each company will decide how it wants to organize its MPS in terms of time periods.
Figure 32. Master production schedule in production and planning. Developed by LINCS in Supply Chain Management Consortium.

MSO.v2.25 (03/29/2017) Page 42 of 105
Figure 33. Aggregate plan input to master production schedule. Developed by LINCS in Supply Chain Management Consortium.
Capacity Requirements Planning (CRP)
Capacity requirements planning (CRP) breaks down a company’s product mix and then aggregates the capacity requirements of these more detailed plans at the work center level. CRP develops load profiles, which are the number of units that must be produced and the time it will take to make these products at each work center, to determine if adequate capacity of labor and materials is available. It is an iterative process, especially as the MPS undergoes revisions, which could occur daily, weekly, or monthly.
The reasons for performing capacity requirement planning (CRP) are important to ensure the company is producing efficiently (Bass, n.d.). Earlier capacity planning efforts were likely performed at a higher level than rough-cut capacity planning,
If CRP indicates that capacity is insufficient, operations personnel may decide to:
Figure 34. Capacity requirements planning in production and planning. Developed by LINCS in Supply Chain Management Consortium.
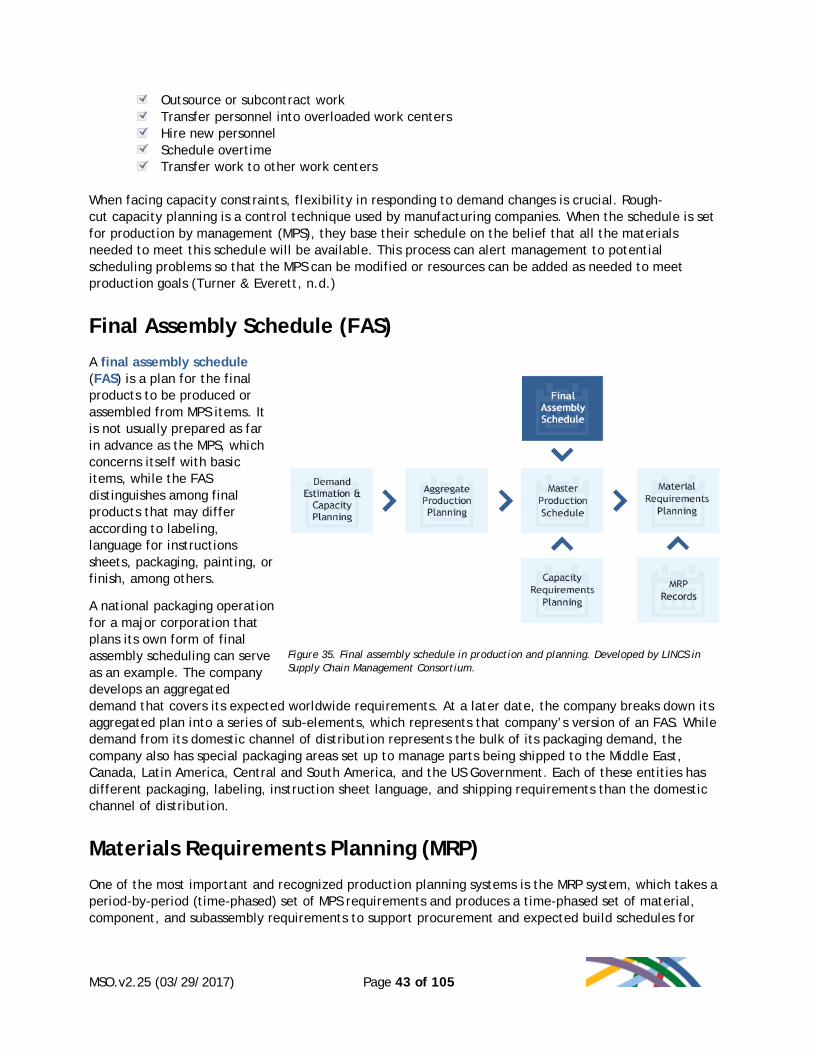
MSO.v2.25 (03/29/2017) Page 43 of 105
Outsource or subcontract work Transfer personnel into overloaded work centers Hire new personnel Schedule overtime Transfer work to other work centers
When facing capacity constraints, flexibility in responding to demand changes is crucial. Rough-cut capacity planning is a control technique used by manufacturing companies. When the schedule is set for production by management (MPS), they base their schedule on the belief that all the materials needed to meet this schedule will be available. This process can alert management to potential scheduling problems so that the MPS can be modified or resources can be added as needed to meet production goals (Turner & Everett, n.d.)
Final Assembly Schedule (FAS)
A final assembly schedule (FAS) is a plan for the final products to be produced or assembled from MPS items. It is not usually prepared as far in advance as the MPS, which concerns itself with basic items, while the FAS distinguishes among final products that may differ according to labeling, language for instructions sheets, packaging, painting, or finish, among others.
A national packaging operation for a major corporation that plans its own form of final assembly scheduling can serve as an example. The company develops an aggregated demand that covers its expected worldwide requirements. At a later date, the company breaks down its aggregated plan into a series of sub-elements, which represents that company’s version of an FAS. While demand from its domestic channel of distribution represents the bulk of its packaging demand, the company also has special packaging areas set up to manage parts being shipped to the Middle East, Canada, Latin America, Central and South America, and the US Government. Each of these entities has different packaging, labeling, instruction sheet language, and shipping requirements than the domestic channel of distribution.
Materials Requirements Planning (MRP)
One of the most important and recognized production planning systems is the MRP system, which takes a period-by-period (time-phased) set of MPS requirements and produces a time-phased set of material, component, and subassembly requirements to support procurement and expected build schedules for
Figure 35. Final assembly schedule in production and planning. Developed by LINCS in Supply Chain Management Consortium.

MSO.v2.25 (03/29/2017) Page 44 of 105
subassemblies and end products. MRP is a look-ahead system in that it collects information from a variety of sources and plans for probable future events.
Each unique product at a company, whether it is an end item sold to customers, a component part of end items, or a subassembly (a component that has components), has a unique computerized MRP record. Even if one component used in, for example, five different end items will still have only one MRP record. The MRP system will aggregate the demand requirements for five of those items and present that as an aggregated figure in the component’s MRP record. For example, a standard shelf might be used in five different types of refrigerator but the shelf would still have only a single record in the MRP system.
MRP systems and records rely on three critical inputs. Incorrect data from any three of these data sources will lead to erroneous MRP records:
• Time-phased demand data from the MPS: This data populates the gross requirements portion of the MRP record
• Updated bill of materials (BOM): The BOM is like the recipe for a product. It lists the amounts and numbers of raw materials, components, and subassemblies required to build or assemble a product.
• Current inventory status of the item: This figure includes any inventory that is available for use and not committed to any other use. Some companies call this uncommitted stock.
Several features make MRP systems and records unique. First, an MRP system is one of the few systems in which supply and demand are considered together. In fact, supply and demand are considered explicitly within an MRP record. The gross requirements, the top line of the record, and the planned order releases, the bottom line of the record, represent the demand for an item. The scheduled receipts, planned order receipts, and the projected available balance line relate to supply. The second unique feature is that MRP systems feature both planning and execution. Additionally, systems called MRP II are used to incorporate the necessary resources with the equipment planning to arrive at a holistic view of total requirements. MRP II is a method used to plan effectively for all resources needed for manufacturing. MRP II addresses operational planning, financial planning, and includes a comprehensive simulation tool to answer what-if questions to minimize risk.
MRP Records
Figure 37 is a basic MRP record. Recall that every end item, component, and subassembly has a single MRP record. The vertical columns are time periods, also called time buckets. If an MRP record is in
Figure 36. Material requirements planning in production and planning. Developed by LINCS in Supply Chain Management Consortium.

MSO.v2.25 (03/29/2017) Page 45 of 105
weeks, Period 3 would represent three weeks from the current period. The current period is always considered Period 0.
Figure 37. Sample MRP Record. Developed by LINCS in Supply Chain Management Consortium.
Each line of the MRP record contains important information:
• Gross requirements: This is the gross or unadjusted demand line of the MRP record. Its primary input comes from the MPS. This line can include forecasted demand or actual orders. MRP records cannot be completed unless demand information appears in the gross requirements line, but it is not necessary to have a demand figure in each time bucket.
• Scheduled receipts: Any items currently being built or on order from suppliers will appear in the time bucket when they will be available. These are not planned items but rather actual work orders or work-in-process.
• Planned order receipts: This represents the time period when an item and its required quantity must be available. It is a plan in anticipation of a future requirement. MRP systems assume the planned order receipt is available at the beginning of the specific time period.
• Projected available balance: This is the amount of physical inventory projected to be available at the end of each time period; it is also the beginning inventory for the next period.
• Planned order releases: These are expected future orders, which correspond to planned order receipts adjusted for an item’s lead time. If, for example, a company has a planned order receipt for period 5 with a two-period lead time, then the planned order release quantity would appear in period 3. Planned order release is also called the net requirements line and represents what quantity is actually needed of a given item after adjusting for any scheduled receipts and beginning available balances.
• Safety stock: This represents any safety inventory carried to prevent stock-outs that is built into the MRP record and plan. Technically, a safety stock of five units, for example, means the project available balance line should not drop below five units in the MRP record.
• Lead time: This represents the time required to build an item or receive an item from a supplier or other part of the organization
• Lot size: This represents the quantity that will be built or ordered from a supplier every time a projected available balance falls below the next period’s gross requirement. Lot-for-lot means that only the quantity required will be scheduled or ordered. A lot size of 60, for example, means that items will be built or ordered in increments of 60. If 61 units are required, an order plan for 120 will be generated.

MSO.v2.25 (03/29/2017) Page 46 of 105
Scheduling Considerations
Four major considerations associated with scheduling systems include finite and infinite loading and forward and backward scheduling. The following explains these concepts.
Infinite versus Finite Loading
Infinite loading assumes that no restrictions exist on capacity. With this approach a scheduling system simply prioritizes every job awaiting work. No attempts are made, at least by the system, to load work into specific work centers or onto specific machines. The virtue of this approach is its lack of complexity.
Finite loading considers work center capacities when allocating work. A finite loading system not only prioritizes pending work, but also assigns resources to complete that work.
Forward versus Backward Scheduling
Forward scheduling systems assign work to the earliest unassigned time slots in work centers. This approach is more likely to be used when no customer commitments or orders are in place. This might be the approach taken by a company operating in an MTS environment; recall that an MTS company schedules and builds to forecasted amounts, while an MTO company schedules and builds to actual customer orders. The virtue of forward scheduling is that a company can schedule in ways to maximize efficiencies, such as minimizing certain kinds of equipment changeovers between jobs. Jobs can be scheduled to ensure the most efficient use of labor and equipment resources.
Backward scheduling plans around the date promised to the customer. Once the due date commitment is noted, a scheduler determines the best way to deliver by that date. This is a recommended approach whenever a company absolutely must meet specific promise dates to customers; it applies to both manufacturing and service providers.
Production Control
A major part of manufacturing and operations planning is to ensure that the execution of the production plan takes place accurately and efficiently; this is referred to as production control. Technically, production control includes any activity involved in handling materials, parts, assemblies, and subassemblies, from their raw or initial stage of production to the finished product stage, in an organized and efficient manner. It may also include activities such as planning, scheduling, routing, dispatching, and storage.
A range of production control measures are typically used to indicate whether a production system is in control. Some control measures include (Learning Block 5 addresses measurement in detail):

MSO.v2.25 (03/29/2017) Page 47 of 105
• Forecast accuracy • Inventory record accuracy • Worker and equipment utilization and efficiency • Waste and scrap compared to budget • Conformance to job schedules • On-time delivery to customers • Accurate accounting of work-in-process • Finished goods production • Statistical process control (SPC) indicators
Learning Block 3 Summary Planning and control are major parts of production management and SCM. A hierarchy of planning and control systems exists to support planning and control at various levels. Once a company understands with confidence the demand for an item or service, it can begin to plan capacity, which usually consists of plant and equipment, financial resources, and human resources. At the next level of the hierarchy, aggregate planning results in a medium-range plan that typically covers three to 18 months. It is used in a manufacturing environment and determines overall planned output levels and the resources required to support the relevant groups of products.
Aggregate plans are a primary source of input for the MPS. The MPS is a disaggregated, time-phased schedule for individual product requirements (not components or subsystems and subassemblies). Other planning and control systems discussed include CRP and FAS. This learning block stressed the importance of MRP systems, which take a period-by-period (time-phased) set of MPS requirements and produce a time-phased set of material, component, and subassembly requirements timed to support procurement and expected build schedules.
Figure 38. Production control. Developed by LINCS in Supply Chain Management Consortium.
Figure 6. Manufacturing and service operations. Developed by LINCS in Supply Chain Management Consortium.

MSO.v2.25 (03/29/2017) Page 48 of 105
The importance of short-term scheduling or job sequencing must also be stressed. Day-to-day operations in manufacturing and service environment benefit from systems that prioritize work. The learning block concluded with a short discussion of production control, which includes any activity involved in handling materials, parts, assemblies, and subassemblies from their raw or initial stage of production to the finished product stage in an organized and efficient manner.
Learning Block 3 Practice Questions 1. Production control includes any _______ involved in handling materials, parts, assemblies,
and subassemblies from their initial stage of production to the finished product stage in an organized and efficient manner.
a. Cost b. Activity c. Paperwork d. Equipment
2. What type of scheduling system assigns work to the earliest unassigned time slots in work
centers?
a. Backward b. Infinite c. Finite d. Forward
3. What part of an MRP record represents the time period when an item and its required
quantity need to be available?
a. Planned order receipt b. Planned order release c. Projected available balance d. Gross requirements
4. What part of an MRP record represents the item quantity that will be built every time a
projected available balance falls below the next period’s gross requirement?
a. Projected available balance b. Safety stock quantity c. Gross requirement d. Lot size
5. What planning system involves the breakdown of a company’s product mix and aggregates the
capacity requirements of these more detailed plans at a work center level?
a. Projected available balance b. Safety stock quantity c. Rough-cut capacity planning d. Lot size

MSO.v2.25 (03/29/2017) Page 49 of 105
6. Which type of manufacturing plan is used to produce a relatively constant amount of product in each planning period?
a. Level production plan b. Split production plan c. Chase Production plan d. Hybrid production plan
7. What process is used to develop a prediction or estimate of product requirements?
a. Time-phased releases b. Workstation evaluation c. Demand estimation d. Customer surveys
8. A time-phased schedule system for individual product requirements that are not components,
subsystems, or assemblies is called a:
a. Master production schedule b. Materials requirement plan c. Final assembly schedule d. Demand forecast
9. Which of the following is NOT typically part of a demand estimate?
a. Historical demand b. Service and spare parts requirements c. Actual orders d. Inventory level adjustments
10. MRP records rely on which three critical inputs?
a. Time-phased demand data from the master production schedule, expected customer returns, and the current inventory status of the item
b. Time-phased demand data from the MPS, an updated bill of materials, and the current inventory status of the item
c. Statement of final assembly quantities, time-phased demand data from the master production schedule, and updated bill of materials
d. Statement of final assembly quantities, updated bill of materials, and the current inventory status of the item
MSO.v2.25 (03/29/2017) Page 50 of 105
Learning Block 4: Operational Improvement
Learning Block 4 Description Businesses work hard to reduce operating expenses as a way to achieve and maintain competitiveness in their marketplace. Operational expense reductions are often achieved through a consistent approach to continuous improvement that is a cornerstone of the company’s culture. Operational improvement is the notion that no process is perfect and improvements can continually be realized through employee involvement, teamwork, and the application of proven improvement techniques.
Learning Block 4 Learning Objectives Upon completing this learning block, the learner will be able to:
• Recognize the basics of the lean concept • Understand the set of lean objectives, including flow, pull, striving for perfection,
standardization, and simplification • Apply the five important elements of lean production systems • Analyze the set of lean tools and applications, including value stream mapping, process
mapping, kaizen workshops, and the 5S improvement methodology • Implement quality management and improvement tools and techniques, including design of
experiments, process proving, SPC, and Six Sigma
Unit 1: Continuous Improvement In today’s competitive business environment, a company cannot survive and achieve profitability simply by having an excellent product and service portfolio. The products and services must be seen by consumers as a value proposition, meaning that they are perceived as desirable and offered at a reasonable price. Consumers shop to find products and services that have good operational performance, reliability, quality, and prices that are in line with or below competing products and services.
To achieve competitiveness, companies place emphasis on their operational processes and practice continuous improvement by attempting to identify opportunities to streamline work and reduce waste. Waste is defined as work that is performed but does not add value.
Many companies practice formal approaches to achieve continuous improvement by using lean processes and a collection of other quality management practices. While many companies have

MSO.v2.25 (03/29/2017) Page 51 of 105
adopted formal lean and quality improvement practices, other companies simply use the formal processes as a framework and actually implement a less formal approach when that is warranted.
Whether the route to improving operations is through formal or informal processes, the focus should be the same; the company should look for opportunities within its operations to streamline how work is performed and reduce and eliminate waste while performing that work. A company’s success with these initiatives will contribute to a more competitive position and lead to providing products and services that are seen as good value. Figure 39 shows a typical closed-loop process for identifying activities that can be implemented to streamline work and reduce waste. The term closed-loop refers to the fact that once improvements are implemented, the process repeats itself to continue to fine tune and improve operations to achieve continuous improvement.
Unit 2: Lean Lean is a business philosophy rather than simply a set of tools and techniques. At a very high level, lean is the relentless pursuit of eliminating waste across an organization and its supply chain.
Most of what is written and discussed about lean is oriented to manufacturing organizations, which is not unusual since early lean initiatives were pioneered at manufacturing firms. However, while lean concepts are essential to manufacturing success, the initiatives can be applied to all activities in any organization. The relentless pursuit of waste reduction applies in any industry: profit or non-profit, industrial or non-industrial, service or manufacturing. Furthermore, the domain of tools and activities that are part of lean is broad, so virtually any activity that eliminates waste anywhere across an organization can be part of a lean initiative.
Figure 40. Lean process. Developed by LINCS in Supply Chain Management Consortium.
Brainstormto identify improvement
opportunities
Planthe best approaches for
revising work
Implementthe revisions and changes
Assessthe new process for achieving objectives
Figure 39. Closed-loop improvement process. Developed by LINCS in Supply Chain Management Consortium.
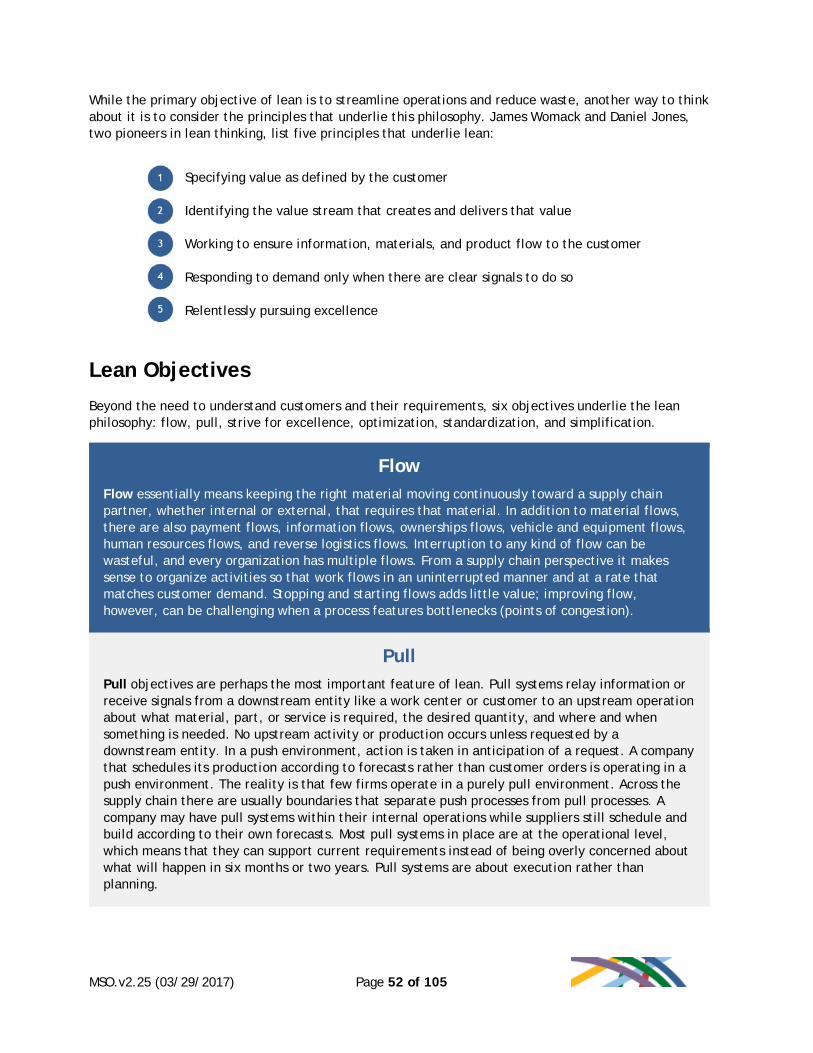
MSO.v2.25 (03/29/2017) Page 52 of 105
While the primary objective of lean is to streamline operations and reduce waste, another way to think about it is to consider the principles that underlie this philosophy. James Womack and Daniel Jones, two pioneers in lean thinking, list five principles that underlie lean:
Specifying value as defined by the customer Identifying the value stream that creates and delivers that value Working to ensure information, materials, and product flow to the customer Responding to demand only when there are clear signals to do so Relentlessly pursuing excellence
Lean Objectives
Beyond the need to understand customers and their requirements, six objectives underlie the lean philosophy: flow, pull, strive for excellence, optimization, standardization, and simplification.
Flow Flow essentially means keeping the right material moving continuously toward a supply chain partner, whether internal or external, that requires that material. In addition to material flows, there are also payment flows, information flows, ownerships flows, vehicle and equipment flows, human resources flows, and reverse logistics flows. Interruption to any kind of flow can be wasteful, and every organization has multiple flows. From a supply chain perspective it makes sense to organize activities so that work flows in an uninterrupted manner and at a rate that matches customer demand. Stopping and starting flows adds little value; improving flow, however, can be challenging when a process features bottlenecks (points of congestion).
Pull Pull objectives are perhaps the most important feature of lean. Pull systems relay information or receive signals from a downstream entity like a work center or customer to an upstream operation about what material, part, or service is required, the desired quantity, and where and when something is needed. No upstream activity or production occurs unless requested by a downstream entity. In a push environment, action is taken in anticipation of a request. A company that schedules its production according to forecasts rather than customer orders is operating in a push environment. The reality is that few firms operate in a purely pull environment. Across the supply chain there are usually boundaries that separate push processes from pull processes. A company may have pull systems within their internal operations while suppliers still schedule and build according to their own forecasts. Most pull systems in place are at the operational level, which means that they can support current requirements instead of being overly concerned about what will happen in six months or two years. Pull systems are about execution rather than planning.

MSO.v2.25 (03/29/2017) Page 53 of 105
Strive for Excellence Strive for excellence supports the notion that poor quality creates waste should not even be open to debate. Any deviation from a desired target or state carries with it an associated loss. In a lean supply chain, there is minimal inventory to fall back upon when quality errors occur, making the pursuit of zero defects critical. The challenge with any quality issue is to identify the root cause of an error, which could be simply due to poor measurement, eliminate the root cause, and then prevent future problems from occurring.
Optimization Optimization can be pursued in many areas; the result of something that is optimized is usually a reduction in waste. To optimize is to make something as perfect, effective, or functional as possible. While many observers equate optimization with reduction, less of something does not always equal optimization.
Standardization Standardization means to conform to something that is established as a model or ideal example. Too many firms fail to standardize their common parts, processes, practices, documents, contracts, measurements, policies, and procedures across their business units when standardization opportunities exist. This usually leads to wasteful duplication of effort that fails to promote best practices. During product design, for example, the extensive use of custom-designed components when standard or previously designed components are available can be wasteful.
Simplification Simplification seeks to reduce the scope or complexity of something without diminishing its effectiveness. Two areas that often benefit from simplification are process design and product design. When simplifying important processes like customer order fulfillment, supplier evaluation and selection, or new product development, non-value adding and wasteful activities are targeted for improvement or elimination. Process improvement teams search for creative ways to perform tasks, which should lead to shorter cycle times and cost reductions. The various tools for process improvement and simplification are used to map current processes and identify areas for process improvement through elimination of waste, duplication, and non-value adding activities.
Why be concerned with simplifying product designs? A simplified product almost always requires fewer parts, resulting in fewer suppliers, fewer material releases, lower logistics requirements, less inventory, improved quality, and lower inventory management costs. Eliminating unnecessary components clearly reduces product cost.
Elements of Lean Operations
Many elements comprise lean manufacturing operations and the key elements are setup time reduction, facility layout changes, pull systems, uniform loading, level scheduling, and 5S. Each of these six elements is explored further:

MSO.v2.25 (03/29/2017) Page 54 of 105
Setup Time Reduction
The first area that companies might address is to reduce manufacturing setup times. Setup time reduction, also referred to as changeover time, is the systematic process of minimizing machine and resource downtime during changeovers from manufacturing one part to another.
Setups are essentially non-value adding activities. The primary focus with non-value adding activities is to minimize their impact on the ability to pursue value-adding activities. Even if an organization is not formally following lean, setups impede flow, and impeded flow affects throughput, productivity, and capacity. The goal of running smaller lot sizes cannot be achieved without briefer equipment and resource setups. No single way exists to reduce setup times. The quest to shorten these times involves a variety of approaches, ranging from studies that detail and document movements down to the second to the addition of new capabilities.
Planning and staging is another important concept that supports not only setup improvements but also better flow across operations. Planning and staging means that some entity, whether it is a facility that is waiting for a supplier shipment or a work center that is processing a sequence of jobs, has access to information that enables it to know what is coming next and when a change will occur. This allows key staff to have the required tools, personnel, equipment, documents, and materials ready to support the change. Planning and staging allows work to be done concurrently in anticipation of a need.
Facility Layout Changes
Every organization that has facilities has physical layouts that constrain or promote the flow of work. After setup time reduction, facility change is the most popular area where companies focus their lean transformation efforts. Manufacturing facilities often feature layouts in which parts and materials move from one work center to another as they progress through manufacturing. Traditional facilities are organized around specialized work centers that group similar equipment and technology together, such as separate work centers for storage, assembly, testing, painting, inspection, finishing, or packaging. This grouping can cause unnecessary movement between work centers.
In many cases, facility layouts create waste through excessive materials handling and movement between work centers, workers who are too specialized across separate and largely disconnected work centers, and material tracking systems that are often too complex. Many advantages come to light when firms pay close attention to physical layouts, including reduced production cycle times, reduced work-in-process inventory, and reduced floor space requirements. Other outcomes include less materials handling, less complex scheduling and control systems, improved product quality, enhanced operating flexibility, and lower total costs.
Figure 41. Time reduction. Developed by LINCS in Supply Chain Management Consortium.
Figure 42. Facility layout. Developed by LINCS in Supply Chain Management Consortium.

MSO.v2.25 (03/29/2017) Page 55 of 105
For many companies, the answer to inefficient layouts is to change the layout so as to remove the wasteful practices of specialized work centers. This often means adopting a cellular layout or work cell. Cellular layouts feature grouping dissimilar operations and equipment together, often in a U-shaped work cell, rather than grouping similar operations and equipment together. The cell layout lends itself to clear visibility of work, minimal materials movement, simplified scheduling, and worker flexibility. Physical layouts should undergo regular reviews as part of the continuous improvement process.
Work center rearrangement in a facility can be a major task, and other challenges often surface during the process. Some equipment does not lend itself to being placed near other equipment, which is a defining characteristic of a work cell. A facility may also be too old to support a new layout, or some equipment may be too large to move. Equipment may also generate emissions or hazardous waste that prevents it from being placed in a general work area. At times, new layouts require the purchase of new equipment, triggering the need for a financial investment analysis.
A final challenge to facility layout changes is that any physical change that alters employees’ normal routines or job responsibilities can easily run into resistance. Worker or departmental specialization must often give way to a flexible and responsive workforce.
Pull Systems
Lean supply chains operate in a push-versus-pull environment. The concept of pull is integral to lean because no upstream activity occurs unless requested by a downstream entity. Pull systems feature action that is taken in response to a direct request rather than anticipating a need that may never occur. The trigger to initiate an act in a push environment originates upstream, with downstream entities managing the consequences. The trigger is often a forecast of anticipated demand that sets the supply chain in motion.
Visible signals, or what the Japanese call a Kanban, are central to a pull system. A kanban is a signaling device that gives authorization and instructions from a downstream center for production or withdrawal of items in an upstream center. These signals, which ideally are non-verbal, can consist of cards, lights, spaces in a rack, and squares on a floor. Kanbans are triggers to do something such as producing goods or moving material downstream.
Figure 44 illustrates how a two-card kanban system operates between work centers. A two-card system typically uses P and C cards. A P, or production, card is a trigger to produce whatever part and quantity is listed on that card. A C, or conveyance, card is a trigger to retrieve the named part in the specified quantity listed on the card. The following steps (represented by circles with numbers inside in Figure 44) show how a two-card system works:
Figure 43. Pull systems. Developed by LINCS in Supply Chain Management Consortium.

MSO.v2.25 (03/29/2017) Page 56 of 105
Work Center 2 (the downstream work center) uses material that was requested earlier from Work Center 1 (the upstream work center). The C card that was attached to the load is removed and placed in a kanban post. A C card that is not attached to material is a trigger to retrieve more material.
An employee goes to the temporary holding area between the work centers with the C card. At the holding area the employee removes the P card from the load and inserts the C card.
The load with the newly inserted C card is moved to Work Center 2, where the material is needed.
The P card that was removed in Step 2 is sent to the kanban post in Work Center 1.
The P card at the kanban post triggers production of the material and in the quantity listed on the card.
The P card is attached to material in a returnable container and moved to a temporary holding area to await an employee to arrive with a C card to retrieve the material.
Figure 44. Two-card Kanban system. Developed by LINCS in Supply Chain Management Consortium.
A balanced material flow between centers ensures that any inventory in the temporary holding areas, which in value stream mapping are called supermarkets, is consumed by a downstream work center. The same pull logic works between companies in a supply chain, although this is not quite as perfected as managing flow between internal work centers.
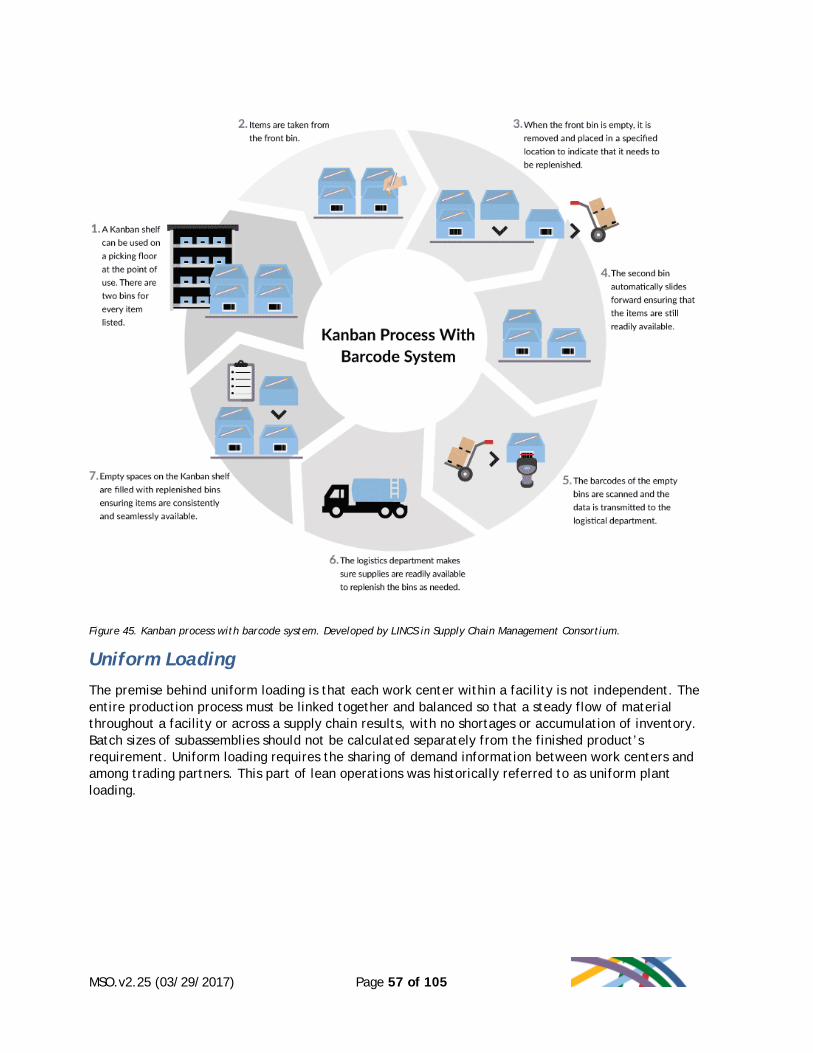
MSO.v2.25 (03/29/2017) Page 57 of 105
Figure 45. Kanban process with barcode system. Developed by LINCS in Supply Chain Management Consortium.
Uniform Loading
The premise behind uniform loading is that each work center within a facility is not independent. The entire production process must be linked together and balanced so that a steady flow of material throughout a facility or across a supply chain results, with no shortages or accumulation of inventory. Batch sizes of subassemblies should not be calculated separately from the finished product’s requirement. Uniform loading requires the sharing of demand information between work centers and among trading partners. This part of lean operations was historically referred to as uniform plant loading.

MSO.v2.25 (03/29/2017) Page 58 of 105
Uniform loading requires open and accurate sharing of information up and down the manufacturing process and supply chain. The adverse effects of not sharing demand information combined with a lack of data transparency can be considerable, leading to excess inventory, poor customer service, and higher production costs. Minor demand fluctuations at the end customer or retail level often amplify as they move further up the supply chain. This amplification, known as the bullwhip effect, is the result of not knowing (and not sharing) the demand for an end product. Each link in the supply chain only knows what the preceding link ordered, and each link produces forecasts based on the anticipated demand of the next customer in the supply chain. This process often leads to over- or under-ordering of raw materials and parts and overproduction or underproduction of products within each link in the supply chain. This effect becomes amplified throughout the supply chain as the different companies overcompensate or undercompensate for these errors in their subsequent ordering and manufacturing quantities.
Level Scheduling
Level scheduling involves scheduling and building a similar product mix every day during a given period. This part of lean operations can be difficult for many companies, particularly those with highly seasonal businesses or where demand is otherwise erratic. Level scheduling works best with consistent patterns of customer demand.
Companies that make a limited number of products on an assembly line are ideally suited to benefit from level scheduling. The assembly line tends to move at the same pace every day, making the routine predictable. The automotive industry serves as an example of level scheduling; cars move down an assembly line at a set and predictable pace. Each line makes a relatively small number of vehicle types at a steady pace.
An important part of level scheduling, and one of the few lean terms that is not a Japanese word, is takt time. Takt is the German word for the baton a conductor uses to create a steady beat. Within lean operations, the takt time is the rate at which customers demand a product. The demand rate establishes the takt time, so it is easy to see that an erratic demand pattern makes it hard to establish a consistent takt time. The challenge is to set up and staff a process that is synchronized to the takt time.
For example…
A hypothetical example illustrates takt time. A work center with 50 hours of available machine time per week and a demand of 100 units has a takt time of 30 minutes. A completed unit must flow from the work center every 30 minutes, given a demand of 100 per week. The takt time will change if available machine time or demand changes.
Figure 46. Loading. Developed by LINCS in Supply Chain Management Consortium
Figure 47. Level scheduling. Developed by LINCS in Supply Chain Management Consortium

MSO.v2.25 (03/29/2017) Page 59 of 105
5S
5S is a Japanese lean methodology designed to reduce waste and optimize productivity through better workplace organization. The following 5S elements or pillars are applied in some companies' efforts to achieve lean manufacturing:
• Sort (Japanese Seiri): Identify and divide items into retain, return, or eliminate
• Set in Order (Seiton): Create a place for all items needed: organize, arrange, and store material, equipment, and supplies.
• Shine (Seiso) : Create a work area that is clean, well lit, and organized
• Standardize (Seikets u): Make the 5S process an habitual part of everyday work
• Sustain (Shitsuke): Ongoing application of the knowledge and skills learned from the 5S process, applied across the organization
Unit 3: Quality Improvement Tools and Techniques Many different tools and techniques are available to support quality improvement. One way to think about quality improvement tools and techniques is to divide them into two broad categories.
The first category deals with approaches normally applied during product and process design. The primary objective of these techniques is to eliminate process variability and thus ensure that a process and design are capable of being produced consistently. During the product and process design phases, emphasis is placed on engaging supplier and customer involvement, ensuring that designs do not exceed equipment capabilities, proofing processes, and other techniques shown in Figure 48 that designers use to create designs that fit within a defined variability range.
The second category stresses approaches to ensure that a previously validated process remains in control and maintains process stability, or a steady state. Some of the techniques in this category also stress continuous improvement (see Figure 48) such as SPC, value analysis, kaizen, and any other approaches that keep the focus continuously on improvement.
Figure 48. 5S. Developed by LINCS in Supply Chain Management Consortium.

MSO.v2.25 (03/29/2017) Page 60 of 105
Product and Process Design Focus: Eliminate Process Variability
Steady State Focus: Maintain Process Stability
• Concurrent product and process design • Early supplier and customer involvement • Quality function deployment • Design for assembly/manufacturability • Process proving studies (Cpk) • Design of experiments • Value Engineering
• Statistical process control • Pre-control • Value analysis • Quality improvement teams • Kaizen techniques • Continuous improvement processes and
measurement
Figure 49. Quality improvement techniques and approaches. Developed by LINCS in Supply Chain Management Consortium.
The following are outlines of three important quality management approaches; SPC, Six Sigma methodology, and five steps to define, measure, analyze, improve, and control (DMAIC) for process improvement studies.
Statistical Process Control (SPC)
A process should only be used for actual manufacturing once its capability has been tested and proven. At the point of confidence, the emphasis should shift from eliminating process variability to maintaining process consistency. SPC is the primary tool used in determining whether a previously proven process remains in control. SPC is the application of statistical methods to identify and control the special causes of variation in a process.
SPC techniques monitor quality, typically of machine operators, while a product is being made. These techniques provide largely real-time information concerning the items produced. If SPC charts reveal an out-of-limit situation or a troublesome trend that shows non-random deviations, then operators should take corrective action as required. This technique almost always relies on constant data collection and statistical charting.
SPC charts reveal when a process is allowing the production of products beyond their acceptable limits. An out-of-limit condition occurs when the measurements taken from the product output exceed the statistically derived limits that define process control limits. When a process consistently moves outside those limits, it is considered out of control.
SPC charting does not tell an operator why products are out of limits and why a process might be out of control or trending toward being out of control. It also does not tell the operator how to correct any issues with the process. Other quality management techniques focus on finding the root cause of problems.
Figure 50. Statistical process control. Developed by LINCS in Supply Chain Management Consortium.

MSO.v2.25 (03/29/2017) Page 61 of 105
Six Sigma Methodology
Six Sigma is a term used to describe a specific set of techniques and tools for process improvement. It was pioneered at the Motorola Corporation in the mid-1980s; by the 1990s, it was widely adopted by companies that had a major emphasis on quality and process improvement. General Electric has been recognized as a leader in integrating Six Sigma throughout the culture of its organization.
Six Sigma seeks to improve the quality of the output of a process by identifying and removing defects and their causes and by minimizing variability in manufacturing and business processes. It uses a set of quality management methods that are supported by statistical techniques, relying on an infrastructure of trained personnel who are experts in these methods to drive the organization toward improvement. Six Sigma is typically implemented through projects that follow a defined sequence of steps and have specific value targets, such as reducing process cycle time, reducing defects, reducing costs, increasing customer satisfaction, and increasing profits.
The term Six Sigma (capitalized because it was written that way when Motorola filed the trademark in 1993) originated from terminology associated with statistical analysis of manufacturing processes. The maturity of a manufacturing process can be described by a sigma rating that indicates its yield, or the percentage of defect-free outcomes it creates. A Six Sigma process is one in which 99.99966% of all opportunities to produce an outcome are statistically expected to be free of defects; this can also be stated as 3.4 defects per one million opportunities.
DMAIC Improvement Process
The define, measure, analyze, improve, and control (DMAIC) methodology is central to Six Sigma. Figure 52 presents the major features of each DMAIC step. It is not difficult to see how this approach, when applied rigorously across an organization, is an effective improvement technique.
Phase Description
Define
• Define the customer, their critical-to-quality issues, and the core business process involved
• Define the boundaries of the improvement project
• Define the process to be improved by mapping the process flow
• Identify the customers of the process and their requirements and expectations
Measure
• Measure the performance of the business process involved
• Develop a data collection plan
• Collect data from many sources to determine types of defects and metrics
• Compare to customer feedback to determine shortfalls
Figure 51. Six Sigma. Developed by LINCS in Supply Chain Management Consortium.

MSO.v2.25 (03/29/2017) Page 62 of 105
Figure 52. Major features of DMAIC. Adapted from the www.isixsigma.com dictionary.
Learning Block 4 Summary This learning block focused on two major areas that support continuous performance improvement—lean and quality management. The need to improve operations and supply chain performance is a never-ending challenge.
Lean is the relentless pursuit of eliminating waste across an extended supply chain. It is important to understand the principles that underlie lean, which include specifying value as defined by the customer, identifying the value stream that creates and delivers that value, working to ensure information, materials, and product flow to the customer, responding to demand only when there are clear signals to do so, and relentlessly pursuing excellence. Many elements make up lean manufacturing and operations. In general, setup reduction, facility layout changes, pull systems, level scheduling, and uniform loading are the most essential parts of any lean manufacturing approach.
Analyze
• Analyze both the data collected and the process map to identify root causes of defects and improvement opportunities
• Identify gaps between current and desired performance
• Prioritize improvement opportunities
• Identify sources of variation
Improve
• Improve the process by designing creative solutions to eliminate defects’ root causes
• Create innovative solutions using technology and advanced tools
• Develop and deploy an implementation plan
Control
• Control the process to ensure improvements are maintained
• Prevent reverting back to previous methods
• Develop, document, and implement an ongoing monitoring plan
• Institutionalize the improvements through the modification of systems and structures
Figure 6. Manufacturing and service operations. Developed by LINCS in Supply Chain Management Consortium.

MSO.v2.25 (03/29/2017) Page 63 of 105
A variety of quality-related tools and techniques that facilitate performance improvement fall into two broad categories. The first category includes approaches applied during product and process design. These techniques seek to eliminate process variability and to ensure that production processes and designs are feasible and can actually be carried out. The second category helps ensure that a previously validated process remains in control and maintains process stability. This learning block discussed process proving studies and SPC. It also defined the Six Sigma methodology, which is the modern version of total quality management (TQM). Six Sigma is a term used to describe process improvement initiatives using sigma-based process measures or striving for Six Sigma-level performance. The DMAIC methodology is central to Six Sigma.
Learning Block 4 Practice Questions 1. The D is the first step in the DMAIC improvement process and is an abbreviation for:
a. Determine b. Define c. Decide d. Delineate
2. Which of the following is true about SPC charting?
a. Charts are used to correct product deficiencies b. SPC charts tell an operator how to correct a problem c. Charts can indicate that a process is out of control d. SPC charting signals an operator when a process is trending out of control
3. Six Sigma techniques are most closely aligned with:
a. Product design b. Production time standards c. Facility design d. Quality management
4. The 5S methodology is designed to reduce waste and optimize productivity through:
a. Better workplace design b. Product design c. Product sustainability d. Optimizing transportation
5. What is the first area that companies usually address to make their internal operations
lean?
a. Facility layout changes b. Level scheduling c. Pull systems d. Setup reductions
MSO.v2.25 (03/29/2017) Page 64 of 105
6. Companies practice continuous improvement initiatives to:
a. Fill gaps during process changeovers b. Satisfy management initiatives c. Streamline work and reduce waste d. Follow established procedures
7. Which choice best describes a kanban?
a. The flow rate of work into a work center b. A chart showing if production is staying in control c. A continuous improvement workshop d. An authorization and instruction from a downstream center for production or withdrawal of
items from an upstream center in a lean supply chain
8. In a two-card kanban system, what is a C card?
a. It is a conveyance card that triggers the movement of material from one work center to another
b. It is a conveyance card that triggers the production of an item c. It is a control card designed to introduce discipline into a work center d. It is a control card that triggers the movement of material from one work center to
another
9. What is the lean element that allows a steady and balanced flow of material to move through a facility or across a supply chain, with no shortages in inventory?
a. Level scheduling b. Uniform loading c. Uniform scheduling d. Level loading
10. In lean operations, what is the rate at which customers demand a product?
a. Flow time b. Order cycle time c. Takt time d. Throughout time

MSO.v2.25 (03/29/2017) Page 65 of 105
Learning Block 5: Performance Metrics
Learning Block 5 Description Performance metrics are an important aspect of operations and other functional groups including finance, marketing, warehousing, and purchasing. In the absence of metrics and other clear measures of performance, it is difficult to understand past and current performance. Performance metrics provide the objective evidence to identify processes that are working, or not working and help set management priorities for improvement efforts.
Learning Block 5 Learning Objectives Upon completing this learning block, the learner will be able to:
• Recognize the important role that measurement plays in supporting the attainment of manufacturing and supply chain objectives
• Explain the reasons for measuring performance • Understand the four components of performance measurement • Apply the characteristics of an effective measurement system • Differentiate various manufacturing and supply chain measurement categories and measures
Unit 1: Understanding Metrics Performance metrics are quantifiable measures that are used by companies to measure, track, and assess various processes. Metrics may vary from company to company; they will also vary between departments within a company. As key metrics are developed, a company may elect to summarize the metrics into a dashboard that enables management decision-makers to understand the performance of the organization and determine where actions are needed based on areas of subpar performance.
In the development of performance metrics, most organizations use a five-step process. The process is initiated by identifying the processes that should be measured, determining targets for each measurement by defining upper and lower limits of acceptability, setting up processes to collect data, updating graphs and reports, and taking the necessary actions when the metric shows that a process is outside of the acceptable range.
Collaboration across an organization is required to achieve a meaningful metrics program. After agreeing on what should be measured, it is often more difficult to find consensus on measurement limits, data collection processes, and when to take improvement actions. A total set of metrics employed by a company
Figure 53. Metrics. Developed by LINCS in Supply Chain Management Consortium.

MSO.v2.25 (03/29/2017) Page 66 of 105
summarized on a dashboard provides indicators about overall performance and behavior.
Performance Measurement
Measurement motivates individuals and groups to act in certain ways. It is important that measures promote the right kinds of behaviors to support organizational goals rather than narrow and sometimes conflicting goals. Measurement also helps identify areas that are most in need of improvement, and is an invaluable part of the continuous improvement process.
Another reason to measure performance is to identify rates of change. Measurement provides insight into performance over time that managers can use to project into the future. Measurement also conveys what is important both within an organization and to supply chain partners.
Performance measurement also supports important quality management principles. Measurement is an ideal way to convey an organization’s requirements and expectations, both internally and across the supply chain. Measurement also helps managers to base their decisions on objective, data-driven information rather than subjective impressions, another important quality principle. The measurement process is also an excellent way to promote continuous improvement, which is a requirement that never goes away. Once a performance target is attained, a new, more challenging target may be established.
Another aspect regarding performance measurement is employee performance. Employees are often evaluated based on metrics, paid by performance on metrics, and may be part of broader compensation programs that are based on team performance on metrics. Individual and team metrics may be developed based on higher-level and historic performance and expected future performance.
Characteristics of Effective Performance Metrics
The following set of principles serves as a guide when evaluating a performance metrics system:
Performance objectives are reviewed regularly and adjusted by management Metrics link to and support higher-level functional and company-wide strategies and objectives Metrics link to and support performance strategies and objectives of other functions Individuals or groups are held accountable for achieving performance results Metrics promote teamwork, continuous improvement, and cross-functional cooperation Metrics form the basis for reporting results to executives Metrics include triggers that indicate when process control tasks are necessary Metrics include well-defined plans regarding how to achieve each measure
Figure 54. Performance measurement. Developed by LINCS in Supply Chain Management Consortium.
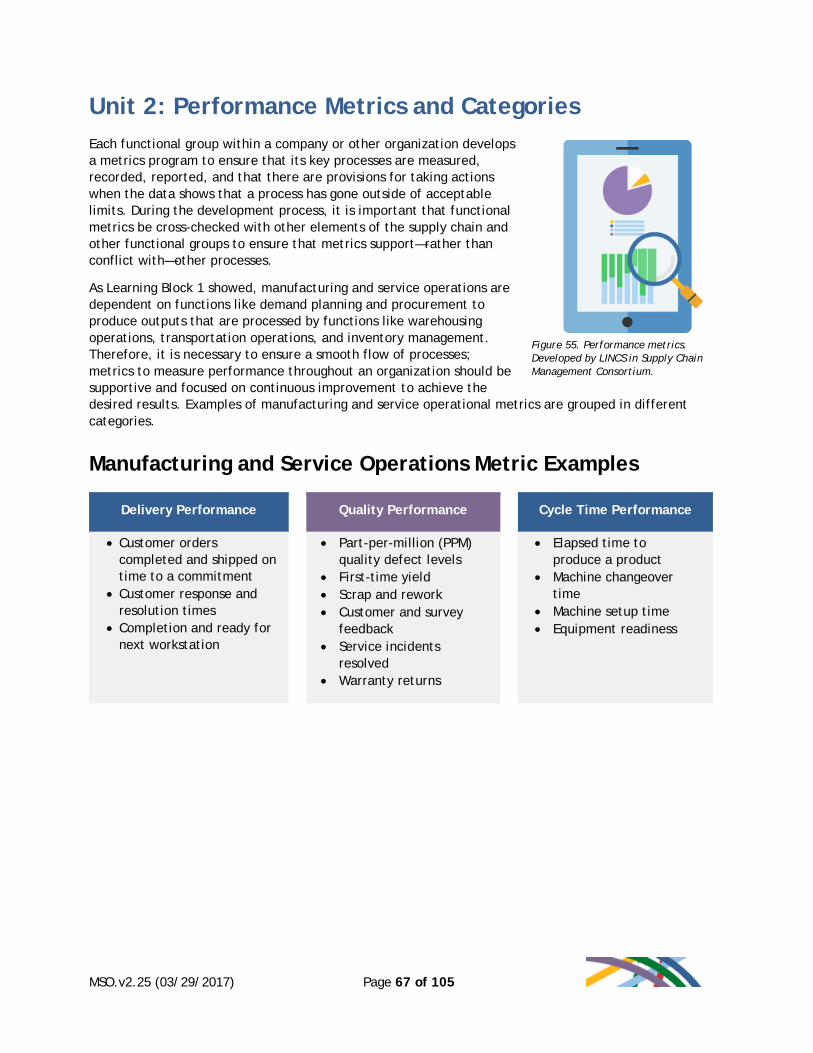
MSO.v2.25 (03/29/2017) Page 67 of 105
Unit 2: Performance Metrics and Categories Each functional group within a company or other organization develops a metrics program to ensure that its key processes are measured, recorded, reported, and that there are provisions for taking actions when the data shows that a process has gone outside of acceptable limits. During the development process, it is important that functional metrics be cross-checked with other elements of the supply chain and other functional groups to ensure that metrics support—rather than conflict with—other processes.
As Learning Block 1 showed, manufacturing and service operations are dependent on functions like demand planning and procurement to produce outputs that are processed by functions like warehousing operations, transportation operations, and inventory management. Therefore, it is necessary to ensure a smooth flow of processes; metrics to measure performance throughout an organization should be supportive and focused on continuous improvement to achieve the desired results. Examples of manufacturing and service operational metrics are grouped in different categories.
Manufacturing and Service Operations Metric Examples
Delivery Performance Quality Performance Cycle Time Performance
• Customer orders completed and shipped on time to a commitment
• Customer response and resolution times
• Completion and ready for next workstation
• Part-per-million (PPM)
quality defect levels • First-time yield • Scrap and rework • Customer and survey
feedback • Service incidents
resolved • Warranty returns
• Elapsed time to
produce a product • Machine changeover
time • Machine setup time • Equipment readiness
Figure 55. Performance metrics. Developed by LINCS in Supply Chain Management Consortium.

MSO.v2.25 (03/29/2017) Page 68 of 105
Safety Performance Cost Performance
• Number and severity of overall accidents and incidents
• Environmental accidents and incidents
• Regulatory non-compliance incidents
• Total costs expended to
make a product • Labor hours expended
per x dollars • Non-productive labor
hours (resulting from material shortages, equipment downtime, etc.)
• Revenue per employee • Training hours per
employee
Learning Block 5 Summary Measuring performance is an important part of every functional group and activity; it is an important enabler of organizational success. This learning block identified the reasons for measuring or assessing performance, including the need to motivate individuals and groups to act in certain ways, promote the right kinds of behaviors that support organizational rather than narrow and sometimes conflicting goals, identify areas that are most in need of improvement, and identify rates of change. Measurement is also an integral part of quality management, particularly the need to stress objective rather than subjective decision-making. This learning block also stressed the four parts of effective measures and the characteristics of an effective measurement system.
Production and supply chain measures, which include manufacturing and service operations measures, can be grouped into different categories. Numerous examples of measures across different supply chain categories were provided. These categories included supplier-related measures, transportation-related measures, manufacturing/operations related measures, distribution-related measures, and planning and control measures. The challenge becomes one of developing a set of measures that are not in conflict.
Whatever measures are used, they must align with corporate objectives, not conflict with other measures, and promote desirable behavior. Measures should also include well-defined plans regarding how to achieve each measure along with who is accountable for success or failure.
Figure 6. Manufacturing and service operations. Developed by LINCS in Supply Chain Management Consortium.

MSO.v2.25 (03/29/2017) Page 69 of 105
Learning Block 5 Practice Questions 1. Past and current performance metrics can be used as an enabler to:
a. Make individuals accountable for errors b. Justify poor quality production c. Predict and plan for future performance limits for new metrics d. Discontinue continuous improvement
2. What is the best definition of performance metrics?
a. Theory used in setting safety stock levels b. Quantifiable measures to track and assess performance c. Measures used only in manufacturing d. Relying solely on the ability of barcode systems to scan inventory
3. Management decisions for improvements should be based primarily on which type of data?
a. Short-term b. Subjective c. Sporadic d. Objective
4. Which of the following is a good example of a quality performance metric for a manufacturing
operation?
a. Procurement overhead b. New sales c. Parts per million (PPM) defect level d. Average total cost per unit
5. Which performance metric category provides an indication of performance for accidents,
incidents, and environmental issues?
a. Safety b. Finance c. Support d. Suppliers
6. Which of the following is a good example of a manufacturing cost performance metric?
a. Non-productive labor hours b. Machine readiness c. On-time delivery d. Safety infractions
7. In addition to providing an indication of performance, metrics can also indicate what other
attribute about a company?
a. Earnings b. Trust c. Profitability d. Behavior

MSO.v2.25 (03/29/2017) Page 70 of 105
8. Multiple metrics at a summary level are often displayed or collected in a document referred
to as a: a. White paper b. Dashboard c. Display board d. Accelerator
9. What is a standardized delivery metric that is used in many industries?
a. Customer orders completed and delivered to a commitment b. Non-conformance charges c. First-pass yield d. Warranty return rates
10. Which of the following is NOT a manufacturing-related measure?
a. Overall equipment effectiveness b. First-time yield c. Changeover or setup times d. Transportation vehicle demurrage and detention charges

MSO.v2.25 (03/29/2017) Page 71 of 105
Learning Block 6: Systems and Technology
Learning Block 6 Description Systems and technology play a major role in manufacturing and service operations. This learning block highlights the key systems and technologies used to support manufacturing and service operations including enterprise resource planning (ERP), condition monitoring systems, computer-aided design (CAD), and computer-integrated manufacturing. Key aspects of mechanization and automation are also covered specifically including computer controlled conveyors and robotics.
Some of the emerging technologies and systems used in manufacturing and service related operations are presented including 3D printing, responsive web design, and cloud computing.
Learning Block 6 Learning Objectives Upon completing this learning block, the learner will be able to:
• Recognize the role and importance of systems and technology in manufacturing and service operations
• Understand the key aspects of automation in manufacturing operations • Apply the role and importance of emerging technologies in use in modern manufacturing and
service operations
Unit 1: Role of Technology Technology encompasses a wide variety of innovations and tools that process and convert information into a useable format. Using computers as a base, there are many other communication and factory automation tools and advances that have become enablers to productivity that speed the flow and conversion of raw materials into finished goods.
In the past, a large portion of tasks and information flows among functional groups and customers were carried out manually. In many instances, these manual transactions and methods of communications were inefficient, unreliable, time-consuming, and prone to error. Conducting business in this fashion was costly and inefficient because it decreased a firm’s
Figure 56. Technology. Developed by LINCS in Supply Chain Management Consortium.
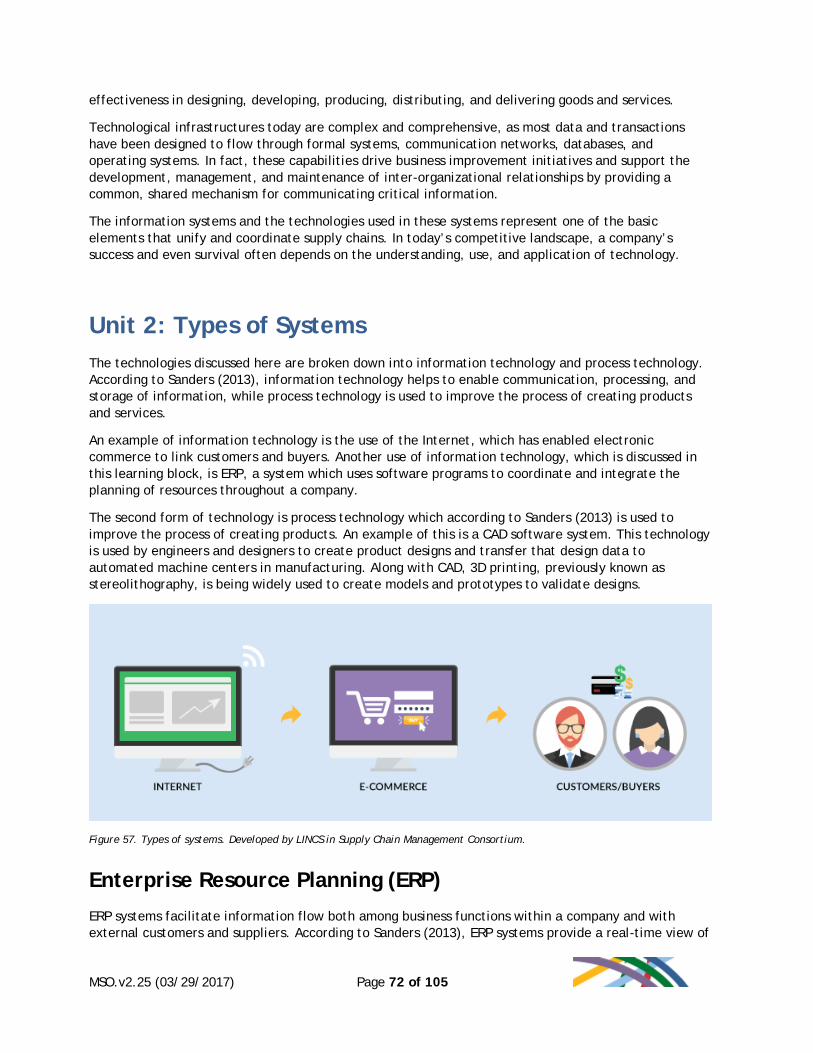
MSO.v2.25 (03/29/2017) Page 72 of 105
effectiveness in designing, developing, producing, distributing, and delivering goods and services.
Technological infrastructures today are complex and comprehensive, as most data and transactions have been designed to flow through formal systems, communication networks, databases, and operating systems. In fact, these capabilities drive business improvement initiatives and support the development, management, and maintenance of inter-organizational relationships by providing a common, shared mechanism for communicating critical information.
The information systems and the technologies used in these systems represent one of the basic elements that unify and coordinate supply chains. In today’s competitive landscape, a company’s success and even survival often depends on the understanding, use, and application of technology.
Unit 2: Types of Systems The technologies discussed here are broken down into information technology and process technology. According to Sanders (2013), information technology helps to enable communication, processing, and storage of information, while process technology is used to improve the process of creating products and services.
An example of information technology is the use of the Internet, which has enabled electronic commerce to link customers and buyers. Another use of information technology, which is discussed in this learning block, is ERP, a system which uses software programs to coordinate and integrate the planning of resources throughout a company.
The second form of technology is process technology which according to Sanders (2013) is used to improve the process of creating products. An example of this is a CAD software system. This technology is used by engineers and designers to create product designs and transfer that design data to automated machine centers in manufacturing. Along with CAD, 3D printing, previously known as stereolithography, is being widely used to create models and prototypes to validate designs.
Figure 57. Types of systems. Developed by LINCS in Supply Chain Management Consortium.
Enterprise Resource Planning (ERP)
ERP systems facilitate information flow both among business functions within a company and with external customers and suppliers. According to Sanders (2013), ERP systems provide a real-time view of

MSO.v2.25 (03/29/2017) Page 73 of 105
key business processes within a company, including production, order processing, and inventory management. In the past, these key areas tended to use independent systems that did not readily share information or promote common data standards. For example, the accounting, purchasing, inventory, and sales departments each used different systems that did not integrate well with the other systems. Reporting and tracking of basic business activities among departments was both time-consuming and unreliable.
An ERP system offers the ability to process information from parts of the organization and different types of transactions within a single, integrated solution tracked in real time that can provide timely, accurate information to business managers (Leoni, 2012). There is no need with ERP systems to export data from multiple independent systems to arrive at a desired set of results or reports—the ERP system allows all authorized staff within a company access to the information they need.
Information such as production quantities, product attributes, and manufacturing capacity is used to make decisions; this information comes from the machines and the processes used in manufacturing. Sensors, controls, and machine operators collect data like quantity produced, the remaining quantity to produce, and key quality attributes, and feed this information to the ERP system for integration and analysis.
Figure 58. Enterprise resource planning. Developed by LINCS in Supply Chain Management Consortium.
Condition Monitoring Systems
Manufacturing facilities and equipment are designed to perform specific functions. Once the layout and processes have been defined and approved, physical conditions can often be identified that indicate a failure may be imminent by use of monitoring systems. Under these circumstances, it may be possible to repair or remove the item from service before a functional failure actually occurs.
Monitoring equipment is used to detect the ongoing condition of equipment and is designed to warn operators when an operation is deteriorating or has deteriorated. This leads to an equipment shutdown to prevent harm to the operator or equipment and
Figure 59. Even older models had a mechanical shut off valve that would prevent the bottles from overfilling if the regular valve failed. By AlfvanBeem (Own work) [CC0], via Wikimedia Commons.

MSO.v2.25 (03/29/2017) Page 74 of 105
production of defective goods. An example of an automatic shutdown by monitored equipment is filling bottles of Coca-Cola; if the machine is overfilling bottles, shutdown occurs automatically.
Computer-Aided Design (CAD)
CAD is a system that uses computers and complex graphics software as a tool in the design of products. These systems enable designers to develop, adjust, and revise designs easily and quickly. Designs for products are saved electronically; when design changes are needed they can easily be modified. In addition, many CAD software packages have a standard parts library that allows ready access to common parts that are commercially available.
CAD can also be used to test how different dimensions, tolerances, and materials react to different conditions. For example, tests can be performed to assess how different parts would stand up to conditions like varying loads and changes in temperature. This is carried out on the computer using CAD software packages with built-in engineering design calculations.
One important CAD use applies to the manufacturing environment. CAD has the capability to integrate product design with a manufacturing process at the machine level. The actual CAD data is used to program the production machine (called computer-integrated manufacturing). Transferring data in this fashion reduces machine programming errors and enables quicker machine setup and run times.
CAD increases the speed and flexibility of the design process. Designs can be produced on the computer screen, manipulated, and shared with other departments like engineering, manufacturing, suppliers, and even customers to obtain feedback and consider adding inputs.
Computer-Integrated Manufacturing
Computer-integrated manufacturing refers to the integration of product design data and the planning of processes used to make a product. These types of systems integrate CAD data files with numerically controlled machines.
The key purpose of these types of integrated systems is to achieve greater responsiveness and flexibility among different parts of the organization. They allow companies to respond more quickly to customer needs, new product designs, revisions to existing designs, and the incorporation of new materials and technologies into products.
Unit 3: Automation Automation and mechanization have been incorporated by many companies; they are well-suited to manufacturing, in which tasks are repetitive and throughput is achieved by repetitive, discrete, and continuous processes. Automation occurs when a system controls the operation of the equipment and makes decisions about product placement and flow. For example, if a pallet with work-in-process is being stored between workstations, the control system will decide where to move the pallet according
Figure 60. Computer-aided design. Developed by LINCS in Supply Chain Management Consortium.
Figure 61. 3D Printer. By User: Semenko (Own work) [CC BY-SA 3.0], via Wikimedia Commons.

MSO.v2.25 (03/29/2017) Page 75 of 105
to algorithms in the system. In manufacturing, this can be used to place this pallet near the closest workstation that requires those parts.
Automation in Supply Chain
Meeting goals and objectives of sustainability and efficiency is a challenge for supply chain management. Industry leaders focus on sustainable growth in every process because inconsistent processes are not efficient and are bad for business. Automating processes in the supply chain is helping companies make the most out of the available resources while providing better customer service (Rauscher, 2014). To succeed in enforcing and maintaining consistent processes in the supply chain, there are mechanical systems handling equipment that automate processes; for example,
Conveyors
In manufacturing operations, conveyors are used to move and transport products between workstations. Conveyors provide a safe, efficient, and effective way to move large quantities of materials; they have gates that can be programmed for material to be moved to specific workstations or destinations. In the Federal Express sorting facility in Memphis, Tennessee, packages are transported daily on miles of conveyors that facilitate the processing of over 3 million packages per day at peak times. Conveyors have electronic optical reading devices attached to gates which read bar codes on the packages and then automatically direct each package to its destination.
Robotics
Robotics or robots are used to support human effort in manufacturing operations; in some cases, robotics has replaced human effort. Robotics were initially introduced in manufacturing to replace operations and tasks that were hazardous or unsafe for humans, like working around fumes when spray-painting cars or welding car frames, which emits dangerous sparks. In most instances today, a robot consists of a robotic arm that is used for highly specific tasks, including welding and painting operations, subassembly operations, and loading and unloading of machinery (Sanders, 2013). This increases the speed of operation, improves accuracy, and is particularly useful in carrying out difficult tasks.
Sanders (2013) explains how some robots are fairly simple and carry out a repetitive set of instructions, while can be quite complex. Robot arms that weld in a set series of steps are one, simple form of robotics. A more complex type of robot might be a numerically controlled machine. These types of machines are controlled by computers and carry out a varied set of consecutive tasks that include drilling, boring, and turning of machine parts to the different required shapes and sizes.
Industrial Automation
Industrial automation is a broad term that describes the use of intelligent or smart machines in a manufacturing environment to allow specific processes to be performed with minimal intervention. The
Figure 62. Conveyor. Developed by LINCS in Supply Chain Management Consortium.
Figure 63. Robotic arm. Developed by LINCS in Supply Chain Management Consortium.

MSO.v2.25 (03/29/2017) Page 76 of 105
machines require control systems to make them intelligent. The machine control systems can be electrical, mechanical, hydraulic, pneumatic, or computerized; several can be combined into one control system, which is often the case.
The primary benefits of industrial automation include lean operations and reduced labor needs that still provide excellent quality, repeatable accuracy, and excellent customer satisfaction. Examples of industrial automation in use today include robotics, lasers that perform precision welding on mechanical assemblies and soldering on microcircuits, and computer integrated-manufacturing that controls machining operations like turning, milling, cutting, and drilling.
Unit 4: Emerging Technologies Innovations in technology are occurring rapidly; these changes enable companies to integrate productivity enhancements and new product offerings. In this unit, three of the newer technologies—3D printing, responsive web design, and cloud technologies—are presented.
3D Printing
The process now known as 3D printing is technology that goes back several years to a process called stereolithography or additive manufacturing. Stereolithography equipment was expensive and could only be justified by large organizations that were engaged in tight-tolerance, close-fit new design processes. Recently, 3D printers have become affordable and have replaced the more expensive older forms of stereolithography.
3D digital technology can print a three-dimensional solid object of almost any shape and size from a digital model or CAD design. The additive process applies successive layers of material until the desired object is created.
Sanders (2013) notes that 3D printers can be used to create products by using plastic, ceramic, or metal raw materials. The benefit of this technology is for creating a prototype of a product as part of the design process; the prototype can be used to prove out a new design and perform fit checks of that design in the assembly of various components.
3D printers can also be used for small-scale and low-quantity manufacturing when it is not cost-effective to purchase and install expensive equipment designed for manufacturing large quantities or undertaking long production runs. It is also highly effective when the goal is to produce a one-off, meaning that there is a demand or need for only one item. This is especially useful for filling a truly custom design order for a customer.
In service operations, 3D printing has become particularly common to re-engineer and manufacture replacement parts that are no longer manufactured or no longer available. When a technician attempts
Figure 64. 3D printer. By Creative Tools from Halmdstad, Sweden (Printrbot Simple - personal 3D printer) [CC BY 2.0], via Wikimedia Commons.

MSO.v2.25 (03/29/2017) Page 77 of 105
to repair or rebuild an expensive machine and finds that the failed part or parts are no longer available, the technician can work with a CAD operator to reengineer the part by creating a new digital design for the old part, and then use that design to create the object on a 3D printer.
Virtually all types of goods-producing industries can benefit from using 3D printing to create and verify a prototype item prior to production of by providing a customer with a single, unique item.
Responsive Web Design
As the use of mobile devices increase, many individuals are using them on the go to access information to review designs, process layouts, and components in the manufacturing environment. Companies that develop and design websites must design those sites to be viewed on a broad range of handheld devices like smart phones and tablets.
Responsive web design (RWD) is a process for designing website content that adjusts to different devices to facilitate viewing the desired information. The design goal is to provide an optimal viewing experience that includes easy reading and navigation with a minimum of resizing, panning, and scrolling.
Use of Cloud Technologies
Cloud computing provides users of computer services with the ability to store and process their data in third-party data centers, which are computers owned by a third party with flexible arrangements to add capacity as the number of users grow. A key aspect of cloud computing is the sharing of computer services. In this environment, data does not reside on a single personal computer or mainframe computer. It resides on computers that are more broadly accessible to users who need the capability and pay for their usage. In effect, the cloud allows companies to use advanced computer services and software applications that are located on a central server or servers and to pay only for services used without necessarily having to invest in expensive computing hardware or software.
With cloud computing, many users can access a single server to retrieve and update data without purchasing licenses for different applications. One manufacturing example of the cloud might be using CAD software; a company might need to design a product but would not want to invest in CAD software, which can be very expensive. It would simply pay a fee for the specific cloud-based computing service needed to create the product design.
Figure 65. Responsive web design. Developed by LINCS in Supply Chain Management Consortium.
Figure 66. Cloud computing. Developed by LINCS in Supply Chain Management Consortium.

MSO.v2.25 (03/29/2017) Page 78 of 105
Learning Block 6 Summary Several technologies are used in companies to support manufacturing and service operations. The first type of technology discussed is information technology, which enables communication and the processing and storage of information. The second type is process technology which is used to improve the process of creating products and services.
ERP software facilitates information flow between the many functions within a business and manages connections to outside entities, including customers. CAD is a system that combines computers and graphics software that is used by designers to design products.
Computer-integrated manufacturing refers to the integration of product design and planning of processes to manufacture a product. Several new technologies are being widely used in manufacturing, such as 3D printing, RWD, and cloud technologies.
Learning Block 6 Optional Supplemental Resources The optional supplemental resources listed below may be used to reinforce the content covered in this learning block.
Davis, M. M., Heineke, J. N., & Davis, M. M. (2005). Operations management: Integrating manufacturing and services (5th ed.). Boston: McGraw-Hill.
Leoni, J. (2012, February 12). What is an ERP System? eSoftware Professionals. Retrieved from http://www.esopro.com/erp-blog/erp-solutions/what-is-an-erp-system
Sanders, N., (2014). The Definitive Guide to Manufacturing and Service Operations (3rd ed.). Upper Saddle River, NJ: Pearson.
Learning Block 6 Practice Questions 1. Which type of system enables the communication, processing, and storage of information?
a. Machining system b. Process flow system c. Information technology systems d. Paper-based system
Figure 6. Manufacturing and service operations. Developed by LINCS in Supply Chain Management Consortium.

MSO.v2.25 (03/29/2017) Page 79 of 105
2. Which type of systems are used to improve the process of creating products?
a. Process technology systems b. Relational database systems c. Word processing systems d. Presentation systems
3. Which choice best defines the purpose of equipment condition monitoring systems?
a. Monitor setups efficiency b. Detect equipment and operator productivity c. Monitor conditions and warn operators when an operation is deteriorating or has
deteriorated d. Monitor return on investment
4. Computer-integrated manufacturing is used to:
a. Run manufacturing business systems b. Integrate product design data and plant maintenance improvements c. Integrate product design data and planning processes to manufacture products d. Monitor equipment setups and changeovers
5. Computer-aided design (CAD):
a. Plans machine preventive maintenance programs. b. Integrates machine run-time efficiency c. Decreases the speed and flexibility of the design process d. Is a system that uses computers and complex graphics software as a design tool
6. Enterprise Resource Planning (ERP) systems benefit users by providing:
a. The control system for equipment to make decisions b. A real-time view of key business processes with a company c. The systems for placing purchase orders d. A tracking system for customer service representatives
7. In a manufacturing operation, conveyors are used to:
a. Move and transport products between workstations b. Manufacture products c. Offload heavy containers d. Move only small quantities of items
8. Identify one form of manufacturing automation that has helped to increase the speed of an
operation, improve the accuracy of an operation, and is particularly useful in carrying out difficult tasks.
a. Robotics b. 3D printing c. CAD d. ERP

MSO.v2.25 (03/29/2017) Page 80 of 105
9. Using a digital model or CAD data, 3D printers are used to create:
a. Multi-dimensional product designs b. Two-dimensional products in limited sizes c. Two-dimensional paper objects d. Three-dimensional solid objects of almost any shape and size
10. Cloud computing provides computer services users with:
a. Collaboration across many individuals in a company b. Access to a server to retrieve and update their data without purchasing licenses for
different applications c. Storage and processing of data in third-party data centers d. The ability to store and process their data in a third-party data center

MSO.v2.25 (03/29/2017) Page 81 of 105
Learning Block 7: Maintenance and Quality
Learning Block 7 Description Within an operation's organization, manufacturing plants are often complex networks of machines, robotics, conveyors, forklifts, and the personnel that use that equipment to make products. The maintenance department is accountable for making sure that the physical plant and the machines, conveyors, and other materials handling equipment are all functioning properly and safely. The maintenance department may have a formal program to prevent breakdowns and failures; they also perform fixes in a timely manner when such an issue occurs. Depending on the role that is defined for maintenance in a particular company, they might also be responsible for the physical plant, or building, and housekeeping and grounds maintenance.
Learning Block 7 Learning Objectives Upon completing this learning block, the learner will be able to:
• Recognize the role and importance of maintenance service operations in helping to ensure equipment availability and reliability
• Understand the differences between preventive and corrective maintenance • Analyze the key aspects of housekeeping and cleaning services in a manufacturing environment • Summarize the concept of outsourcing, including how inventory management works with a third
party • Differentiate between quality assurance and quality control in operations
Unit 1: Maintenance Service Operations The expected readiness of manufacturing equipment used to create products has a significant effect a company’s ability to meet customer demand and on its profitability. Equipment breakdowns and failures disrupt manufacturing process flows, create idle worker time, and could impact product delivery commitments to customers.
Equipment readiness has to do with the time that equipment or machinery is actually functioning to produce goods. No piece of equipment or machinery is available 100% of the time, due to factors like breakdowns and planned routine maintenance. In addition, machinery and equipment does not
Figure 67. Maintenance service operations. Developed by LINCS in Supply Chain Management Consortium.

MSO.v2.25 (03/29/2017) Page 82 of 105
always run at its intended output rate due to wear and tear, inadequate setups, or poor installation. Manufacturing equipment must be serviced periodically, much like a car or any other mechanical system with multiple moving parts and assemblies. It is clear that equipment readiness contributes to the ability of a manufacturing operation to run processes optimally and achieve production goals.
The Maintenance Function
The primary goal of the maintenance function is to plan activities and work tasks to mitigate equipment failure. Ideally, maintenance should be performed to prevent equipment failures by replacing components and parts before they break, performing planned overhauls, lubrications, and adjustments.
However, even with the best preventive maintenance program, equipment may break or fail to operate in accordance with the intended specification. When this occurs, maintenance needs to have the necessary trained personnel and access to spare and replacement parts to quickly and effectively make the machine operational.
The maintenance function exists mainly to provide a service to the operations to ensure that plant and equipment is safe, reliable and available for manufacturing purposes.
Various Maintenance Functions
The maintenance exists to assure that the manufacturing and services processes functions remain operable to assure a smooth, continuous flow of materials and processes as outlined next:
Breakdown repairs Breakdown repairs are carried out on equipment or machinery that has broken down during the course of normal operation
Overhaul The process of repairing and maintaining a piece of equipment or machinery to restore it to working condition
Rebuild The process of building a piece of equipment or machinery to working condition after it has reached the end of its normal working life or after it has been damaged
Service
During the normal course of work the maintenance personnel perform routine operations carried out on a regular basis to keep machinery and equipment functioning effectively including minor adjustments and periodic lubrication
Modification The process of making a small adjustment, change, or addition to a piece of equipment or machinery to improve the operational output
Inspection The process of performing a physical examination or review. Inspection involves taking measurements and performing tests with gauges to determine proper functionality to a standard
Figure 68. Machine failures may be avoided with preventive maintenance.

MSO.v2.25 (03/29/2017) Page 83 of 105
Replacements The process of changing out a piece of equipment or machinery, or a component of this equipment or machinery when it has reached the end of its useful life
Unit 2: Types of Maintenance The maintenance department is usually chartered to provide maintenance actions at two primary levels; preventive maintenance and corrective maintenance. Preventive maintenance is predetermined work performed on a schedule that has the goal of preventing the sudden failure of equipment or components. Preventive maintenance helps to:
• Protect assets and prolong the useful life of production equipment • Improve system reliability • Decrease the cost of replacement • Decrease system downtime • Improves safety and reduce injury
In contrast to preventive maintenance, corrective maintenance is an important maintenance task that is performed in response to a breakdown or failure. It is performed to troubleshoot, isolate, and repair a defect or fault so that the equipment can be readily returned to a safe, operational condition. Corrective maintenance can be implemented on two levels: maintenance that has to be performed immediately after a breakdown or failure occurs and maintenance that can be deferred until a shift change or other convenient time. Deferrals can be used only if other similar machines are available to avoid disruptions in the manufacturing process. Both immediate and deferral corrective maintenance depend on the availability of skilled technical personnel and replacement parts.
Equipment failure can have adverse results in both human and economic terms. In addition to downtime and the costs involved in repairing or replacing equipment parts or components, there is the risk of injury to operators, and exposure to chemical or physical agents. Emphasis should always be placed on preventive maintenance over corrective maintenance as a way to minimize unsafe conditions and equipment failure.
Preventive Maintenance Tasks
There are three basic types of preventive maintenance:
• Scheduled inspections at regular intervals to find potential failures • Scheduled rework at or before some specific lifespan or operational limit • Scheduled discard of or one or more parts at or before some specified lifespan or operational
limit
These tasks are all directed at preventing failures. The inspection tasks can often be performed without removing the item from its installed position, whereas the rework and discard tasks generally require that the item be physically removed from the equipment and sent to a workshop for repair or replacement.

MSO.v2.25 (03/29/2017) Page 84 of 105
Scheduled inspections
Scheduled inspections are used to detect potential failures and call for the removal or repair of an item because it does not meet the required standards. This type of inspection will either reveal the components that require corrective action to prevent a functional failure or those components that will probably survive until the next inspection.
Scheduled rework
Scheduled rework is generally carried out on items that display characteristics of wear, as their probability of failure becomes greater after a certain operational lifespan. When an item does have a target lifespan, its failure rate can sometimes be reduced by imposing a time limit on units to prevent operating these machines past their limits; rework is performed to restore functionality.
Scheduled discard
Scheduled discard tasks are generally also carried out at specified life limits for equipment and machinery or for their components. These limits are also called either safe life limits or economic life limits. Safe life limits are established to avoid critical failures. Economic life limits are established because they have proven cost-effective in preventing non-critical failures.
Services and Lubrication
Most equipment and machinery requires numerous scheduled servicing and lubrication tasks to maintain satisfactory operation. Lubrication normally consists of discarding the old lubricant and adding new lubrication. Lubrication is usually done at fixed time intervals (as when replacing the oil in a car), whether or not there are signs that it is needed, because the cost is very low compared to the costs that might result from inadequate lubrication. The cost of lubrication is usually so low that it justifies the studies required to determine the most economical task interval.
Lubrication is considered a discard task. Servicing tasks such as checking air pressure provided to a machine or fluid levels in hydraulic systems are considered on-condition maintenance tasks. In these cases potential failures are represented by pressure or fluid levels below replacement level, so the condition is corrected as necessary.
Equipment and Machinery Failure
A functional failure can mean a total machine breakdown or loss, but it can also be defined as the inability to meet a specified performance standard. This occurs when a machine continues to function but produces parts that are out of tolerance or display poor quality. To define a functional failure for a given item first demands an understanding that item’s performance specifications and capabilities.
Figure 69. Lubrication. Developed by LINCS in Supply Chain Management Consortium.

MSO.v2.25 (03/29/2017) Page 85 of 105
Once the specifications and capabilities have been defined, physical conditions can often be identified that suggest that failure is imminent; it may be possible to remove the item from service before a functional failure occurs.
For example…
Through the use of SPC, discussed in learning block 4, an operator might detect that product output is deviating from the intended specification. Upon further research, the operator and maintenance personnel might detect that a change in machine operation, speed, or mechanical fatigue might be the cause of the substandard condition of the parts. In an automotive factory, an operator might detect that the robotic welds on a vehicle frame do not meet the required specifications. Upon further research, the team works to isolate the root cause resulting from insufficient voltage to the welder, incorrect welding rod material, or dissimilar metals. The goal of the maintenance team is to isolate and repair the equipment failure.
Consequences of Failure
The consequences of a failure will determine the priority for corrective and preventive maintenance activities required to deal with the failure and to prevent recurrence. These may range from the modest cost of replacing a failed component to the possible destruction of an entire piece of equipment or injuries, or worse, among workers. Therefore, maintenance is dictated not by the frequency of failure but by the nature of its consequences.
The more complex a piece of equipment or machinery is, the more ways there are in which it can fail. The consequences of failures can be grouped into the four main categories listed next. The consequence category also establishes the key objective for maintenance:
Types of Consequences Maintenance Objective
Safety Possible danger to workers
Scheduled maintenance is essential to reduce the risk of failure to an acceptable level
Operational Economic losses such as loss of product
output and repair costs
Scheduled maintenance is desirable if it costs less than the costs it prevents
Figure 70. Equipment failure. Developed by LINCS in Supply Chain Management Consortium.

MSO.v2.25 (03/29/2017) Page 86 of 105
Non-operational Normally involving only the costs of repair
Scheduled maintenance is desirable if it costs less than the costs it prevents
Hidden failure Involves failures that have no direct impact
but expose equipment and machinery to likely multiple failures
Scheduled maintenance is required to ensure the level of availability of the function necessary to avoid exposure to multiple failures
Unit 3: Total Productive Maintenance (TPM) Total productive maintenance (TPM) is a major element in lean manufacturing. As lean manufacturing aims to streamline operations and reduce waste, it is critical that machinery operates as intended without failure. TPM is aimed at ensuring that machinery never or rarely breaks down by keeping that equipment in a like-new condition and is also vital to reducing small stops from minor failures. TPM increases overall equipment effectiveness.
Elements of TPM
Maintenance management is typically viewed as a plant-wide or even company-wide resource called TPM, which rests on pillars or sub-programs and activities; Figure 71 shows the five pillars, each of which addresses a different aspect of effective maintenance. Note that operators and production management play a major role in and are exclusively responsible for the pillar called autonomous maintenance.
The purpose of TPM is to develop and implement a system that extends equipment life and reduces the average time between machine failures. TPM practices and the resulting system are plant-wide and cross-functional, involving production, maintenance, and engineering.
The manager of each function must be deeply and actively committed to the program and system. An important goal is to reduce the frequency and cost of emergency repairs (breakdown maintenance) through the proper application of autonomous maintenance, time-based maintenance, and condition-based maintenance. In Figure 71, all five TPM pillars and their corresponding attributes are outlined.
Pillar Goals Who What
Increase equipment effectiveness
Zero failures
Zero defects
Production and Maintenance teams
Identify losses
Set machine operational effectiveness targets
Root cause analysis and correction
Establish optimal equipment conditions

MSO.v2.25 (03/29/2017) Page 87 of 105
Autonomous maintenance
Operator understanding
Operator care and ownership
Operator teams Initial cleaning
Lubrication
Conduct general inspections
Planned maintenance
More efficient, cost-effective maintenance
Maintenance teams Daily and periodic inspections
Predictive maintenance
Lengthen equipment life
Spare parts control
Breakdown analysis
Lubrication control
Maintenance and operator skill training
Higher skill levels for operators and maintenance workers
Operators
Maintenance workers
Maintenance fundamentals
Predictive technology
Repair skills
Troubleshooting and diagnosis
Maintenance prevention during design
More reliable equipment is easier to maintain
Production design
Maintenance staff
Design goals, rules, and specifications
Design reviews
Figure 71. Five TPM pillars. Developed by LINCS in Supply Chain Management Consortium.
Equipment Installation and Upgrade Services
From time to time companies must install new equipment and technology or perform significant upgrades to current equipment. This may involve the removal of existi8ng equipment and the installation of new equipment, during which time the manufacturing process, or parts of that process, may become non-functional.
As time goes by, equipment and machinery ages and needs to be replaced. Additionally, new technologies are introduced that make manufacturing processes more productive and efficient. In these cases, companies will arrange to replace the old equipment and machinery with new equipment and machinery.
Figure 72. Equipment installation. Developed by LINCS in Supply Chain Management Consortium.

MSO.v2.25 (03/29/2017) Page 88 of 105
Unit 4: Maintenance Spares Maintenance spares are spare parts and subassemblies that are required to ensure that the plant and equipment is kept in a reliable and safe condition. The following are various categories of maintenance spares:
• Usage materials: These materials are used on a regular basis; typical examples are fasteners, cleaning materials, lubrication materials, and other consumables
• Schedule spares: These spares are typically used whenever a planned maintenance task is performed; they could include internal machine parts and roller bearings on conveyors
• Project materials: These are used for a planned project, and could include internal parts to rebuild a machine to a significant extent
• Breakdown spares: These are used when breakdowns occur to replace broken or non-functioning parts
• Insurance spares: These spares are used to protect against natural disasters; they could consist of an entire machine or set of machines to enable manufacturing to continue
Unit 5: Housekeeping
What is Housekeeping?
Housekeeping is fundamentally the process of ensuring that the workplace is kept neat, organized, and clean. Industrial housekeeping includes the provision of adequate workspace, adequate storage arrangements around workstations, and sufficient clearance around all equipment and machinery.
According to the Canadian Center for Occupational Health and Safety (2015), effective housekeeping can reduce or eliminate workplace dangers and help complete a job done safely and properly. Poor
housekeeping can lead to dangers in the work environment by suppressing hazards that cause injuries. Housekeeping also involves attitude. Good housekeeping embodies a certain discipline and mindset that can carry over into orderliness and discipline throughout manufacturing operations. Poor housekeeping can have the opposite effect. If the sight of paper, debris, clutter, and spills is accepted as normal, then other more serious health and safety hazards may also be taken for granted.
Unit 6: Manufacturing and Service Quality In an operations environment, quality improves reliability, increases production, and promotes customer satisfaction. Fewer product defects and service callbacks translate to fewer warranty claims and increased customer satisfaction. Process improvements that were previously discussed in Learning Block 4 also eliminate waste, improve flow, enhance workplace safety, and contribute to the bottom line.
Figure 73. Adequate storage. Developed by LINCS in Supply Chain Management Consortium.
Figure 74. Inadequate storage. Developed by LINCS in Supply Chain Management Consortium.

MSO.v2.25 (03/29/2017) Page 89 of 105
Quality Assurance vs. Quality Control
The terms quality assurance and quality control are often used interchangeably to refer to different ways of ensuring the quality of a service or product. These terms, however, do have different meanings.
Quality assurance consists of the planned and systematic management activities that are implemented in a quality program to enable the product and service requirements to be fulfilled. Quality control, on the other hand, is an evaluation or observation that is made of a product or service to indicate if the manufacturing or service process met standards and achieved the desired results.
Quality control is the process of ensuring that products and services meet consumer expectations. In a manufacturing environment, it is not unusual to find quality control inspection points that designate where a product might be subjected to either an in-process inspection—the measurement of attributes before the item is complete—or a final inspection once the product has been finished. In complex manufacturing processes, the value of performing in-process inspections is to determine the adequacy of the product during the manufacturing process, as many inspections and tests cannot be performed once the final assembly process has been completed. Additionally, finding or discovering defects after assembly could result in enormous rework or scrap costs. In many cases, manufacturing workers are trained to perform quality control inspections and tests but in cases of expensive precision products, separate quality control technicians usually perform the necessary checks.
Quality assurance is a management culture and high-level set of processes that are oriented to and focused on defect prevention, while quality control is product-oriented and focuses on defect identification. With a focus on defect prevention, process excellence is required; it is implemented through LEAN, SPC, Six Sigma, and DMAIC, as discussed in Learning Block 4. The integration of a comprehensive preventive maintenance program, as laid out in this learning block, is also a key element of keeping machines and manufacturing equipment operating at peak performance and efficiency.
Learning Block 7 Summary The expected readiness of manufacturing equipment and tools for performing service operations has a significant impact on a company’s ability to meet customer demand and profitability.
Preventive maintenance is predetermined work, performed on a schedule, with the aim of preventing wear and tear or sudden failure of equipment components. Preventive maintenance is carried out in order to help ensure that equipment and machinery is maintained well, without waiting for a failure to occur.
Corrective maintenance, as contrasted with preventive maintenance, is the function that enables rapid response to a sudden or unexpected failure. Tools, spare parts, and skilled on-call workers are critical to restoring equipment to its functional capability in order to meet manufacturing schedules.
Figure 6. Manufacturing and service operations. Developed by LINCS in Supply Chain Management Consortium.

MSO.v2.25 (03/29/2017) Page 90 of 105
TPM is a major element in lean manufacturing. The TPM discipline is aimed at ensuring machinery never or rarely breaks down because it is kept in like-new condition.
Housekeeping is fundamentally the process of ensuring the workplace is kept clean and tidy. Industrial housekeeping forms part of the general responsibility of all operations personnel. It includes the provision of adequate workspace and adequate storage arrangements, both around the workstation and near all equipment and machinery.
Quality control is the measurement and testing of products to ensure that requirements have been satisfied. Quality assurance consists of the management processes employed to optimize performance in preventing defects and deficiencies.
Learning Block 7 Optional Supplemental Resources The optional supplemental resources listed below may be used to reinforce the content covered within this learning block.
Davis, M., & Heineke, J. (2005) Operations Management: Integrating Manufacturing and Services (5th ed.). Waltham, MA: McGraw-Hill.
Sanders, N., (2014). The Definitive Guide to Manufacturing and Service Operations (3rd ed.). Upper Saddle River, NJ: Pearson.
Learning Block 7 Practice Questions 1. What is the primary goal of the maintenance function?
a. Plan activities and work tasks to mitigate equipment failure b. Retain and restore equipment to a specified condition to achieve its minimum useful life c. Retain and restore equipment to an unspecified condition to achieve its maximum useful
life d. Destroy equipment once it has reached its maximum useful life
2. Which choice best defines preventive maintenance?
a. Routine maintenance to guarantee that equipment will break down b. Maintenance of equipment after a failure c. Ignoring maintenance requirements so that equipment will fail d. Predetermined, scheduled work to prevent a sudden failure
3. A functional failure is defined as:
a. The ability of an item to meet a specified performance standard b. The inability of an item to meet a specified performance standard c. The inability of an item to meet an unspecified performance standard d. The ability of an item to meet an unspecified performance standard

MSO.v2.25 (03/29/2017) Page 91 of 105
4. Scheduled inspections are also called:
a. Run-to-failure maintenance b. Outsourced maintenance c. On-condition maintenance d. Supplier-managed maintenance
5. The total preventive maintenance (TPM) discipline is aimed at:
a. Ensuring that equipment is kept in like-new condition so that it rarely breaks down b. Ensuring that equipment is only in new condition so the machinery never breaks down c. Ensuring that equipment is only maintained by maintenance personnel so the machinery
rarely breaks down d. Eliminating the need for maintenance personnel to be involved in maintaining the
equipment
6. Which choice best defines corrective maintenance?
a. Planned maintenance b. Perform in response to a machine breakdown or failure c. Maintenance prevention during machine design d. Maintenance and operator skill training
7. Which choice best defines maintenance spares?
a. Items that are consumed in the production process to make products b. Items used to ensure that the plant and equipment are kept in a reliable and safe condition c. Utility backup systems such as generators d. Part-time maintenance department employees
8. Insurance spares are kept in inventory to protect against:
a. Production schedule fluctuations b. Natural disasters, to enable the continuation of manufacturing c. Maintenance operation changeovers d. Schedule slippage
9. Housekeeping is defined as:
a. The procurement of adequate workspace and utilities around workstations b. Scheduling the production equipment in plants c. The elimination of the need to keep the workplace clean and tidy d. The process of ensuring the workplace is kept organized, clean, and neat
10. The maintenance process of making a small adjustment, change, or addition to a machine
to improve its operational output is called:
a. Breakdown repair b. Modification c. Inspection d. Overhaul

MSO.v2.25 (03/29/2017) Page 92 of 105
References
Bass, B. (n.d.). The Advantages of Capacity Requirement Planning. Retrieved from http://smallbusiness.chron.com/advantages-capacity-requirement-planning-25152.html
Canadian Center for Occupational Health and Safety (2015, February 8), Workplace housekeeping - basic guide. Retrieved from http://www.ccohs.ca/oshanswers/hsprograms/house.html
Davis, M., & Heineke, J. (2005) Operations Management: Integrating Manufacturing and Services (5th ed.). Waltham, MA: McGraw-Hill.
Leoni, J. (2012, February 12). What is an ERP System? eSoftware Professionals. Retrieved from http://www.esopro.com/erp-blog/erp-solutions/what-is-an-erp-system
Rouscher, J. (2014). Automate processes for a sustainable supply chain. Retrieved from http://betanews.com/2014/09/18/automate-processes-for-a-sustainable-supply-chain/
Sanders, N. (2014). The Definitive Guide to Manufacturing and Service Operations (3rd ed.). Upper Saddle River, NJ: Pearson Education.
Turner, B., & Everett, W. (n.d.). Retrieved from http://www.wisegeek.com/what-is-rough-cut-capacity-planning.htm
What is aggregate planning? Definition and meaning. (n.d.). Retrieved from http://www.businessdictionary.com/definition/aggregate-planning.html

MSO.v2.25 (03/29/2017) Page 93 of 105
Practice Questions Answer Key
Learning Block 1 1. A 2. C 3. B 4. D 5. C 6. A 7. A 8. B 9. D 10. D Learning Block 2 1. D 2. B 3. A 4. C 5. A 6. D 7. A 8. C 9. C 10. D Learning Block 3 1. B 2. D 3. A 4. D 5. C 6. A 7. C 8. A 9. A 10. B
Learning Block 4 1. B 2. C 3. D 4. A 5. D 6. C 7. D 8. A 9. B 10. C Learning Block 5 1. C 2. B 3. D 4. C 5. A 6. A 7. D 8. B 9. A 10. D Learning Block 6 1. C 2. A 3. C 4. C 5. D 6. B 7. A 8. A 9. D 10. D
Learning Block 7 1. A 2. D 3. B 4. C 5. A 6. B 7. B 8. B 9. D 10. B

MSO.v2.25 (03/29/2017) Page 94 of 105
Manufacturing and Service Operations Certification Track Glossary
*: Indicates terms that come, in part or in whole, from the Supply Chain Management Terms and Glossary from August 2013 (cscmp.org).
0–9
5S Improvement Methodology: A Japanese lean methodology designed to reduce waste and optimize productivity through better workplace organization.
A
Actual Demand*: The known demand for a specific product based on customer orders and production orders that are open. Once an order is shipped or production is completed, specific demand quantity will become usage. Actual demand should be netted against any forecast for the same period, meaning that as orders are received they are considered to be part of an earlier forecast; those forecasts should be considered satisfied.
Actual Production: The amount of a product that a production facility actually produces, as opposed to the amount that it could produce if it were to run at full capacity.
Aggregate Plan*: A plan for the production process, two to 18 months in advance, to give management an idea of what quantity of materials and other resources are to be procured and when, so that the total cost of operations of the organization is kept to a minimum over that period.
Aggregate Planning*: An operational activity that compiles an aggregate plan for the production process.
Assembly Line*: A manufacturing process where products are completed from components as a result of a series of continuous activities. Henry Ford is widely recognized as the father of the assembly line. See Product Layout.
Assemble-to-Order (ATO)*: In this type of process, products are assembled from standardized parts and modules. The flexibility in this process is in how the parts are assembled. Usually, you have several options available that allow buyers to customize their assembled products. The process structures used in this type of operation are repetitive, and organizations use mass customization processes. Examples include Subway restaurants, which use an assembly line to make a customized sandwich from standardized ingredients or Home Depot’s paint department, which makes a customized color for a customer by mixing pigments with white paint.
ATO: See Assemble-to-Order.
Automation: A term used when a control system is in charge of equipment operation to the point of making decisions.
Autonomous Maintenance: The maintenance carried out by the operators of the machines rather than by dedicated maintenance technicians.

MSO.v2.25 (03/29/2017) Page 95 of 105
B
Backward scheduling: A technique used to calculating activities based on a series of known activities, the time required to complete them, and the desired end date for completing the series. Plans and creates the schedules around the date promised to the customer.
Batch: A homogeneous group of products. The quantity of material or product prepared for one operation.
Best Practice*: A specific process or group of processes that have been recognized as the best method for conducting a given action. Best practices may vary by industry or geography, depending on the context. Best practices methodology may be applied with respect to resources, activities, cost objectives, or processes. Note: best practices that are generally available from any source should be analyzed to determine their applicability to given situations before being used as a guideline or benchmark.
Bill of Materials (BOM)*: A structured list of all the materials or parts and quantities needed to produce a particular finished product, assembly, subassembly, or manufactured part, whether purchased or not.
BOM*: See Bill of Materials
Breakdown Repairs: Repairs carried out on equipment that has broken down during the course of normal operation.
Breakdown Spares: Materials used when a part on installed equipment is deteriorating and needs to be replaced.
C
Capacity*: The physical facilities, personnel, and processes available to meet the product or service needs of customers. Capacity generally refers to the maximum output or producing ability of a machine, person, process, factory, product, or service, or to the maximum amount of space available, as in warehouse storage capacity.
Capacity Planning*: Assuring that needed resources like manufacturing capacity, distribution center capacity, transportation vehicles, etc. will be available at the right times and places to meet logistics and supply chain needs.
Cellular Layout*: A combination of a product layout and a process layout.
Chase Production Plan: A production plan that plans on satisfying demand when it occurs.
Cloud Computing*: A growing computing paradigm in which data and services reside in massively scalable data centers and can be accessed from any connected devices over the Internet; the cloud is similar to the on demand concept of SaaS or ASP computing services, with the exception of the broad nature of the network of computers.
Computer-Aided Design (CAD)*: Computer- based systems for product design that may incorporate analytical and what if capabilities to optimize product designs. Many CAD systems capture geometric and other product characteristics for engineering data management systems, production and cost analysis, and performance analysis.
Condition Monitoring Systems: Systems designed to monitor the ongoing condition of equipment and warn operators of any deterioration.
Consumption: The using up of goods and services by consumer purchasing or in the production of goods.

MSO.v2.25 (03/29/2017) Page 96 of 105
Contingency: A possibility that must be prepared for, often in an emergency or under unusual circumstances.
Contingency Capacity: Added manufacturing capacity to allow for contingencies.
Contingency Plans*: Preparations to deal with calamities like floods and non-calamitous disruptions like labor strikes before they occur.
Continuous Flow Manufacturing*: A production system organized and sequenced according to the steps involved in the manufacturing process in which the product moves seamlessly and continuously through the entire manufacturing process.
Conveyors*: Mechanisms used to unload and load vehicles and route items through warehouses. Conveyors can also be used as an automated sorting system, of which there are four major categories: pop-up sorter, surface sorter, tilt slat sorter, and tilt tray sorter.
Corrective Maintenance: Maintenance that restores the operation’s performance to its performance level before deterioration or a failure occurred.
Customization*: Creating a product from existing components into an individual, tailored order. See Make-to-Order.
D
Demand*: What customers or users actually want. It is typically associated with the consumption of products or services as opposed to a prediction or forecast.
Demand Risk: The risk that a demand forecast may not meet the actual consumer demand.
Deterioration: Downgrading of the effectiveness or physical characteristics (color, consistency, odor, etc.) of a substance due to faulty packaging or abnormal storage conditions.
Disruption: An event that interrupts one or more processes.
DMAIC*: Part of the Six Sigma methodology that employs the following five steps: define, measure, analyze, improve, and control.
DMAIC Improvement Process: See DMAIC.
Due Date: Date on which a product or service must be complete.
Due Date Performance: A measure of how frequently a product or service is completed against the date when it had to be completed.
E
End Customer: The final consumer who purchases the product.
Enterprise Resource Planning (ERP)*: Software that combines materials requirements planning, distribution requirements planning, and capacity requirements planning into one system.
Equipment*: The rolling stock that carriers use to facilitate the transportation services that they provide, including containers, trucks, chassis, vessels, and airplanes.
ERP*: See Enterprise Resource Planning.

MSO.v2.25 (03/29/2017) Page 97 of 105
F
Facility Layout Strategies: The layout strategy used to ensure a smooth flow of work, materials, and information through a system. The basic meaning of facility is the space in which a company’s activities take place. The layout and design of that space impact greatly how the work is done—the flow of work, materials, and information through the system.
FAS*: See Final Assembly Schedule.
Final Assembly*: The highest level assembled product, as it is shipped to customers. This terminology is typically used when products consist of many possible features and options that may only be combined when an actual order is received.
Final Assembly Schedule (FAS)*: A list of scheduled operations required to produce completed products in a make-to-order or assemble-to-order manufacturing process. It may involve secondary operations beyond the final assembly that are required to complete subassemblies of components needed to assemble the finished product.
Finished Goods*: Products completely manufactured, packaged, stored, and ready for distribution.
Finite Loading: Prioritizes pending work and assigns resources to complete that work.
Fixed-Position Layout: A production technique used to assemble products that are too large, bulky, or fragile to safely or effectively move to a location for completion. In a fixed-position layout, personnel, supplies, and equipment are brought to the site where the product will be assembled, rather than the product’s being moved through an assembly line or set of assembly stations.
Forecast Error: The measurement of how incorrect, or off, forecasts are.
Forecasting*: Predictions of how much of a product will be purchased by customers; relies on both quantitative and qualitative methods.
Forward Scheduling: Assigns work to the earliest unassigned time slots in work centers.
Fulfillment*: The act of fulfilling customer orders. Fulfillment includes order managing, picking, packaging, and shipping.
Functional Failure: Inability to meet a specified performance standard.
G
Gross Requirements: The unadjusted demand line of the MRP record.
H
Human Risk: The risk created by poorly trained personnel in a manufacturing facility or employees’ lifestyle affecting the processes within the supply chain.
I
Infinite Loading*: A method used in calculating work center activity loading where there are no constraints placed on the capacity of the work centers. In other words, the calculation assumes that an infinite amount of capacity is available.
Infrastructure risk: The risk of loss associated with the impact on a project from infrastructure problems. An unreliable or intermittent utility supply and road and rail infrastructure deterioration. It is also known as transportation risk.

MSO.v2.25 (03/29/2017) Page 98 of 105
Insurance Spares: Spares used to protect against disasters.
Inventory*: The number of units or the value, or both, of goods stock that a company holds.
Investment Incentives: Government programs aimed at stimulating private sector interest in specified types of capital expenditure, or investment in areas of high unemployment or poverty.
Iterative Process: A process for arriving at a decision or a desired result by repeating rounds of analysis or a cycle of operations.
J
Job: A production type where the product and process to produce it are designed for that one occasion, which is unlikely to be repeated; therefore, the product and service and process design may run concurrently.
Job Shop Production: A job shop is a type of manufacturing process in which small batches of a variety of custom products are made. In the job shop process flow, most of the products produced require a unique setup and sequencing of process steps.
K
Kaizen*: Taken from the Japanese words kai (change) and zen (good), kaizen literally translates to changes that make our product better. The popular meaning has grown to include continuous improvement of all areas of a company, not just quality. Kaizen is a business philosophy of continuous cost, quality problems, and delivery time reductions through rapid, team-based improvement activities.
Kanban*: The Japanese word for visible record that loosely translates as card, billboard, or sign. Popularized by the Toyota Corporation, a kanban system uses standard containers or lot sizes to deliver required parts to the assembly line just in time for use. Empty containers are then returned to the source as a signal to resupply the associated parts in the specified quantity. Some modern IT systems use electronic kanbans, which alert upstream functions of the need for parts downstream.
L
Lead time*: The total time that elapses between an order’s placement and its receipt. Lead time includes the time required for order transmittal, order processing, order preparation, and transit. Variants are supplier lead time, manufacturing or assembly lead time, and customer order lead time.
Lean*: A business management philosophy that considers the expenditure of resources for any goal other than the creation of value for the end customer to be wasteful, and thus a target for elimination.
Legal Risk: The risk that a legal contract or financial transaction will not be fulfilled because it breaks the law or there is a regulatory conflict.
Level Production Plan: A production plan in which a company plans to produce a relatively constant amount in each planning period.
Level Scheduling: Scheduling and building a similar product mix every day during a given period of time.
M
Maintenance: Any activity—such as tests, measurements, replacements, adjustments and repairs—intended to retain or restore a functional unit to a specified state in which the unit can perform its required functions.

MSO.v2.25 (03/29/2017) Page 99 of 105
Maintenance Spares: Items used to ensure that the plant and equipment are kept in a reliable and safe condition.
Make-to-Order (MTO)*: Geared towards a larger class of customers that allows for some customization. Typically, orders are required to begin the production process. However, unlike ETO, most of the design work is complete, and part may even be in inventory. This reduces the amount of time required to process the order. The process structures used in MTO are batch, job shop, and cellular processes.
Make-to-Stock (MTS)*: Companies mass produce goods to store in inventory so when customers place orders, the product is ready to ship. Companies use demand forecasting to estimate production requirements. Products that are in the mature stage are usually the best ones to use this type of process because demand is readily known. The process structures used in this type of setting are repetitive assembly lines and continuous processes.
Management Risk: The risks associated with ineffective, destructive or underperforming management, which hurts shareholders and the company or funds being managed.
Manufacturing Outputs: Manufacturing output refers to the total inflation-adjusted value of output produced by manufacturers.
Manufacturing Postponement Strategies: Strategies used to provide additional operational flexibility to adjust specific production configurations so as to meet uncertainties associated with the customer demand forecast.
Market Segment*: A group of people or organizations sharing one or more characteristics causing them to have similar product or service needs. A true market segment meets all of the following criteria: it is distinct from other segments (different segments have different needs); it is homogeneous within the segment (exhibits common needs); it responds similarly to a market stimulus; and it can be reached by a market intervention. The term is also used when consumers with identical product or service needs are divided up into groups so they can be charged different amounts. These can broadly be viewed as positive and negative applications of the same idea of splitting the market up into smaller groups.
Mass Production: The manufacturing of goods in large quantities, often using standardized designs and assembly-line techniques.
Master Production Schedule (MPS)*: The master level or top-level schedule used to set the production plan in a manufacturing facility. Sometimes shortened to MPS, it is created from the demand forecast and tells the factory how many end item products are needed by a certain time frame.
Materials handling*: The physical handling of products and materials between procurement and shipping.
Materials Requirements Planning (MRP)*: A decision-making methodology used to determine the timing and quantities of materials to purchase.
Measure*: A number used to quantify a metric, showing the result of part of a process and often resulting from a simple count. An example is the number of units shipped.
Mechanization: The use of machines, either wholly or in part, to replace human or animal labor.
Mixed strategy: A production planning strategy. This approach recognizes the best approach to produce at the same rate for a period of time with some accumulation of inventory. This represents a combination of level planning and chase planning.
Modular*: A product or service that can be acquired as individual parts or assembled into a group.
MPS*: See Master Production Schedule.

MSO.v2.25 (03/29/2017) Page 100 of 105
MRP*: See Materials Requirements Planning.
MTO*: See Make-to-Order.
MTS*: See Make-to-Stock.
N
Niche Market: A niche market is a focused, targetable portion of a market.
O
On-Condition Maintenance: See Scheduled Inspections.
Operational Processes: Processes that define the primary activities that a company needs to perform in order to successfully execute its business.
Operational Risk: A form of risk that summarizes the risks a company or firm undertakes when it attempts to operate within a given field or industry.
Operations Function: The operations function within an organization brings together raw materials with the production process to make products that customers need.
Operations Infrastructure: The combination of facilities, equipment, and utility infrastructure, or the physical structures required for operation.
Operations Management: The management of the transformation process in which inputs are made into products and services.
Operations Strategy: A plan specifying how an organization will allocate resources in order to support infrastructure and production. An operations strategy is typically driven by the overall business strategy of the organization, and is designed to maximize the effectiveness of production and support elements while minimizing costs.
Output: The amount of energy, work, goods, or services produced by a machine, factory, company, or individual within a certain period.
Oversupply: An excessive amount of a good or other substance. Oversupply results when demand is lower than supply, thus resulting in a surplus.
Overhauls: The process of substantially repairing a piece of equipment or machinery to restore it to working condition.
P
Performance Measures*: Indicators of the work performed and the results achieved in an activity, process, or organizational unit.
Performance Target: The expected or predicted success level of an individual, company or organization.
Planned Order Receipts*: Any line item on an open purchase or production order that has been scheduled but not yet received into stock.
Postponement Strategies*: Postponement is a business strategy that maximizes possible benefit and minimizes risk by delaying further investment into a product or service until the last possible moment.
Preventive Maintenance*: Maintenance that is designed keep equipment in like-new condition to avoid a failure.
MSO.v2.25 (03/29/2017) Page 101 of 105
Process Design: A process that focuses on breaking down a large process into smaller processes, some of which can be automated.
Process Layout: Plant layout in which machines and equipment integral to a workflow are grouped together by function.
Product*: Something that has been or is being produced.
Product Design: Product design as a verb is the process of creating a new product to be sold by a business to its customers.
Product Family*: A set of products that are considered as a single group when creating forecasts for planning purposes.
Product Layout: Part of the manufacturing process that allows for the repetitive assembly of highly standardized products. When a manufacturing operation utilizes product layout, production work can be laid out in a straight line with labor and equipment subdivided in a smooth line. See Assembly Line.
Production Control: Ensuring that execution of the production plan takes place accurately and efficiently.
Production Plan*: The administrative process that takes place within a manufacturing business that involves making sure that sufficient raw materials, personnel, and other necessary items are procured and ready to create finished products according to a specified schedule.
Project Materials: Materials used for a planned project.
Projected Available Balance: The amount of physical inventory projected to be available at the end of each time period.
Promised Lead Time: A commitment to a customer of the amount of time in the supply chain that will elapse between when a process starts and when it is completed.
Pull Production Plan: See Chase Production Plan.
Push Production Plan: See Level Production Plan.
R
Raw Materials*: Crude or processed material that can be converted by manufacturing, processing, or both, into new and useful products.
Rebuild: The process of building a piece of equipment or machinery to working condition after it has reached the end of its normal working life or after it has been damaged.
Recalls: An order to replace or repair defective items that have been sold.
Resources*: Economic elements applied or used in the performance of activities or to support cost objects directly. Resources include people, materials, supplies, equipment, technologies, and facilities.
Risk: A cost consideration in transportation that sometimes increases the cost of shipping for products that are at higher risk of being damaged in transit than other products.
Risk Assessment: The determination of quantitative or qualitative estimate of risk related to a concrete situation and a recognized threat (also called hazard).
Risk Avoidance: The act of reducing the amount of risk so much that a task is completely avoided or not completed.

MSO.v2.25 (03/29/2017) Page 102 of 105
Risk Mitigation*: A reduction in the exposure to risk, lessening the impact or probability of its occurrence.
Risk Plan: A risk management plan is a document that a project manager prepares to foresee risks, estimate impacts, and define responses to issues.
Rough-Cut Capacity Planning: Involves the breakdown of a company’s product mix and then aggregating the capacity requirements of these more detailed plans at a work center level.
S
Safety Stock*: The inventory a company holds above normal needs as a buffer against delays in receipt of supply or changes in customer demand.
Schedule Spares: Spares used whenever a planned maintenance scheduled task is done.
Scheduled Inspections: Inspections that detect potential failures and call for the removal or repair of an item on the condition that they do not meet the required standard when inspected.
Scheduled Receipts: Any items currently being built or on order from suppliers will appear in the time bucket when they are available.
SCM*: See Supply Chain Management.
Service Level*: A metric shown as a percentage that captures the ability to satisfy demand or responsiveness. Order fill rates and machine or process uptime are examples of service level measures.
Six Sigma*: Six Sigma is a term coined to stress the continuous reduction in process variation to achieve near-flawless quality. When a Six Sigma rate of improvement has been achieved, defects are limited to 3.4 per one million opportunities.
Six Sigma Methodology: A term used to describe the process improvement initiatives using sigma-based process measures or striving for Six Sigma level performance.
Software: Refers to the brain of the machine— the programs that make the machine run, such as the operating system, Internet browsers, and applications on smartphones.
SPC*: See Statistical Process Control.
Statistical Process Control (SPC)*: A method for achieving quality control in processes. The technique hinges on the observation that any process is subject to seemingly random variations, which are said to have common causes, and non-random variations, which are said to have special causes. SPC relies on measuring variation in output and setting control limits based on observations of variations arising solely from common causes. A process that is in control is expected to generate output that is within its control limits.
Subassemblies: Units assembled separately but designed to fit with other units into a finished manufactured product.
Supply Chain*: Starting with unprocessed raw materials and ending with the end customer using the finished goods, the supply chain links many companies together. The material and informational interchanges in the logistical process, stretching from acquisition of raw materials to delivery of finished products to the end user.
Supply Chain Management*: The design and management of all activities involved in sourcing and procurement, conversion, and all logistics management activities. Notably, it also includes coordination and collaboration with channel partners, who can be suppliers, intermediaries, third-party logistics providers, and end customers.

MSO.v2.25 (03/29/2017) Page 103 of 105
Supply risk: Is the probability of loss occurring from the lack of available raw material(s), resulting in the firm’s inability to meet customer demand due to supplier failure to provide supplies.
T
Takt time*: The maximum time per unit to make a product in order to meet demand. It is derived from the German word Taktzeit (cycle time). Takt time sets the pace for industrial manufacturing lines.
Technical Risk: Exposure to loss due to activities such as design and engineering, manufacturing, technological processes, and test procedures. Is the risk associated with the knowledge base being employed its technical aspects.
Time-Phased: Distribution of activities, tasks, milestones, and resources over an appropriate time scale for the scheduled completion of a plan, program, or project.
Total Quality Management*: Sometimes shortened to TQM, designing processes to produce consistent quality.
Total Productive Maintenance (TPM)*: A team-based maintenance process designed to maximize machine availability and performance and product quality.
TPM*: See Total Productive Maintenance.
TQM*: See Total Quality Management.
U
Uncertainty: Occurs when not everything in the supply chain is foreseen or understood before it happens.
Usage materials: Materials used on a regular basis and the usage of which follows some pattern.
Utility infrastructure: The infrastructure required to provide utilities within the organization.
V
Value Stream Mapping*: A pencil and paper tool used in two stages: 1) Follow a product's production path from beginning to end and draw a visual representation of every process in the material and information flows. 2) Draw a future state map of how value should flow. The more important map is the future state map.
Variability: Occurs when some items or processes in the supply chain are either completed in inconsistent ways or done incorrectly for one of a range of reasons.

MSO.v2.25 (03/29/2017) Page 104 of 105
Notes Page
____________________________________________________________________________________________________________________________________________________________________________________________________________________________________________________________________________________________________________________________________________________________________________________________________________________________________________________________________________________________________________________________________________________________________________________________________________________________________________________________________________________________________________________________________________________________________________________________________________________________________________________________________________________________________________________________________________________________________________________________________________________________________________________________________________________________________________________________________________________________________________________________________________________________________________________________________________________________________________________________________________________________________________________________________________________________________________________________________________________________________________________________________________________________________________________________________________________________________________________________________________________________________________________________________________________________________________________________________________________________________________________________________________________________________________________________________________________________________________________________________________________________________________________________________________________________________________________________________________________________________________________________________________________________________________________________________________________________________________________________________________________________________________________________________________________________________________________________________________________________________________________________________________________________________________________________________________________________________________________________________________________________________________________________________________________________________________________________________________________________________________________________________________________________________________________________________________________________________________________________________________________________________________________________________________________________________________________________________________________________________________________________________________________________________________________________________________________________________________________________________________________________________________________________________________________________________________________________________________________________________________________________________________________________________________________________________________________________________________________________________________________________________________________________________________________________________________________________________________________________________________________________________________________________________________________________________________________________________________________________________________________________________________________________________________________________________________________________________________________________________________________________________________________________________________________________________________________________________________

MSO.v2.25 (03/29/2017) Page 105 of 105
Addendum
The previous document version was V2.20 (file name LINCS.MSO.v2.20.07242016).
Current version is v2.25 (file name LINCS.MSO.v2.25.03292017) and contain the following updates:
• Replaced all CanStockPhoto images
• Corrected PQ9 in LB3 to read “Which of the following is NOT typically part of a demand estimate?”
• Replaced all unnecessary instances of “above” and “below”.
• The abstract page was corrected to match all other tracks
• All non-working links were replaced or deleted
• Updated reference page