Embed Size (px)
Citation preview

1
MANSFIELD DISTRICT COUNCIL
LONG TERM FINANCIAL STRATEGY 2019/2020 – 2028/2029
2
CONTENTS
Page Number
Section Number
Section
3 1 Executive Summary
5 2 Purpose
6 3 Scope
6 4 Policy Drivers
7 5 Economic Context Inflation Economic Growth BREXIT Interest rates Property Markets Public Sector Finances Local Government Re-organisation
17 6 National, Regional and Local policies
18 7 Funding - Mansfield District Council. Revenue Support Grant Retained Business Rates Council Tax Housing Benefit, Universal Credit Council Tax Reduction Scheme
28 8 Population and Housing Growth
29 9 Fees and Charges
30 10 Asset Rents
31 11 Commercial activities
32 12 Financial Investments
33 13 New Homes Bonus
34 14 Capital Receipts
34 15 Employees
36 16 Premises
39 17 ICT
41 18 Reserves
42 19 Three Year Financial Projections
42 20 Conclusion
42 21 Principles of Financial Planning
44 22 Areas to consider

3
1. Executive Summary
The strategy identifies the increasingly difficult time facing Mansfield District Council
and its financial position in the immediate, medium and longer term and areas where
additional information and work is required. It sets out ten principles which should be
used to guide future financial planning.
This is due to a combination of increasing and uncertain costs in supplies,
employment, in the operation of key services and the high maintenance
requirements for the Council’s operational assets. At the same time severe
reductions in funding from the UK government since 2010/2011, Council Tax and
charges being held to help support the local economy following the financial crisis
and austerity has contributed to the significant challenge facing the Council.
Despite the real term income reductions and cost increases, the Council has been
able to manage it financial position and limit the impact on front-line services through
the income generated from its commercial asset acquisition programme, targeted
savings, increase commercial service income and the managed release of reserves.
The future position however requires the Council to transform the way in which its
direct and supporting services are delivered and to make difficult decisions in the
scope and scale of its services and ultimately the structure of the Council itself,
working with other authorities facing similar challenges.
It is clear that Government funding will continue to reduce for lower tier authorities
(district and borough councils) as greater financial pressure is felt at upper tier
(unitary and county councils) as a result of increased demand on adult and children’s
social care. The current Fair Funding Review proposes the allocation of retained
business rates on the basis of statutory need with this and locally generated
business rates growth, council tax and charges being the way in which local
authorities will finance expenditure and services in the future.
The range of services provided and the level of expenditure will be determined by
the amount of income which can be generated locally. Local priorities therefore need
to be identified and established.
The Council’s future approach to locally generated income in the form of Council Tax
through the rate of tax and housing growth, fees and charges, commercialism and
business rates growth need to take account of the reducing resources from the
government and the increasing costs of delivering its services.
This comes at a time of great economic uncertainty and potential disruption to the
national economy which affects residents and businesses locally, potentially
affecting the level of need for public sector intervention and support. The Council
needs to be in a position to provide this as well as day to day service delivery whilst
at the same time being affected itself by any further impact on Government funding
as a result of the national economic position.

4
The Council’s Transformation Plan is the means by which the Council will meet the
current and ongoing financial challenges. Achieving this depends heavily on
investment in new technology and systems; these will require ongoing maintenance,
upgrade and support. Further work is needed to determine the extent and nature of
this and the financial savings this will generate.
The dependency on technology requires that the IT infrastructure and equipment is
sufficient and kept up to date to minimise service disruption, inefficiencies and to
protect information and personal data held by the Council. The strategy identifies the
level of this ongoing and vital investment.
The Council owns and provides services through a range of operational properties
such as the Civic Centre, Vale Road and Hermitage Lane depots, parks, Palace
Theatre, Museum and car parks. It has an external contract for the management of
its leisure centres but retains responsibility for significant repairs to these.
These properties cost the Council money in terms of management, day to day
repairs, energy, business rates and in some cases significant capital investment. The
aging nature of many of these properties has now resulted in failures resulting in
operational service disruption for residents and the council. This strategy identifies
where this significant investment is known and required together with the need for
further works in other operational properties. The expenditure required needs to be
built into decisions regarding the future use, retention and charging policies
associated with these properties to ensure that resources are available to minimise
future disruptions.
The Transformation Plan and the decisions necessary to ensure that the Council is
financially stable and is able to provide the range and level of service needed will
impact on its employees in terms of the expectations for the way in which they work
and in the overall size of the workforce.
Over the period of the strategy, the number of employees will need to reduce
significantly simply to maintain the current level of expenditure and further reductions
will be necessary to make any impact on the projected deficits. This will require
detailed planning and will also incur costs in respect of redundancy and potential
pension strain which will need to be taken into account when determining the level of
reserves.
The development and production of this strategy is the first steps for the Council to
look towards the future; its commitment, aspirations and its income streams. It
identifies that there is still much that is unknown and will need to be investigated
further and plans put in place to deal with the results.
The strategy should be used to inform decision making and as a basis for
communication to stakeholders as many of the decisions and actions necessary
should be understood in the context of the wider financial position of the Council.

5
2. Purpose
This Strategy deals with how the Council will manage its financial resources,
however it must be seen in the context to delivering its wider aspirations for
the district in terms of.
Growth
Aspiration
Well-being and
Place
In addition to transforming the services it provides and the way in which they
are provided to ensure that the Council is fit for the 21st Century and beyond.
In order to do this, the Council needs to ensure that it has a sound financial
base, good governance arrangements, efficient processes, strong ICT
infrastructure and capabilities, well maintained operational premises and a
well-trained and motivated workforce.
It aims to identify the financial impact of known, anticipated and potential
events and requirements over a 10 year time-frame.
Any projections covering this length of time will naturally contain uncertainty
and the strategy includes the assumptions made.
The level of uncertainty and risk increases as the amount of influence the
Council has over events reduces and the timespan of the projection
increases.
The Strategy has been used to provide more detail within the three year
General Fund, Housing Revenue Account and Capital budgets.
The impact of BREXIT on the economy and therefore public finances are
unclear both in timing and impact, the proposed changes to local authority
financing and potentially structure will be felt within the next 2 to 3 years and
so affect even short term assessments.
It is vital that the Council takes a long-term view despite pressures to reduce
its planning horizons to deal with the immediate issues arising from reducing
income and the range of uncertainties.
It is not enough to ‘put things off’ until we know more and the key to future
sustainability is to develop a range of options and solutions which can be
switched on and off quickly. Flexibility and agility are needed when conditions
and outcomes are uncertain.

6
In order to do this, the Council must have clear priorities, policies and plans
supported by robust information and evidence so that financial resources can
be targeted in the most effective way.
3 Scope
Whilst this is a Council-wide strategy and covers General Fund, Housing
Revenue Account and implications for capital expenditure and funding there is
a greater focus on the General Fund revenue services; the Housing Revenue
Account has a thirty (30) year Business Plan which is currently being updated.
When complete this will feed into the wider strategy as will any implication for
the Capital Programme.
It includes service and non-service income and expenditure – Government
grant funding, Council Tax, Investment income and the costs associated with
borrowing.
It does not include expenditure and income relating to Mansfield Homes, the
Council’s wholly owned housing development company; although the impact
of economic and interest changes are highlighted as it affects assumptions on
any surplus or loss associated with this company is included.
It does include the implications of any loans granted to the company or repaid
and interest incurred or receivable as a result.
It does include the implications of services provided to the company by the
Council.
It takes account of the expenditure and income on shared services and the
net income or expenditure on the Mansfield and District Joint Crematorium.
It does not aim to deal with every element of expenditure and income but
focusses on those which have the most impact on the Council’s financial
position.
4 Policy Drivers
The Council is clear that it wants to create a district where people can
succeed in terms of their own aspirations, their families and their businesses.
To do this the Council must make the district a place where people want to
live, want to visit, want to work and do business and where they want to make
a better life for themselves and others.
This cannot be done by the Council alone and it must involve other public
sector partners, businesses and the communities themselves.

7
The aim to deliver housing and economic growth is key to the generation of
income locally and work done as part of the Local Plan has informed
assumptions on this aspect.
5 Economic context
5.1 Over the period of the Strategy the local, regional, national and global
economic situation will vary. The document does not aim to make predictions
in respect of long term growth or the impact of major global events but uses
the latest expert views to help inform general direction of the economy as far
as possible and in particular those areas which have a greater potential direct
impact on the Council.
5.2 Inflation currently stands at 2.4% (September 2018); this remains above
the government’s target of 2%.
There are many factors which impact on the level of inflation and tracking
these gives an indication of the future short term position.
The price of goods and services which the council purchases reflects the
supply and demand of each element which suppliers and consumers incur
throughout the supply chain from raw materials, labour, supporting costs such
as fuel to delivery and final purchase.
Within this strategy it is not possible to identify the individual elements but
some are common to all products.
Graphs 1 and 2 below show the history of the Consolidated Price Index (CPI)
measure of inflation and the projections used by the Bank of England for
future years. As can be seen, over the longer term CPI can be highly variable
which will impact on expenditure incurred by the council and on the income
received from asset rents and charges for services. The forecast shows the
range of value for CPI based on the information available to the Bank of
England.

8
Graph 1 – CPI history
Graph 2 – CPI forecast
A major influence over the rate of inflation is Oil and its cost in relation to the
strength of the GB£ relative to the US$.
5.2.1 Oil – this is the base commodity for most products and extends
throughout the supply chain for extraction and transportation of raw materials
and the manufacture and delivery of finished products.
Prior to the financial crisis in 2008, oil prices were relatively stable at $20 -
$30 per barrel however during 2008 and the following years it has varied
between $132 and $30 per barrel. It currently sits at $76.3 per barrel (October
2018).
-1.0%
0.0%
1.0%
2.0%
3.0%
4.0%
5.0%
6.0%A
pr-
08
Jul-0
8O
ct-
08
Jan-0
9A
pr-
09
Jul-0
9O
ct-
09
Jan-1
0A
pr-
10
Jul-1
0O
ct-
10
Jan-1
1A
pr-
11
Jul-1
1O
ct-
11
Jan-1
2A
pr-
12
Jul-1
2O
ct-
12
Jan-1
3A
pr-
13
Jul-1
3O
ct-
13
Jan-1
4A
pr-
14
Jul-1
4O
ct-
14
Jan-1
5A
pr-
15
Jul-1
5O
ct-
15
Jan-1
6A
pr-
16
Jul-1
6O
ct-
16
Jan-1
7A
pr-
17
Jul-1
7O
ct-
17
Jan-1
8A
pr-
18
Jul-1
8

9
It is very volatile and dependent on supplies from the Middle East, South and
Central America, USA and Russia. The recent increase in oil and gas derived
from fracking has steadied the volatility as these plants are relatively easy to
close and re-open as the price fluctuates. Action by suppliers to limit or
increase production which controls the supply and therefore price is also used
to equalise variability.
The demand for oil and oil based products is heavily dependent on the global
economy and uncertainty over trade particularly between USA and China and
between USA and Europe has short term but potentially longer term effects.
Oil is typically purchased on US$; the relationship between GBP£ and US$ is
therefore vital in determining the ‘real’ cost to UK organisations. Graphs 3 and
4 show the variability of these two significant factors over time.
Graph 3 - Price of Oil since 2008

10
Graph 4 – Value of GB£ to US$ since 2008
There is an impact across all organisations, businesses and individuals
reflected either in the price of goods or at the pumps in the form of fuel.
The cost of operating the vehicle fleet, heating and lighting the Council’s
premises would be affected and therefore the cost of delivering services to
residents and customers. These would mainly be statutory services such as
waste collection or those directly affecting tenants and local communities, for
instance, Community Safety, maintenance of parks and housing repairs.
5.2.2 Labour – Since 2016 until recently wage inflation has been below the
Government’s measure of inflation (CPI) and has therefore dampened overall
inflationary pressures within the economy. This has been particularly so within
the public sector where a pay cap of 1% was in place. This cap was breeched
in 2017 and is anticipated not to be enforced for future years. Since 2017
wage growth has kept pace with and been slightly above CPI at around 2.5%.
If this continues and the gap widens in favour of wage growth this will
increase general inflationary pressures.
5.2.3 Taxes – Government decision on taxation will impact on inflation.
Whilst no immediate increases in the rates of income tax are expected,
increases in employers National Insurance rates and duties on fuel, alcohol

11
and cigarettes etc. are to be expected when the Chancellor of the Exchequer
delivers the annual budgets.
The Council is not directly affected by increases in VAT however changes will
impact on the level of fees and charges made by the Council to service users
and tenants. The impact on the Council comes from its closeness to the
‘Partial Exemption’ limit which if exceeded removes the ability to reclaim VAT
on supplies.
5.2.4 Property Stamp Duty – this tax is payable on the acquisition of property
and is not recoverable by the Council and affects the amount paid and
therefore the amount to be funded through the council’s own resources or
borrowing. It is also payable by those acquiring properties from the Council
and therefore affects the selling price of those assets. The rules surrounding
this area are complicated but are regularly updated and amended to help
stimulate the property markets or raise additional tax revenue.
5.2.5 Business Rates – as with all organisations, the Council is required to
pay business rates on its properties.
Revaluations are carried out at intervals and affect the Council but also affect
businesses and organisations within the district. Significant changes can
occur and whilst transitional arrangements are usually in place and specific
reliefs can be applied these events can distort the local economy – e.g. high
street retail properties.
The multiplier (rate in the pound of Rateable Value) is determined by CPI and
is set by the Government.
The Council can gain from increased Business Rates income which it collects
and retains a portion of.
5.2.6 Asset Rents - The rate of inflation is important in terms of both
expenditure and income; commercial rents on a number of the assets
acquired by the Council are increased in accordance with the Retail Price
Index measure of inflation therefore whilst a high inflation figure increase
costs it can also increase income.
5.2.7 Residents and Businesses - The rates of inflation also have a direct
impact on residents and the level of disposable income available to be spent
and therefore an impact on spending locally with the consequential effect on
the local economy.
Where businesses try to absorb inflation by not passing this on to consumers,
this also affects the net income and profit of the business. This places greater
pressure on reducing costs elsewhere which could be local suppliers or the
workforce, again impacting on the local economy.

12
Whilst inflation remains at the current low levels and wages keep pace the
impact is small but does not give any leeway for consumers to increase
spending and generate growth. This is particularly acute in respect of
affordable housing.
5.3 Local Government pay and pensions – Local Government pay does not
come under the same cap as has been the case for other areas of the public
sector, however recent pay increases have mirrored the cap. Whilst resources
within local government remain tight and central grant support reduces
pressure will continue to limit significant increases, however pressure from
unions will also be felt to increase at least in line with inflation.
The majority of employees at Mansfield District Council are members of the
Nottinghamshire Local Government Pension scheme. As with all pension
schemes the liability for paying retired employees is growing as the numbers
and their longevity increases. At the same time, reduced funding has resulted
in a smaller workforce contributing to the scheme, this is set to continue.
There have been a number of changes to the benefits paid to retired
employees and the level of contributions payable which goes some way to
address this issue, however this has also meant that the contributions
required by employers has also been affected.
A reassessment of the Pension Fund projected position and likely deficit is
undertaken every three years, at this stage the employers’ contributions are
determined for the period in the form of a lump sum with reduced annual
contributions or higher annual contributions. The next assessment is due for
2019/2020.
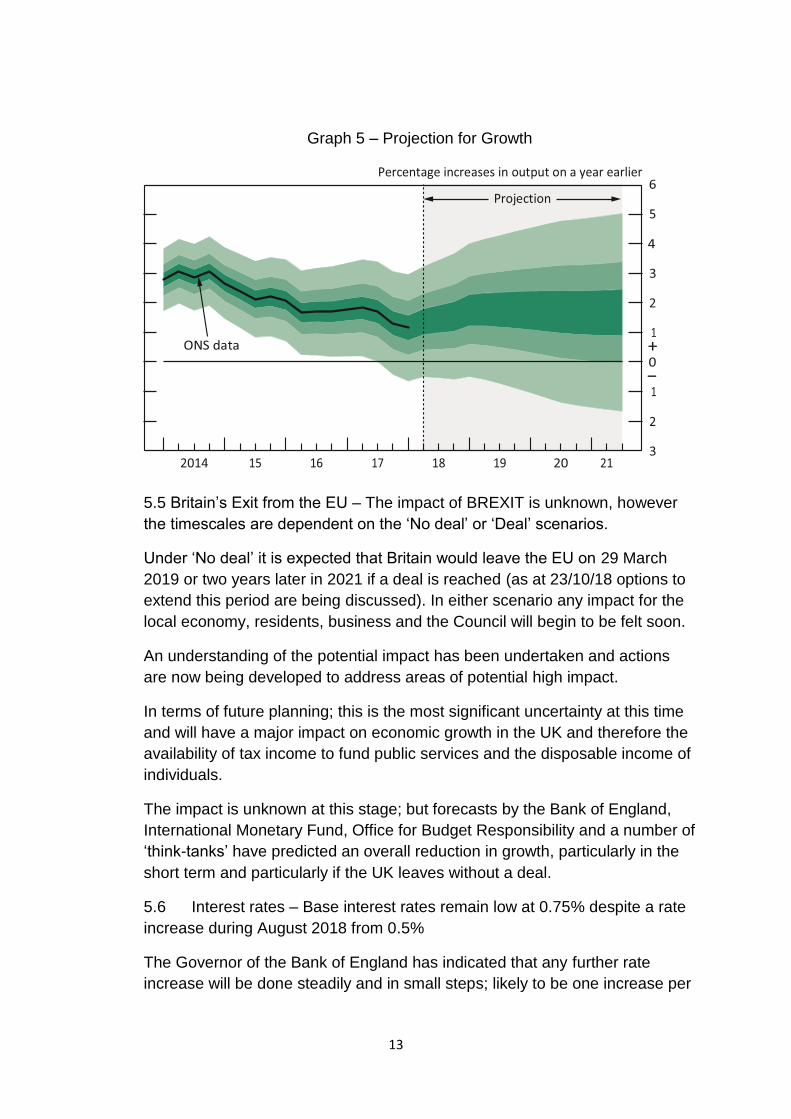
5.4 Economic Growth – Growing the local economy in terms of housing
and business is vital to the generation of future income through Council Tax
and Business Rates and is also needed to ensure the vibrancy and
sustainability of the town centres, jobs and earnings. It also means that there
is a resulting need for increased services provided by the Council in areas
such as waste collection, provision of open space and the availability of
education, health facilities and improved infrastructure which must be
delivered with local partners. Graph 5 below shows the current projections
used by the Bank of England; as with inflation projections there is a wide
variation in the potential growth which is dependent on global, European and
domestic issues.
13
Graph 5 – Projection for Growth
5.5 Britain’s Exit from the EU – The impact of BREXIT is unknown, however
the timescales are dependent on the ‘No deal’ or ‘Deal’ scenarios.
Under ‘No deal’ it is expected that Britain would leave the EU on 29 March
2019 or two years later in 2021 if a deal is reached (as at 23/10/18 options to
extend this period are being discussed). In either scenario any impact for the
local economy, residents, business and the Council will begin to be felt soon.
An understanding of the potential impact has been undertaken and actions
are now being developed to address areas of potential high impact.
In terms of future planning; this is the most significant uncertainty at this time
and will have a major impact on economic growth in the UK and therefore the
availability of tax income to fund public services and the disposable income of
individuals.
The impact is unknown at this stage; but forecasts by the Bank of England,
International Monetary Fund, Office for Budget Responsibility and a number of
‘think-tanks’ have predicted an overall reduction in growth, particularly in the
short term and particularly if the UK leaves without a deal.
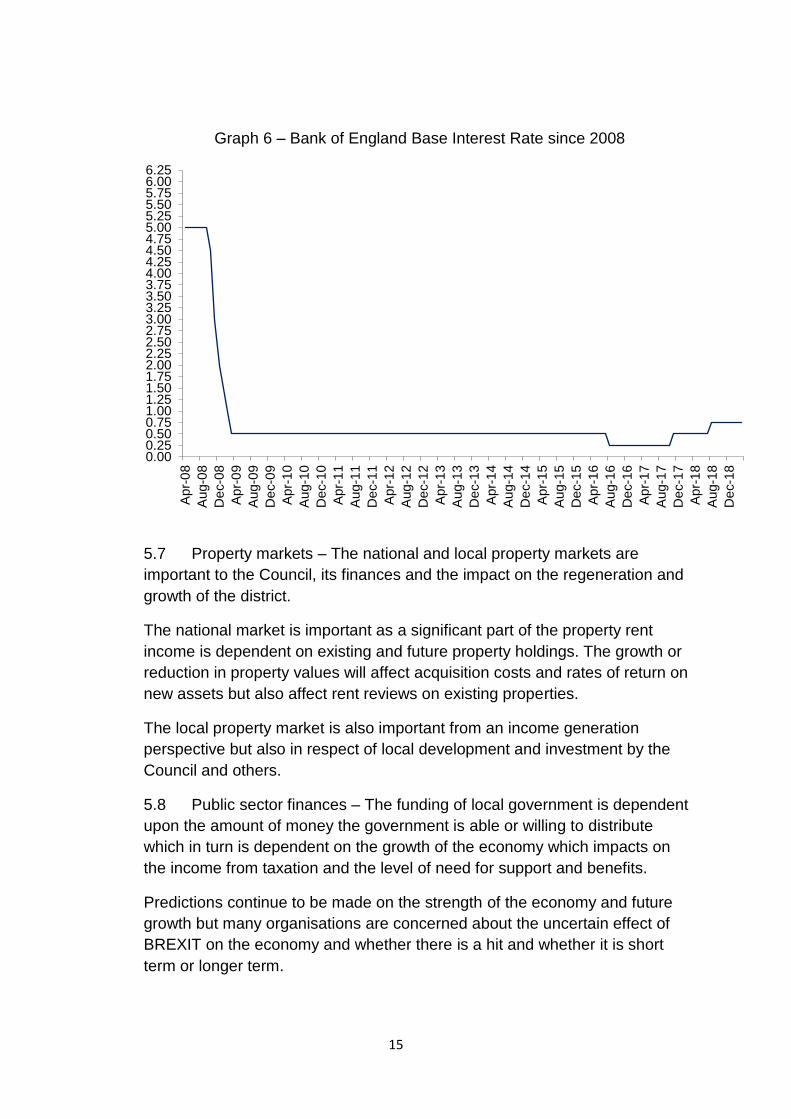
5.6 Interest rates – Base interest rates remain low at 0.75% despite a rate
increase during August 2018 from 0.5%
The Governor of the Bank of England has indicated that any further rate
increase will be done steadily and in small steps; likely to be one increase per

14
year. The recent increase also provides some leeway to reduce the rate again
should it be necessary to support the economy.
This provides a level of certainty for the Council’s investment income levels
and to some extent borrowing costs for capital expenditure going forward.
This is particularly important should the Council continue acquiring properties
to support its services.
Certainty over interest rates also helps businesses with their investment plans
and the low rates mean that borrowing to invest is affordable in the medium
term.
This is true also for those buying homes; this is an issue where first time
buyers are unable to afford the initial deposit or the house is only affordable at
the current low rates of interest where any upward shift tips the balance into
the purchase being unaffordable.
There is a potential impact resulting from changes in interest rates in other
housing related areas as the current low rates have been in place for 10 years
and those buying a house within that period did so at low rates.
Should these increase this could impact on their ability to afford their existing
mortgages and possibly impact on homelessness, the need for further public
sector housing or making housing within the district less affordable affecting
housing development and growth.
Low interest rates are good for borrowing but those with savings gain little.
This has been the case for several years and the proportion of disposable
income saved continues to fall as a result.
The Council’s cash investments have been reduced over a number of years
and the income now received is not a significant amount compared with the
past.
Graph 6 below shows the recent interest rate history.
15
Graph 6 – Bank of England Base Interest Rate since 2008
5.7 Property markets – The national and local property markets are
important to the Council, its finances and the impact on the regeneration and
growth of the district.
The national market is important as a significant part of the property rent
income is dependent on existing and future property holdings. The growth or
reduction in property values will affect acquisition costs and rates of return on
new assets but also affect rent reviews on existing properties.
The local property market is also important from an income generation
perspective but also in respect of local development and investment by the
Council and others.
5.8 Public sector finances – The funding of local government is dependent
upon the amount of money the government is able or willing to distribute
which in turn is dependent on the growth of the economy which impacts on
the income from taxation and the level of need for support and benefits.
Predictions continue to be made on the strength of the economy and future
growth but many organisations are concerned about the uncertain effect of
BREXIT on the economy and whether there is a hit and whether it is short
term or longer term.
0.000.250.500.751.001.251.501.752.002.252.502.753.003.253.503.754.004.254.504.755.005.255.505.756.006.25
Apr-
08
Aug-0
8
De
c-0
8
Apr-
09
Aug-0
9
De
c-0
9
Apr-
10
Aug-1
0
De
c-1
0
Apr-
11
Aug-1
1
De
c-1
1
Apr-
12
Aug-1
2
De
c-1
2
Apr-
13
Aug-1
3
De
c-1
3
Apr-
14
Aug-1
4
De
c-1
4
Apr-
15
Aug-1
5
De
c-1
5
Apr-
16
Aug-1
6
De
c-1
6
Apr-
17
Aug-1
7
De
c-1
7
Apr-
18
Aug-1
8
De
c-1
8

16
The possible effect and timing can also be determined by the particular ‘deal’
or indeed ‘no deal’ reached.
This uncertainty therefore has implications for the availability of resources and
the level of need within the economy for support. The government is now
making preparations for ‘no deal’ and is incurring expenditure in readiness.
The government has made recent announcements regarding the future
distribution of any resources and it is clear that the NHS, education and
possibly defence will be prioritised and the recent release of the public sector
pay cap for non-local government employees will put further pressure on
resources.
In 2019/20, the Government will undertake a full public sector spending
review; this will align spending to the priorities identified by the government,
the period this will cover is uncertain as is the impact on specific parts of the
sector. A general election must be held in 2022, which may determine the
period covered.
At a more immediate level, the government is undertaking a review of local
government finance and the move towards greater retention (75%) of
business rates growth income by local authorities alongside a review of re-
distribution through its’ Fair Funding Review’.
Within local government, the main funding issue and one which will remain for
the foreseeable future is Adult Social Care and to a growing extent Children’s
Services and it is widely expected that the funding review will allocate a higher
proportion of resources to unitary and upper tier authorities which have
statutory responsibility for these services.
This strategy therefore needs to be based on a continued reduction in central
government support and a re-distribution of resources away from district
councils.
This places greater reliance by the Council on resources it can generate
independently through Council Tax, Business Rates Growth, asset rents and
customer receipts if it to be in a position to resource service provision for the
district.
The ability of the Council to achieve this is dependent on many factors but its
approach to growing the local housing and business economies is vital to this
as is the Council’s approach to the rate of Council Tax, investment in assets
and the charges it makes for services.
5.9 Local Government Re-organisation – Many areas across England are
considering the future structure of local government as a means to making
savings and efficiencies and still delivering services at a local level.

17
With the increase in Combined Authorities and bodies such as the Local
Enterprise Partnerships, together with the Midlands Engine and Northern
Powerhouse there has been a move to wider regional structures to support
and generate economic growth.
Nottinghamshire County Council has recently passed a motion to produce a
business case for a unitary authority which replaces the existing two tier
system.
The districts within the county have dismissed this and stated that any change
must be discussed within the Economic Partnership Committee which
includes all Nottinghamshire Authorities. Nottingham City Council, which is
currently a unitary authority, has identified a potential alternative approach.
Mansfield District Council will need to determine its approach to future
structures, during the period of this strategy it is likely that this will be
necessary and initial resources may be required and any implications
addressed.
6 National, Regional and Local policy
The Council works within a wider framework of public and quasi-public
services which are overseen by the UK national government and each area
has its particular policy areas. Often however, the policies of one organisation
impacts on other bodies. Similarly polices developed and implemented at a
local level by the Council will in-turn have an impact on services or the plans
of other organisations.
This strategy does not try to identify all the potential connections and
implications, the following are examples of where these can or will have an
impact on the policies, finances or services provided by the Council.
6.1 National policies
National polices will generally impact on regional and local organisations as
the actions they take will then affect other bodies.
Universal Credit – the roll out of the policy and new approach, bring a range of
benefits together. This affects the Council as a deliverer of Housing Benefit
which is being replaced for working age claimants.
Fixing our Broken Housing Market – White Paper. This aims to address the
national shortage of housing including affordable housing across the country.
National Planning Policy Framework – This aims to set out ways in which
growth and housing can be encouraged and driven to meet both economic
and housing growth needs

18
Industrial Strategy – This sets out the government’s approach and principles
to increasing the country’s productivity and economic growth.
National Waste Strategy – reuse and recycling to meet EU targets
Focus on Renewables – Energy generation from renewable a nd sustainable
sources
Public Health England – Health in all policies approach
6.2 Regional policies
Local Enterprise Partnership (LEP) – Derbyshire and Nottinghamshire area
partnership for growth representing business, education and local authorities
(D2N2)
Economic Prosperity Committee (EPC) – Nottinghamshire local authorities co-
ordinating growth and linked with LEP
Nottinghamshire County Council Growth Strategy
Nottinghamshire County Council Health and Well-being Strategy
6.3 Local policies
Local Plan – setting out the dwelling and business growth requirements and
the sites for development; currently in consultation.
Mansfield District Council health and well-being aspirations – reducing
obesity, inactivity, smoking, drug and alcohol abuse, teenage pregnancies,
mortality rates.
Parks and Open Space Strategy
Mansfield District Council / Ashfield District Council Joint Economic Strategy
7 Government Funding – Mansfield District Council
This has decreased significantly since 2010/2011; affecting general funding
such as Revenues Support Grant and Business rates and specific grants such
Council Tax and Housing benefit Administration Grant.
This has impacted not only in individual years but has had a significant
cumulative impact on the funding received over the period in comparison to a
no increase and more so when taking account of general inflation (CPI)

19
Table 1
Year General Funding
allocation
Cash Reduction
£000
Cash reduction
%
Annual CPI
Inflation adjusted allocation
Inflation adjusted
loss £000
Amount received as a % of inflation adjusted allocation
%
2010/11 10,366 0 0 - 10,366 0 100
2011/12 8,185 -2,181 -21 3.5 10,729 -2,544 76
2012/13 7,289 -896 -11 4.3 11,190 -3,901 65
2013/14* 8,161 +872 +12 2.7 11,492 -3,331 71
2014/15 7,101 -1,060 -13 2.3 11,757 -4,656 60
2015/16 6,039 -1,062 -15 1.1 11,886 -5,847 51
2016/17 5,274 -765 -13 0.1 11,898 -6,624 44
2017/18 4,654 -620 -12 1.1 12,029 -7,375 39
2018/19 4,329 -325 -7 2.8 12,365 -8,036 35
Total 61,398 103,712 -42,314 59
*Includes Council Tax Reduction Scheme grant and Council Tax Freeze Grant
Graph 7 – General Government Grant
7.1 Revenue Support Grant (RSG) – This is the grant received from government
which has previously been based on the relative needs of each local authority.
The government signalled its intent to remove this and replace with Business
Rates retention and a fair Funding Formula by 2020. Continuation of the formula
approach for RSG will result in the Council being in a negative position as are
some authorities. The government is looking to resolve this as part of the future
funding proposals and therefore for the purposes of this strategy it is assumed
-
2,000
4,000
6,000
8,000
10,000
12,000
14,000
10/11 11/12 12/13 13/14 14/15 15/16 16/17 17/18 18/19
Amount£000
Financial year
Government General Grant
Grant rec'd
Inflation Adj grant

20
that the Council will no longer receive RSG from 2020/2021 but will not be in a
negative position.
Table 2
Year Amount £
2019/2020 244
2020/2021 0
Graph 8 Government General Fund – RSG and Business rates split
7.2 Retained Business rates – For second tier (district councils), this will
become the main source of central funding distributed by the Government
from 2020/2021. Decisions are required by the Government regarding the
amount and mechanism for future distribution.
The amount generated; the amount available for distribution and the amount
distributed to individual authorities are dependent on a range of factors which
are outside the direct control or influence of the Council. These factors will
change throughout the period of the Strategy and it therefore needs to reflect
this and provide an approach to resolve this.
Overall Business Rates collectable and collected – assumptions regarding
economic growth and how this is translated into tangible increase business
0
2000
4000
6000
8000
10000
12000
10/11 11/12 12/13 13/14 14/15 15/16 16/17 17/18 18/19 19/20
RSG and Business Rates
Rates
RSG

21
rates collection will determine the amount of money available for distribution
to local government.
This is a property based tax and it is therefore relatively stable and will
increase as more buildings are built. However, there is growing pressure from
businesses to reform this tax as they see it as a growing and unfair tax on
business. As pressure increases the likelihood of future reform also increases.
The risk to the Council of the future un-sustainability of income grows.
In the short term, a change in this regime is not seen as a priority for the
Government as Brexit continues to be the major focus.
The amount payable is determined by the Rateable Value (RV) and the
multiplier (rate in £). The RV is affected by any revaluations carried out and
the multiplier is increased annually by CPI measure of inflation. The
Government has indicated the next revaluation will be 2021 and every three
years thereafter.
Whilst local authorities will retain a higher proportion of growth, the proposed
system of re-distribution includes provision for re-setting baseline funding
levels which ultimately takes away growth from individual councils and
transfers this to others on the basis of need and ability to generate income.
The district’s rateable value base for 2018/2019 was £74.5m and billed
£35.7m. The increase in this base will be affected by future re-valuations. The
amount billed will be affected by any changes to the multi-plier which will be
assumed at CPI and any transitional arrangements put in place or further
discounts. Further deductions are made for provisions for appeals and
revaluations.
Mansfield District Council currently receives 40% of the remaining sum which
is then pooled within the county and tariffs applied.
Out of the £74.5 RV, MDC’s actual business rates income will be its baseline
funding and its projected share of the Nottinghamshire Business Rates Pool
totalling £3.5m (4.7%).
The table below shows the change in Rateable Value (RV) within the district
and the gross amount receivable using the small business rate multiplier.
Changes in RV tend to increase following revaluations; the impact on the
gross amount is smoothed by the Government adjusting the multiplier after
taking account of the annual inflationary increase.

22
Graph 9
The Government is also to undertake a spending review. The amount
available for other public services will be dependent on economic growth and
tax income. Allocations have already been identified in advance of this review
to Health and increases are expected for Defence.
There is no certainty regarding future baseline funding allocations and
therefore it will be assumed that reductions in funding will be to the same
extent as previously. This would result in addition reduction in grant of £10.3m
in real terms or £5.3m in cash terms up to 2029/30. This would bring the
annual funding from the current £4.3m to £3.4m by 2029/30.
Graph 10
0
10
20
30
40
50
60
70
80
2011 2012 2013 2014 2015 2016 2017 2018
Mill
ion
sRateable Values and Gross Business Rates
RATEABLE VALUE
GROSS AMOUNT
Linear (RATEABLEVALUE)
-
1,000
2,000
3,000
4,000
5,000
6,000
Amount£000
Financial year
Government General Grant
Grant rec'd
Inflation Adj grant

23
7.3 Council Tax – dwellings within the district are placed into one of eight
bands; A/A* to H, based on a value at 1st April 1990. This value is determined
by the Valuation Agency; the value of new properties is converted back to this
date. Band A is the lowest value and H is the highest.
(A* reflect dwellings occupied by those in need of significant adaptations due
to disability).
The numbers of properties within each band is adjusted to take account of
statutory discounts such as a 25% reduction for properties with a single adult
in occupation and discretionary premiums such as an additional 50% for
properties which remain unoccupied after 2 years.
The council also has a local Council Tax Reduction Scheme; this replaced the
previously national Council Tax Benefit Scheme in 2014/2015. This scheme
reduces the liability for individuals based on their financial circumstances.
Once the property number, bandings, premiums and discounts have been
determined this forms the calculation of the Council Tax Base which converts
the total figure into Band D equivalents. A Collection Rate of 98.5% is then
applied to reflect the probability that not all the Council Tax billed will be due
to properties becoming empty during the year, amounts collected in later
years or written off for instance due to the death of the occupier.
The base is an indicator of the growth in housing provision; in number and
value and the financial health of residents.
The Table below shows both the total properties for the period 2011/2012 to
2018/2019 by Band and the overall Council Tax Base before Collection Rate
adjustment for the same period.
Table 3 – Council Tax adjusted base
11/12 12/13 13/14 14/15 15/16 16/17 17/18 18/19
A/A* 26,347 26,412 26,450 26,540 26,679 26,819 26,983 27,107
B 9,291 9,279 9,327 9,325 9,388 9,462 9,508 9,551
C 6,256 6,266 6,338 6,392 6,469 6,519 6,581 6,614
D 3,517 3,542 3,544 3,564 3,622 3,687 3,711 3,735
E 1,367 1,365 1,364 1,363 1,380 1,411 1,437 1,445
F 353 354 357 362 373 383 394 401
G 178 178 178 176 178 179 182 184
H 19 19 19 20 22 25 26 26
Total 47,328 47,415 47,577 47,742 48,111 48,485 48,822 49,063
Base 32,019.2 32,130.6 32,299.7 26,672.9* 27,904.3 28,702.6 29,335.0 29,345.7
67.65% 67.76% 67.89% 55.87% 60.00% 59.19% 60.01% 59.81%
*Introduction of local Council Tax Reduction Scheme

24
The chart below shows the current position graphically.
Graph 11
An additional 1,735 additional dwellings completed during this period.
The Chart below shows the cumulative increase by Council Tax band. As can
be seen there is a significant increase in the completion of Band A dwellings
over the period which has an impact on the amount of Council Tax received.
Graph 12
The Council has been allocated targets of 325 for housing development within
the district, should this not be achieved the Council may incur penalties.
-
5,000
10,000
15,000
20,000
25,000
30,000
A / A* B C D E F G H
D
w
e
l
l
i
n
g
s Council Tax Band
Dwellings by Band 2018/19
-100
0
100
200
300
400
500
600
700
800
2012/13 2013/14 2014/15 2015/16 2016/17 2017/18 2018/19
D
w
e
l
l
i
n
g
s
Cummulative Change in Dwellings Completed by Council Tax Band A / A*
B
C
D
E
F
G
H

25
Each Council Tax Band attracts a different rate of Council Tax due. The rates
approved for 2018/2019 for each band are:
Table 4
Council Tax Band
Council Tax (£p)
A 123.15
B 143.67
C 164.20
D 184.72
E 225.77
F 266.82
G 307.87
H 369.44
The amount budgeted to be raised from Council Tax for 2018/2019 is £5.34m.
Without taking into account the impact on the Council tax Reduction Scheme
and discounts for every 1% of increase in Council Tax equates £53,400. The
table below shows the cumulative amount of Council Tax raised for every 1%
increase over the 10 year period of the Strategy.
Table 5
Year In year increase at
1%
£
Cumulative amount
raised at 1% increase
£
1 53,400 53,400
2 53,934 107,334
3 54,473 161,807
4 55,018 216,825
5 55,568 272,393
6 56,124 328,517
7 56,685 385,202
8 57,252 442,454
9 57,824 500,278
10 58,402 558,680
26
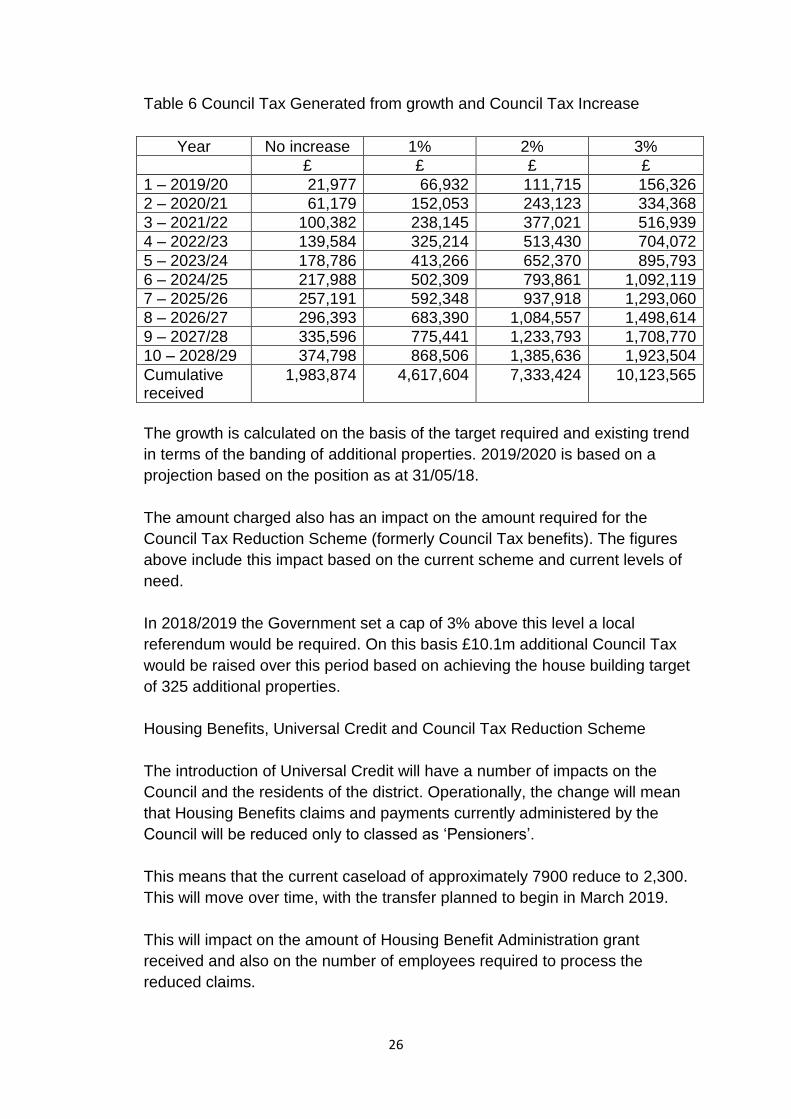
Table 6 Council Tax Generated from growth and Council Tax Increase
Year No increase 1% 2% 3%
£ £ £ £
1 – 2019/20 21,977 66,932 111,715 156,326
2 – 2020/21 61,179 152,053 243,123 334,368
3 – 2021/22 100,382 238,145 377,021 516,939
4 – 2022/23 139,584 325,214 513,430 704,072
5 – 2023/24 178,786 413,266 652,370 895,793
6 – 2024/25 217,988 502,309 793,861 1,092,119
7 – 2025/26 257,191 592,348 937,918 1,293,060
8 – 2026/27 296,393 683,390 1,084,557 1,498,614
9 – 2027/28 335,596 775,441 1,233,793 1,708,770
10 – 2028/29 374,798 868,506 1,385,636 1,923,504
Cumulative received
1,983,874 4,617,604 7,333,424 10,123,565
The growth is calculated on the basis of the target required and existing trend
in terms of the banding of additional properties. 2019/2020 is based on a
projection based on the position as at 31/05/18.
The amount charged also has an impact on the amount required for the
Council Tax Reduction Scheme (formerly Council Tax benefits). The figures
above include this impact based on the current scheme and current levels of
need.
In 2018/2019 the Government set a cap of 3% above this level a local
referendum would be required. On this basis £10.1m additional Council Tax
would be raised over this period based on achieving the house building target
of 325 additional properties.
Housing Benefits, Universal Credit and Council Tax Reduction Scheme
The introduction of Universal Credit will have a number of impacts on the
Council and the residents of the district. Operationally, the change will mean
that Housing Benefits claims and payments currently administered by the
Council will be reduced only to classed as ‘Pensioners’.
This means that the current caseload of approximately 7900 reduce to 2,300.
This will move over time, with the transfer planned to begin in March 2019.
This will impact on the amount of Housing Benefit Administration grant
received and also on the number of employees required to process the
reduced claims.

27
Universal Credit is also expected to impact on the level of council housing rent
arrears for which a financial allowance will need to be made.
In areas where the policy has begun to be rolled out, there has been an
increased time delay between applying for the benefit and receiving the
money resulting in increased hardship for individuals and families. The impact
of this for the district is unknown but would need to be monitored and
addressed where required.
7.5 Council Tax Reduction Scheme
From 2013, the national Council Tax Benefits were replaced with local Council
Tax Reduction Schemes (CTRS) and Council Tax collection authorities
(Districts, Boroughs and Unitary councils) were required to devise a scheme
accordingly.
Mansfield District Council did this and is now in place. It has largely continued
with the methodology and processes used for the former national scheme for
annual upgrades for other benefit and pension increases continue.
The scheme is approved annually by the Council before each financial year.
The significant change to the system is that the council no longer receives
grant from the Government to cover the benefits paid; this is now included in
the Council Tax Base calculation and an amount is included within the general
grant received from the government.
Costs associated with this are now borne in effect by those authorities raising
income from Council Tax – Mansfield District Council, Nottinghamshire
County Council, Nottinghamshire Fire and Rescue Service, Police and in
Warsop Parish Council; increases in Council Tax therefore increase the level
of CTRS. CTRS is directly affected by the level of deprivation, employment
and wage levels within the local economy. As can be seen, the caseload
continues to reduce, however the cost of the scheme increases as a result of
upgrades to thresholds and increases in Council Tax by authorities. Of this
amount Mansfield District Council pays approximately 10%. This proportion
has reduced as Mansfield as held it Council Tax levels whilst others have
increased.

28
Table 7
CTRS £
Caseload
2013/14 8,761,525 11,237
2014/15 8,442,986 10,826
2015/16 8,231,119 10,412
2016/17 8,218,565 9,922
2017/18 8,379,210 9,806
2018/19 (est)
8,618,474 9,535
8. Population and housing growth
The table below shows the recent and projected population growth for the
district set against the number of homes built and projected. As can be seen,
there was a significant drop in homes built whilst population continued to grow
requiring a sharp increase in future years to make up the lost ground. This
accords with the target of at least 325 homes per year being delivered from
2019/20.
Graph 11 – Projected Population and Housing Growth
Growth in population provides additional strain on public services and
infrastructure but also increased spending power within the local economy.
0
100
200
300
400
500
600
700
100,000
102,000
104,000
106,000
108,000
110,000
112,000
114,000
Ho
me
s B
uilt
(n
et)
Po
pu
lati
on
Population
Homes Built
29
The particular issues relating to the district from housing growth are increased
council tax income but also specifically an increase in domestic refuse
collection.
At present the council operates 11 rounds to collect and empty 48,000 bins
per week. This averages 4,363 collections per round and 872 collections per
round per day. The average cost of a round is approximately £100,000 per
year plus a vehicle costing £160,000.
Based on an annual growth of 325 dwellings and weekly collections, this
would add 30 properties per round or 6 properties per round per day.
Therefore, based on current levels of collection; an additional round would
become fully utilised once 4,300 additional collections are required or 13
years at the targeted level of growth. In the early years, changes to working
arrangements would enable the additional collections, however there will
become a point where an additional round will be needed which would provide
capacity for a number of years.
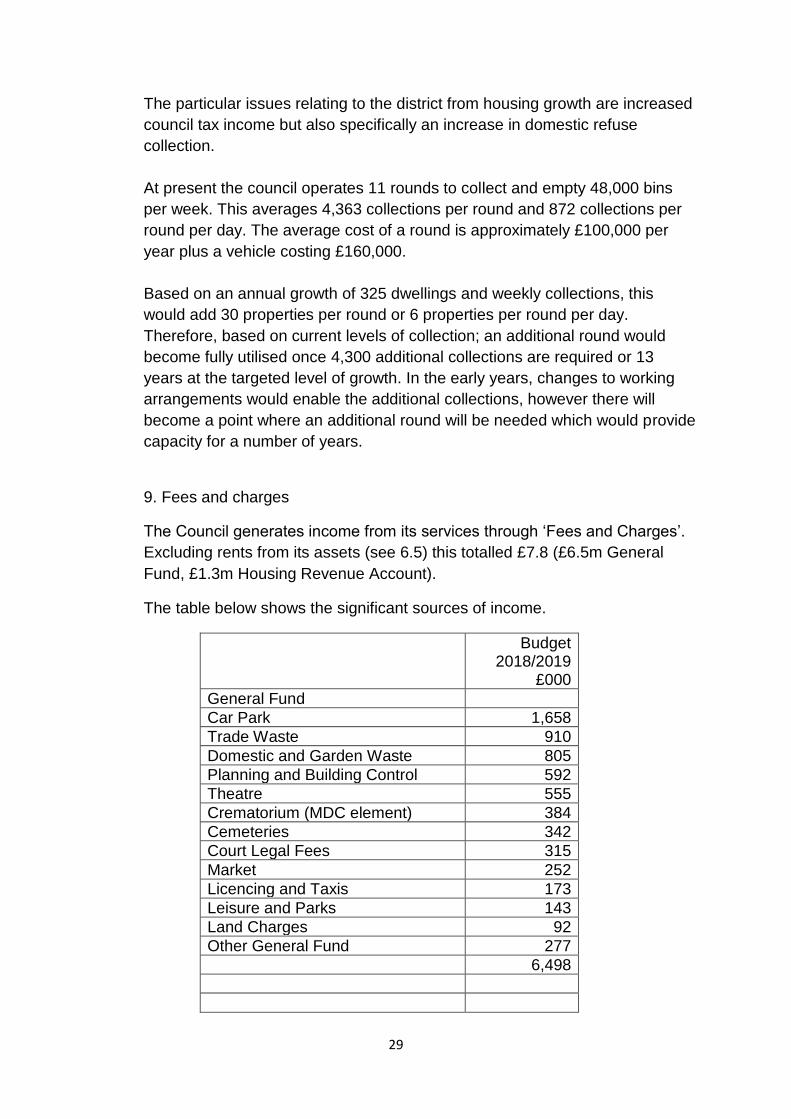
9. Fees and charges
The Council generates income from its services through ‘Fees and Charges’.
Excluding rents from its assets (see 6.5) this totalled £7.8 (£6.5m General
Fund, £1.3m Housing Revenue Account).
The table below shows the significant sources of income.
Budget 2018/2019
£000
General Fund
Car Park 1,658
Trade Waste 910
Domestic and Garden Waste 805
Planning and Building Control 592
Theatre 555
Crematorium (MDC element) 384
Cemeteries 342
Court Legal Fees 315
Market 252
Licencing and Taxis 173
Leisure and Parks 143
Land Charges 92
Other General Fund 277
6,498

30
Housing Revenue Account (HRA)
District Heating 706
Poppyfields 278
Assisted Living 115
Repairs 100
Other HRA 145
1,344
Total 7,842
In determining future levels of charges a specific plan is required for each
area which takes account of the cost of the service, future and ongoing
investment needs, market position and impacts on other service areas,
support services and non-service accounts such as borrowing.
10. Asset rents
The Council has embarked on a programme of property acquisition in order to
safeguard services, release resources for investment and to drive forward its
transformation work.
It has a wide portfolio of assets within the district and externally; the 2018/19
budget income from this source is shown below.
Table 9
Property Type
Annual Budgeted Income
£
Commercial 249,749
Retail 2,295,265
Industrial 435,923
NBIU 22,278
Community Centres 5,152
TOTAL 3,008,367
The largest and most valuable single property and the major source of rental
income within the district is the Four Season’s Shopping Centre where the
Council owns the ground lease; the income from this has remained at £2m
31
and whilst this is a stable source of income, further growth is dependent on
the success of the shopping centre and future occupancy and rental income.
This is therefore related to the level of economic growth and footfall in
Mansfield town centre and the continued attraction of the Four Season and
the shops within.
The building itself opened in 1974 and whilst previous and current operators
have invested in the Centre, an agreed programme of work will be needed to
ensure its long term viability at a time when shopping patterns are changing
significantly.
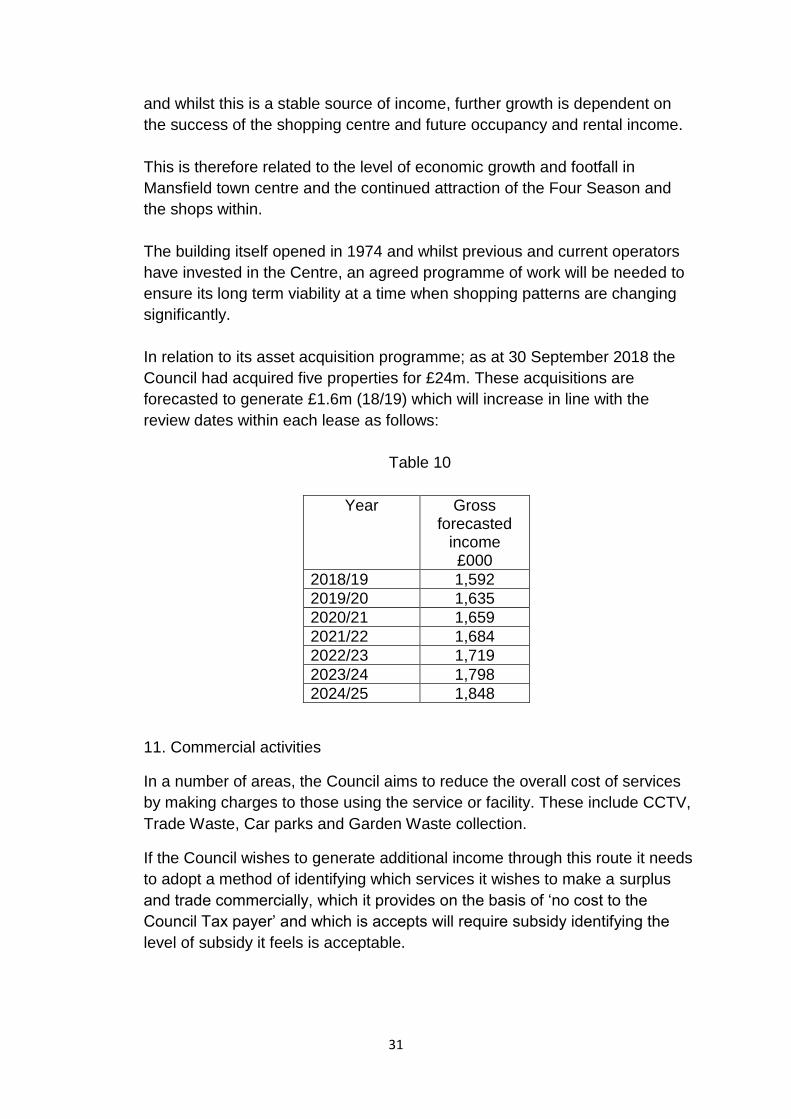
In relation to its asset acquisition programme; as at 30 September 2018 the
Council had acquired five properties for £24m. These acquisitions are
forecasted to generate £1.6m (18/19) which will increase in line with the
review dates within each lease as follows:
Table 10
Year Gross forecasted
income £000
2018/19 1,592
2019/20 1,635
2020/21 1,659
2021/22 1,684
2022/23 1,719
2023/24 1,798
2024/25 1,848
11. Commercial activities
In a number of areas, the Council aims to reduce the overall cost of services
by making charges to those using the service or facility. These include CCTV,
Trade Waste, Car parks and Garden Waste collection.
If the Council wishes to generate additional income through this route it needs
to adopt a method of identifying which services it wishes to make a surplus
and trade commercially, which it provides on the basis of ‘no cost to the
Council Tax payer’ and which is accepts will require subsidy identifying the
level of subsidy it feels is acceptable.

32
There are a number of statutory constraints and requirements which must be
followed, however this approach has been adopted by other local authorities
and different structures have been set up to enable this approach.
The Council has set up Mansfield Homes as a housing company which is able
to make a profit which is returned to the Council in the form of a share-holders
dividend. The Council is the sole shareholder.
The company’s cash flow is funded by a loan from the Council not exceeding
£8.3 million. The Council receives interest on this at a commercial rate and
will receive the loan principal repaid when income from the sale of houses is
received. The company is anticipated to make a significant contribution in the
region of £900,000 in 2019/2020. In order for future dividends to be
generated, the company will identify further projects and funding will be
considered by the Council.
12. Financial Investments
As at the 31 March 2018, the council held financial investments in a range of
institutions totalling £24.8m which generated £97,000 income during
2017/2018. Prior to the financial crash and credit crunch in 2008, income from
this sources exceeded £2m.
The primary requirement of managing investments is to ensure security of the
funds and ability to generate income from this source is limited.
Interest rates on investments are greatly affected by the Bank of England’s
Base Rate which was increased from 0.5% to 0.75% in August 2018.
Investments are also spread across a number of financial institutions to
spread risk which also impacts on the ability to maximise interest income
The Council is intending to reduce its overall cash investment by £14m to
approximately £10m which gives the ability to fund capital expenditure without
the need for external borrowing in the short term but reducing the amount of
interest earned as a result.
Whilst this reduces interest payments in the short term; it gives the Council a
greater exposure to future interest rate increases at the point it needs to
borrow. As rates are expected to rise only gradually, it is possible to manage
this risk.

33
13 New Homes Bonus
New Homes Bonus is a grant awarded to local authorities in response to
increases in dwellings. This is awarded once an authority exceeds a threshold
and is based on the average national Band D Council Tax amount.
In order to attract additional New Homes Bonus, the net increase in dwelling
within Mansfield District must exceed 149 Band D equivalents in the previous
12 months. This is based on the Council Tax Base calculation between
November and October. As at 31 August 2018; there had been an increase of
132 dwellings equating to 112 Band D equivalent dwellings. It is unlikely that
the threshold will be achieved.
Any grant received will be received for four years; the achievement of this
threshold each year therefore impacts on future years’ allocations and
resources.
As a further incentive for house building, the Government is to set targets for
each local authority; for Mansfield District Council this is 325 properties per
year.
The following table shows the amount of New Homes Bonus which could be
generated based on this target, the current Council Tax banding profile of
dwellings within the district, the current threshold and years for which the
grant is allocated.
Table11
Year New Homes Bonus Annual Growth £000
New Homes
Bonus in year
payment £000
2019/20 0 0
2020/21 149 149
2021/22 148 297
2022/23 146 443
2023/24 145 588
2024/25 144 582
2025/26 142 577
2026/27 141 572
2027/28 140 566
2028/29 138 561
Total 4,335

34
As can be seen from the above, achievement of the targets would make a
significant financial impact to support the Council’s services.
14. Capital receipts
Capital receipts are generated through the disposal of a capital asset – land,
buildings, vehicles and equipment. In general, these can only be used to meet
the costs associated with acquiring, building or improving similar assets.
As part of the Transformation plan, a number sites and properties are being
identified for disposal to generate additional capital receipts.
This approach will provide funding towards the works required to safeguard
the Council’s operation properties, to reduce the reliance on external
borrowing.
A direction from the Minister for Housing, Communities and Local
Government has also enable councils to use capital receipts for the purpose
of generating future savings and efficiencies. These can also be used to
support the Transformation Plan for example investing in ICT or meeting the
costs associated with reducing the Council’s overall workforce as explained in
15 below.
15. Employees
Whilst it is a moving figure, the Council has 770 employees, as a number of
these do not work the standard 37 hours per week this equates to 685 full
time equivalent posts.
The 2018/2019 projected cost including Employers National Insurance and
Superannuation is:
Table 12
Total £000
General Fund (including Crematorium)
15,021
Housing Revenue Account
6,227
Pension Lump Sum 2,232
Total employed cost 23,480
Vacancies 786
Total establishment cost
24,266

35
The mean average employed cost per employee therefore stands at
approximately £34,277. This will fluctuate dependent on the scale and number
of employees, the rate of vacancies and the impact of any changes to the NI
and Superannuation contribution rates.
In order to calculate the impact of changes to the number of employees, the
variable average cost (excluding the fixed Pension lump sum payment) is
used - £31,019.
The table below sets out the position with no change in employee numbers
taking account of the increased cost of basic pay, National Insurance and
Superannuation rate. In addition it includes the estimated change in the
Pension Lump Sum payments and rates as a result of the three yearly
actuarial valuations.
The table also shows the reduction in employee numbers required to maintain
the overall costs at current levels. This does not take account of reductions to
meet the current projected deficits.
Table 13
Year Overall employee
costs
£000
Employee reduction
to maintain current
cost FTE
FTE Employed
2018/19 23,480 - 685
2019/20 23,905 -13.43 672
2020/21 24,606 -21.31 650
2021/22 25,048 -12.75 638
2022/23 25,500 -12.50 625
2023/24 26,210 -18.92 606
2024/25 26,679 -11.88 594
2025/26 27,157 -11.65 583
2026/27 27,895 -17.27 565
2027/28 28,393 -11.08 554
2028/29 28,901 -10.87 543
Total -141.67
The Transformation Plan identifies areas where changing the way in which
services are provided would result in the need for fewer employees with no
impact on the service. In addition, a planned reduction through managing
vacancies, retirements and voluntary redundancies is in place.
36
All service areas will be reviewed with savings from employees being
expected.
This will lead to compulsory redundancies which will be dealt with under the
Council’s policies. The scale of this is not known however these will be
minimised where possible.
Reducing the Council’s workforce will generate necessary savings and the
impact on service provision will be minimised; however as the cost of services
increase and government grant continues to fall this becomes more difficult
and the Council will need to prioritise the services it wishes to continue to
deliver in line with the income it has available.
Whilst an ongoing saving will be made from reducing the workforce, there are
one off and continuing costs associated with this in the form of redundancy
payments and pension strain. In identifying the level of reduction necessary
resources need to be set aside to meet these costs.
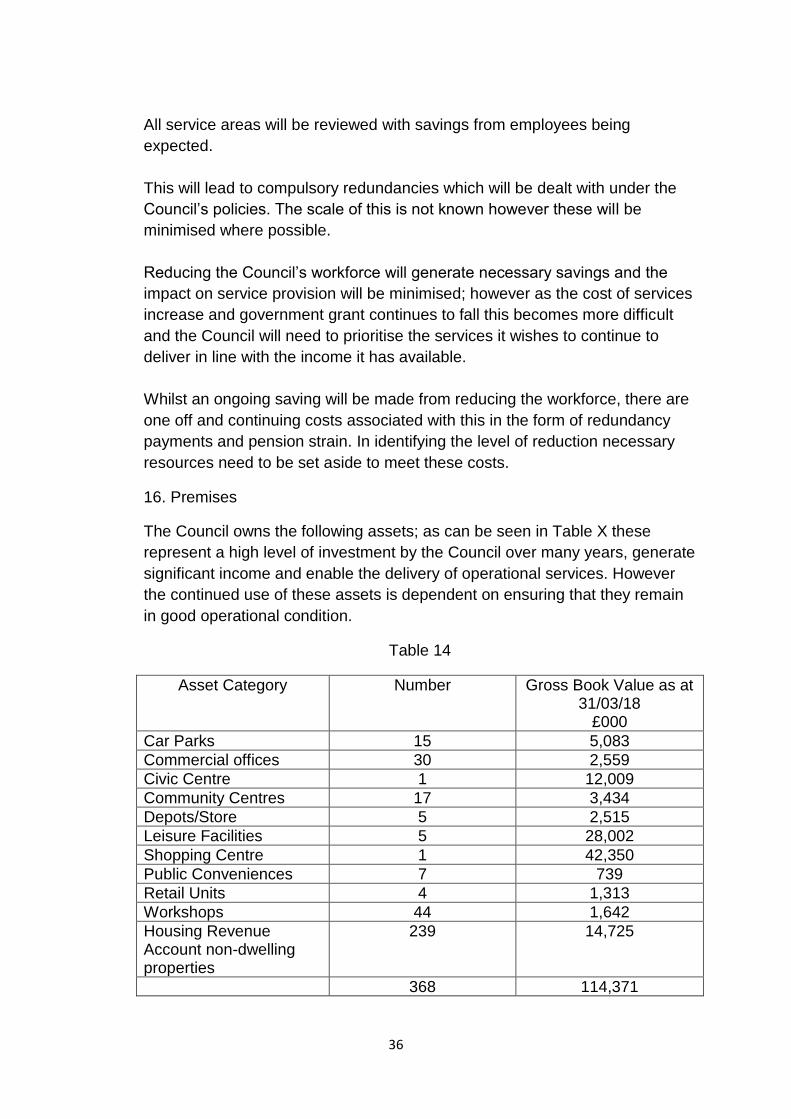
16. Premises
The Council owns the following assets; as can be seen in Table X these
represent a high level of investment by the Council over many years, generate
significant income and enable the delivery of operational services. However
the continued use of these assets is dependent on ensuring that they remain
in good operational condition.
Table 14
Asset Category Number Gross Book Value as at 31/03/18
£000
Car Parks 15 5,083
Commercial offices 30 2,559
Civic Centre 1 12,009
Community Centres 17 3,434
Depots/Store 5 2,515
Leisure Facilities 5 28,002
Shopping Centre 1 42,350
Public Conveniences 7 739
Retail Units 4 1,313
Workshops 44 1,642
Housing Revenue Account non-dwelling properties
239 14,725
368 114,371

37
Business rates – for 2018/2019 the Council is expected to be charged
£998,000 in business rates for its buildings per year; after taking account
adjustments for transitional relief and refunds the amount expected to be paid
is £425,000. This reduction is mainly the result of closing district heating
boiler-houses and includes one of refunds.
The current rateable value of its premises stands at £3,226,000.
Revaluation of premises is planned to be undertaken every 3 years; the
impact of this is difficult to assess and some areas may increase in value,
others may reduce.
In addition to the Rateable Value of premises; the multiplier also increases
annually on the CPI measure of inflation. The Government’s target CPI is 2%.
The current multiplier used for the majority of MDC assets is 49.3p.
Taking the current RV and current multiplier a 2% increase would equate to
the council paying an additional £32,000 in business rates per year.
Following the Business rates re-valuation in 2017 properties owned by the
council are being identified and where necessary an appeal will be made. The
appeals from the 2010 re-valuation continue to be processed; the majority of
these are now complete and the Council has been successful in a number of
cases, reducing the annual charge and receiving a refund.
Planned Preventative Works – In order to ensure that the assets used by the
Council to deliver its services are fit for purpose it is necessary to identify the
level of investment required to maintain or improve the asset.
Based on the results of a programme of asset condition surveys the estimated
amount required is set out in the table below.
Table 15
Asset 18/19 £000
19/20 £000
20/21 £000
21/22 £000
Total £000
Walkden St Car Park
300 2,350 250 450 3,350
Four Seasons Car Park
30 450 418 270 1,168
Civic Centre
274 484 184 86 1,028
Palace Theatre
250 250
Mansfield Museum
150 150
Old Town Hall* 750 750
Community Centres
40 30 70
Hermitage Lane depot
18 100 118

38
Various works by priority**
350 400 400 1,150
Ongoing condition surveys
24 24 48
Statutory compliance risk assessments
40 40 40 40 160
Asset Management system administrator post
18 18 18 18 72
Total planned expenditure
1,494 4,222 1,334 1,264 8,314
Existing budgets
1,494 1,773 463 463 4,193
Additional requirement
0 2,449 871 801 4,121
Mansfield and District Joint Crematorium***
35 768 11 20 834
Leisure Centres****
* Dependent on grant of further £750,000
** Further breakdown over 105 properties available
*** Further requirements of totalling: £1.5m 22/23 to 26/27. Funding will be
through JCC but impact will be on MDC’s VAT and Partial Exemption position.
**** Leisure Management contract – MDC retains responsibility for buildings
and major equipment whilst the contractor is responsible for day to day
repairs. The current works which have been identified are set out below. A
detailed programme now needs to be developed along the same lines as for
other operational assets:
Water Meadows
Roof replacement
Pool plant/ leak flume resolution
Air handling unit
Window replacement
Pool plant refurbishment
Rebecca Adlington SC
Wet-side Flooring

39
Pool swimming pool tank refurbishment
Boiler replacement
Air handling units replacement
Oak Tree Leisure Centre
Roof replacement
Boiler replacement
The method of funding this investment is dependent upon the nature and the
scale of the work, whether it merely maintains the asset or whether it
enhances and lengthens its useful life.
17. ICT Renewal
The operation of the Council and its services is heavily dependent on its ICT
infrastructure. The following table identifies the basic operational requirements
for this. In addition, as the Council increases its digital transformation there is
a need for developments and maintenance of its existing core sytems.
Table 16
Network Infrastructure Hardware
Renewal Fund Item Replacement Time Span Yearly Fund
Servers Every 5 years 63,450
Switches Every 5 years 17,490
Firewalls Every 5 years 3,540
Routers Every 5 years 2,140
Backup Every 5 years 3,170
Storage Every 5 years 18,050
Wireless Every 5 years 2,490
UPS Every 5 years 550
Sub Total 110,880
Network Infrastructure Software
Windows server Every 3 years 22,064
Exchange (e-mail) server Every 3 years 1,770
SQL server Every 3 years 9,144

40
Sub Total 32,978
User Hardware and Software
Kiosks Every 5 years 2,350
Smart Phones Every 4 years 4,460
Mobile phones Every 4 years 1,800
Desk Phones Every 10 years 7,220
Monitors Every 5 years 11,900
PC’s - Expected to decrease Every 5 years 11,070
Laptops - Expected to increase Every 5 years 10,790
Thin Clients - Expected to decrease Every 10 years 10,290
Tablets Every 4 years 10,660
Mice/Keyboards/Cases/Cables etc. Yearly 2,500
Sub Total 73,040
TOTAL YEARLY FUND REQUIRED 216,898
In order to meet these requirements in line with the life expectancy of the
items an annual contribution of £216,898 is needed; this will also need to be
inflated annually; increasing the contribution by 2% year on year or
approximately £5,000 per year. An ICT Renewal Fund is in place with the
following contributions being within the base budget.
2019/20 - £106,000
2020/21 - £81,000
2021/22 - £200,000
The Council’s Transformation Plan includes a significant proposed investment
in ICT; systems software, equipment training and continued development.
Whilst a Transformation Reserve of £500,000 was set up in 2018/2019.
£128,000 remains uncommitted at this stage.

41
A programme of corporate hardware and software developments needs to be
produced and core service requirements for the following systems:
Digital platform
HR and payroll
Financial Management
Council Tax and Housing Benefits
Payments
Housing Management
18. Reserves
The Council maintains a range of reserves to meet identified commitments
and to meet unforeseen expenditure or loss of income and to ensure
resources are available to meet its statutory role in the event of a major
emergency.
As part of the post-holder’s role, the statutory Chief Financial Officer must be
satisfied with and comment upon the adequacy of these reserves. In order to
meet this requirement an annual review and risk assessment is undertaken to
determine any reserves no longer required, any additional reserves or
increase required.
Reserves should only be used to finance ‘one-off’ or time constrained
expenditure and not to support ongoing commitments which should be
identified and included in the Council’s revenue budgets. They should only be
used for the purpose for which they have been identified.
The strategy identifies the need for specific reserves to be set up or added to
Council’s assets, ICT infrastructure and Transformation work can be
safeguarded, developed and progressed. These amounts need to be included
within the base budgets.

42
19. Three Year Financial Projections
Details are contained within the budget report submitted alongside this
strategy together with proposals as to how this is to be addressed.
Table 17
2019/20 £000
2020/21 £000
2021/22 £000
General Fund Base - Deficit
2,497 5,040 5,919
Additional for Local Plan
100 0 0
Additional Planned Preventative Works (known)
2,449 871 801
Additional ICT Renewal (known)
111 136 17
Additional ICT development and upgrade
Unquantified Unquantified Unquantified
Additional Planned Preventative Works (leisure)
Unquantified Unquantified Unquantified
Minimum General Fund Deficit
5,157 6,047 6,737
HRA Deficit 359 1,137 1,859
20. Conclusion and actions.
The 2019/20, 2020/21 and 2021/22 budgets, which have been based on the
strategy identify the following deficits together with other required expenditure.
Whilst work is continuing on these budgets to deliver a balanced budget; the
Long Term Strategy identifies that the short and medium term issues will continue
and will result in even higher deficits in future unless significant changes to the
way in which the Council delivers its services. It is vital that the Transformation
Plan and its consequences are properly resourced and that the savings and
benefits to be delivered are clearly identified and defined.
21. Principles of financial planning.
This is not an exhaustive list of things which need to be considered, however if
these are followed and refined in the future, this will provide the Council with a
robust approach to ensuring that it meets its statutory obligations, its
organisational requirements and its policy aspirations for the district.

43
Principles 1 to 5 relate primarily to understanding the size and timescales of the
likely commitment; 6 to10 relate to what needs to be considered when identifying
solutions.
1. Identify and quantify the Council’s future statutory, organisational and operational requirements; where these are unknown or uncertain –
investigate and develop mitigation.
2. Identify and quantify the Council’s policy and developmental aspirations and requirements in light of local, regional and national policies and the economic landscape.
3. Prioritise statutory, organisational, developmental and policy requirements on the basis of risk, opportunity and impact. Gather information and evidence in order to support this prioritisation.
4. Put timescales on when these requirements will impact on resources. This enables planning of internal resources, communication and enables work to commence on identifying the resulting financial resources.
5. Identify existing and potential income sources and aim to maximise these to meet requirements.
6. Assess the risks associated with existing and potential income streams and be prudent when determining the amount and timing of income expected.
7. Base expenditure, savings and income proposals on a robust understanding of the financial and budget position; the costs, benefits, risks, opportunities and impacts associated with the proposal.
8. Look at the short, medium and long term position. ALL are important.
9. Having identified the need and determined the timing and size of the financial impact; where possible allocate resources in advance over a planned period.
10. Plan for uncertainty. The Council will need to find money for
unplanned expenditure or loss of income. The budgets and financial plans
are estimates and based on assumptions over which the Council has no control. Reserves must be at a level which will allow immediate emergency and urgent expenditure and flexibility must be built in to service revenue and capital budgets. Aim to only use reserves to meet one off events and not to meet ongoing commitments.

44
22. Areas to consider
The following provides a number of areas of work which will be required to
ensure the financial sustainability of the Council.
1. Transformation Plan:
Digital Transformation - The work already underway on using technology
to deliver services and communicate with customers is vital. The Council
will need to provide initial and ongoing support to get the benefiys of this
work.
Core Service Review – The Council will be unable to provide the range of
services in now provides and to the same level. The benchmarking work
done as part of the Transformation Plan has identified that the Council has
continued to provide services that other authorities do not and it has
continued to deliver its range of services predominantly itself when others
do not. A clear understanding of the priority services the Council need to
deliver must be developed and openness to exploring other ways of
delivery.
Continuous Improvement – All services and managers are expected to
continually look to find more efficient and better ways of delivering the
services under their remit. This must continue faster and to a greater
extent than in previous years.
Physical Assets – The Council’s operational assets require significant
investment; all opportunities for reducing this liability should be explored
including reducing the range and number of assets. Where it is possible,
joint use and commercial letting of surplus space needs to be driven in line
with the Government’s One Public Estate policy.
Procurement – The Council must use its significant buying power itself and
with others to secure the best price for the goods and services it procures.
This includes the way in which it delivers services and the way in which
packages of work and goods are designed will be crucial. Working with
Nottingham City Council Procurement Team will release savings.
Agile and Home-working – The changing patterns of work, changing and
reducing workforce all require new ways of thinking and working about the
place and hours of work. Traditional ‘office hours’ are no longer acceptable
to customers and employees too require greater flexibility. This approach
results in higher productivity; potentially releasing capacity and reduces

45
the size of operational space required and therefore free to sell or let out
commercially.
Commercialism – The Council’s approach to its Commercial Asset
portfolio has demonstrated that significant sums can be generated; its
wholly owned housing company too is expected to generate a significant
dividend. Opportunities exist for a focussed commercial approach both
through income generation and also the approach to expectations for
service areas to break-even, make a surplus or reduce the subsidy.