Embed Size (px)
Citation preview
MANITOBA TELECOM SERVICES INC. ANNUAL REPORT 2001
MA
NIT
OB
AT
ELE
CO
MS
ER
VIC
ES
INC
. AN
NU
AL R
EP
OR
T 2
00
1

01 / Introduction02 / Financial Highlights04 / Letter to Shareholders10 / NexGen12 / Wireless14 / e-business16 / Expansion and Partnering18 / Our People22 / Management’s Discussion & Analysis34 / Financial Statements46 / Five Years in Review47 / Investor Information
TABLE OF CONTENTS ➜
THOMAS E. STEFANSONChairman, Manitoba Telecom Services Inc.and MTS Communications Inc.Mr. Stefanson has been Chairman of the MTS Board of Directors since 1989. He is a member of the Governance Committee.
N. ASHLEIGH EVERETTChairman, Royal Canadian Properties Limitedand President, Royal Canadian Securities LimitedMs. Everett has been a member of the MTSBoard of Directors since 1997. She is a memberof the Audit Committee and the HumanResources and Compensation Committee.
JOHN F. FRASER, O.C.Chairman, Air CanadaMr. Fraser has been a member of the MTSBoard of Directors since 1997. He is theChairman of the Governance Committee and a member of the Human Resources and Compensation Committee.
JOCELYNE M. CÔTÉ-O’HARAPrincipal, C20 & CompanyMs. Côté-O’Hara has been a member of the MTS Board of Directors since 1997. She is a member of the Audit Committee and the Human Resources and CompensationCommittee.
➜
➜
➜
➜
WILLIAM C. FRASERPresident & Chief Executive Officer, Manitoba Telecom Services Inc., MTS Communications Inc. and MTS Advanced Inc. Mr. Fraser has been a member of the MTS Board of Directors since 1997.
JONATHAN P. KLUGChief Financial Officer, Bell CanadaMr. Klug has been a member of the MTS Board of Directors since 2000. He is a member of the Audit Committee.
RAYMOND L. McFEETORSPresident & Chief Executive Officer, The Great-West Life Assurance Company and London Life Insurance CompanyMr. McFeetors has been a member of theMTS Board of Directors since 1997. He is a member of the Governance Committee.
➜
➜
➜
C. ARNOLD L. MORBERGPresident & Chief Executive Officer, Calm Air International Ltd.Mr. Morberg has been a member of the MTSBoard of Directors since 1997. He is a memberof the Audit Committee.
RANDALL J. REYNOLDSPresident & Chief Executive Officer, BCE Nexxia Inc.Mr. Reynolds has been a member of the MTS Board of Directors since 2000. He is a member of the Governance Committee.
GEDAS A. SAKUSCorporate DirectorMr. Sakus has been a member of the MTS Board of Directors since 1999. He is a member of the Human Resources andCompensation Committee.
DONALD H. PENNY, F.C.A., LL.D. Chairman, Meyers Norris PennyMr. Penny has been a member of the MTSBoard of Directors since 1997. He is the Chairman of the Audit Committee and a member of the Governance Committee.
➜
➜
➜
➜
ARTHUR R. SAWCHUKChairman, Manulife Financial CorporationMr. Sawchuk has been a member of the MTS Board of Directors since 1997. He is a member of the Governance Committee.
D. SAMUEL SCHELLENBERG CEO, Pembina Valley Water Co-operative Inc.Mr. Schellenberg has been a member of theMTS Board of Directors since 1989. He isChairman of the Human Resources and Compensation Committee and a member of the Audit Committee.
JOHN W. SHERIDANPresident, Bell CanadaMr. Sheridan has been a member of the MTS Board of Directors since 2000. He is a member of the Human Resources andCompensation Committee.
➜
➜
➜
MTS BOARD OF DIRECTORS
Every story has a beginning. The MTS story begins with ourcustomers who, for more than 90 years, have relied on us to meet their communications needs. Today, there are more reasons than ever to choose MTS. Our commitment to delivering the most comprehensive suite of services, our dedication to quality, and our single-minded determinationto provide exceptional value in everything we offer makeMTS the first choice for communications services.
p.1
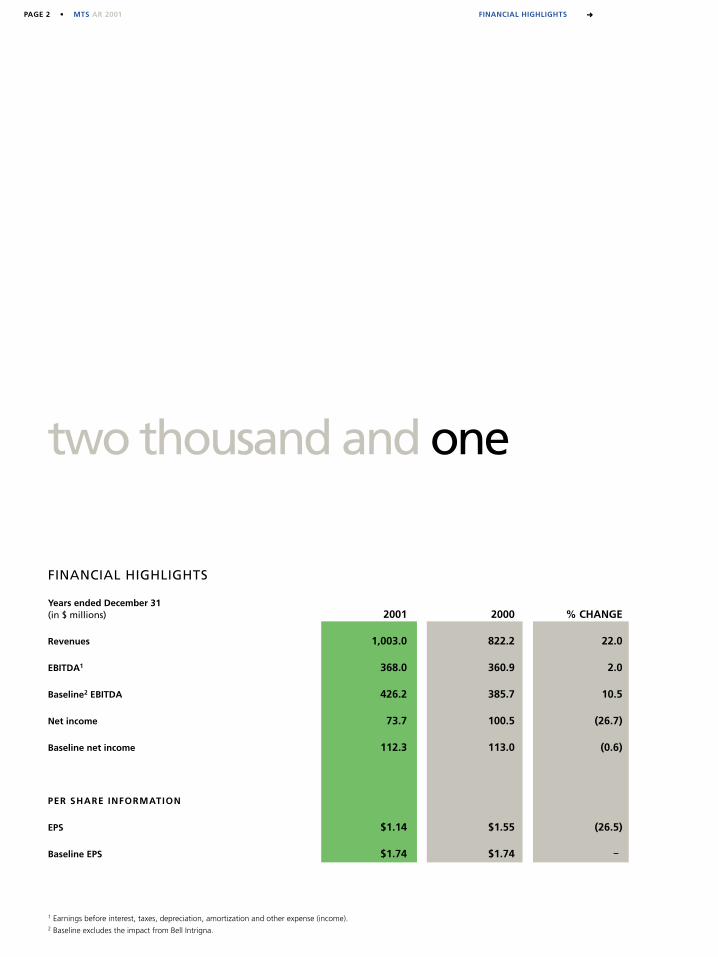
PAGE 2 • MTS AR 2001 FINANCIAL HIGHLIGHTS ➜
two thousand and one
2001 2000 % CHANGE
Revenues 1,003.0 822.2 22.0
EBITDA1 368.0 360.9 2.0
Baseline2 EBITDA 426.2 385.7 10.5
Net income 73.7 100.5 (26.7)
Baseline net income 112.3 113.0 (0.6)
PER SHARE INFORMATION
EPS $1.14 $1.55 (26.5)
Baseline EPS $1.74 $1.74 –
1 Earnings before interest, taxes, depreciation, amortization and other expense (income).2 Baseline excludes the impact from Bell Intrigna.
FINANCIAL HIGHLIGHTS
Years ended December 31(in $ millions)
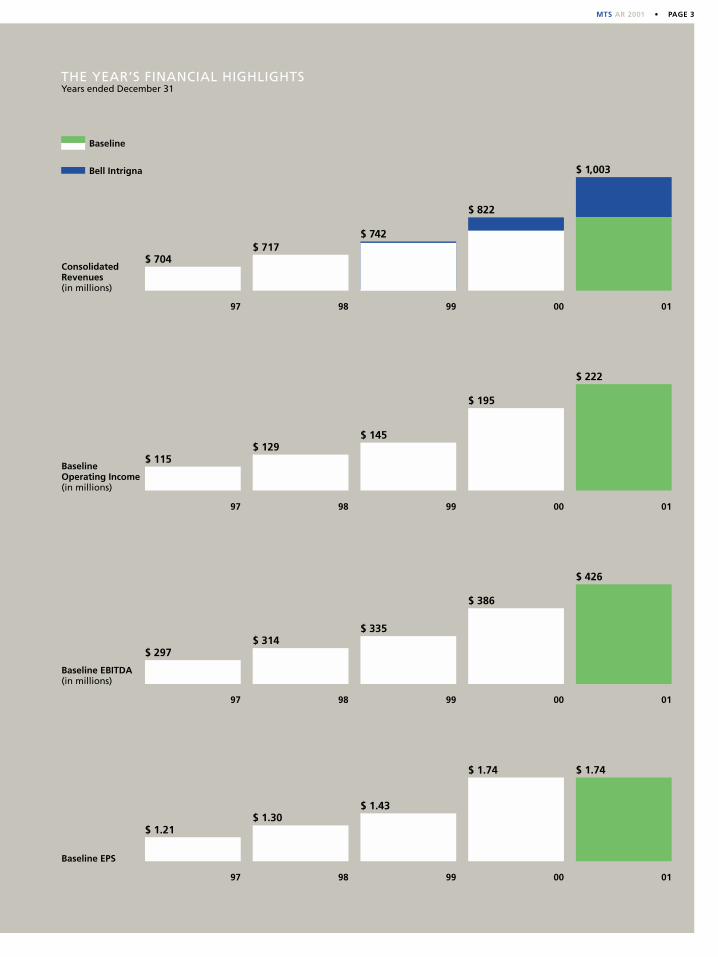
MTS AR 2001 • PAGE 3
97
$ 704$ 717
$ 822
ConsolidatedRevenues(in millions)
98 99 00 01
97
$ 115$ 129
$ 145
$ 195
$ 222
Baseline Operating Income(in millions)
98 99 00 01
97
$ 297$ 314
$ 335
$ 386
$ 426
Baseline EBITDA(in millions)
98 99 00 01
97
$ 1.21$ 1.30
$ 1.43
$ 1.74 $ 1.74
Baseline EPS
98 99 00 01
THE YEAR’S FINANCIAL HIGHLIGHTSYears ended December 31
Bell Intrigna
Baseline
$ 742
$ 1,003
PAGE 4 • MTS AR 2001 LETTER TO SHAREHOLDERS ➜
1of a kind
MTS’s many accomplishments in 2001 reflect our ability to ride the waves of change and opportunity
that are everywhere in the communications industry. In a year that was marked by global political and economic
uncertainty, we made excellent progress in continuing to fulfill our mission of diversifying and growing our
business, and providing innovative communications, e-business and media solutions with exceptional value to
our customers.
MTS’s baseline1 business once again delivered solid financial performance in 2001, with revenues and
earnings per share (EPS) of $820.8 million and $1.74, respectively–consistent with our targets for the year.
Consolidated revenues climbed by 22% to push through the $1 billion mark–a real milestone in our
company’s history.
Our achievements stem directly from our strategies –strategies that are aimed at driving strong, long-
term profitable growth, while prudently managing our risk profile. We are focusing our business in Manitoba to
lead the market, while investing and expanding into complementary lines of business that leverage our strengths.
We aggressively moved forward with these objectives in 2001, concentrating on four major expansion activities:
advancing our NexGen broadband initiative; continuing the successful expansion of our wireless business; growing
our e-business division, Qunara Inc. (“Qunara”); and continuing the build out of our majority owned subsidiary,
Bell Intrigna Inc. (“Bell Intrigna”), in Alberta and British Columbia.
The best measure of our continued success in Manitoba is our position in the marketplace. Quite simply,
we are number one in each of our chosen markets. In wireless, we hold 68% market share. In Internet, it is more
than 50%; in long distance, it is 80%; and in the local market, we are at 98%. Inextricably linked to MTS’s
leadership position is our status as a full-service provider. This is a huge competitive advantage which provides
extensive opportunities for unique bundling solutions and one-stop shopping. Today, MTS offers a full range of
telecommunications services. Tomorrow’s opportunity is the high-bandwidth services that we are enabling
through our NexGen initiative.
NexGen positions MTS with the most advanced and expansive communications infrastructure in
Manitoba –strengthening our competitive position and providing an excellent platform for profitable growth.
In 2001, our NexGen team made tremendous progress with its deployment plan. Seventy-six per cent of
MARKET LEADER. RELENTLESS INNOVATOR. FINANCIAL PERFORMER.
1Baseline excludes the impact from Bell Intrigna.
MTS AR 2001 • PAGE 5
Manitobans now have access to high-speed Internet capabilities, which is ahead of our original year-end target of 70%.
As these infrastructure enhancements were being rolled out, we aggressively marketed the network’s high-speed
Internet capabilities to our customers. More than 22,800 new customers signed on for this service in 2001, representing
an increase of 205% from a year earlier, contributing to growing levels of high-speed service penetration.
We also advanced our plans for the introduction of future broadband-enabled services. In September,
MTS applied to the Canadian Radio-television and Telecommunications Commission for a broadcast distribution
licence, with longer-term plans to introduce broadcast distribution as another growth vehicle and value-added
service for our customers.
In the delivery of wireless services, network coverage and functionality are key. MTS leads the market in
both of these areas. Our network is pervasive, with a wireless footprint that covers 96% of the population. For
the past 14 years, we have continually invested to build and evolve our network–first with analog service, and
now with extensive digital capabilities. In 2001, we undertook a multi-year, $50 million upgrade, expanding our
800 MHz digital reach and installing and turning up 1.9 GHz service in Winnipeg. We also acquired an additional
10 MHz of spectrum through Industry Canada’s auction. These investments not only enhanced the quality and
reach of our service, but also set the stage to add to our growing stable of wireless data applications that ride
on the network.
Our e-business division, Qunara, is another area of particular accomplishment. Qunara is a business
adjacency where we are taking our core competencies and building them into a new line of business that adds
to the diversification of our revenue base and strengthens MTS’s overall growth profile.
Early in 2001, we acquired The EXOCOM Group Inc. (“EXOCOM”). EXOCOM significantly enhanced our
ability to provide new products and services, increased Qunara’s clientele, and expanded our operations into new
markets. MTS’s e-business operation went on to deliver revenues of $25.5 million, which exceeded plan and was
reflective of our overall approach to managing MTS’s businesses for long-term growth. Through the balance of
the year, our e-business team concentrated on integrating EXOCOM and Qunara. Effective January 1, 2002, Qunara
and EXOCOM officially began operating as a single company under the Qunara banner.
With revenues of $182.2 million in 2001, Bell Intrigna captured an estimated 10% share of its addressable
market–an excellent growth ramp, a major accomplishment, and a testament to its business model. The Bell
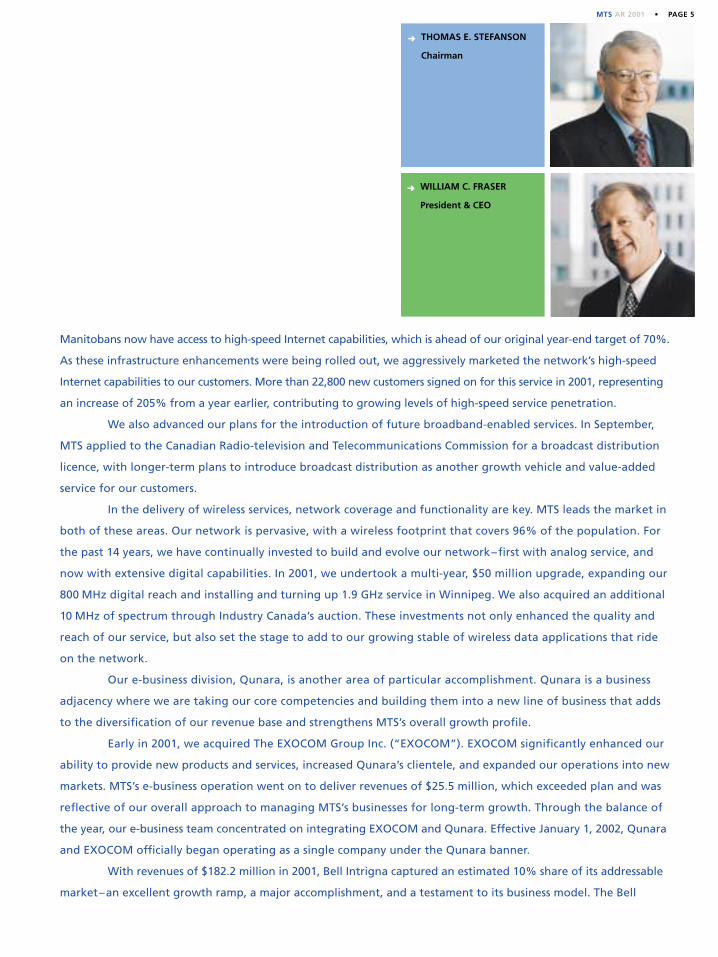
WILLIAM C. FRASER
President & CEO
THOMAS E. STEFANSON
Chairman
➜
➜
PAGE 6 • MTS AR 2001 LETTER TO SHAREHOLDERS ➜
Intrigna team progressed with the deployment of its infrastructure, a key requirement for the company as it
transitions customers onto its own network and advances profitability. Bell Intrigna also completed its
contractual arrangements relating to the Government of Alberta’s (“GoA”) SUPERNET project, and assumed
responsibility for a major portion of the GoA’s telecom services, which alone contributed revenues of $23.4 million
during the year.
Looking ahead to 2002, we will continue to focus on the efficiency of our core traditional business
while, at the same time, advancing our four major business expansion initiatives to drive profitable growth,
improve our value proposition, and strengthen our status as a clear choice for customers.
➜ Related to NexGen, our priorities include further increasing our customer base, advancing MTS’s plans
for the introduction of new broadband services, trialling a digital television distribution service and
executing our infrastructure build. By the end of 2002, we plan to have completed fibre deployment to
247 office buildings, 41 industrial parks and 14 major hotels.
➜ In wireless, we will be further improving our digital network with the introduction of 1xRTT, a standard
for digital cellular PCS services that will enable new capabilities and improvements in voice efficiencies.
It will also allow for data transmission speeds of up to 144 kilobits per second. We have earmarked
approximately $6 million of capital to expand our wireless data offerings–all of which will support what
we believe will be another year of excellent growth from this line of business.
➜ Qunara will be focused on growing its position in the Canadian market, expanding delivery capability
within its existing client base, creating access to new strategic accounts and leveraging its technology
partnerships. Qunara also will be selectively entering key verticals in the United States where it can take
unique offerings to market.
➜ We are committed to seeing that Bell Intrigna’s business plan is successfully executed, and that its presence
in Alberta and British Columbia increases, tapping into new opportunities to drive ongoing value creation.
Bell Intrigna will be driving hard to deliver on all aspects of the GoA SUPERNET, and will be aggressively
working to deliver on its plans for increased profitability. Bell Intrigna’s opportunity and challenge as it
moves forward is to build on its momentum in the marketplace, while at the same time capitalizing
on its infrastructure to accelerate the migration of its customers onto its own network.
➜➜
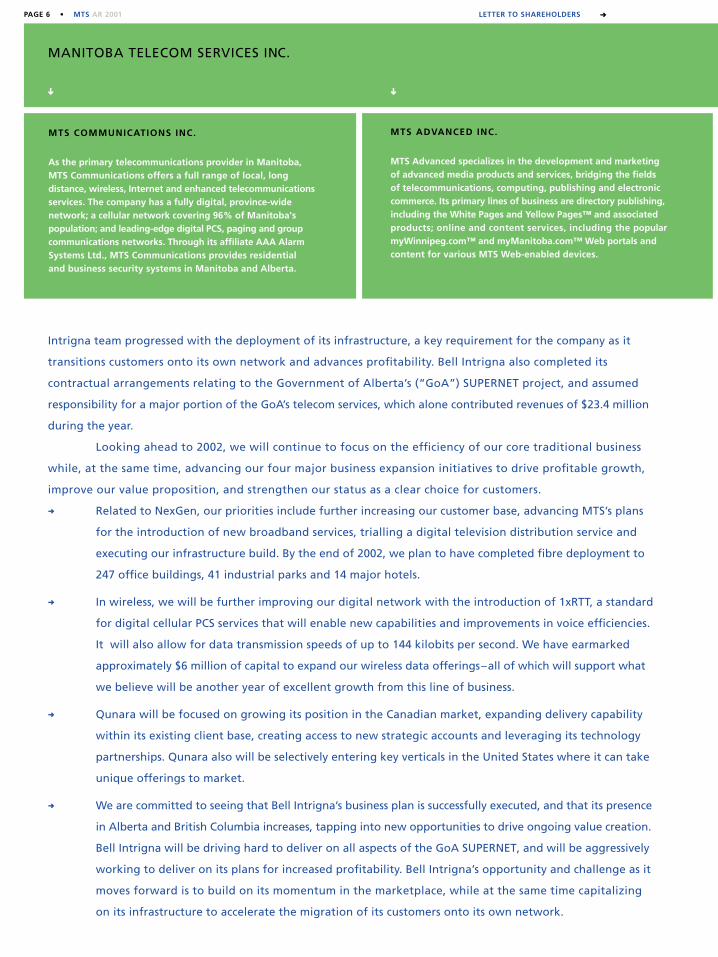
MTS ADVANCED INC.
MTS Advanced specializes in the development and marketing of advanced media products and services, bridging the fields of telecommunications, computing, publishing and electroniccommerce. Its primary lines of business are directory publishing,including the White Pages and Yellow Pages™ and associatedproducts; online and content services, including the popularmyWinnipeg.com™ and myManitoba.com™ Web portals andcontent for various MTS Web-enabled devices.
MANITOBA TELECOM SERVICES INC.
MTS COMMUNICATIONS INC.
As the primary telecommunications provider in Manitoba,MTS Communications offers a full range of local, longdistance, wireless, Internet and enhanced telecommunicationsservices. The company has a fully digital, province-widenetwork; a cellular network covering 96% of Manitoba'spopulation; and leading-edge digital PCS, paging and groupcommunications networks. Through its affiliate AAA AlarmSystems Ltd., MTS Communications provides residential and business security systems in Manitoba and Alberta.
MTS AR 2001 • PAGE 7
Our optimism for the future is grounded in our focus on the customer, in the appropriateness of our
strategies, and in our ability to execute. Add to this MTS’s strengths:
➜ We are the leading communications provider in Manitoba, and we are building for tomorrow to ensure
that we fully leverage this position into new growth opportunities.
➜ We are one of the most efficient, competitive telecommunications companies in North America and a
cost leader in Canada–and there is no better proof than our industry-leading baseline EBITDA performance.
➜ We have an aggressive growth strategy in place in Western Canada that not only provides a very
attractive revenue and profitability ramp, but also less risk.
➜ MTS is in excellent financial position, supported by its solid capital structure, strong cash flows,
and superior financing flexibility.
Taken together, MTS is extremely well positioned to grow and succeed both inside and beyond
Manitoba. We believe there is no better path for long-term profitable growth than the one MTS is on, and
we are confident in our ability to deliver value to our shareholders.
Market leader. Relentless innovator. Financial performer.
MTS truly is one of a kind.
➜ ➜
Thomas E. Stefanson
Chairman
William C. Fraser
President & CEO January 30, 2002
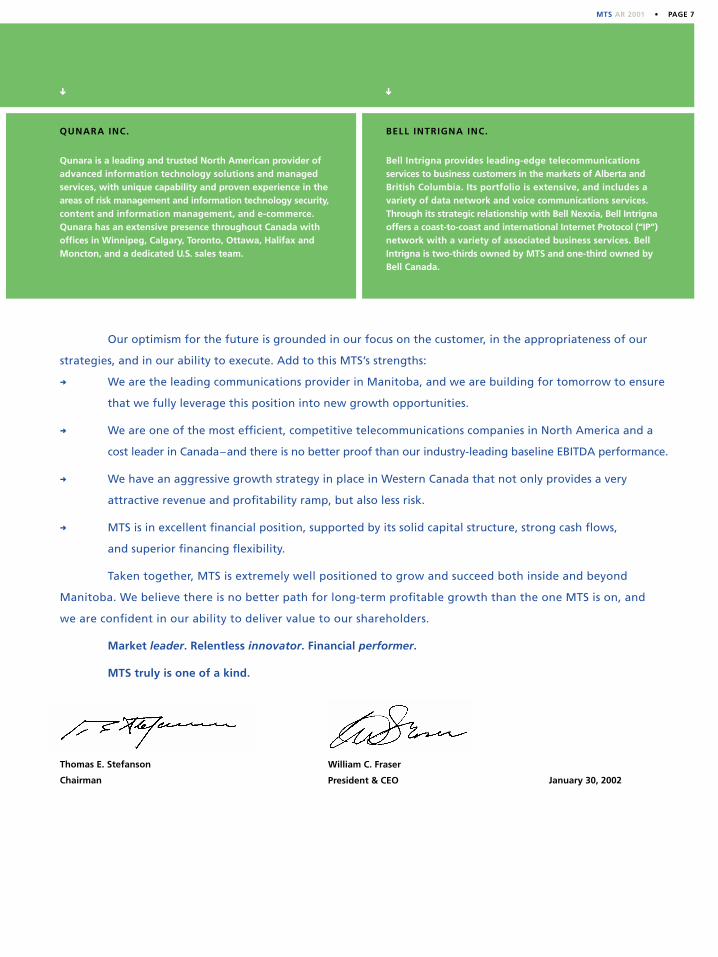
QUNARA INC.
Qunara is a leading and trusted North American provider ofadvanced information technology solutions and managedservices, with unique capability and proven experience in theareas of risk management and information technology security,content and information management, and e-commerce.Qunara has an extensive presence throughout Canada withoffices in Winnipeg, Calgary, Toronto, Ottawa, Halifax andMoncton, and a dedicated U.S. sales team.
BELL INTRIGNA INC.
Bell Intrigna provides leading-edge telecommunicationsservices to business customers in the markets of Alberta andBritish Columbia. Its portfolio is extensive, and includes avariety of data network and voice communications services.Through its strategic relationship with Bell Nexxia, Bell Intrignaoffers a coast-to-coast and international Internet Protocol (“IP”)network with a variety of associated business services. BellIntrigna is two-thirds owned by MTS and one-third owned byBell Canada.
PAGE 8 • MTS AR 2001 GROWTH AREAS ➜
LEVERAGING OUR EXPERIENCE ONE STEP AT A TIME.
LONG-TERM SUCCESS MARKED BY STRONG, PROFITABLE
GROWTH DEMANDS A STRATEGIC AND FORWARD-
LOOKING APPROACH. AT MTS, WE ARE MEETING THAT
CHALLENGE BY FOCUSING ON LEADING THE MARKETS
IN OUR CORE BUSINESS AND PRUDENTLY EXPANDING
INTO NEW, RELATED GROWTH OPPORTUNITIES WHERE
WE CAN BRING OUR KEY STRENGTHS TO BEAR.
MTS AR 2001 • PAGE 9
Our approach to business begins with strategies that have beendesigned to achieve one goal: long-term profitable growth. Bycontinually increasing the value we provide customers, andparticipating in select business development opportunities thatleverage our core competencies, we have transformed MTS intoWestern Canada’s leading regional provider of communicationsservices. For the past several years, MTS has consistently led itschosen markets in Manitoba; 2001 was no exception. Weenhanced the quality and breadth of our portfolio with newadditions in wireless and Internet services, fine tuned pricingwhere required to ensure competitive positioning, and investedin new information technologies in areas like customer billingand network management to build on our customer relationships.Outside of Manitoba, the creation of Bell Intrigna is MTS’s mostsignificant expansion initiative to date. Launched in June of 1999,Bell Intrigna’s unique business model provides the company withmany distinct competitive advantages. It operates exclusively in the high growth areas of Alberta and British Columbiaspecifically targeting business customers–a segment that enjoysamongst the highest relative levels of profitability in the market.Bell Intrigna has an exclusive partnership arrangement withBell Nexxia, and is backed by two very strong and seasonedcommunications companies: MTS and Bell Canada. In just twoand one half years of operation, Bell Intrigna has grown to havedeployed gross capital assets of $273.4 million. This year, BellIntrigna delivered revenues of $182.2 million compared with $2.2million in 1999. Through Qunara, we aggressively expanded thescope of MTS’s e-business operations. Consistent with our prudentapproach to growth, MTS acquired EXOCOM in January 2001.This acquisition added to the depth and breadth of Qunara’scapabilities, to its presence in its markets, and contributed toMTS’s e-business revenues for the year exceeding plan.
PAGE 10 • MTS AR 2001 GROWTH AREAS ➜
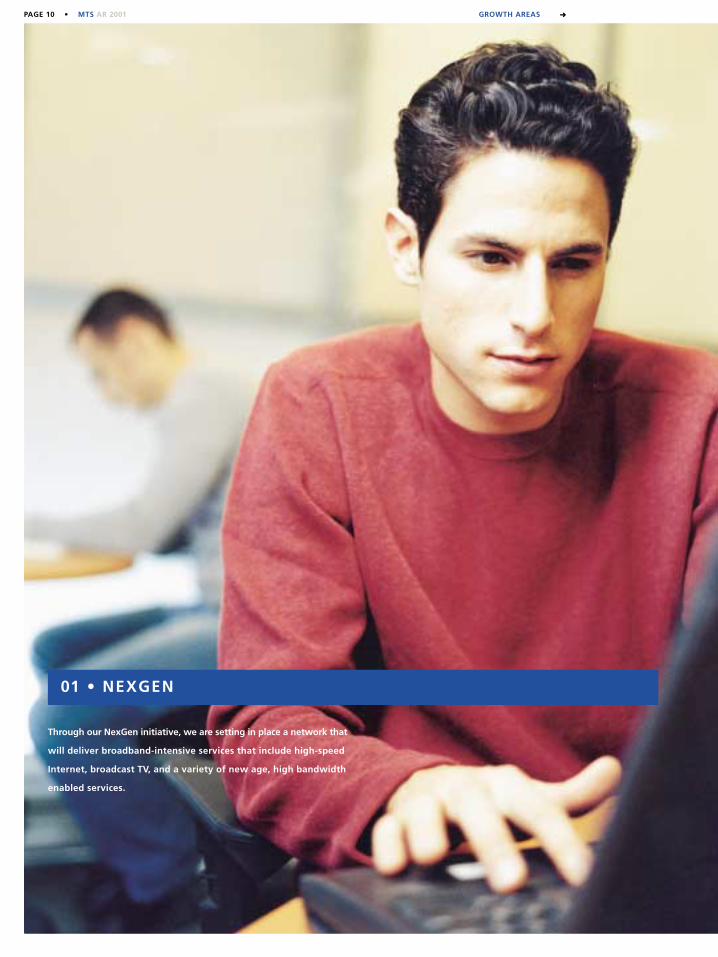
01 • NEXGEN
Through our NexGen initiative, we are setting in place a network that
will deliver broadband-intensive services that include high-speed
Internet, broadcast TV, and a variety of new age, high bandwidth
enabled services.
MTS AR 2001 • PAGE 11
As telecommunications, computers and broadcast technologies converge, MTS is expanding its network
capabilities to provide the solutions essential in our changing world. MTS’s NexGen initiative is a four-year, $300 million
major capital build program to deliver the most extensive portfolio of communications services to business and residential
customers over the most advanced broadband network in the province. By the end of 2001, high-speed Internet service was
available to 95% of residential customers in Winnipeg and Brandon, and in 34 other communities throughout the province.
For the business segment, NexGen technology has been deployed to 194 office buildings, 28 industrial parks and 14 hotels,
with an additional 53 office buildings and 13 industrial parks targeted for 2002.
In addition to high-speed Internet service, MTS advanced plans for other new broadband-enabled services that
will ride on the enhanced network. In September, MTS applied to the Canadian Radio-television and Telecommunications
Commission for a broadcast distribution licence. Technical service and market trials using VDSL technology in the network
will be completed through 2002, with full commercial launch of digital TV planned for 2003. VDSL technology is provided
over a secure dedicated line, and has many advantages over other digital service providers– including the capability to
deliver three simultaneous digital video signals and a requirement for only one set-top box.
one powerful network
01 • NEXGEN 02 • WIRELESS 03 • E-BUSINESS 04 • EXPANSION AND PARTNERING
PAGE 12 • MTS AR 2001 GROWTH AREAS ➜
As market demand for wireless services accelerated in 2001, MTS’s customer base increased by more than 20%.
It took nearly ten years to break the 100,000-customer mark, following the commercial launch of wireless service in 1988.
Four years later, we have doubled our number of customers to more than 200,000, with no signs of a slowdown in sight.
In this segment, the greatest opportunities for the future lie in continuing to grow the customer base and adding new
value-added services for our customers.
The wireless opportunity is no longer limited to voice applications. We are aggressively expanding our line of
wireless data products, contributing to the company’s overall value proposition, and positioning MTS to capture future
growth. Digital Data to Go™, a value-added service, allows customers to gain instant access to the Internet, e-mail and their
corporate network at speeds averaging 56 kilobits per second, by connecting their laptop computer and MTS cellular
phone. Zero Gravity™ is a wireless Internet and e-mail connection for Palm Personal Digital Assistants; MTS was
the first telecommunications company in Canada to offer this service. Mobile Browser™, an Internet connection for
Web-enabled, digital PCS phones, is a first-in-Manitoba service from MTS. Wireless POS enables wireless debit and credit
card transactions. eChat™ Interactive Paging allows customers to send and receive e-mails using a small pager-size
communicator.
f1rst
MTS AR 2001 • PAGE 13
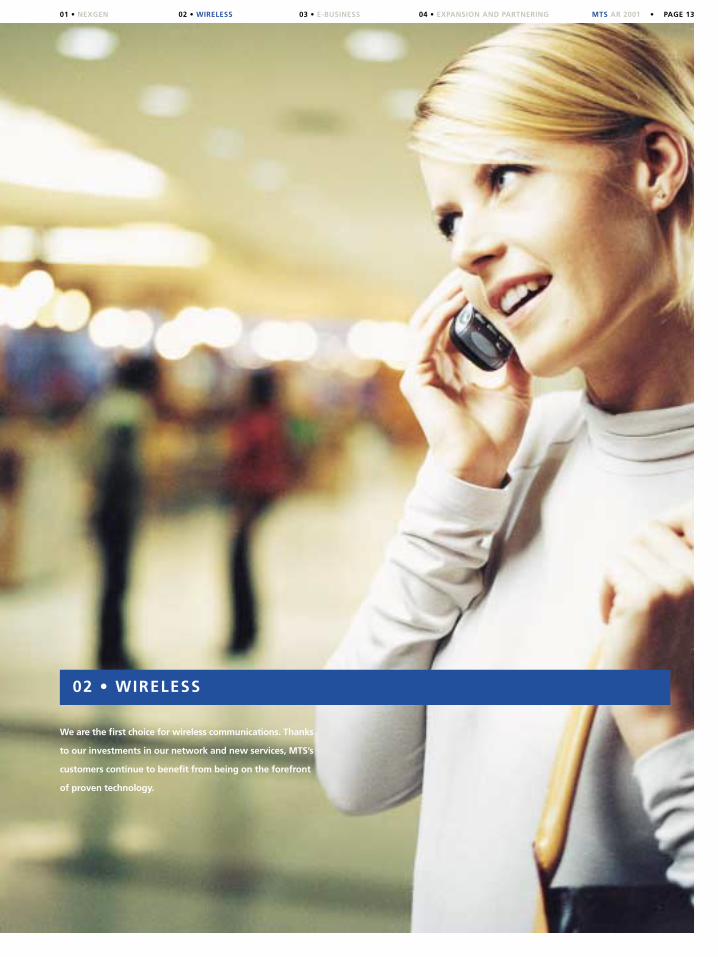
02 • WIRELESS
We are the first choice for wireless communications. Thanks
to our investments in our network and new services, MTS’s
customers continue to benefit from being on the forefront
of proven technology.
01 • NEXGEN 02 • WIRELESS 03 • E-BUSINESS 04 • EXPANSION AND PARTNERING

PAGE 14 • MTS AR 2001 GROWTH AREAS ➜
03 • E-BUSINESS
One of the best, and growing. Qunara continues to build its
reputation as a provider of information technology solutions
and managed services with capabilities and expertise that set
it apart from the competition.
MTS AR 2001 • PAGE 15
2001 was an excellent year for Qunara, marked by a major expansion of its capabilities, services and market
presence–and overall performance that exceeded plan. Qunara's portfolio of end-to-end e-business solutions is extensive;
its proven capabilities are reflected in the calibre of its customer relationships. A major highlight in 2001 was a $5.2 million
contract with the Canadian Department of National Defence to provide expertise in information technology security
specifically related to smart card and Public Key Infrastructure technologies.
Our e-business capabilities were recognized when EXOCOM was named a Microsoft Gold Certified Partner in both
the e-Commerce and Enterprise Systems specializations–the first Canadian firm to earn two of these highly sought-after
certifications. We also became the first Canadian firm to meet Sun Microsystems Inc.’s SunToneSM Certification and
Branding Program's availability, reliability and performance standards for managed hosting and security services.
Underpinning our success is the Qunara team, offering an exceptional breadth and depth of business and
technical expertise, and a passion for excellence. For the second consecutive year, EXOCOM was named one of the top 100
employers in Canada, recognized for a culture that attracts the top professionals in the industry and encourages career
development and personal growth.
010010011010
01 • NEXGEN 02 • WIRELESS 03 • E-BUSINESS 04 • EXPANSION AND PARTNERING

PAGE 16 • MTS AR 2001 GROWTH AREAS ➜
Bell Intrigna’s business success is built on a value proposition that offers business customers a compelling alternative
with innovative, cost-effective, and highly reliable communications solutions. Bell Intrigna’s partnership arrangement with
Bell Nexxia contributes to the delivery of its value proposition by providing global connectivity, access to IP-based services,
and the benefit of an assured revenue stream.
Some of Bell Intrigna’s many accomplishments in 2001 include: growing its customer base to more than 1,400,
completing the detailed contracting phase relating to GoA’s SUPERNET, taking over the delivery of the majority of the
GoA’s current telecommunications service requirements, and making excellent progress in the deployment of infrastructure
throughout its operating territory. By the end of 2001, Bell Intrigna’s network had grown to include three DMS 500
switches, 27,000 fibre kilometres, and 43 co-locations. Two hundred and thirty-one buildings were signed with 141
connected to the network.
1+1
MTS AR 2001 • PAGE 17
04 • EXPANSION AND PARTNERING
The one to watch. Backed by the experience, solutions, reputation and
strengths of its key partners and shareholders, Bell Intrigna is the leading
and fastest-growing alternative provider of telecommunications services
in Alberta and British Columbia. Through its most impressive win to date,
Alberta SUPERNET, Bell Intrigna is building a next generation network
that will bring high-speed Internet services to every Alberta community
with a school, library, hospital or provincial government office by 2004.
01 • NEXGEN 02 • WIRELESS 03 • E-BUSINESS 04 • EXPANSION AND PARTNERING

As important as leading-edge technology and exciting value
propositions are to a successful business, it is the people who bring it all
together. Our vision of enhancing MTS’s status as the premier regional
communications provider in Western Canada is shared by all of our employees.
In fact, it is the fundamental reason we achieved that status in the first place.
MTS’s track record of making prudent business decisions that
deliver results and drive sustainable growth is directly attributable to the skills,
expertise and determination that our employees possess both individually
and as a team. Together, we are committed to providing customers with the
best service in the industry, which has translated into high levels of customer
Outstanding employees
PAGE 18 • MTS AR 2001 OUR PEOPLE ➜

satisfaction across all of our lines of business. In addition, our ability to adapt
as an organization has manifested itself in an unfailing ability to meet the
challenges of the communications industry.
MTS’s leadership position in the marketplace parallels our leadership
efforts in the community. Our employees excel as active members of their
communities, contributing countless hours in support of worthwhile
endeavours– and donating more than a quarter of a million dollars each
year to selected charities operating in Manitoba. MTS is proud to match their
donations dollar for dollar.
1 vision
MTS AR 2001 • PAGE 19
PAGE 20 • MTS AR 2001 OUR SERVICES ➜
Be it local and long distance wireline services, wireless, e-business solutions or high-speed Internet, only
MTS offers customers the convenience of one-stop shopping for all of their communications needs. It is the MTS
advantage, significantly enhancing our overall value proposition in Manitoba.
The breadth of MTS’s service offerings provides us with the opportunity to create unique bundled solutions.
Packaging wireline, wireless, and Internet services contributes to growth in services, and gives our customers less
reason to shop around.
In 2001, we introduced a single bill option, adding to the convenience that comes from dealing with a
single service provider. Today, MTS customers can receive a single bill for their wireline and wireless services. We are
one-stop shopping
Digital or analog, voice or data,
MTS is Manitoba’s first choice
for wireless communications.
We are committed to delivering
extremely high quality services
over the most extensive
network in the province.
MTS is the market leader
in wireline communications,
offering a full suite of
telecommunications
equipment, Calling Features
and savings plans that keep
customers coming back.
With our reliable, affordable
and expanded high-speed
Internet network, more
Manitobans than ever are
turning to MTS to access
all the Internet has to offer.
MTS’s investment in NexGen
services is paying dividends for
customers who require high
bandwidth. With applications
including broadcast video and
tele-radiology on the horizon,
the future looks even brighter.
➜ ➜ ➜ ➜
WIRELINE COMMUNICATIONS WIRELESS COMMUNICATIONS INTERNET ACCESS BROADBAND SERVICES
on our way to including the Internet as well as other NexGen applications, such as video services, in the future.
MTS is Manitoba’s most trusted name in telecommunications, a name that has been synonymous with
leading-edge technology, one-stop shopping and outstanding service for nearly 100 years. Our reputation for high
quality, competitively priced services and our relationships with customers contribute to sustained high levels
of customer satisfaction and market share.
Major customers, like the
Ontario Justice Department,
turn to MTS to provide
tailored solutions that allow
them to meet without the
expense, time commitment
and inconvenience associated
with travel.
We bring businesses and
customers together. From Web
destinations of choice like
myWinnipeg.com™ to trusted
advertising solutions like the
MTS Yellow Pages™, MTS
continues to lead the way.
Qunara creates a direct
link between businesses
looking to e-enable their
enterprises and the solutions
that allow them to increase
efficiency, lower costs and
expand their markets.
Our AAA Alarms subsidiary
offers a complete suite
of solutions to customers
in Manitoba and Alberta,
providing increased security
and peace of mind.
➜ ➜ ➜ ➜
MEDIA SERVICES TELE- AND VIDEOCONFERENCING
E-BUSINESS SOLUTIONS SECURITY SERVICES
MTS AR 2001 • PAGE 21
PAGE 22 • MTS AR 2001
md&afinancial statements
MANAGEMENT’S DISCUSSION & ANALYSIS ➜
23 / Management’s discussion & analysis34 / Management’s responsibility for
consolidated financial statements35 / Audit committee report35 / Auditors’ report36 / Consolidated statement of income37 / Consolidated statement of
retained earnings37 / Consolidated statement of cash flow38 / Consolidated balance sheet39 / Notes to consolidated financial statements
TABLE OF CONTENTS ➜
MANITOBA TELECOM SERVICES INC. AR 2001 • PAGE 23
This discussion and analysis should be read in conjunction with the Company’s audited consolidated financial statements. This
report includes forward-looking statements about MTS’s corporate direction and financial objectives that are subject to risks
and uncertainties. As a consequence, actual results may differ materially from those projected or suggested.
OVERVIEW
MTS continues to successfully pursue strategies for achieving long-term profitable growth, and leveraging core competencies
developed as the premier communications provider in Manitoba. Through its Bell Intrigna subsidiary, the Company is also one
of the largest alternative providers serving businesses in Alberta and British Columbia–both strong growth markets for
communications services.
MTS delivered another year of solid financial performance in 2001, including a record 22% increase in consolidated operating
revenues. 2001 marked the first time in the Company’s history that revenues exceeded $1 billion. Strong profitability continued
to underpin the MTS growth strategy. In its baseline business1, EBITDA2 reached $426.2 million, representing an impressive
increase of 10.5%. The EBITDA margin increased to 51.9%, an industry-leading level, and up from 50.5% in 2000. Baseline
earnings per share (“EPS”) were on target at $1.74. This performance is consistent with the results achieved a year earlier, and
reflects a major capital investment in a $300 million, four-year initiative, NexGen, which will evolve the Company’s network
with next generation broadband technologies.
In 2001, MTS achieved major gains in its core markets, further positioning the Company to continue to deliver profitable growth.
In Manitoba, the Company remains the clear leader, with a portfolio that includes wireline, wireless, online, e-business and
directory services. Major highlights in MTS’s baseline operations include:
➜ Exceptional growth in wireless services, with customers increasing by 22% over the previous year. The customer base pushed
through the 200,000 mark in 2001, representing a milestone in the evolution of wireless services. Wireless growth has been
a hallmark of MTS’s success and is expected to continue.
➜ In the rapidly growing market for high-speed Internet services, MTS increased its share to 37% from 30% at the beginning
of the year. This growth is attributable, in part, to excellent progress during the year deploying NexGen capabilities.
By year-end, the coverage of the Company’s new broadband infrastructure had been extended to more than 76% of
residential customers in the province, including 95% in Winnipeg and Brandon.
➜ The Qunara business unit led MTS’s growth thrust into e-business markets inside and beyond Manitoba. Qunara’s
performance exceeded plan by delivering $25.5 million in revenues, while also completing the acquisition and
integration of The EXOCOM Group Inc. (“EXOCOM”), a provider of e-business products and services. Qunara’s strong
revenue performance reflects both the acquisition of EXOCOM and the success achieved in aggressively growing the
revenue base following the acquisition. On a pro forma basis, e-business revenues increased by 35% in 2001.
➜ In more traditional wireline markets such as long distance and local services, MTS maintained its undisputed status as the
market leader, with 80% share in long distance and 98% in local. Directory services provided yet another solid year of
results by growing revenues to $32 million.
Outside Manitoba, through Bell Intrigna, MTS continued to move forward confidently in the growth markets of Western Canada.
By year-end, Bell Intrigna had doubled its addressable market share to 10%, while delivering revenues of $182.2 million –
more than triple the level achieved in 2000. EBITDA at Bell Intrigna was ($58.2) million. This was lower than originally anticipated
and is attributable to slower migration of resale traffic onto the Bell Intrigna network. Decisive action was taken beginning
in September 2001 to accelerate Bell Intrigna’s path to profitability.
management’s discussion & analysis
MANAGEMENT’S DISCUSSION & ANALYSIS
1 Baseline results exclude the impact from Bell Intrigna.2 Earnings before interest, taxes, depreciation, amortization and other expense (income).
PAGE 24 • MANITOBA TELECOM SERVICES INC. AR 2001
2001 also saw Bell Intrigna continue with the roll-out of its regional network capabilities. Customer acquisition continued at a
rapid pace. By year-end, 1,474 business customers had chosen Bell Intrigna to meet their telecommunications needs. Long-term
agreements with the Government of Alberta (“GoA”) were also completed in 2001. In accordance with these agreements, Bell
Intrigna began construction on the GoA’s SUPERNET project in the fourth quarter–a three-year, $300 million broadband network
that will extend broadband capabilities extensively throughout Alberta. Bell Intrigna has prime responsibility to build, operate and
maintain the SUPERNET. In addition, a significant portion of the GoA’s telecommunications services business is being transferred to
Bell Intrigna – valued at a guaranteed minimum of $169 million in revenues over 10 years. Of that amount, $23.4 million in
revenues were reported in 2001. The relationship with the GoA firmly anchors Bell Intrigna as a significant market player in
Western Canada, providing a boost to marketing activities aimed at generating more public and private sector customers.
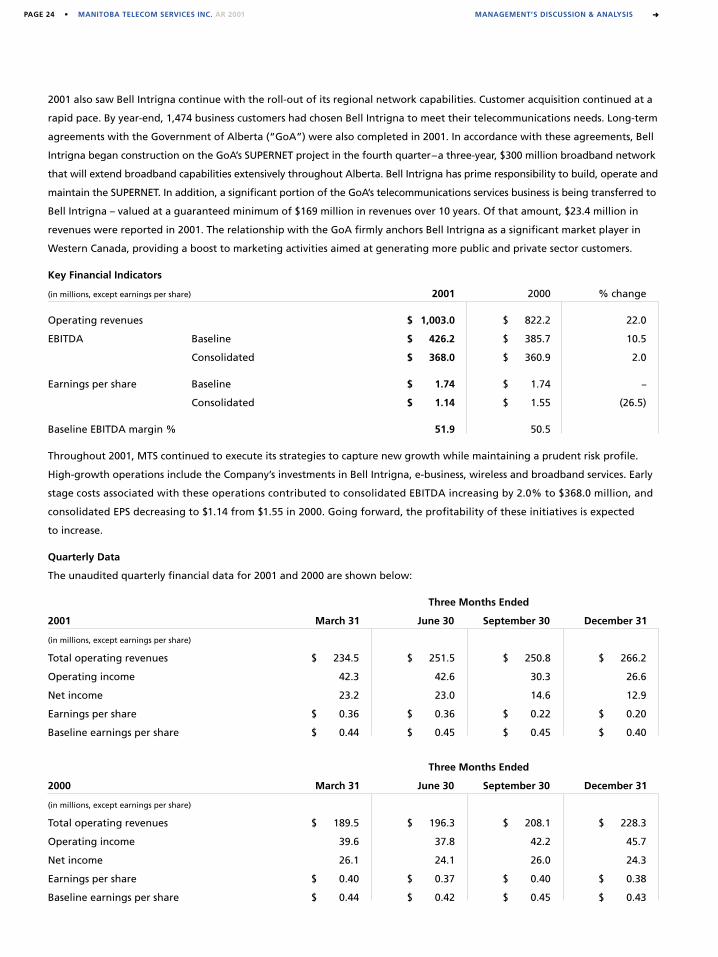
Key Financial Indicators
(in millions, except earnings per share) 2001 2000 % change
Operating revenues $ 1,003.0 $ 822.2 22.0
EBITDA Baseline $ 426.2 $ 385.7 10.5
Consolidated $ 368.0 $ 360.9 2.0
Earnings per share Baseline $ 1.74 $ 1.74 –
Consolidated $ 1.14 $ 1.55 (26.5)
Baseline EBITDA margin % 51.9 50.5
Throughout 2001, MTS continued to execute its strategies to capture new growth while maintaining a prudent risk profile.
High-growth operations include the Company’s investments in Bell Intrigna, e-business, wireless and broadband services. Early
stage costs associated with these operations contributed to consolidated EBITDA increasing by 2.0% to $368.0 million, and
consolidated EPS decreasing to $1.14 from $1.55 in 2000. Going forward, the profitability of these initiatives is expected
to increase.
Quarterly Data
The unaudited quarterly financial data for 2001 and 2000 are shown below:
Three Months Ended
2001 March 31 June 30 September 30 December 31
(in millions, except earnings per share)
Total operating revenues $ 234.5 $ 251.5 $ 250.8 $ 266.2
Operating income 42.3 42.6 30.3 26.6
Net income 23.2 23.0 14.6 12.9
Earnings per share $ 0.36 $ 0.36 $ 0.22 $ 0.20
Baseline earnings per share $ 0.44 $ 0.45 $ 0.45 $ 0.40
Three Months Ended
2000 March 31 June 30 September 30 December 31
(in millions, except earnings per share)
Total operating revenues $ 189.5 $ 196.3 $ 208.1 $ 228.3
Operating income 39.6 37.8 42.2 45.7
Net income 26.1 24.1 26.0 24.3
Earnings per share $ 0.40 $ 0.37 $ 0.40 $ 0.38
Baseline earnings per share $ 0.44 $ 0.42 $ 0.45 $ 0.43
MANAGEMENT’S DISCUSSION & ANALYSIS ➜
MANITOBA TELECOM SERVICES INC. AR 2001 • PAGE 25
RESULTS OF OPERATIONS
Operating Revenues
Consolidated operating revenues increased 22.0% to $1.003 billion in 2001. This exceptional performance is attributable to
strong increases in the Company’s high-growth operations and substantial improvement in its traditional operations. Revenues
from high-growth operations grew to $355.1 million, representing an increase of 88.7% over 2000. Revenues from traditional
operations increased by 2.8% to $616.0 million.
Traditional Operations
(in millions) 2001 2000 % change
Local services $ 382.1 $ 360.0 6.1
Long distance services 201.9 208.2 (3.0)
Directory 32.0 30.9 3.6
$ 616.0 $ 599.1 2.8
Network access lines 685,314 698,585 (1.9)
Long distance minutes (000’s) 1,236,813 1,199,015 3.2
Local services revenues grew by $22.1 million or 6.1% over 2000. This improvement is due mainly to residential rate increases
awarded by the Canadian Radio-television and Telecommunications Commission (the “CRTC”), combined with growth in
revenues from enhanced local services. These increases were partially offset by a marginal decrease in network access lines,
together with pricing adjustments to support MTS’s leading competitive position in the local business services market.
Residential access lines were marginally lower due to customers shifting some of their wireline requirements to MTS’s newer
technology offerings. This resulted in the displacement of second lines by high-speed Internet and wireless services. Basic
local residential rates increased by $3.00 per month effective August 1, 2000, and by $1.85 per month effective April 1, 2001.
Both rate increases were awarded by the CRTC to contribute to the funding of MTS’s higher income tax expense in 2001.
Effective May 14, 2001, the CRTC approved an average residential rate increase of $0.80 per month as part of the exogenous
factor under price cap regulation relating to the change in the CRTC’s contribution mechanism. In addition to the
incremental revenues associated with monthly residential rate increases, revenues from enhanced services, such as Call
Waiting, Call Display, and Three Way Calling, also grew. These improvements were due to higher penetration levels and prices
charged for these services.
Long distance revenues declined marginally by 3.0% to $201.9 million. This decrease is primarily the result of a change in the
contribution mechanism as set out in the CRTC’s Decision 2000-745, which became effective January 1, 2001. This decision
eliminated the contribution component from settlement revenues received by MTS for delivering long distance service in
Manitoba for other carriers. The resulting decrease in long distance revenues was more than offset by lower costs incurred by
MTS for delivering these services outside the Company’s operating territory. Also contributing to the decrease in revenues for
the year were targeted pricing adjustments, net of growth in long distance minutes. These pricing actions support MTS’s
continuing market leadership position. At year-end, MTS’s share of the long distance market in Manitoba was an estimated
80% – a level maintained by the Company throughout the year.
Directory revenues increased by 3.6% to $32 million, compared with $30.9 million in 2000. This was achieved through increased
sales efforts, as well as the availability of enhanced product features.
MANAGEMENT’S DISCUSSION & ANALYSIS
PAGE 26 • MANITOBA TELECOM SERVICES INC. AR 2001 MANAGEMENT’S DISCUSSION & ANALYSIS ➜
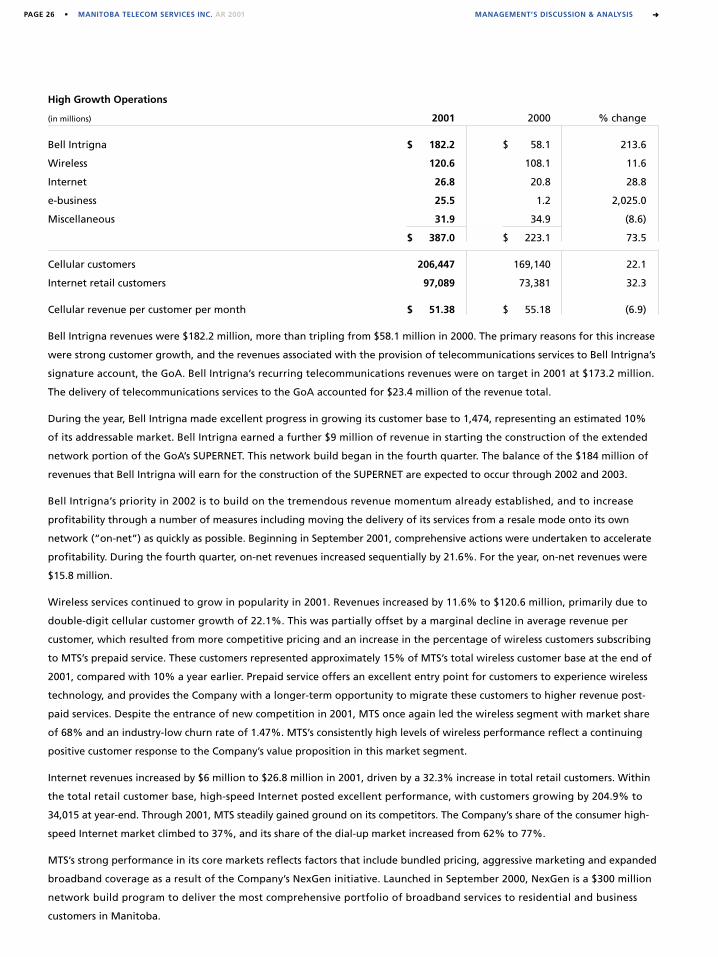
High Growth Operations
(in millions) 2001 2000 % change
Bell Intrigna $ 182.2 $ 58.1 213.6
Wireless 120.6 108.1 11.6
Internet 26.8 20.8 28.8
e-business 25.5 1.2 2,025.0
Miscellaneous 31.9 34.9 (8.6)
$ 387.0 $ 223.1 73.5
Cellular customers 206,447 169,140 22.1
Internet retail customers 97,089 73,381 32.3
Cellular revenue per customer per month $ 51.38 $ 55.18 (6.9)
Bell Intrigna revenues were $182.2 million, more than tripling from $58.1 million in 2000. The primary reasons for this increase
were strong customer growth, and the revenues associated with the provision of telecommunications services to Bell Intrigna’s
signature account, the GoA. Bell Intrigna’s recurring telecommunications revenues were on target in 2001 at $173.2 million.
The delivery of telecommunications services to the GoA accounted for $23.4 million of the revenue total.
During the year, Bell Intrigna made excellent progress in growing its customer base to 1,474, representing an estimated 10%
of its addressable market. Bell Intrigna earned a further $9 million of revenue in starting the construction of the extended
network portion of the GoA’s SUPERNET. This network build began in the fourth quarter. The balance of the $184 million of
revenues that Bell Intrigna will earn for the construction of the SUPERNET are expected to occur through 2002 and 2003.
Bell Intrigna’s priority in 2002 is to build on the tremendous revenue momentum already established, and to increase
profitability through a number of measures including moving the delivery of its services from a resale mode onto its own
network (“on-net”) as quickly as possible. Beginning in September 2001, comprehensive actions were undertaken to accelerate
profitability. During the fourth quarter, on-net revenues increased sequentially by 21.6%. For the year, on-net revenues were
$15.8 million.
Wireless services continued to grow in popularity in 2001. Revenues increased by 11.6% to $120.6 million, primarily due to
double-digit cellular customer growth of 22.1%. This was partially offset by a marginal decline in average revenue per
customer, which resulted from more competitive pricing and an increase in the percentage of wireless customers subscribing
to MTS’s prepaid service. These customers represented approximately 15% of MTS’s total wireless customer base at the end of
2001, compared with 10% a year earlier. Prepaid service offers an excellent entry point for customers to experience wireless
technology, and provides the Company with a longer-term opportunity to migrate these customers to higher revenue post-
paid services. Despite the entrance of new competition in 2001, MTS once again led the wireless segment with market share
of 68% and an industry-low churn rate of 1.47%. MTS’s consistently high levels of wireless performance reflect a continuing
positive customer response to the Company’s value proposition in this market segment.
Internet revenues increased by $6 million to $26.8 million in 2001, driven by a 32.3% increase in total retail customers. Within
the total retail customer base, high-speed Internet posted excellent performance, with customers growing by 204.9% to
34,015 at year-end. Through 2001, MTS steadily gained ground on its competitors. The Company’s share of the consumer high-
speed Internet market climbed to 37%, and its share of the dial-up market increased from 62% to 77%.
MTS’s strong performance in its core markets reflects factors that include bundled pricing, aggressive marketing and expanded
broadband coverage as a result of the Company’s NexGen initiative. Launched in September 2000, NexGen is a $300 million
network build program to deliver the most comprehensive portfolio of broadband services to residential and business
customers in Manitoba.
MANITOBA TELECOM SERVICES INC. AR 2001 • PAGE 27MANAGEMENT’S DISCUSSION & ANALYSIS
In 2001, MTS aggressively deployed NexGen infrastructure, increasing high-speed coverage to 95% of residential customers in
Winnipeg and Brandon, and to 34 tier two communities throughout the province. This represents 76% of Manitobans, which
is ahead of the Company’s 70% year-end target. In the business market, NexGen technology was deployed to 194 office
buildings, 28 industrial parks and 14 hotels. This new infrastructure positions MTS to take advantage of rapidly growing
demand for high-speed Internet service today, as well as for the broadband-enabled services of the future.
In addition to the organic growth MTS achieved in its markets in 2001, the Company also added to its customer base through
the acquisition of three Manitoba-based Internet service providers – Portage Internet Connection, Pangea.ca Inc. and Web4
Internet Services, together representing approximately 7,700 customers. These acquisitions provide an excellent opportunity
to cost-effectively migrate customers from dial-up to high-speed Internet service.
Revenues from e-business operations were $25.5 million in 2001 compared with $1.2 million in 2000. This significant increase
is primarily attributable to the acquisition of EXOCOM in January 2001 and its subsequent integration into Qunara operations
during the year. Following this acquisition, Qunara went on to aggressively grow the e-business operations, delivering a 35%
year over year increase in revenues on a pro forma basis. EXOCOM strategically enhances Qunara’s ability to provide new
products and services, increase its client base and expand into new markets. MTS’s e-business unit has a high quality, well-
diversified customer base that spans several industries as well as federal and provincial government departments. A major
e-business win in 2001 occurred when the Canadian Department of National Defence awarded Qunara a $5.2 million contract
for services related to IT security and privacy requirements.
Miscellaneous revenues, including telecommunications-related services and home security, decreased by $3 million in 2001.
This lower relative level of revenues is attributable to the Company’s completion of certain service contracts in the United
States, offset by growth in home security services. During the year, MTS grew its home security business both organically and
through the acquisition of Creative Home Systems Inc. and Knight Security and Communications Inc.
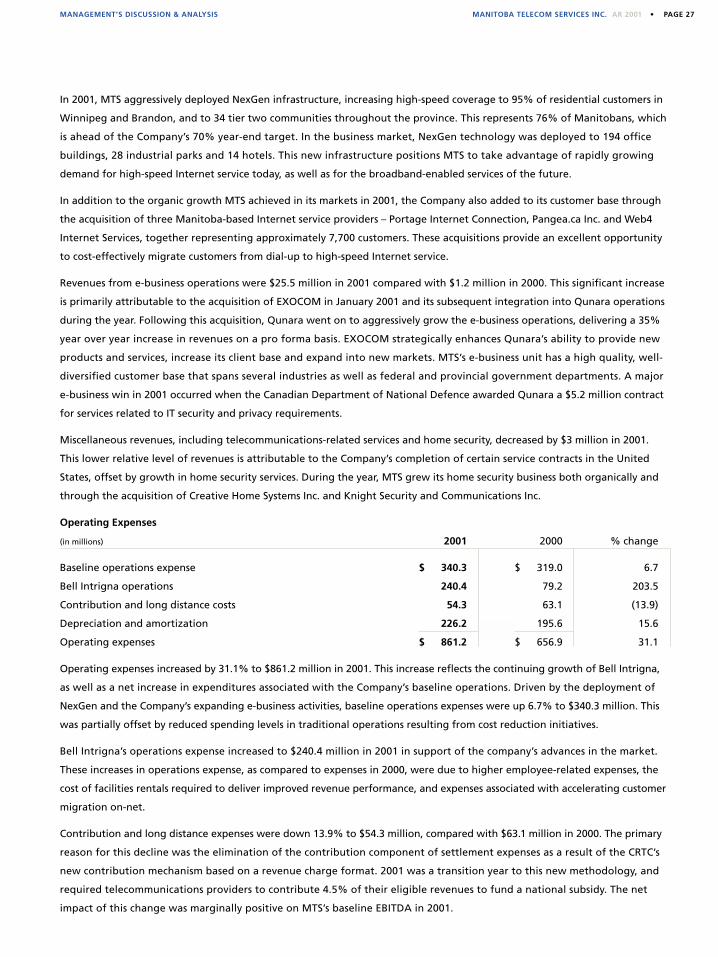
Operating Expenses
(in millions) 2001 2000 % change
Baseline operations expense $ 340.3 $ 319.0 6.7
Bell Intrigna operations 240.4 79.2 203.5
Contribution and long distance costs 54.3 63.1 (13.9)
Depreciation and amortization 226.2 195.6 15.6
Operating expenses $ 861.2 $ 656.9 31.1
Operating expenses increased by 31.1% to $861.2 million in 2001. This increase reflects the continuing growth of Bell Intrigna,
as well as a net increase in expenditures associated with the Company’s baseline operations. Driven by the deployment of
NexGen and the Company’s expanding e-business activities, baseline operations expenses were up 6.7% to $340.3 million. This
was partially offset by reduced spending levels in traditional operations resulting from cost reduction initiatives.
Bell Intrigna’s operations expense increased to $240.4 million in 2001 in support of the company’s advances in the market.
These increases in operations expense, as compared to expenses in 2000, were due to higher employee-related expenses, the
cost of facilities rentals required to deliver improved revenue performance, and expenses associated with accelerating customer
migration on-net.
Contribution and long distance expenses were down 13.9% to $54.3 million, compared with $63.1 million in 2000. The primary
reason for this decline was the elimination of the contribution component of settlement expenses as a result of the CRTC’s
new contribution mechanism based on a revenue charge format. 2001 was a transition year to this new methodology, and
required telecommunications providers to contribute 4.5% of their eligible revenues to fund a national subsidy. The net
impact of this change was marginally positive on MTS’s baseline EBITDA in 2001.
PAGE 28 • MANITOBA TELECOM SERVICES INC. AR 2001 MANAGEMENT’S DISCUSSION & ANALYSIS ➜
Non-cash expenses of depreciation and amortization increased, as planned, by 15.6% to $226.2 million, primarily due to the
rapid expansion in Bell Intrigna’s network investment and the ramp-up of its back office customer support systems. As well,
new telecommunications plant in MTS’s baseline operations associated with NexGen also contributed to higher levels of
depreciation expense.
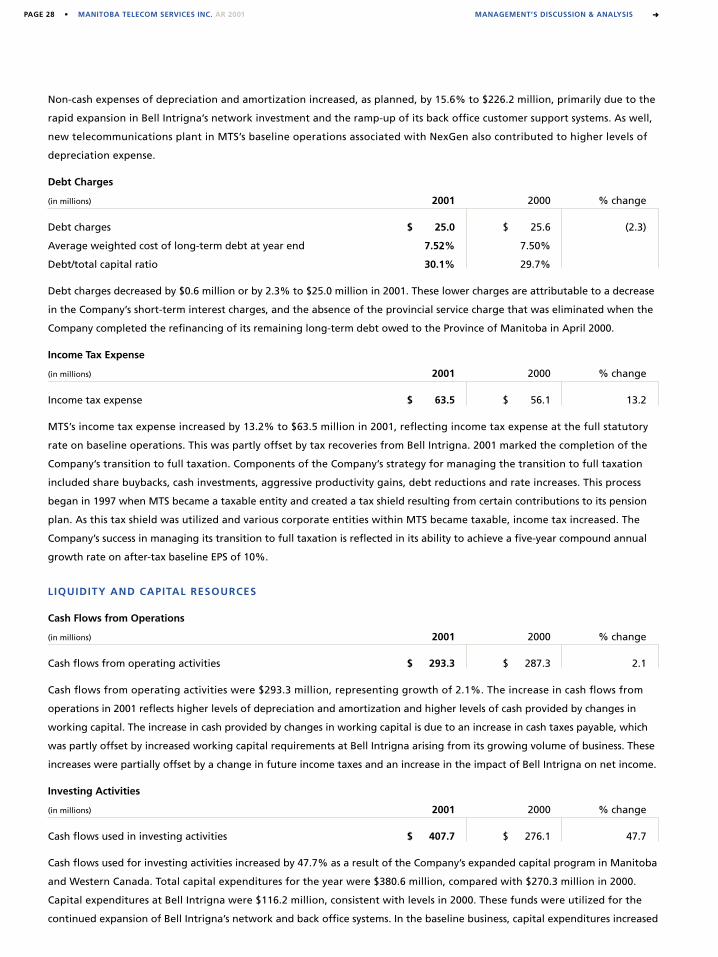
Debt Charges
(in millions) 2001 2000 % change
Debt charges $ 25.0 $ 25.6 (2.3)
Average weighted cost of long-term debt at year end 7.52% 7.50%
Debt/total capital ratio 30.1% 29.7%
Debt charges decreased by $0.6 million or by 2.3% to $25.0 million in 2001. These lower charges are attributable to a decrease
in the Company’s short-term interest charges, and the absence of the provincial service charge that was eliminated when the
Company completed the refinancing of its remaining long-term debt owed to the Province of Manitoba in April 2000.
Income Tax Expense
(in millions) 2001 2000 % change
Income tax expense $ 63.5 $ 56.1 13.2
MTS’s income tax expense increased by 13.2% to $63.5 million in 2001, reflecting income tax expense at the full statutory
rate on baseline operations. This was partly offset by tax recoveries from Bell Intrigna. 2001 marked the completion of the
Company’s transition to full taxation. Components of the Company’s strategy for managing the transition to full taxation
included share buybacks, cash investments, aggressive productivity gains, debt reductions and rate increases. This process
began in 1997 when MTS became a taxable entity and created a tax shield resulting from certain contributions to its pension
plan. As this tax shield was utilized and various corporate entities within MTS became taxable, income tax increased. The
Company’s success in managing its transition to full taxation is reflected in its ability to achieve a five-year compound annual
growth rate on after-tax baseline EPS of 10%.
LIQUIDITY AND CAPITAL RESOURCES
Cash Flows from Operations
(in millions) 2001 2000 % change
Cash flows from operating activities $ 293.3 $ 287.3 2.1
Cash flows from operating activities were $293.3 million, representing growth of 2.1%. The increase in cash flows from
operations in 2001 reflects higher levels of depreciation and amortization and higher levels of cash provided by changes in
working capital. The increase in cash provided by changes in working capital is due to an increase in cash taxes payable, which
was partly offset by increased working capital requirements at Bell Intrigna arising from its growing volume of business. These
increases were partially offset by a change in future income taxes and an increase in the impact of Bell Intrigna on net income.
Investing Activities
(in millions) 2001 2000 % change
Cash flows used in investing activities $ 407.7 $ 276.1 47.7
Cash flows used for investing activities increased by 47.7% as a result of the Company’s expanded capital program in Manitoba
and Western Canada. Total capital expenditures for the year were $380.6 million, compared with $270.3 million in 2000.
Capital expenditures at Bell Intrigna were $116.2 million, consistent with levels in 2000. These funds were utilized for the
continued expansion of Bell Intrigna’s network and back office systems. In the baseline business, capital expenditures increased
MANITOBA TELECOM SERVICES INC. AR 2001 • PAGE 29MANAGEMENT’S DISCUSSION & ANALYSIS
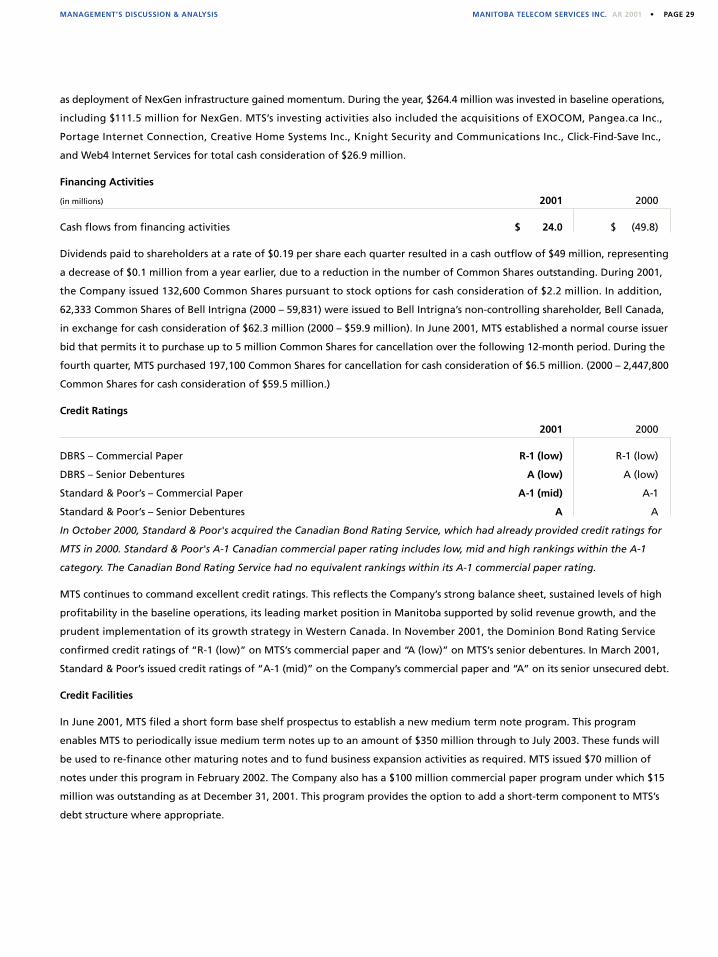
as deployment of NexGen infrastructure gained momentum. During the year, $264.4 million was invested in baseline operations,
including $111.5 million for NexGen. MTS’s investing activities also included the acquisitions of EXOCOM, Pangea.ca Inc.,
Portage Internet Connection, Creative Home Systems Inc., Knight Security and Communications Inc., Click-Find-Save Inc.,
and Web4 Internet Services for total cash consideration of $26.9 million.
Financing Activities
(in millions) 2001 2000
Cash flows from financing activities $ 24.0 $ (49.8)
Dividends paid to shareholders at a rate of $0.19 per share each quarter resulted in a cash outflow of $49 million, representing
a decrease of $0.1 million from a year earlier, due to a reduction in the number of Common Shares outstanding. During 2001,
the Company issued 132,600 Common Shares pursuant to stock options for cash consideration of $2.2 million. In addition,
62,333 Common Shares of Bell Intrigna (2000 – 59,831) were issued to Bell Intrigna’s non-controlling shareholder, Bell Canada,
in exchange for cash consideration of $62.3 million (2000 – $59.9 million). In June 2001, MTS established a normal course issuer
bid that permits it to purchase up to 5 million Common Shares for cancellation over the following 12-month period. During the
fourth quarter, MTS purchased 197,100 Common Shares for cancellation for cash consideration of $6.5 million. (2000 – 2,447,800
Common Shares for cash consideration of $59.5 million.)
Credit Ratings
2001 2000
DBRS – Commercial Paper R-1 (low) R-1 (low)
DBRS – Senior Debentures A (low) A (low)
Standard & Poor’s – Commercial Paper A-1 (mid) A-1
Standard & Poor’s – Senior Debentures A A
In October 2000, Standard & Poor's acquired the Canadian Bond Rating Service, which had already provided credit ratings for
MTS in 2000. Standard & Poor's A-1 Canadian commercial paper rating includes low, mid and high rankings within the A-1
category. The Canadian Bond Rating Service had no equivalent rankings within its A-1 commercial paper rating.
MTS continues to command excellent credit ratings. This reflects the Company’s strong balance sheet, sustained levels of high
profitability in the baseline operations, its leading market position in Manitoba supported by solid revenue growth, and the
prudent implementation of its growth strategy in Western Canada. In November 2001, the Dominion Bond Rating Service
confirmed credit ratings of “R-1 (low)” on MTS’s commercial paper and “A (low)” on MTS’s senior debentures. In March 2001,
Standard & Poor’s issued credit ratings of “A-1 (mid)” on the Company’s commercial paper and “A” on its senior unsecured debt.
Credit Facilities
In June 2001, MTS filed a short form base shelf prospectus to establish a new medium term note program. This program
enables MTS to periodically issue medium term notes up to an amount of $350 million through to July 2003. These funds will
be used to re-finance other maturing notes and to fund business expansion activities as required. MTS issued $70 million of
notes under this program in February 2002. The Company also has a $100 million commercial paper program under which $15
million was outstanding as at December 31, 2001. This program provides the option to add a short-term component to MTS’s
debt structure where appropriate.
PAGE 30 • MANITOBA TELECOM SERVICES INC. AR 2001 MANAGEMENT’S DISCUSSION & ANALYSIS ➜
OUTLOOK
MTS anticipates strong financial performance in 2002 to support its objective of achieving sustainable, long-term profitable
growth. MTS intends to continue to prudently invest in growth opportunities within and adjacent to its core markets. As part
of that effort, there will be continued emphasis on strengthening the business in Manitoba, which will strengthen the Company’s
status as the undisputed market leader and franchise brand for full service communications.
The outlook in 2002 for MTS is positive. The baseline business is expected to show revenue growth of 6% to 8%, with both
EBITDA and EPS anticipated to grow 6% to 8%. At Bell Intrigna, the priority is to accelerate the path to profitability while
maintaining strong growth in revenues. Management believes its financial targets rank well in the Canadian industry, and
demonstrate a strong baseline business with excellent upside potential through its growth strategy. The Company is focused
on maintaining an attractive balance of risk and reward and is confident about delivering shareholder value in 2002.
In the baseline business, MTS is well-positioned to continue delivering high levels of profitability in its traditional operations –
local, long distance and directory services – while taking advantage of higher-growth opportunities in wireless, e-business and
broadband markets. Over the years, MTS has consistently increased revenues and margins in traditional operations, while
maintaining, at year-end 2001, an estimated 80% of the long distance market, 98% of the local market, and a reputation as the
lowest cost telecommunications provider in Canada.
2002 presents opportunities to maintain a strong performance in the Company’s traditional operations. Revenues from local
services are anticipated to increase in 2002 as a result of a full year’s impact from rate increases that were implemented during
2001, and continuing growth in enhanced services due to increasing penetration levels and new additions to this portfolio.
These increased revenues will be partially offset by lower contribution revenues, limited competitive losses that are forecast
on the business side, and a decline in residential network access lines as customers move to high-speed Internet and wireless
services. The CRTC currently is conducting a review of price cap regulation with a decision expected in the second quarter
of 2002. In addition to setting the parameters for the next price cap period, the CRTC also is expected to address subsidy
requirements associated with high-cost service areas. The outcome of the CRTC’s review is not anticipated to materially impact
the Company’s results.
During 2001, the competitive pressures on long distance pricing stabilized, providing some new, limited revenue opportunities.
MTS introduced a toll network access charge of $1.25 on monthly residential long distance rate plans in the first quarter of
2002. These price changes are expected to mitigate reduced revenues associated with competitive losses in this segment. In the
year ahead, directory services are expected to deliver small improvements derived from modest increases in advertising rates
and the roll-out of product enhancements. Taken together, revenues from traditional services are expected to increase in 2002.
Wireless, high-speed Internet and e-business services are forecast to continue to deliver excellent growth. In 2001, the wireless
customer base increased by 22.1%. Revenue growth was impressive at 11.6%. These positive growth trends are expected to
continue. MTS has invested in wireless infrastructure to capitalize on ongoing growth in this market, and to meet emerging
demand for new high-value products and services. Wireless data services, such as point-of-sale applications, e-mail and mobile
Web access, have very good potential longer term. Network investments are planned for 2002, through further digital cellular
expansion under the Company’s multi-year $50 million program and upgrades that include the implementation of 1xRTT
technology. 1xRTT is a standard for digital cellular PCS services that will enable new capabilities and improvements in voice
efficiencies and allow for data transmission speeds of up to 144 kilobits per second. The Company continues to evaluate wireless
growth opportunities outside Manitoba with its partner, Bell Canada.
A high-growth area of strategic value to MTS’s baseline business is the Internet and other broadband-enabled opportunities
that are supported by the Company’s four-year, $300 million investment in next generation infrastructure. By year-end, the
Company captured 37% of the consumer high-speed Internet market in Manitoba, up from 30% a year earlier. For 2002, the
objective is to continue this growth trend and to migrate dial-up customers to higher-speed Internet solutions. MTS anticipates
MANITOBA TELECOM SERVICES INC. AR 2001 • PAGE 31
increasing its high-speed consumer customer base by more than 30,000 in 2002. A further area of aggressive marketing focus
in 2002 is business Internet services. Two new offerings, Professional and Network, were introduced in the latter part of 2001.
Both services offer peak download speeds of up to 3 megabits per second and upload speeds of up to 320 kilobits per second.
As part of its NexGen initiative, activities will continue throughout the year on the development of a broadcast service
offering for residential customers. Technical trials were undertaken in 2001 with market trials continuing in 2002. The
Company applied to the CRTC for a broadcast licence, and a decision on this application is expected in the second quarter of
2002. The commercial launch of the offering is scheduled for 2003.
As demand increases for high-speed broadband services, MTS will leverage its next generation network as a source of growth,
and also as a competitive differentiator for maintaining high levels of “customer ownership” in Manitoba. Ownership of the
broadband customer is expected to be critical to future bundling strategies for services in residential and business markets.
E-business is another high-growth opportunity in the baseline business. MTS has been active in this segment since 1997 and,
in 2002, expects strong performance from Qunara. Following the acquisition of EXOCOM in 2001, Qunara is positioned as an
end-to-end e-business solutions provider to businesses in Canada and the United States. Qunara is specifically focused on
growing its position in the Canadian market, expanding delivery capability within its existing client base, acquiring new
strategic accounts and leveraging its technology partnerships. Qunara also will be selectively entering key vertical markets in the
United States where it can offer unique services. Qunara revenues were $25.5 million in 2001, and are expected to demonstrate
revenue growth in the 30% range in 2002. Longer-term objectives are for e-business revenues to reach $100 million by 2005
through a combination of organic growth and acquisitions.
MTS’s baseline operations establish the Company as one of the lowest cost providers in Canada. Going forward, the Company
will build on that position through continued strong cost management in traditional operations, while prudently funding
higher growth areas of the business. Management believes this approach is appropriate for maintaining the Company’s
competitive position and delivering ongoing high levels of profitability. Overall, operating costs in the baseline business will
rise slightly in 2002, to support wireless, Internet and e-business growth. These increases are expected to be partially offset by
strong cost management efforts in traditional operations through re-engineering processes, re-negotiating contracts and
leveraging the Company’s alliance with Bell. In addition, the impact of the changes to the CRTC’s contribution mechanism are
anticipated to result in a decrease in MTS’s contribution expense. This decrease will more than offset the associated decrease
in the Company’s contribution revenues and provide a net positive EBITDA benefit in 2002.
In Alberta and British Columbia, Bell Intrigna’s objectives for 2002 are to advance its market position, while aggressively
enhancing profitability. Bell Intrigna will move forward on strong revenue momentum established in 2001, significant
addressable market penetration of 10%, and a strategic partnership with the GoA. Key areas of focus for Bell Intrigna in
support of enhancing profitability include accelerating the migration of services onto the Bell Intrigna network, targeting new
customers who can immediately be served by the Bell Intrigna network instead of through a resale arrangement, and
optimizing its leased facilities.
MTS, at year-end, was in business development discussions with Bell Canada with respect to building on the successes that they
have achieved together in Western Canada through the rapid growth and evolution of Bell Intrigna. MTS’s objective is to
conclude these discussions with an arrangement to improve the Company’s growth prospects in Western Canada.
Liquidity and Capital Resources
The Company’s planned baseline capital expenditures for 2002 are $228 million. Capital is primarily targeted at the higher
growth operations, including the NexGen roll-out, which represents a $76 million capital expenditure. Further capital
requirements for Bell Intrigna also are anticipated. In the first quarter of 2002, Bell Intrigna’s capital forecast is $25 million.
The Company anticipates confirming Bell Intrigna’s annual forecast following the conclusion of its business development
MANAGEMENT’S DISCUSSION & ANALYSIS
PAGE 32 • MANITOBA TELECOM SERVICES INC. AR 2001
discussions with Bell Canada. In accordance with the agreements entered into by Bell Intrigna respecting the GoA’s SUPERNET,
Bell Intrigna is committed to spend $59 million to build a portion of the base network over the term of the agreements.
The Company anticipates that its internally generated cash, together with cash reserves and access to its existing commercial
paper and medium term note programs, will be sufficient to fund operating and capital expenditures and the payment of
dividends in 2002. As such, it does not anticipate any change to its credit ratings. MTS maintains an industry-leading low debt-
to-total capital ratio, which was 30.1% at year-end 2001. Going forward, the Company has adequate capacity to borrow funds
to support its operations and to pursue new strategic opportunities aimed at delivering growth profitably, while continuing to
maintain significant balance sheet strength. MTS expects to generate positive free cash flow in 2003.
REGULATORY ENVIRONMENT
The telecommunications industry in which the Company’s major operating subsidiary, MTS Communications Inc.
(“MTS Communications”), operates is governed by the CRTC, which regulates telecommunications common carriers under
the authority of the Telecommunications Act (Canada). The CRTC has authority over certain aspects of the operations of
telecommunications common carriers, including rates, service packages, quality of service, costing and accounting practices.
The CRTC, however, has the discretion to forbear from regulating certain products and services where it considers the market
to be sufficiently competitive to protect the interests of consumers.
The CRTC regulates MTS Communications as a telecommunications carrier, and previously exercised regulatory authority over
MTS Mobility Inc. until its amalgamation with MTS Communications in January 2000 as part of the integration of the wireline
and wireless businesses. The CRTC does not require MTS Communications to file tariffs for its wireless services, but retains the
authority to regulate the terms and conditions of these services. As Bell Intrigna operates as a competitive local exchange
carrier in Alberta and British Columbia, only its arrangements with other carriers are regulated by the CRTC. MTS Advanced
and Qunara are not regulated by the CRTC.
For regulatory purposes, MTS Communications is divided into two segments: utility and competitive. The utility segment
includes most local telephone services. Competitive segment services include long distance, wireless, Internet, data and
terminal service offerings. MTS Communications is required to file tariffs for its local services and to demonstrate that its
services cover their costs and underlying charges. Long distance, wireless, Internet access, terminal services and most data
services provided by MTS Communications are forborne, meaning that the rates for these services do not require CRTC
approval. MTS Communications, therefore, operates on an equal footing with its competitors in these forborne competitive
segment services. The CRTC maintains the authority to impose general conditions on the provision of long distance, wireless
and Internet access services to prevent unjust discrimination and the conferring of undue preference in relation to these services.
MTS Communications' utility segment has been regulated under a price cap regulatory mechanism since January 1998. Under
the price cap regime, utility services are grouped into a number of service baskets. Initial prices for each basket are capped,
after which annual price changes are adjusted by an inflation factor and a pre-determined productivity offset of 4.5%. Price
cap regulation mandates price reductions only for services that are provided at prices above their costs, such as business rates
in Winnipeg. Prices for services that are currently below cost, such as certain residential services, are permitted to rise. Price
cap regulation applies only to local utility services, and is intended as an interim form of regulation as the market in local
telephone services becomes more competitive. The CRTC conducted a review of the price cap regime during 2001 and is
expected to issue a decision in the second quarter of 2002 that will adjust the price cap rules.
Since January 1998, the market in local telephone services has been open to competition. In a decision issued in May 1997, the
CRTC required the telephone companies to unbundle certain essential elements of their local networks that must be made
available to competitors at tariffed rates. This permits new entrants to provide competitive local service without completely
replicating the networks of the existing telephone companies. Competitors also are permitted to enter the local market by
MANAGEMENT’S DISCUSSION & ANALYSIS ➜
MANITOBA TELECOM SERVICES INC. AR 2001 • PAGE 33
reselling the local services provided by MTS Communications. Local number portability has been available in Winnipeg since
December 31, 1998 to facilitate competition in local telephone services.
MTS Communications, as an incumbent telephone company, retains an obligation to provide service throughout its operating
territory. Regulatory proceedings are currently underway to determine the extent of subsidies required to support service in
areas where the revenues from local service cannot be expected to cover the cost of providing service. The size of the subsidy
needed to support below-cost service will be determined as part of the price-cap review proceeding conducted by the CRTC in
2001. In a decision issued in November, the CRTC determined that, beginning in the second quarter of 2001, local residential
service would be subsidized through a national subsidy fund to which all telecommunications service providers must contribute
a percentage of their telecommunications services revenues. The CRTC also determined that the subsidies to high-cost serving
areas, in future, would be determined based on the incremental, forward-looking costs of providing residential service in these
areas. These costs were developed and approved by the CRTC in 2001.
MTS made an application in September 2001 for a Class 1 Broadcast Distribution Undertaking licence to serve Region 2, which
consists of the Prairie provinces. MTS intends to offer broadcasting services to customers using digital subscriber line technology
to deliver media programming over telecommunications infrastructure. A decision on MTS’s application is expected in the
second quarter of 2002.
NEW ACCOUNTING PRONOUNCEMENTS
In accordance with new guidance provided by the Canadian Institute of Chartered Accountants (“CICA”) effective January 1, 2002,
MTS has adopted the accounting recommendations contained in the following CICA Handbook sections.
Section 3062, Goodwill and Other Intangible Assets
MTS fully implemented the recommendations contained in this section effective January 1, 2002. Accordingly, MTS has assigned
each of its unamortized goodwill balances to a reporting unit, and, commencing January 1, 2002, MTS will not recognize any
goodwill amortization. Rather, MTS will test goodwill for impairment upon transition, on an annual basis and when an event
or circumstance occurs that more likely than not reduces the fair value of a reporting unit below its carrying value. The new
CICA recommendations require disclosure of net income and earnings per share adjusted for amortization expense related to
goodwill that is no longer subject to amortization. Accordingly, in the notes to its 2002 interim and annual financial statements,
MTS will disclose 2001 adjusted net income and earnings per share for comparative purposes.
Section 3870, Stock-based Compensation and Other Stock-based Payments
MTS implemented the recommendations contained in this section effective January 1, 2002. Management has adopted the
intrinsic value method of accounting for stock options granted to employees on or after January 1, 2002. As such, the new
CICA recommendations require disclosure of the pro forma net income and earnings per share as if the fair value method were
used for accounting for stock options. Accordingly, in the notes to its 2002 interim and annual financial statements, MTS will
disclose the pro forma net income and earnings per share.
MANAGEMENT’S DISCUSSION & ANALYSIS
PAGE 34 • MANITOBA TELECOM SERVICES INC. AR 2001 FINANCIAL STATEMENTS ➜
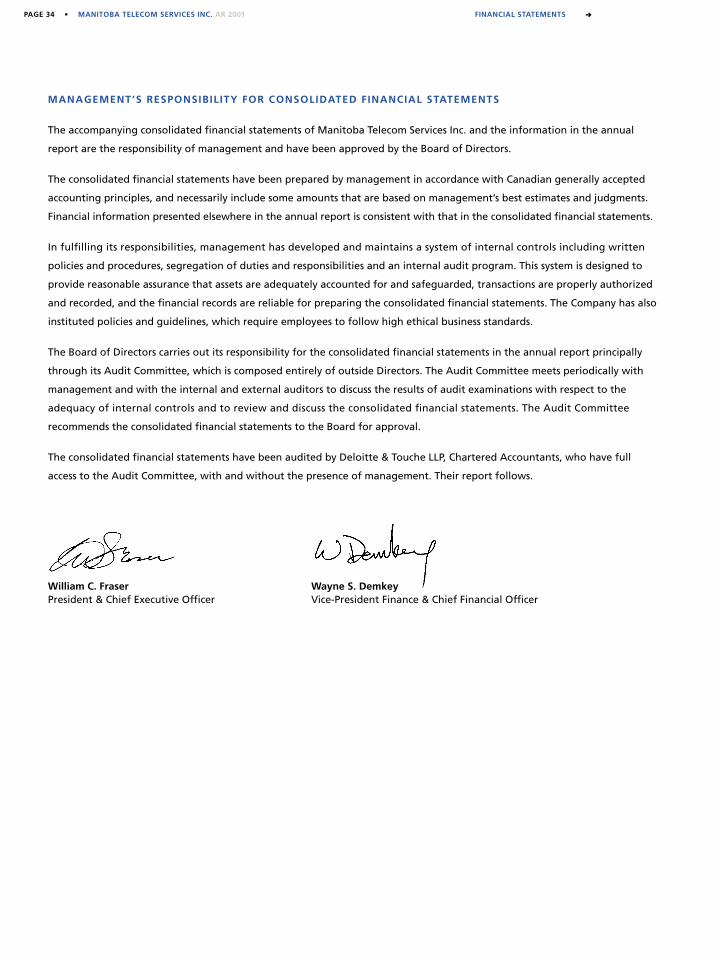
MANAGEMENT ’S RESPONSIBILITY FOR CONSOLIDATED FINANCIAL STATEMENTS
The accompanying consolidated financial statements of Manitoba Telecom Services Inc. and the information in the annual
report are the responsibility of management and have been approved by the Board of Directors.
The consolidated financial statements have been prepared by management in accordance with Canadian generally accepted
accounting principles, and necessarily include some amounts that are based on management’s best estimates and judgments.
Financial information presented elsewhere in the annual report is consistent with that in the consolidated financial statements.
In fulfilling its responsibilities, management has developed and maintains a system of internal controls including written
policies and procedures, segregation of duties and responsibilities and an internal audit program. This system is designed to
provide reasonable assurance that assets are adequately accounted for and safeguarded, transactions are properly authorized
and recorded, and the financial records are reliable for preparing the consolidated financial statements. The Company has also
instituted policies and guidelines, which require employees to follow high ethical business standards.
The Board of Directors carries out its responsibility for the consolidated financial statements in the annual report principally
through its Audit Committee, which is composed entirely of outside Directors. The Audit Committee meets periodically with
management and with the internal and external auditors to discuss the results of audit examinations with respect to the
adequacy of internal controls and to review and discuss the consolidated financial statements. The Audit Committee
recommends the consolidated financial statements to the Board for approval.
The consolidated financial statements have been audited by Deloitte & Touche LLP, Chartered Accountants, who have full
access to the Audit Committee, with and without the presence of management. Their report follows.
William C. Fraser Wayne S. DemkeyPresident & Chief Executive Officer Vice-President Finance & Chief Financial Officer
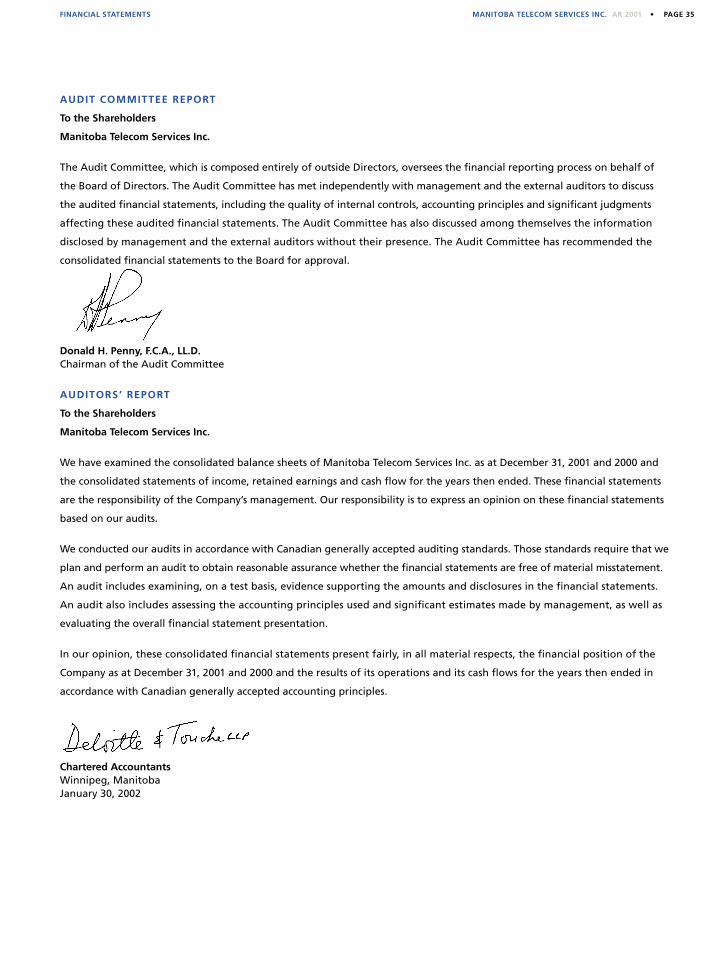
MANITOBA TELECOM SERVICES INC. AR 2001 • PAGE 35FINANCIAL STATEMENTS
AUDIT COMMITTEE REPORT
To the Shareholders
Manitoba Telecom Services Inc.
The Audit Committee, which is composed entirely of outside Directors, oversees the financial reporting process on behalf of
the Board of Directors. The Audit Committee has met independently with management and the external auditors to discuss
the audited financial statements, including the quality of internal controls, accounting principles and significant judgments
affecting these audited financial statements. The Audit Committee has also discussed among themselves the information
disclosed by management and the external auditors without their presence. The Audit Committee has recommended the
consolidated financial statements to the Board for approval.
Donald H. Penny, F.C.A., LL.D.Chairman of the Audit Committee
AUDITORS ’ REPORT
To the Shareholders
Manitoba Telecom Services Inc.
We have examined the consolidated balance sheets of Manitoba Telecom Services Inc. as at December 31, 2001 and 2000 and
the consolidated statements of income, retained earnings and cash flow for the years then ended. These financial statements
are the responsibility of the Company’s management. Our responsibility is to express an opinion on these financial statements
based on our audits.
We conducted our audits in accordance with Canadian generally accepted auditing standards. Those standards require that we
plan and perform an audit to obtain reasonable assurance whether the financial statements are free of material misstatement.
An audit includes examining, on a test basis, evidence supporting the amounts and disclosures in the financial statements.
An audit also includes assessing the accounting principles used and significant estimates made by management, as well as
evaluating the overall financial statement presentation.
In our opinion, these consolidated financial statements present fairly, in all material respects, the financial position of the
Company as at December 31, 2001 and 2000 and the results of its operations and its cash flows for the years then ended in
accordance with Canadian generally accepted accounting principles.
Chartered AccountantsWinnipeg, ManitobaJanuary 30, 2002
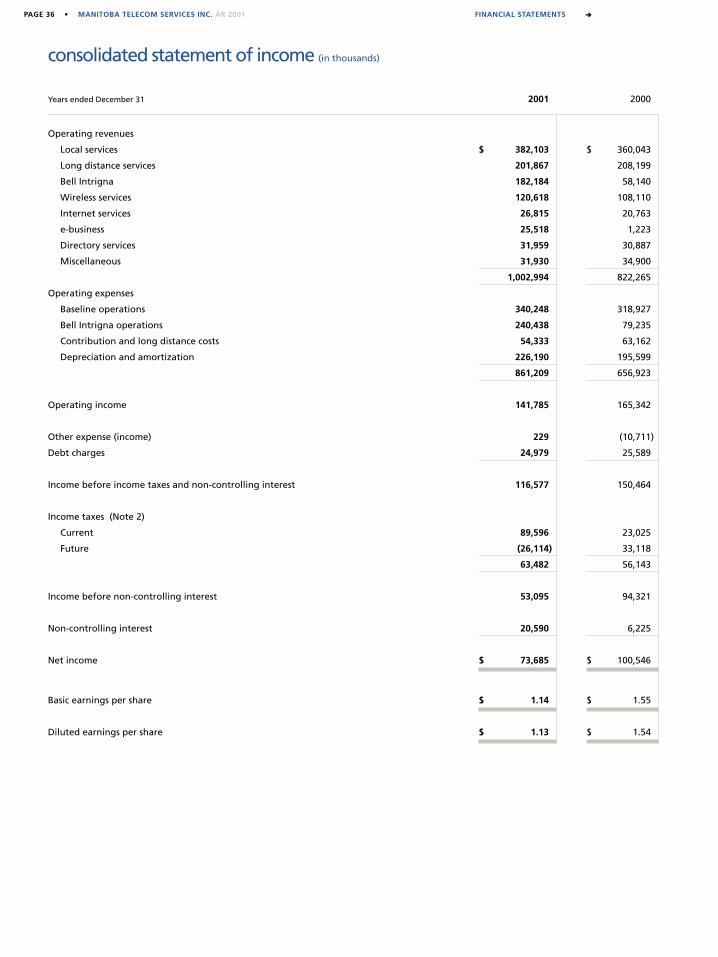
PAGE 36 • MANITOBA TELECOM SERVICES INC. AR 2001 FINANCIAL STATEMENTS ➜
consolidated statement of income (in thousands)
Years ended December 31 2001 2000
Operating revenues
Local services $ 382,103 $ 360,043
Long distance services 201,867 208,199
Bell Intrigna 182,184 58,140
Wireless services 120,618 108,110
Internet services 26,815 20,763
e-business 25,518 1,223
Directory services 31,959 30,887
Miscellaneous 31,930 34,900
1,002,994 822,265
Operating expenses
Baseline operations 340,248 318,927
Bell Intrigna operations 240,438 79,235
Contribution and long distance costs 54,333 63,162
Depreciation and amortization 226,190 195,599
861,209 656,923
Operating income 141,785 165,342
Other expense (income) 229 (10,711)
Debt charges 24,979 25,589
Income before income taxes and non-controlling interest 116,577 150,464
Income taxes (Note 2)
Current 89,596 23,025
Future (26,114) 33,118
63,482 56,143
Income before non-controlling interest 53,095 94,321
Non-controlling interest 20,590 6,225
Net income $ 73,685 $ 100,546
Basic earnings per share $ 1.14 $ 1.55
Diluted earnings per share $ 1.13 $ 1.54

MANITOBA TELECOM SERVICES INC. AR 2001 • PAGE 37
Years ended December 31 2001 2000
Cash flows from operating activities
Net income $ 73,685 $ 100,546
Depreciation and amortization 226,190 195,599
Cash from (used in) changes in working capital 76,316 (9,342)
Non-controlling interest (20,590) (6,225)
Future income taxes (26,114) 33,118
Other, net (36,116) (26,411)
Cash flows from operating activities 293,371 287,285
Cash flows from investing activities
Capital expenditures, net (380,613) (270,253)
Purchase of investments (Note 10) (26,924) (5,274)
Other (130) (464)
Cash flows used in investing activities (407,667) (275,991)
Cash flows from financing activities
Dividends (49,099) (49,170)
Issuance of notes payable (Note 6) 15,000 –
Issuance of share capital (Note 8) 2,181 343
Issuance of share capital by subsidiary to non-controlling interest 62,327 59,831
Purchase of outstanding Common Shares (Note 8) (6,502) (59,501)
Repayment of long-term debt – (84)
Decrease in premium on long-term debt – (1,318)
Cash flows from (used in) financing activities 23,907 (49,899)
Decrease in cash and cash equivalents (90,389) (38,605)
Cash and cash equivalents, beginning of year 113,607 152,212
Cash and cash equivalents, end of year $ 23,218 $ 113,607
Years ended December 31 2001 2000
Retained earnings, beginning of year
As previously stated $ 185,368 $ 113,340
Adjustment to reflect change in accounting for income taxes (Note 2) – 62,530
Retained earnings restated, beginning of year 185,368 175,870
Net income 73,685 100,546
Dividends (49,099) (49,170)
Purchase of outstanding Common Shares (Note 8) (5,073) (41,878)
Retained earnings, end of year $ 204,881 $ 185,368
consolidated statement of retained earnings (in thousands)
consolidated statement of cash flow (in thousands)
FINANCIAL STATEMENTS
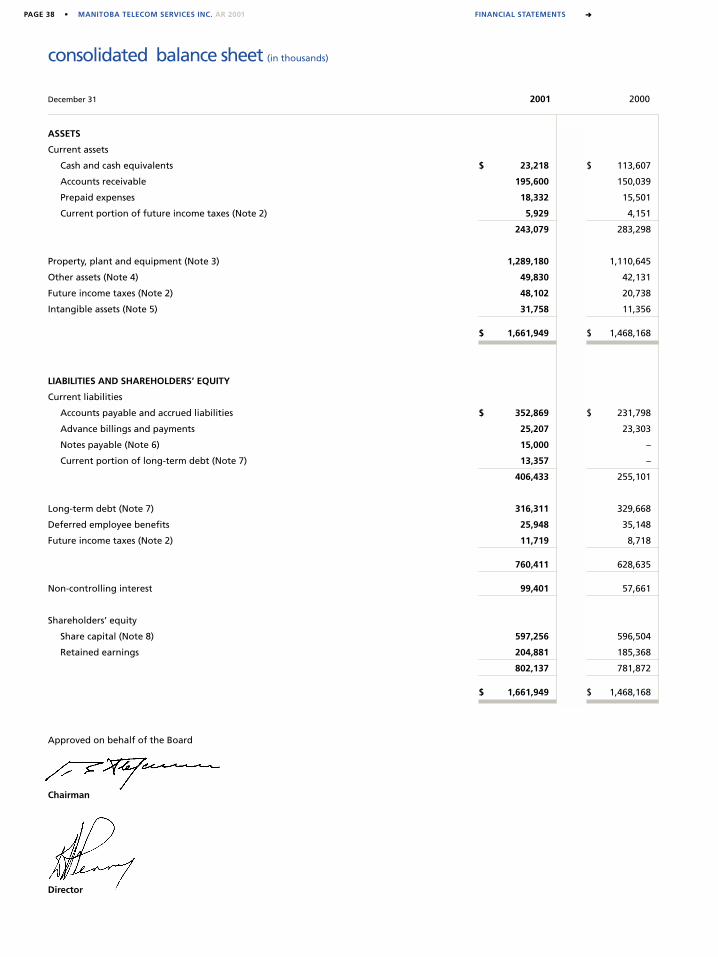
PAGE 38 • MANITOBA TELECOM SERVICES INC. AR 2001 FINANCIAL STATEMENTS ➜
consolidated balance sheet (in thousands)
Director
December 31 2001 2000
ASSETS
Current assets
Cash and cash equivalents $ 23,218 $ 113,607
Accounts receivable 195,600 150,039
Prepaid expenses 18,332 15,501
Current portion of future income taxes (Note 2) 5,929 4,151
243,079 283,298
Property, plant and equipment (Note 3) 1,289,180 1,110,645
Other assets (Note 4) 49,830 42,131
Future income taxes (Note 2) 48,102 20,738
Intangible assets (Note 5) 31,758 11,356
$ 1,661,949 $ 1,468,168
LIABILITIES AND SHAREHOLDERS’ EQUITY
Current liabilities
Accounts payable and accrued liabilities $ 352,869 $ 231,798
Advance billings and payments 25,207 23,303
Notes payable (Note 6) 15,000 –
Current portion of long-term debt (Note 7) 13,357 –
406,433 255,101
Long-term debt (Note 7) 316,311 329,668
Deferred employee benefits 25,948 35,148
Future income taxes (Note 2) 11,719 8,718
760,411 628,635
Non-controlling interest 99,401 57,661
Shareholders’ equity
Share capital (Note 8) 597,256 596,504
Retained earnings 204,881 185,368
802,137 781,872
$ 1,661,949 $ 1,468,168
Approved on behalf of the Board
Chairman
MANITOBA TELECOM SERVICES INC. AR 2001 • PAGE 39
notes to consolidated financial statementsFor the years ended December 31, 2001 and 2000
1. SUMMARY OF SIGNIFICANT ACCOUNTING POLICIES
ConsolidationThe consolidated financial statements have been prepared in accordance with Canadian generally accepted accounting principles.
The consolidated financial statements include the accounts of Manitoba Telecom Services Inc. (the “Company”) and its wholly owned
subsidiaries, MTS Communications Inc., MTS Advanced Inc., Manitoba Telecom Services International Inc., AAA Alarm Systems Ltd.,
Qunara Inc., and The EXOCOM Group Inc., as well as its majority-owned subsidiary, Bell Intrigna Inc.
Revenue recognitionRevenues from local telecommunications, Internet and e-business services are recognized in the period the services are provided.
Revenues from long distance and wireless airtime are recognized based on usage in the period the services are provided. Revenues
from telecommunications and e-business related maintenance services are deferred and recognized over the period of the customer
contract. Revenues from telecommunications and e-business related product sales are recognized once the product is installed and
available for use. Directory revenues are recognized during the period the directory is in circulation.
Cash and cash equivalentsCash and cash equivalents include cash on hand, net of bank overdrafts, and money market instruments which are readily convertible
into known amounts of cash.
Property, plant and equipmentProperty, plant and equipment is recorded at original cost, including materials, direct labour and certain overhead costs associated with
construction activity and an allowance for the cost of funds during construction. Depreciation is calculated on a straight-line basis over
the estimated useful life of property, plant and equipment by applying rates that are based on a continuing program of engineering
studies. The composite depreciation rate for the year ended December 31, 2001 was 7.5% (2000 – 7.7%).
Deferred costsDeferred costs include cellular and PCS activation costs and home security customer installation costs that are amortized over the period
of expected benefits, which is normally two years for cellular and PCS, and ten years for home security customers. Deferred costs also
include costs associated with the issuance of long-term debt, which are amortized over the term of the issue. The carrying value of
deferred costs is presented net of accumulated amortization. Total amortization of deferred costs charged to operations amounts to
$16.2 million in 2001 (2000 – $11.7 million).
Intangible assetsIntangible assets are comprised of goodwill and other intangible assets. Goodwill represents the excess of the aggregate purchase price
over the fair value of the identifiable net assets of subsidiaries at the dates of acquisition and is amortized on a straight-line basis over
the estimated periods of benefit ranging from four to 20 years. The carrying value of goodwill is evaluated for potential permanent
impairment on an ongoing basis. In order to determine whether permanent impairment exists, the Company’s management considers
the financial condition of each acquired business unit, as well as its expected pre-tax earnings, cash flows and market-related values.
Any impairment in the value of goodwill is written off against earnings in the year the impairment is recognized. Total amortization
of goodwill charged to operations amounts to $3.6 million in 2001 (2000 – $1.7 million). Other intangible assets represent customer
contracts and other contractual arrangements, which are being amortized over the estimated period of benefit of one to ten years.
Total amortization of other intangible assets charged to operations amounts to $0.3 million in 2001. The carrying value of intangible
assets is presented net of accumulated amortization.
Translation of foreign currenciesForeign currencies have been translated into Canadian dollars at rates of exchange on the following bases:
i. Monetary assets and liabilities at effective rates prevailing at the end of the year; and
ii. Revenues and expenses at rates prevailing at the respective transaction dates.
Financial instrumentsThe Company’s financial assets and liabilities are initially recorded at the related transaction amount, which is normally the historical
cost. When the carrying value of a financial asset exceeds its fair value on a basis that is other than temporary, the carrying value is
reduced to the fair value.
With the exception of long-term debt, the carrying value of the Company’s financial assets and liabilities, which are subject to normal
trade terms, approximates the fair value. The Company’s long-term debt, with a cost of $329.7 million (2000 – $329.7 million), has a fair
market value of $356.0 million as at December 31, 2001 (2000 – $344.2 million). During the years ended December 31, 2001 and 2000,
the Company has not utilized any derivative financial instruments.
The Company is exposed to credit risk from its customers. This risk is minimized by the Company’s large and diverse customer base.
Income taxesThe Company uses the liability method of accounting for income taxes. Under this method, future income tax assets and liabilities are
determined based on the differences between the tax basis of an asset or liability and its carrying amount, and are measured using
FINANCIAL STATEMENTS
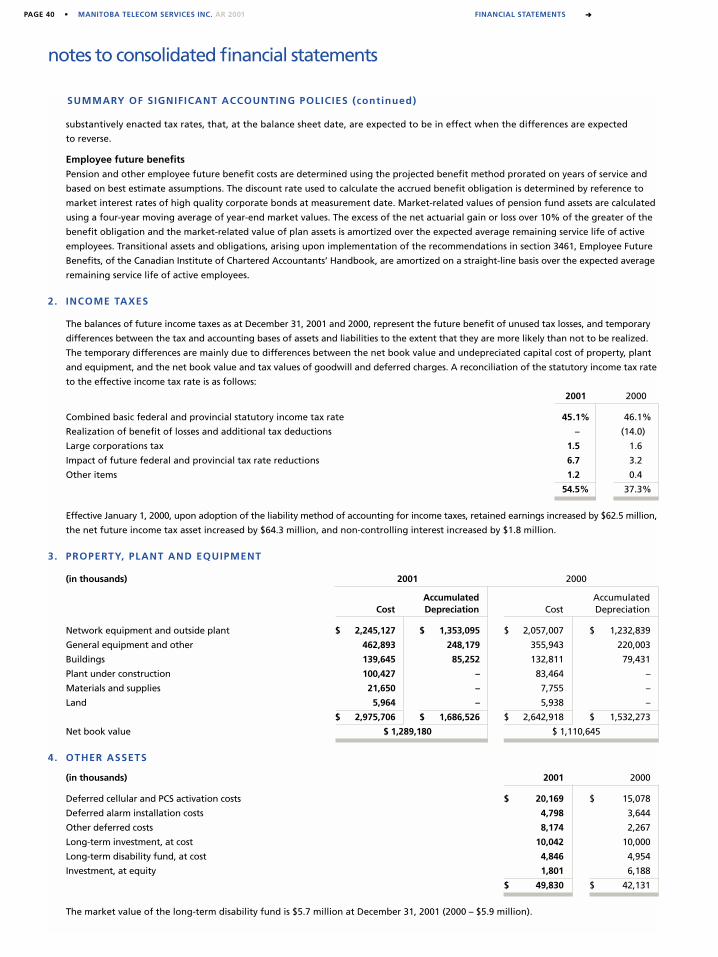
PAGE 40 • MANITOBA TELECOM SERVICES INC. AR 2001 FINANCIAL STATEMENTS ➜
notes to consolidated financial statements
substantively enacted tax rates, that, at the balance sheet date, are expected to be in effect when the differences are expected
to reverse.
Employee future benefitsPension and other employee future benefit costs are determined using the projected benefit method prorated on years of service and
based on best estimate assumptions. The discount rate used to calculate the accrued benefit obligation is determined by reference to
market interest rates of high quality corporate bonds at measurement date. Market-related values of pension fund assets are calculated
using a four-year moving average of year-end market values. The excess of the net actuarial gain or loss over 10% of the greater of the
benefit obligation and the market-related value of plan assets is amortized over the expected average remaining service life of active
employees. Transitional assets and obligations, arising upon implementation of the recommendations in section 3461, Employee Future
Benefits, of the Canadian Institute of Chartered Accountants’ Handbook, are amortized on a straight-line basis over the expected average
remaining service life of active employees.
2. INCOME TAXES
The balances of future income taxes as at December 31, 2001 and 2000, represent the future benefit of unused tax losses, and temporary
differences between the tax and accounting bases of assets and liabilities to the extent that they are more likely than not to be realized.
The temporary differences are mainly due to differences between the net book value and undepreciated capital cost of property, plant
and equipment, and the net book value and tax values of goodwill and deferred charges. A reconciliation of the statutory income tax rate
to the effective income tax rate is as follows:
2001 2000
Combined basic federal and provincial statutory income tax rate 45.1% 46.1%
Realization of benefit of losses and additional tax deductions – (14.0)
Large corporations tax 1.5 1.6
Impact of future federal and provincial tax rate reductions 6.7 3.2
Other items 1.2 0.4
54.5% 37.3%
Effective January 1, 2000, upon adoption of the liability method of accounting for income taxes, retained earnings increased by $62.5 million,
the net future income tax asset increased by $64.3 million, and non-controlling interest increased by $1.8 million.
3. PROPERTY, PLANT AND EQUIPMENT
(in thousands) 2001 2000
Accumulated AccumulatedCost Depreciation Cost Depreciation
Network equipment and outside plant $ 2,245,127 $ 1,353,095 $ 2,057,007 $ 1,232,839
General equipment and other 462,893 248,179 355,943 220,003
Buildings 139,645 85,252 132,811 79,431
Plant under construction 100,427 – 83,464 –
Materials and supplies 21,650 – 7,755 –
Land 5,964 – 5,938 –
$ 2,975,706 $ 1,686,526 $ 2,642,918 $ 1,532,273
Net book value $ 1,289,180 $ 1,110,645
4. OTHER ASSETS
(in thousands) 2001 2000
Deferred cellular and PCS activation costs $ 20,169 $ 15,078
Deferred alarm installation costs 4,798 3,644
Other deferred costs 8,174 2,267
Long-term investment, at cost 10,042 10,000
Long-term disability fund, at cost 4,846 4,954
Investment, at equity 1,801 6,188
$ 49,830 $ 42,131
The market value of the long-term disability fund is $5.7 million at December 31, 2001 (2000 – $5.9 million).
SUMMARY OF SIGNIFICANT ACCOUNTING POLICIES (continued)
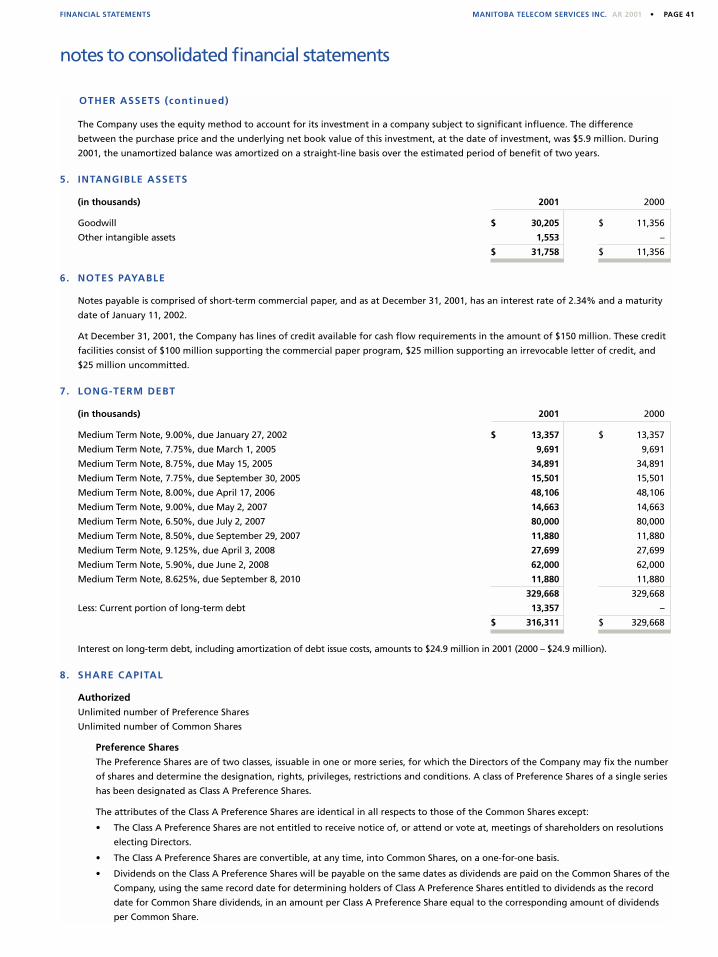
MANITOBA TELECOM SERVICES INC. AR 2001 • PAGE 41
notes to consolidated financial statements
The Company uses the equity method to account for its investment in a company subject to significant influence. The difference
between the purchase price and the underlying net book value of this investment, at the date of investment, was $5.9 million. During
2001, the unamortized balance was amortized on a straight-line basis over the estimated period of benefit of two years.
5. INTANGIBLE ASSETS
(in thousands) 2001 2000
Goodwill $ 30,205 $ 11,356
Other intangible assets 1,553 –
$ 31,758 $ 11,356
6. NOTES PAYABLE
Notes payable is comprised of short-term commercial paper, and as at December 31, 2001, has an interest rate of 2.34% and a maturity
date of January 11, 2002.
At December 31, 2001, the Company has lines of credit available for cash flow requirements in the amount of $150 million. These credit
facilities consist of $100 million supporting the commercial paper program, $25 million supporting an irrevocable letter of credit, and
$25 million uncommitted.
7. LONG-TERM DEBT
(in thousands) 2001 2000
Medium Term Note, 9.00%, due January 27, 2002 $ 13,357 $ 13,357
Medium Term Note, 7.75%, due March 1, 2005 9,691 9,691
Medium Term Note, 8.75%, due May 15, 2005 34,891 34,891
Medium Term Note, 7.75%, due September 30, 2005 15,501 15,501
Medium Term Note, 8.00%, due April 17, 2006 48,106 48,106
Medium Term Note, 9.00%, due May 2, 2007 14,663 14,663
Medium Term Note, 6.50%, due July 2, 2007 80,000 80,000
Medium Term Note, 8.50%, due September 29, 2007 11,880 11,880
Medium Term Note, 9.125%, due April 3, 2008 27,699 27,699
Medium Term Note, 5.90%, due June 2, 2008 62,000 62,000
Medium Term Note, 8.625%, due September 8, 2010 11,880 11,880
329,668 329,668
Less: Current portion of long-term debt 13,357 –
$ 316,311 $ 329,668
Interest on long-term debt, including amortization of debt issue costs, amounts to $24.9 million in 2001 (2000 – $24.9 million).
8. SHARE CAPITAL
Authorized Unlimited number of Preference Shares
Unlimited number of Common Shares
Preference SharesThe Preference Shares are of two classes, issuable in one or more series, for which the Directors of the Company may fix the number
of shares and determine the designation, rights, privileges, restrictions and conditions. A class of Preference Shares of a single series
has been designated as Class A Preference Shares.
The attributes of the Class A Preference Shares are identical in all respects to those of the Common Shares except:
• The Class A Preference Shares are not entitled to receive notice of, or attend or vote at, meetings of shareholders on resolutions
electing Directors.
• The Class A Preference Shares are convertible, at any time, into Common Shares, on a one-for-one basis.
• Dividends on the Class A Preference Shares will be payable on the same dates as dividends are paid on the Common Shares of the
Company, using the same record date for determining holders of Class A Preference Shares entitled to dividends as the record
date for Common Share dividends, in an amount per Class A Preference Share equal to the corresponding amount of dividends
per Common Share.
FINANCIAL STATEMENTS
OTHER ASSETS (continued)
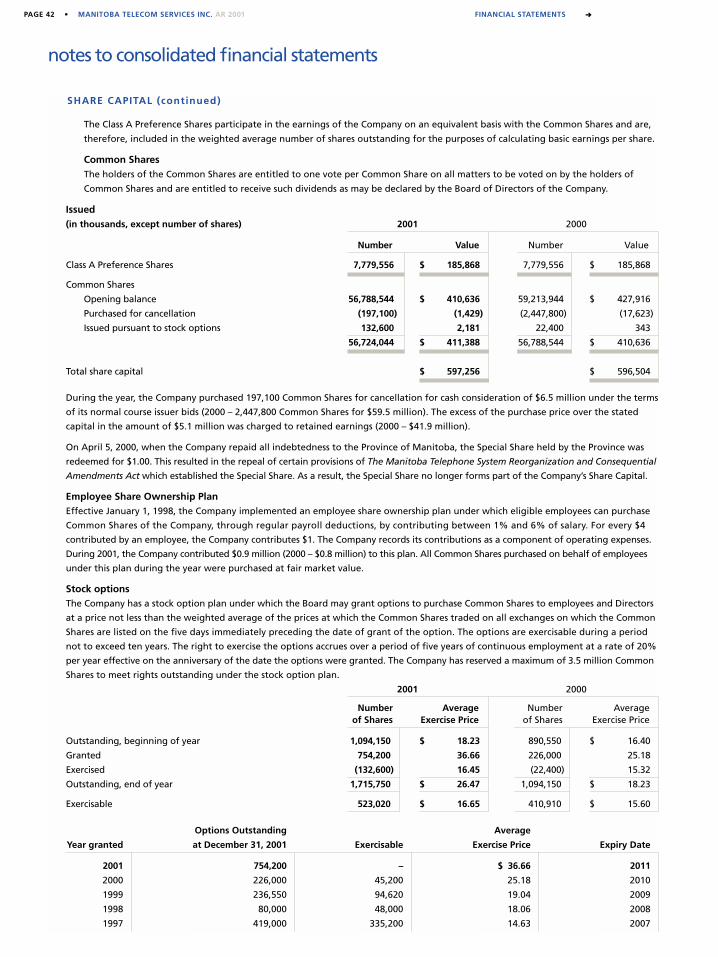
PAGE 42 • MANITOBA TELECOM SERVICES INC. AR 2001 FINANCIAL STATEMENTS ➜
notes to consolidated financial statements
The Class A Preference Shares participate in the earnings of the Company on an equivalent basis with the Common Shares and are,
therefore, included in the weighted average number of shares outstanding for the purposes of calculating basic earnings per share.
Common SharesThe holders of the Common Shares are entitled to one vote per Common Share on all matters to be voted on by the holders of
Common Shares and are entitled to receive such dividends as may be declared by the Board of Directors of the Company.
Issued(in thousands, except number of shares) 2001 2000
Number Value Number Value
Class A Preference Shares 7,779,556 $ 185,868 7,779,556 $ 185,868
Common Shares
Opening balance 56,788,544 $ 410,636 59,213,944 $ 427,916
Purchased for cancellation (197,100) (1,429) (2,447,800) (17,623)
Issued pursuant to stock options 132,600 2,181 22,400 343
56,724,044 $ 411,388 56,788,544 $ 410,636
Total share capital $ 597,256 $ 596,504
During the year, the Company purchased 197,100 Common Shares for cancellation for cash consideration of $6.5 million under the terms
of its normal course issuer bids (2000 – 2,447,800 Common Shares for $59.5 million). The excess of the purchase price over the stated
capital in the amount of $5.1 million was charged to retained earnings (2000 – $41.9 million).
On April 5, 2000, when the Company repaid all indebtedness to the Province of Manitoba, the Special Share held by the Province was
redeemed for $1.00. This resulted in the repeal of certain provisions of The Manitoba Telephone System Reorganization and Consequential
Amendments Act which established the Special Share. As a result, the Special Share no longer forms part of the Company’s Share Capital.
Employee Share Ownership PlanEffective January 1, 1998, the Company implemented an employee share ownership plan under which eligible employees can purchase
Common Shares of the Company, through regular payroll deductions, by contributing between 1% and 6% of salary. For every $4
contributed by an employee, the Company contributes $1. The Company records its contributions as a component of operating expenses.
During 2001, the Company contributed $0.9 million (2000 – $0.8 million) to this plan. All Common Shares purchased on behalf of employees
under this plan during the year were purchased at fair market value.
Stock optionsThe Company has a stock option plan under which the Board may grant options to purchase Common Shares to employees and Directors
at a price not less than the weighted average of the prices at which the Common Shares traded on all exchanges on which the Common
Shares are listed on the five days immediately preceding the date of grant of the option. The options are exercisable during a period
not to exceed ten years. The right to exercise the options accrues over a period of five years of continuous employment at a rate of 20%
per year effective on the anniversary of the date the options were granted. The Company has reserved a maximum of 3.5 million Common
Shares to meet rights outstanding under the stock option plan.
2001 2000
Number Average Number Averageof Shares Exercise Price of Shares Exercise Price
Outstanding, beginning of year 1,094,150 $ 18.23 890,550 $ 16.40
Granted 754,200 36.66 226,000 25.18
Exercised (132,600) 16.45 (22,400) 15.32
Outstanding, end of year 1,715,750 $ 26.47 1,094,150 $ 18.23
Exercisable 523,020 $ 16.65 410,910 $ 15.60
Options Outstanding Average
Year granted at December 31, 2001 Exercisable Exercise Price Expiry Date
2001 754,200 – $ 36.66 2011
2000 226,000 45,200 25.18 2010
1999 236,550 94,620 19.04 2009
1998 80,000 48,000 18.06 2008
1997 419,000 335,200 14.63 2007
SHARE CAPITAL (continued)
MANITOBA TELECOM SERVICES INC. AR 2001 • PAGE 43
notes to consolidated financial statements
9. EMPLOYEE FUTURE BENEFITS
The Company has a contributory defined benefit best average pension plan (the “Pension Plan”), which covers the employees of Manitoba
Telecom Services Inc., MTS Communications Inc., MTS Advanced Inc., and Manitoba Telecom Services International Inc. The Pension Plan
provides pensions based on length of service and best average earnings. The Company’s policy is to fund the Pension Plan as determined
through periodic actuarial valuations. Contributions reflect actuarial assumptions regarding salary projections and future service benefits.
The Company also provides supplemental pension arrangements and other non-pension employee future benefits that are unfunded with
the exception of the long-term disability plan for which the Company has dedicated assets set aside to fund benefits. These assets are
recorded on the Company’s financial statements.
The actuarial assumptions used in determining the Company’s accrued benefit obligations for December 31, 2001 include a discount
rate of 7.50% (2000 – 7.00%) for pension liabilities and 6.75% (2000 – 7.00%) for the non-pension employee future benefits liabilities,
expected long-term rate of return on plan assets of 7.50% (2000 – 7.25%), and a rate of compensation increase of 3.00% (2000 – 2.25%).
In 2001, the Company recognized a defined benefit pension plan credit of $6.8 million (2000 – $4.7 million), which is comprised of a
current service cost (net of employee contributions) of $12.3 million (2000 – $11.9 million), interest on the accrued benefit obligation
of $58.6 million (2000 – $58.5 million), an expected return on plan assets of $66.8 million (2000 – $64.2 million), and the amortization
of the transitional asset of $10.9 million (2000 – $10.9 million).
The aggregate accrued benefit obligation of the Company’s defined benefit pension plans of $841.3 million at December 31, 2001
(2000 – $851.1 million) is comprised of the accrued benefit obligation at January 1, 2001 of $851.1 million (2000 – $816.5 million), current
service cost of $21.3 million (2000 – $20.7 million), interest on the accrued benefit obligation of $58.6 million (2000 – $58.5 million),
the actuarial gain on the obligation of $38.4 million (2000 – actuarial loss of $20.8 million), and benefit payments and transfers of
$51.3 million (2000 – $65.4 million). Included in the accrued benefit obligation at year-end is an accrued benefit obligation totalling
$3.6 million (2000 – $2.7 million) in respect of plans that are not funded.
The fair value of the Pension Plan assets at December 31, 2001 of $915.7 million (2000 – $964.8 million) is comprised of the fair value of plan
assets at January 1, 2001 of $964.8 million (2000 – $961.3 million), employee contributions of $9.0 million (2000 – $8.8 million), the actual loss
on plan assets of $6.8 million (2000 – gain of $60.1 million), and benefits paid during the year of $51.3 million (2000 – $65.4 million). The
excess of the Pension Plan assets over the accrued benefit obligation at December 31, 2001 is $74.4 million (2000 – $113.7 million).
At December 31, 2001, the accrued pension benefit liability recognized in the financial statements is $1.3 million (2000 – $8.1 million). The
unamortized net actuarial loss and unamortized net transitional asset of the Company’s defined benefit pension plans are $60.1 million
(2000 – $24.9 million) and $135.8 million (2000 – $146.7 million), respectively.
In 2001, the Company recognized an expense relating to the Company’s other benefit plans of $1.7 million (2000 – $1.6 million) which
is comprised of a current service cost of $1.3 million (2000 – $1.2 million), interest on the accrued benefit obligation of $0.9 million
(2000 – $0.8 million), an expected return on plan assets of $0.4 million (2000 – $0.3 million), and the amortization of the transitional asset
of $0.1 million (2000 – $0.1 million).
The aggregate accrued benefit obligation of the Company’s other defined benefit plans of $13.6 million at December 31, 2001
(2000 – $12.6 million) is comprised of the accrued benefit obligation at January 1, 2001 of $12.6 million (2000 – $11.6 million), current
service cost of $1.3 million (2000 – $1.2 million), interest on the accrued benefit obligation of $0.9 million (2000 – $0.8 million), the
actuarial loss on the obligation of $0.1 million (2000 – $0.2 million), and benefit payments of $1.3 million (2000 – $1.2 million).
The fair value of the other defined benefit plans’ assets recorded in the financial statements at December 31, 2001 of $5.7 million
(2000 – $5.9 million) is comprised of the fair value of plan assets at the beginning of the year of $5.9 million (2000 – $5.3 million),
employer contributions of $1.3 million (2000 – $1.3 million), the actual loss on plan assets of $0.2 million (2000 – gain of $0.5 million),
and benefits paid during the year of $1.3 million (2000 – $1.2 million). The excess of the accrued benefit obligation over plan assets at
December 31, 2001 is $7.9 million (2000 – $6.7 million).
At December 31, 2001, the accrued other defined benefit plans’ liability recognized in the financial statements is $12.2 million
(2000 – $12.0 million), and the book value of the other benefit plans’ assets is $4.8 million (2000 – $5.0 million). The unamortized net
actuarial loss and unamortized net transitional asset of the Company’s other defined benefit plans are $1.5 million (2000 – $0.7 million)
and $1.0 million (2000 – $1.0 million), respectively.
10. ACQUISITIONS
During the year the Company acquired the following businesses:
• 100% ownership interest in The EXOCOM Group Inc. (January 1, 2001), an e-business service provider;
• The operating assets of Portage Internet Connection (February 6, 2001), Pangea.ca Inc. (April 5, 2001) and Web4 Internet Services
(December 1, 2001), providers of Internet access services;
• The operating assets of Creative Home Systems Inc. (May 2, 2001) and Knight Security and Communications Inc. (July 3, 2001),
providers of alarm monitoring services; and
FINANCIAL STATEMENTS
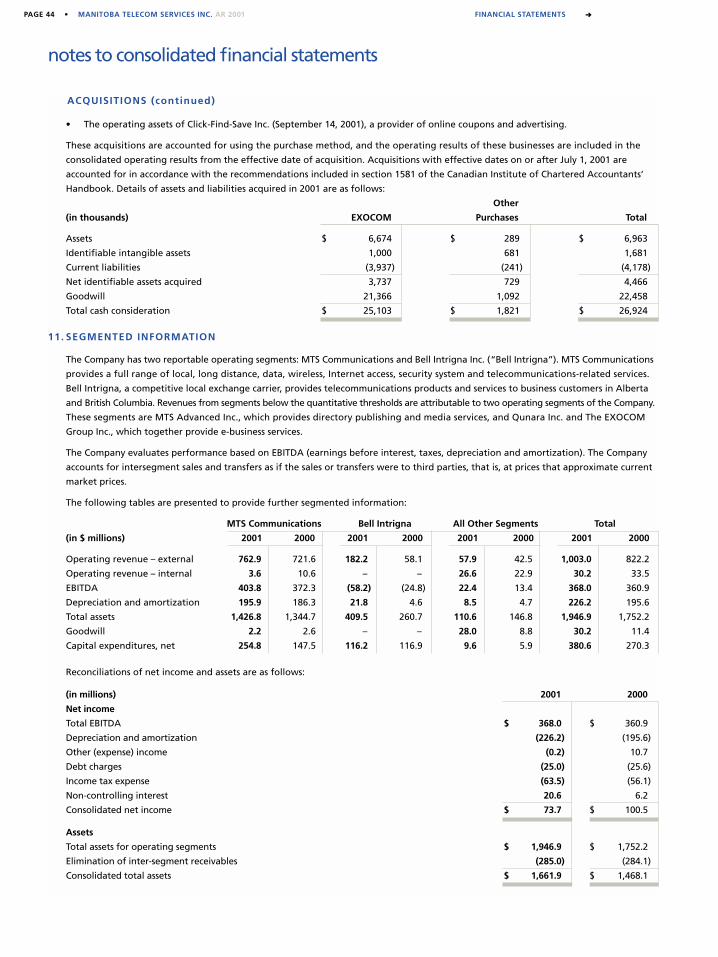
PAGE 44 • MANITOBA TELECOM SERVICES INC. AR 2001 FINANCIAL STATEMENTS ➜
notes to consolidated financial statements
• The operating assets of Click-Find-Save Inc. (September 14, 2001), a provider of online coupons and advertising.
These acquisitions are accounted for using the purchase method, and the operating results of these businesses are included in the
consolidated operating results from the effective date of acquisition. Acquisitions with effective dates on or after July 1, 2001 are
accounted for in accordance with the recommendations included in section 1581 of the Canadian Institute of Chartered Accountants’
Handbook. Details of assets and liabilities acquired in 2001 are as follows:
Other
(in thousands) EXOCOM Purchases Total
Assets $ 6,674 $ 289 $ 6,963
Identifiable intangible assets 1,000 681 1,681
Current liabilities (3,937) (241) (4,178)
Net identifiable assets acquired 3,737 729 4,466
Goodwill 21,366 1,092 22,458
Total cash consideration $ 25,103 $ 1,821 $ 26,924
11. SEGMENTED INFORMATION
The Company has two reportable operating segments: MTS Communications and Bell Intrigna Inc. (“Bell Intrigna”). MTS Communications
provides a full range of local, long distance, data, wireless, Internet access, security system and telecommunications-related services.
Bell Intrigna, a competitive local exchange carrier, provides telecommunications products and services to business customers in Alberta
and British Columbia. Revenues from segments below the quantitative thresholds are attributable to two operating segments of the Company.
These segments are MTS Advanced Inc., which provides directory publishing and media services, and Qunara Inc. and The EXOCOM
Group Inc., which together provide e-business services.
The Company evaluates performance based on EBITDA (earnings before interest, taxes, depreciation and amortization). The Company
accounts for intersegment sales and transfers as if the sales or transfers were to third parties, that is, at prices that approximate current
market prices.
The following tables are presented to provide further segmented information:
MTS Communications Bell Intrigna All Other Segments Total
(in $ millions) 2001 2000 2001 2000 2001 2000 2001 2000
Operating revenue – external 762.9 721.6 182.2 58.1 57.9 42.5 1,003.0 822.2
Operating revenue – internal 3.6 10.6 – – 26.6 22.9 30.2 33.5
EBITDA 403.8 372.3 (58.2) (24.8) 22.4 13.4 368.0 360.9
Depreciation and amortization 195.9 186.3 21.8 4.6 8.5 4.7 226.2 195.6
Total assets 1,426.8 1,344.7 409.5 260.7 110.6 146.8 1,946.9 1,752.2
Goodwill 2.2 2.6 – – 28.0 8.8 30.2 11.4
Capital expenditures, net 254.8 147.5 116.2 116.9 9.6 5.9 380.6 270.3
Reconciliations of net income and assets are as follows:
(in millions) 2001 2000
Net income
Total EBITDA $ 368.0 $ 360.9
Depreciation and amortization (226.2) (195.6)
Other (expense) income (0.2) 10.7
Debt charges (25.0) (25.6)
Income tax expense (63.5) (56.1)
Non-controlling interest 20.6 6.2
Consolidated net income $ 73.7 $ 100.5
Assets
Total assets for operating segments $ 1,946.9 $ 1,752.2
Elimination of inter-segment receivables (285.0) (284.1)
Consolidated total assets $ 1,661.9 $ 1,468.1
ACQUISITIONS (continued)
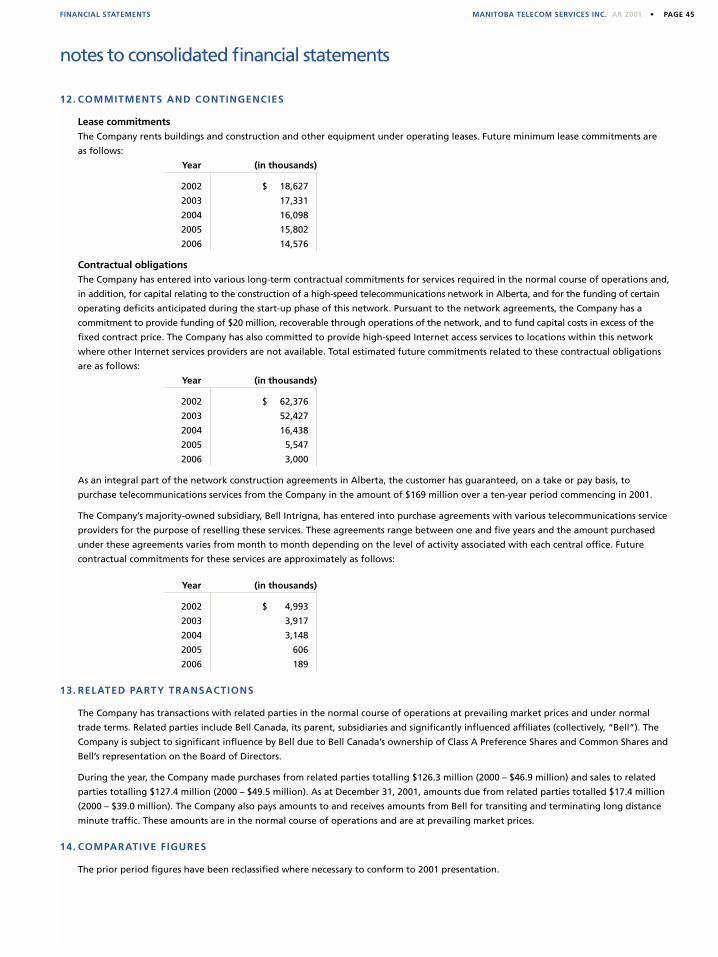
MANITOBA TELECOM SERVICES INC. AR 2001 • PAGE 45
notes to consolidated financial statements
12. COMMITMENTS AND CONTINGENCIES
Lease commitmentsThe Company rents buildings and construction and other equipment under operating leases. Future minimum lease commitments are
as follows:
Year (in thousands)
2002 $ 18,627
2003 17,331
2004 16,098
2005 15,802
2006 14,576
Contractual obligationsThe Company has entered into various long-term contractual commitments for services required in the normal course of operations and,
in addition, for capital relating to the construction of a high-speed telecommunications network in Alberta, and for the funding of certain
operating deficits anticipated during the start-up phase of this network. Pursuant to the network agreements, the Company has a
commitment to provide funding of $20 million, recoverable through operations of the network, and to fund capital costs in excess of the
fixed contract price. The Company has also committed to provide high-speed Internet access services to locations within this network
where other Internet services providers are not available. Total estimated future commitments related to these contractual obligations
are as follows:
Year (in thousands)
2002 $ 62,376
2003 52,427
2004 16,438
2005 5,547
2006 3,000
As an integral part of the network construction agreements in Alberta, the customer has guaranteed, on a take or pay basis, to
purchase telecommunications services from the Company in the amount of $169 million over a ten-year period commencing in 2001.
The Company’s majority-owned subsidiary, Bell Intrigna, has entered into purchase agreements with various telecommunications service
providers for the purpose of reselling these services. These agreements range between one and five years and the amount purchased
under these agreements varies from month to month depending on the level of activity associated with each central office. Future
contractual commitments for these services are approximately as follows:
Year (in thousands)
2002 $ 4,993
2003 3,917
2004 3,148
2005 606
2006 189
13. RELATED PARTY TRANSACTIONS
The Company has transactions with related parties in the normal course of operations at prevailing market prices and under normal
trade terms. Related parties include Bell Canada, its parent, subsidiaries and significantly influenced affiliates (collectively, “Bell”). The
Company is subject to significant influence by Bell due to Bell Canada’s ownership of Class A Preference Shares and Common Shares and
Bell’s representation on the Board of Directors.
During the year, the Company made purchases from related parties totalling $126.3 million (2000 – $46.9 million) and sales to related
parties totalling $127.4 million (2000 – $49.5 million). As at December 31, 2001, amounts due from related parties totalled $17.4 million
(2000 – $39.0 million). The Company also pays amounts to and receives amounts from Bell for transiting and terminating long distance
minute traffic. These amounts are in the normal course of operations and are at prevailing market prices.
14. COMPARATIVE FIGURES
The prior period figures have been reclassified where necessary to conform to 2001 presentation.
FINANCIAL STATEMENTS
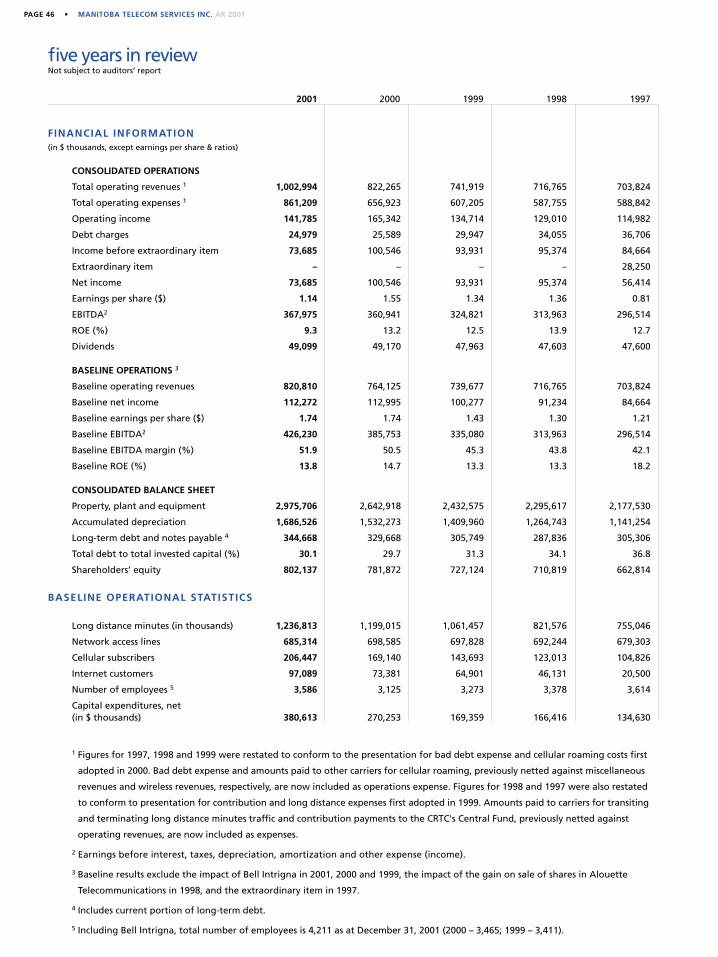
PAGE 46 • MANITOBA TELECOM SERVICES INC. AR 2001
five years in reviewNot subject to auditors’ report
2001 2000 1999 1998 1997
FINANCIAL INFORMATION(in $ thousands, except earnings per share & ratios)
CONSOLIDATED OPERATIONS
Total operating revenues 1 1,002,994 822,265 741,919 716,765 703,824
Total operating expenses 1 861,209 656,923 607,205 587,755 588,842
Operating income 141,785 165,342 134,714 129,010 114,982
Debt charges 24,979 25,589 29,947 34,055 36,706
Income before extraordinary item 73,685 100,546 93,931 95,374 84,664
Extraordinary item – – – – 28,250
Net income 73,685 100,546 93,931 95,374 56,414
Earnings per share ($) 1.14 1.55 1.34 1.36 0.81
EBITDA2 367,975 360,941 324,821 313,963 296,514
ROE (%) 9.3 13.2 12.5 13.9 12.7
Dividends 49,099 49,170 47,963 47,603 47,600
BASELINE OPERATIONS 3
Baseline operating revenues 820,810 764,125 739,677 716,765 703,824
Baseline net income 112,272 112,995 100,277 91,234 84,664
Baseline earnings per share ($) 1.74 1.74 1.43 1.30 1.21
Baseline EBITDA2 426,230 385,753 335,080 313,963 296,514
Baseline EBITDA margin (%) 51.9 50.5 45.3 43.8 42.1
Baseline ROE (%) 13.8 14.7 13.3 13.3 18.2
CONSOLIDATED BALANCE SHEET
Property, plant and equipment 2,975,706 2,642,918 2,432,575 2,295,617 2,177,530
Accumulated depreciation 1,686,526 1,532,273 1,409,960 1,264,743 1,141,254
Long-term debt and notes payable 4 344,668 329,668 305,749 287,836 305,306
Total debt to total invested capital (%) 30.1 29.7 31.3 34.1 36.8
Shareholders’ equity 802,137 781,872 727,124 710,819 662,814
BASELINE OPERATIONAL STATISTICS
Long distance minutes (in thousands) 1,236,813 1,199,015 1,061,457 821,576 755,046
Network access lines 685,314 698,585 697,828 692,244 679,303
Cellular subscribers 206,447 169,140 143,693 123,013 104,826
Internet customers 97,089 73,381 64,901 46,131 20,500
Number of employees 5 3,586 3,125 3,273 3,378 3,614
Capital expenditures, net(in $ thousands) 380,613 270,253 169,359 166,416 134,630
1 Figures for 1997, 1998 and 1999 were restated to conform to the presentation for bad debt expense and cellular roaming costs first
adopted in 2000. Bad debt expense and amounts paid to other carriers for cellular roaming, previously netted against miscellaneous
revenues and wireless revenues, respectively, are now included as operations expense. Figures for 1998 and 1997 were also restated
to conform to presentation for contribution and long distance expenses first adopted in 1999. Amounts paid to carriers for transiting
and terminating long distance minutes traffic and contribution payments to the CRTC's Central Fund, previously netted against
operating revenues, are now included as expenses.
2 Earnings before interest, taxes, depreciation, amortization and other expense (income).
3 Baseline results exclude the impact of Bell Intrigna in 2001, 2000 and 1999, the impact of the gain on sale of shares in Alouette
Telecommunications in 1998, and the extraordinary item in 1997.
4 Includes current portion of long-term debt.
5 Including Bell Intrigna, total number of employees is 4,211 as at December 31, 2001 (2000 – 3,465; 1999 – 3,411).
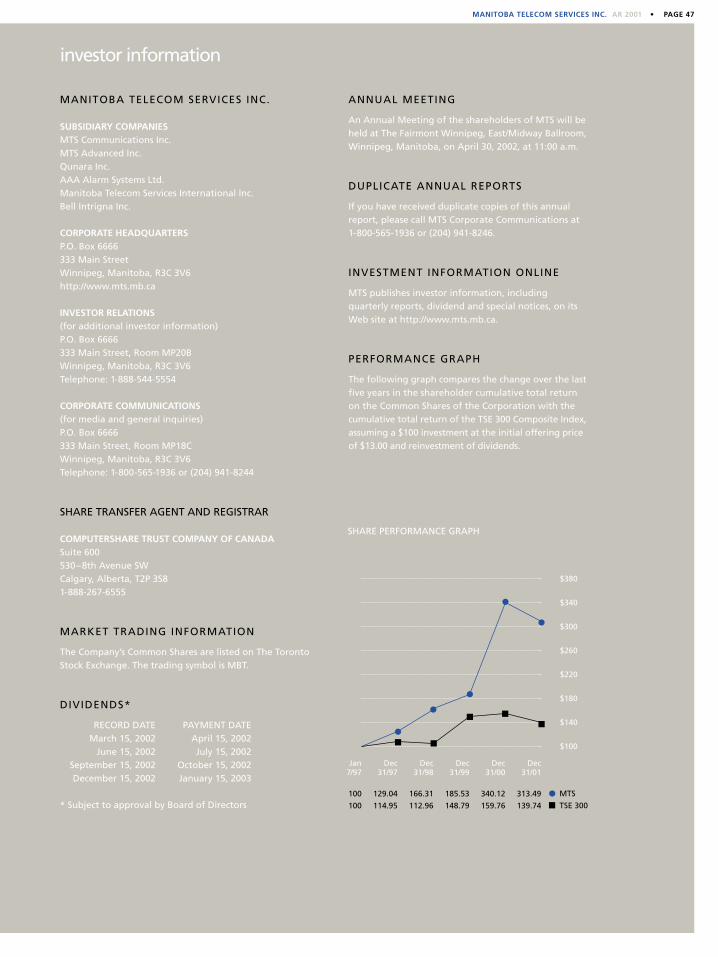
MANITOBA TELECOM SERVICES INC. AR 2001 • PAGE 47
investor information
MANITOBA TELECOM SERVICES INC.
SUBSIDIARY COMPANIESMTS Communications Inc.MTS Advanced Inc.Qunara Inc.AAA Alarm Systems Ltd.Manitoba Telecom Services International Inc.Bell Intrigna Inc.
CORPORATE HEADQUARTERSP.O. Box 6666333 Main StreetWinnipeg, Manitoba, R3C 3V6http://www.mts.mb.ca
INVESTOR RELATIONS (for additional investor information)P.O. Box 6666333 Main Street, Room MP20BWinnipeg, Manitoba, R3C 3V6Telephone: 1-888-544-5554
CORPORATE COMMUNICATIONS (for media and general inquiries)P.O. Box 6666333 Main Street, Room MP18CWinnipeg, Manitoba, R3C 3V6Telephone: 1-800-565-1936 or (204) 941-8244
SHARE TRANSFER AGENT AND REGISTRAR
COMPUTERSHARE TRUST COMPANY OF CANADASuite 600530–8th Avenue SWCalgary, Alberta, T2P 3S81-888-267-6555
MARKET TRADING INFORMATION
The Company’s Common Shares are listed on The TorontoStock Exchange. The trading symbol is MBT.
DIVIDENDS*
RECORD DATE PAYMENT DATEMarch 15, 2002 April 15, 2002
June 15, 2002 July 15, 2002September 15, 2002 October 15, 2002December 15, 2002 January 15, 2003
* Subject to approval by Board of Directors
ANNUAL MEETING
An Annual Meeting of the shareholders of MTS will beheld at The Fairmont Winnipeg, East/Midway Ballroom,Winnipeg, Manitoba, on April 30, 2002, at 11:00 a.m.
DUPLICATE ANNUAL REPORTS
If you have received duplicate copies of this annualreport, please call MTS Corporate Communications at 1-800-565-1936 or (204) 941-8246.
INVESTMENT INFORMATION ONLINE
MTS publishes investor information, including quarterly reports, dividend and special notices, on itsWeb site at http://www.mts.mb.ca.
PERFORMANCE GRAPH
The following graph compares the change over the lastfive years in the shareholder cumulative total return on the Common Shares of the Corporation with thecumulative total return of the TSE 300 Composite Index,assuming a $100 investment at the initial offering priceof $13.00 and reinvestment of dividends.
$380
$340
$300
$260
$220
$180
$140
$100
Jan 7/97
100
100
Dec 31/97
129.04
114.95
Dec 31/98
166.31
112.96
Dec 31/99
185.53
148.79
Dec 31/00
340.12
159.76
Dec 31/01
313.49
139.74
MTS
TSE 300
SHARE PERFORMANCE GRAPH
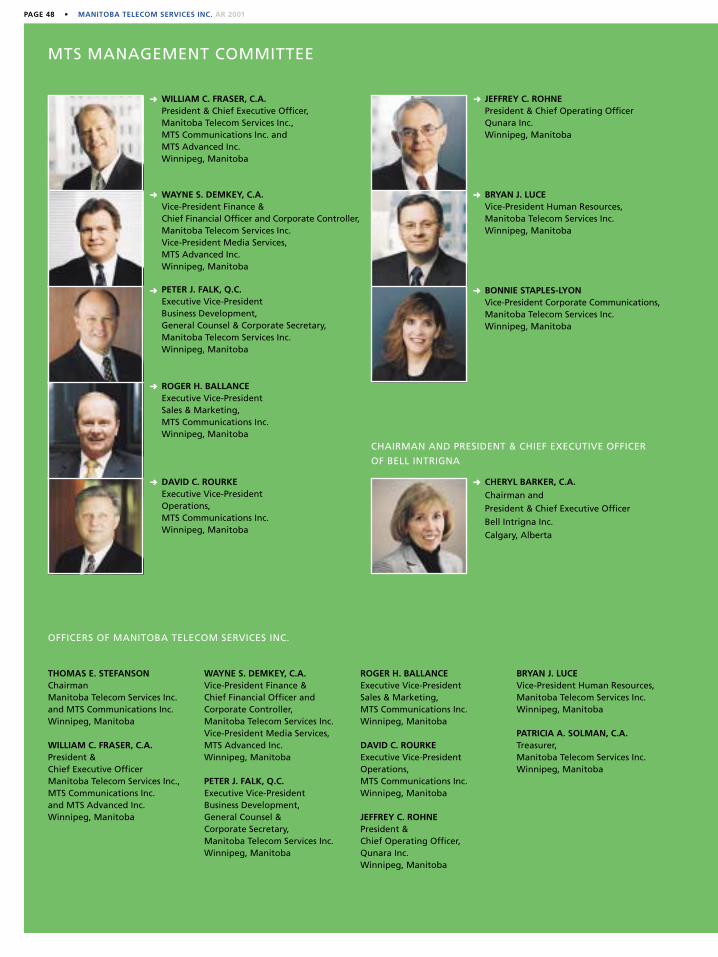
PAGE 48 • MANITOBA TELECOM SERVICES INC. AR 2001
MTS MANAGEMENT COMMITTEE
OFFICERS OF MANITOBA TELECOM SERVICES INC.
CHAIRMAN AND PRESIDENT & CHIEF EXECUTIVE OFFICER
OF BELL INTRIGNA
WILLIAM C. FRASER, C.A.President & Chief Executive Officer,Manitoba Telecom Services Inc., MTS Communications Inc. andMTS Advanced Inc.Winnipeg, Manitoba
PETER J. FALK, Q.C.Executive Vice-President Business Development, General Counsel & Corporate Secretary, Manitoba Telecom Services Inc. Winnipeg, Manitoba
ROGER H. BALLANCEExecutive Vice-PresidentSales & Marketing,MTS Communications Inc.Winnipeg, Manitoba
WAYNE S. DEMKEY, C.A.Vice-President Finance & Chief Financial Officer and Corporate Controller, Manitoba Telecom Services Inc.Vice-President Media Services, MTS Advanced Inc.Winnipeg, Manitoba
➜
➜
➜
➜
DAVID C. ROURKEExecutive Vice-PresidentOperations,MTS Communications Inc.Winnipeg, Manitoba
➜ CHERYL BARKER, C.A.
Chairman and
President & Chief Executive Officer
Bell Intrigna Inc.
Calgary, Alberta
➜
THOMAS E. STEFANSONChairmanManitoba Telecom Services Inc.and MTS Communications Inc.Winnipeg, Manitoba
WILLIAM C. FRASER, C.A.President & Chief Executive OfficerManitoba Telecom Services Inc., MTS Communications Inc. and MTS Advanced Inc.Winnipeg, Manitoba
WAYNE S. DEMKEY, C.A.Vice-President Finance & Chief Financial Officer and Corporate Controller, Manitoba Telecom Services Inc.Vice-President Media Services, MTS Advanced Inc.Winnipeg, Manitoba
PETER J. FALK, Q.C.Executive Vice-President Business Development,General Counsel & Corporate Secretary,Manitoba Telecom Services Inc.Winnipeg, Manitoba
ROGER H. BALLANCEExecutive Vice-PresidentSales & Marketing,MTS Communications Inc.Winnipeg, Manitoba
DAVID C. ROURKEExecutive Vice-President Operations,MTS Communications Inc.Winnipeg, Manitoba
JEFFREY C. ROHNEPresident & Chief Operating Officer,Qunara Inc.Winnipeg, Manitoba
BRYAN J. LUCEVice-President Human Resources,Manitoba Telecom Services Inc.Winnipeg, Manitoba
PATRICIA A. SOLMAN, C.A.Treasurer,Manitoba Telecom Services Inc.Winnipeg, Manitoba
JEFFREY C. ROHNEPresident & Chief Operating OfficerQunara Inc. Winnipeg, Manitoba
BONNIE STAPLES-LYONVice-President Corporate Communications,Manitoba Telecom Services Inc.Winnipeg, Manitoba
BRYAN J. LUCEVice-President Human Resources,Manitoba Telecom Services Inc.Winnipeg, Manitoba
➜
➜
➜
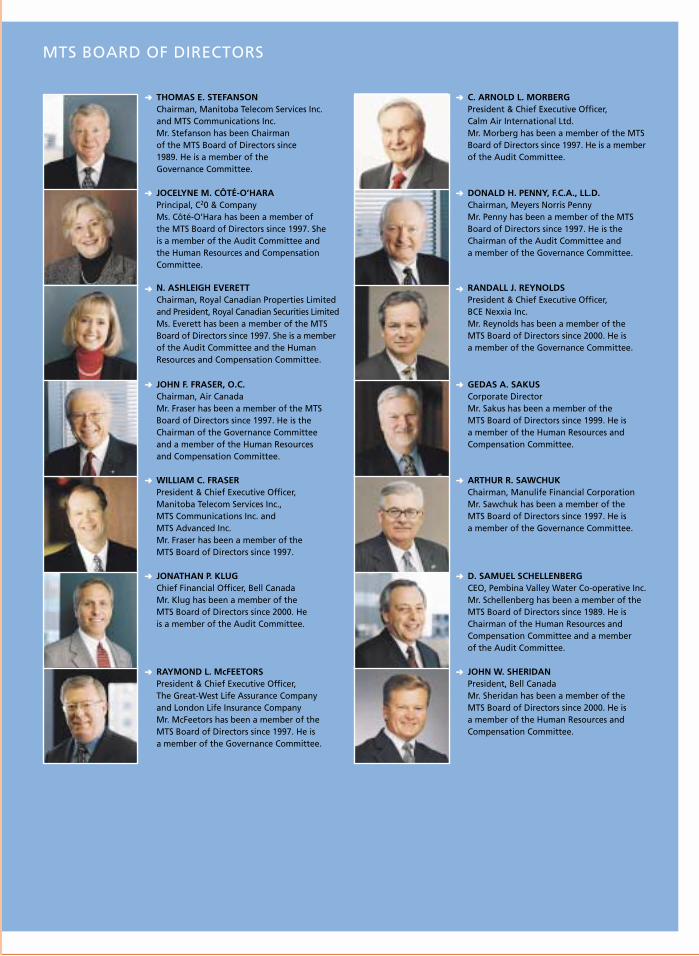
01 / Introduction02 / Financial Highlights04 / Letter to Shareholders10 / NexGen12 / Wireless14 / e-business16 / Expansion and Partnering18 / Our People22 / Management’s Discussion & Analysis34 / Financial Statements46 / Five Years in Review47 / Investor Information
TABLE OF CONTENTS ➜
THOMAS E. STEFANSONChairman, Manitoba Telecom Services Inc.and MTS Communications Inc.Mr. Stefanson has been Chairman of the MTS Board of Directors since 1989. He is a member of the Governance Committee.
N. ASHLEIGH EVERETTChairman, Royal Canadian Properties Limitedand President, Royal Canadian Securities LimitedMs. Everett has been a member of the MTSBoard of Directors since 1997. She is a memberof the Audit Committee and the HumanResources and Compensation Committee.
JOHN F. FRASER, O.C.Chairman, Air CanadaMr. Fraser has been a member of the MTSBoard of Directors since 1997. He is theChairman of the Governance Committee and a member of the Human Resources and Compensation Committee.
JOCELYNE M. CÔTÉ-O’HARAPrincipal, C20 & CompanyMs. Côté-O’Hara has been a member of the MTS Board of Directors since 1997. She is a member of the Audit Committee and the Human Resources and CompensationCommittee.
➜
➜
➜
➜
WILLIAM C. FRASERPresident & Chief Executive Officer, Manitoba Telecom Services Inc., MTS Communications Inc. and MTS Advanced Inc. Mr. Fraser has been a member of the MTS Board of Directors since 1997.
JONATHAN P. KLUGChief Financial Officer, Bell CanadaMr. Klug has been a member of the MTS Board of Directors since 2000. He is a member of the Audit Committee.
RAYMOND L. McFEETORSPresident & Chief Executive Officer, The Great-West Life Assurance Company and London Life Insurance CompanyMr. McFeetors has been a member of theMTS Board of Directors since 1997. He is a member of the Governance Committee.
➜
➜
➜
C. ARNOLD L. MORBERGPresident & Chief Executive Officer, Calm Air International Ltd.Mr. Morberg has been a member of the MTSBoard of Directors since 1997. He is a memberof the Audit Committee.
RANDALL J. REYNOLDSPresident & Chief Executive Officer, BCE Nexxia Inc.Mr. Reynolds has been a member of the MTS Board of Directors since 2000. He is a member of the Governance Committee.
GEDAS A. SAKUSCorporate DirectorMr. Sakus has been a member of the MTS Board of Directors since 1999. He is a member of the Human Resources andCompensation Committee.
DONALD H. PENNY, F.C.A., LL.D. Chairman, Meyers Norris PennyMr. Penny has been a member of the MTSBoard of Directors since 1997. He is the Chairman of the Audit Committee and a member of the Governance Committee.
➜
➜
➜
➜
ARTHUR R. SAWCHUKChairman, Manulife Financial CorporationMr. Sawchuk has been a member of the MTS Board of Directors since 1997. He is a member of the Governance Committee.
D. SAMUEL SCHELLENBERG CEO, Pembina Valley Water Co-operative Inc.Mr. Schellenberg has been a member of theMTS Board of Directors since 1989. He isChairman of the Human Resources and Compensation Committee and a member of the Audit Committee.
JOHN W. SHERIDANPresident, Bell CanadaMr. Sheridan has been a member of the MTS Board of Directors since 2000. He is a member of the Human Resources andCompensation Committee.
➜
➜
➜
MTS BOARD OF DIRECTORS
MANITOBA TELECOM SERVICES INC. ANNUAL REPORT 2001
MA
NIT
OB
AT
ELE
CO
MS
ER
VIC
ES
INC
. AN
NU
AL R
EP
OR
T 2
00
1