Embed Size (px)
Citation preview
MANIPULATION IN CRUDE OIL FUTURES
MARKETS: EVIDENCE FROM PRICE-VOLUME
RELATIONSHIP
BY
BRANDON TEO E JYE
GOON WEI LIAM
TAN SHI LING
TEH TICT CHYUAN
A research project submitted in partial fulfillment of the
requirements for the degree of
BACHELOR OF ECONOMICS (HONS) FINANCIAL
ECONOMICS
UNIVERSITI TUNKU ABDUL RAHMAN
FACULTY OF BUSINESS AND FINANCE
DEPARTMENT OF ECONOMICS
SEPTEMBER 2015
ii
Copyright @ 2015
ALL RIGHTS RESERVED. No part of this paper may be reproduced, stored in a
retrieval system, or transmitted in any form or by any means, graphic, electronic,
mechanical, photocopying, recording, scanning, or otherwise, without the prior
consent of the authors.
iii
Declaration
We hereby declare that:
(1) This undergraduate research project is the end result of our own work and
that due acknowledgement has been given in the references to ALL
sources of information be they printed, electronic or personal.
(2) No portion of this research project has been submitted in support of any
application for any other degree or qualification of this or any other
university, or other institutes of learning.
(3) Equal contribution has been made by each group member in completing
the research project.
(4) The word count of this paper of this research report is approximately 9000
words.
Name of student: Student ID: Signature:
1. Brandon Teo E Jye 11ABB03822
2. Goon Wei Liam 12ABB00191
3. Tan Shi Ling 12ABB07025
4. Teh Tict Chyuan 12ABB00111
Date: September 11, 2015
iv
ACKNOWLEDGEMENT
We would not successfully complete our thesis without the assistances and
contributions of several parties. This thesis has been carried smoothly with those
assistances and contributions. Hence, we hereby would like to express our deepest
sincerity and appreciation towards those parties.
First and foremost, we would like to thank our University, Universiti
Tunku Abdul Rahman (UTAR) for providing such a good environment and
efficient facilities in aiding us to find the sources and complete this thesis.
Next, we would like to express our appreciation to our supervisor, Mr. Go
You How from Faculty of Business and Finance (FBF) for his assistance and
helped us all the time in writing this thesis. During this research period, Mr. Go
has shown generous support, effort, time, patience and inspirations in helping us
in our research. In addition, we would like to thank him for his contributions in
every meeting. He always sacrificed his time to give us feedbacks, advices and
guidance in our thesis.
Moreover, we would like to convey our gratitude to our parents. Without
them, we could not be here today. They have been showing their morale and
financial support over the years. We would like to thank every group member.
Without their co-operation, valuable time and contribution, this research could not
be preceded successfully.
Once again, we are thankful and blissful for having all relevant parties
involved for their comments.
v
TABLE OF CONTENTS
Page
Copyright page……………………………………………………….…….. ii
Declaration………………………………………………………….……… iii
Acknowledgement…………………………………………………………. iv
Table of Contents………………………………………………………...… v
List of Tables…………………………………………………………….… vii
List of Figures…………………………………………………………….... viii
List of Abbreviations…………………………………………………….… ix
Abstract…………………………………………………………………..… x
CHAPTER 1 INTRODUCTION
1.1 Background of Study………………………………. 1
1.2 Problem Statement………………………………..... 2
1.3 Research Questions……………………………….... 7
1.4 Research Objectives………………………………... 7
1.5 Hypotheses Development………………………..… 7
1.6 Significance of Study……………………………..... 9
1.7 Chapter Layout………………………………...........10
CHAPTER 2 LITERATURE REVIEW
2.1 Types of Market Manipulation…………………..… 11
2.2 Price-Volume Relationship………………………… 14
CHAPTER 3 DATA AND METHODOLOGY
3.1 Data………………………………...........................19
3.2 Methodology………………………………..............19
vi
CHAPTER 4 EMPIRICAL RESULTS
4.1 Market Efficiency………..……………………….... 23
4.2 Manipulation in the Brent Crude Oil
Futures Market………………………………........... 24
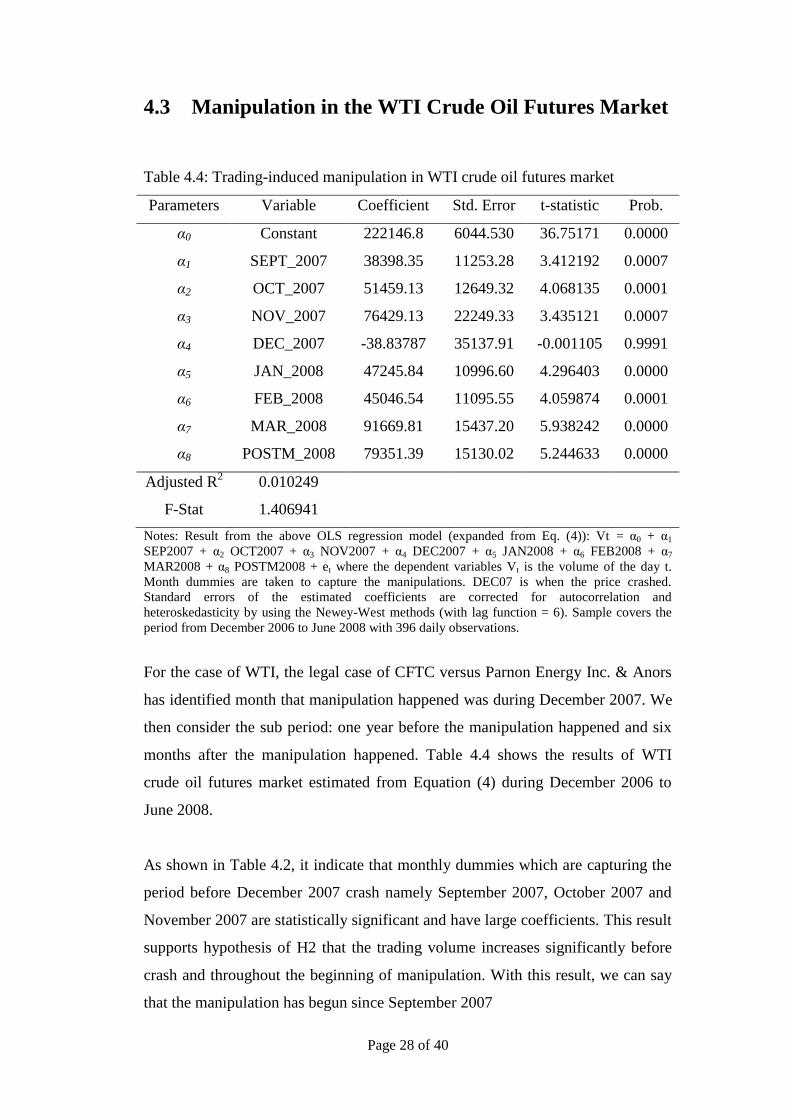
4.3 Manipulation in the WTI Crude Oil
Futures Market………………………………........... 28
4.4 Comparison between manipulation in
Brent and WTI Crude Oil Futures Markets……...… 31
CHAPTER 5 CONCLUSION
5.1 Major Findings………………………………........... 34
5.2 Policies Implications……………………………….. 35
5.3 Recommendations………………………………...... 35
References………………………………...………………………………... 37
vii
LIST OF TABLES
Page
Table 1.1: Characteristic between the Brent and WTI 3
crude oil futures market
Table 4.1: Variance-Ratio (VR) test statistics 23
Table 4.2: Trading-induced manipulation in the Brent crude oil 24
futures market
Table 4.3: Manipulations and price-volume relationship for 26
the Brent crude oil futures market
Table 4.4: Trading-induced manipulation in the WTI 28
crude oil futures market
Table 4.5: Manipulations and price-volume relationship for 30
the WTI crude oil futures market
Table 4.6: Summary of hypotheses results 31
viii
LIST OF FIGURES
Page
Figure 1.1: Brent crude oil futures market price and trading volume, 4
September 1, 2011 – March 31, 2013
Figure 1.2: WTI crude oil futures market price and trading volume, 5
June 1, 2007 – June 30, 2008
ix
LIST OF ABBERVATIONS
ANOVA Analysis of variance
CFTC Commodity Futures Trading Commissions
CSE Colombo Stock Exchange
EC European Commission
EIA Energy Information Association
EMH Efficient Market Hypothesis
GARCH AutoRegressive Conditional Heteroskedasticity
GMM Generalized method of moments
ICE Intercontinental Exchange
IEA International Energy Agency
ISSM Institution for the Study of Security Markets
MDH Mixture of distribution hypothesis
NYSE New York Stock Exchange
NYMEX New Year Mercantile Exchange
SAIH Sequential arrival of information hypothesis
VR Variance-Ratio
WTI West Texas Intermediate
x
ABSTRACT
This study examines existence of manipulation in the West Texas Intermediate
(WTI) and Brent crude oil futures markets during the period of 2005-2014. To
detect the occurrence of manipulation for respective crude oil futures market, five
hypotheses are tested. Variance-Ratio (VR) test (Lo & MacKinlay, 1988),
trading-induced manipulation equation (Aggarwal & Wu, 2006) and price-volume
relationship equation (Lee & Rui, 2002) are adopted. Empirical result provides
three findings. First, the VR test shows that the Brent futures market is inefficient,
while, the WTI futures market is found to be efficient. However, manipulation is
observed in the efficient market. Second, price and volume are found to have
positive relationship before the crash in Brent futures market, whereas, positive
relationship between the series is not detected in the WTI futures market. Third,
no negative price-volume is detected at the post-manipulation period for both
markets. This study suggests that CFTC should consistently monitor both Brent
and WTI crude oil futures markets and should aware of any unusual market
activities. Besides that, CFTC should have the new technology on hands and
knowing the trading patterns in the market.

Page 1 of 40
CHAPTER 1: INTRODUCTION
In this chapter, we discuss the background of study of manipulation in the crude
oil futures market and followed by the problem statement of the research. The
research questions and objectives are stated in the subsequent section. The
significance of study is explained at the next section. The study layout is stated in
the last section.
1.1 Background of Study
Manipulation is an intentional action or movement to affect the normal daily
operations of a market and create a false, confusing phenomenon in the aspects of
price and trading volume. Although there is normal trading dominating the market,
the irregular market behaviors happen now and then, especially in existing
commodity market.
There are many arguments regarding the increase in market price due to
manipulation. For instance, Allen and Gale (1992) identified the market
manipulation in stock market. The purpose of the manipulation process is to
inflate the prices by purchasing excessive stocks. While at the same time, it gives
a false impression of higher future prices to the traders who are uninformed.
Hence, the price of the stocks will be decline sharply after the selling process.
In the futures markets, contract price of commodity market able to provide
information to producers and traders (Nicolau, Palomba, & Traini, 2013). The
futures market is an active, effective and highly traded market which information
flow in the markets is fast and efficient. According to Nicolau, Palomba, and
Traini (2013), they found that the supply decisions of producers were related with
the price of futures contracts. Moreover, the futures contracts were taken as a
reference for the traders to value their commodities Therefore, spot commodity
markets might be dominated by the futures markets.
Page 2 of 40
Khwaja and Mian (2005) studied the pump and dump process to explain how the
mechanism of manipulation works in commodity market. The investors or traders
are able to gain abnormal profits through the practice of "pump and dump". This
is the factor that causes manipulation. According to Khwaja and Mian's (2005),
the act of "pumping" is manipulators buy stock at higher price. Their reaction
gives the incorrect signals to the market. The price is expected to increase by the
uninformed traders, hence buying more stocks.
Then, the manipulators can sell off the stock at higher price and exit the market,
causing a slump in the stock price. The uninformed traders will act after the
manipulators, sell off those stocks they own which may allow the manipulators to
re-enter the market with lower price. Another way to manipulate the market is by
"dumping", manipulators aim to burst the price bubble so that they can enter the
market at lower price by selling off the stocks at lower than fundamental price.
This will cause a fear and eventually the price will crash.
1.2 Problem Statement
During 2006-2008, market manipulation is an arguable and hot issue in
commodity market. Nowadays, manipulation has extend to different kind of
situation, it normally refers to the large traders manipulate the market.
Manipulation in crude oil market causes a huge impact towards the global
economy. A fluctuation in crude oil price provides different impacts towards oil
producing and oil consuming countries. For the case of oil consuming countries,
they will benefit with lower oil prices due to lower cost. The fall of oil price will
have negative impact for the oil producing countries as their profits were reduced.
A fall in the oil price will result to wealth distribution from oil producing nation to
oil consuming nation.
The legal cases of manipulation are adopted to identify the manipulation period.
For example, the Telegraph stated that the indictment filed a lawsuit in New York
Page 3 of 40
about Royal Dutch Shell and British Petroleum (BP) is manipulating more than a
decade in the Brent crude oil market (Godsen, 2013). In May 2012, the companies
Shell, BP and Statoil were raided by the European Commission (EC). EC warned
that the small distortions of assessed prices have a big collapse on the crude oil's
price and sales that impacting the customers.
According to Bloomberg Business, the manipulation happened in Brent crude oil
market in September 2012 (Voris, Nguyen, & Olson, 2013). Whereas in the West
Texas Intermediate (WTI) crude oil futures market, there was manipulation found
in December 2007 by the United States District court case between U.S.
Commodity Futures Trading Commissions (CFTC) versus Parnon Energy Inc.,
Arcadia Petroleum Ltd, Arcadia Energy (SUISSE) SA. Nicholas J. Wildgoose and
James T. Dyer.
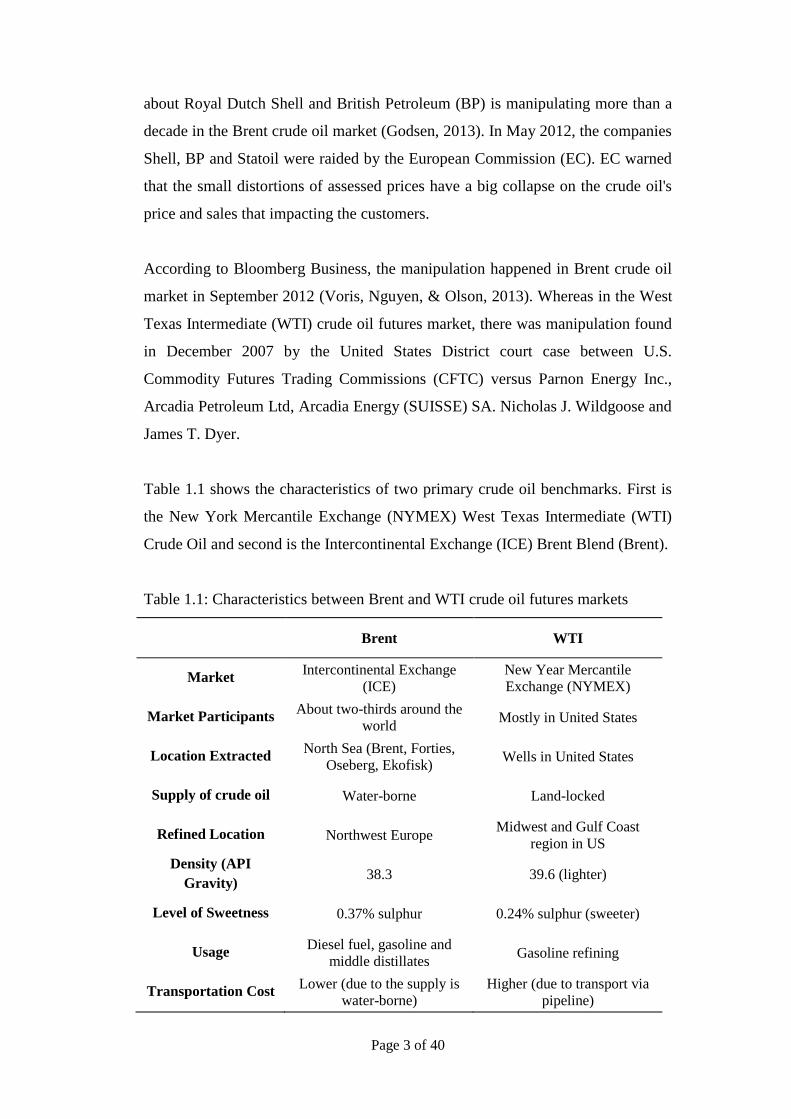
Table 1.1 shows the characteristics of two primary crude oil benchmarks. First is
the New York Mercantile Exchange (NYMEX) West Texas Intermediate (WTI)
Crude Oil and second is the Intercontinental Exchange (ICE) Brent Blend (Brent).
Table 1.1: Characteristics between Brent and WTI crude oil futures markets
Brent WTI
Market Intercontinental Exchange
(ICE)
New Year Mercantile
Exchange (NYMEX)
Market Participants About two-thirds around the
world Mostly in United States
Location Extracted North Sea (Brent, Forties,
Oseberg, Ekofisk) Wells in United States
Supply of crude oil Water-borne Land-locked
Refined Location Northwest Europe Midwest and Gulf Coast
region in US
Density (API
Gravity) 38.3 39.6 (lighter)
Level of Sweetness 0.37% sulphur 0.24% sulphur (sweeter)
Usage Diesel fuel, gasoline and
middle distillates Gasoline refining
Transportation Cost Lower (due to the supply is
water-borne)
Higher (due to transport via
pipeline)
Page 4 of 40
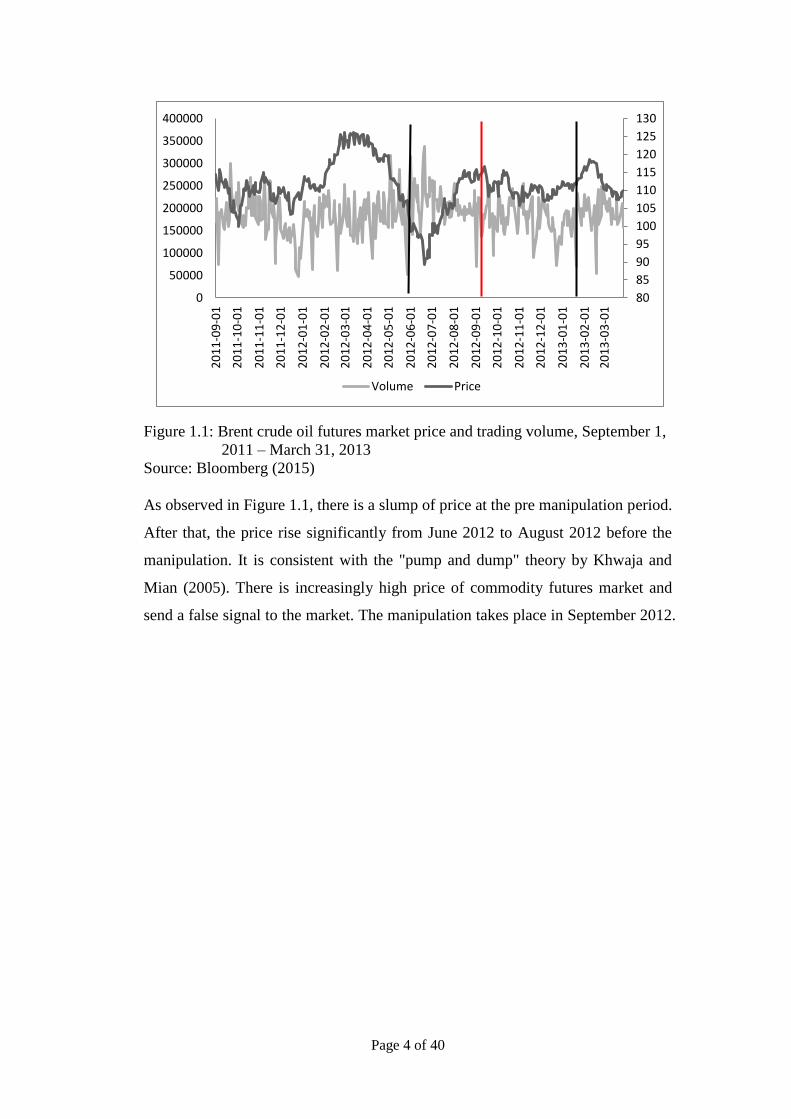
Figure 1.1: Brent crude oil futures market price and trading volume, September 1,
2011 – March 31, 2013
Source: Bloomberg (2015)
As observed in Figure 1.1, there is a slump of price at the pre manipulation period.
After that, the price rise significantly from June 2012 to August 2012 before the
manipulation. It is consistent with the "pump and dump" theory by Khwaja and
Mian (2005). There is increasingly high price of commodity futures market and
send a false signal to the market. The manipulation takes place in September 2012.
80
85
90
95
100
105
110
115
120
125
130
0
50000
100000
150000
200000
250000
300000
350000
400000
20
11
-09
-01
20
11
-10
-01
20
11
-11
-01
20
11
-12
-01
20
12
-01
-01
20
12
-02
-01
20
12
-03
-01
20
12
-04
-01
20
12
-05
-01
20
12
-06
-01
20
12
-07
-01
20
12
-08
-01
20
12
-09
-01
20
12
-10
-01
20
12
-11
-01
20
12
-12
-01
20
13
-01
-01
20
13
-02
-01
20
13
-03
-01
Volume Price
Page 5 of 40
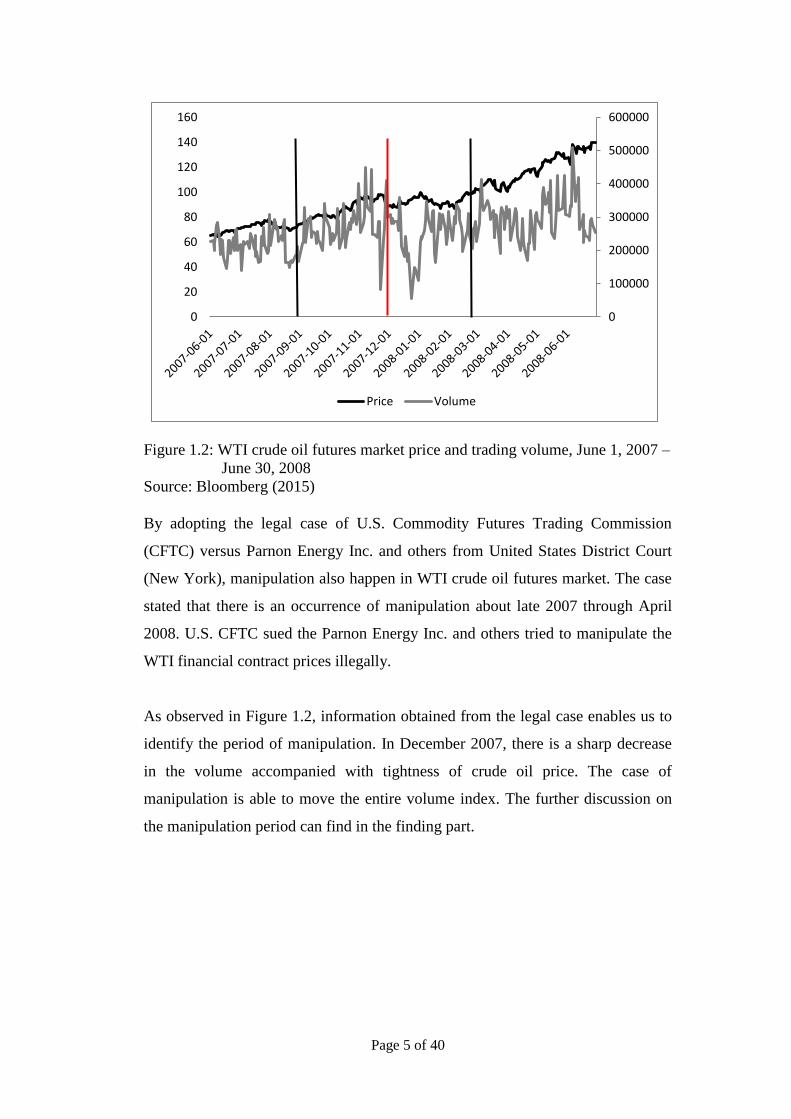
Figure 1.2: WTI crude oil futures market price and trading volume, June 1, 2007 –
June 30, 2008
Source: Bloomberg (2015)
By adopting the legal case of U.S. Commodity Futures Trading Commission
(CFTC) versus Parnon Energy Inc. and others from United States District Court
(New York), manipulation also happen in WTI crude oil futures market. The case
stated that there is an occurrence of manipulation about late 2007 through April
2008. U.S. CFTC sued the Parnon Energy Inc. and others tried to manipulate the
WTI financial contract prices illegally.
As observed in Figure 1.2, information obtained from the legal case enables us to
identify the period of manipulation. In December 2007, there is a sharp decrease
in the volume accompanied with tightness of crude oil price. The case of
manipulation is able to move the entire volume index. The further discussion on
the manipulation period can find in the finding part.
0
100000
200000
300000
400000
500000
600000
0
20
40
60
80
100
120
140
160
Price Volume
Page 6 of 40
In 2013, United States Energy Information Association (EIA) reported the average
prices for the Brent and WTI crude oil markets are $108.56/barrel and
$93.98/barrel respectively. From International Energy Agency’s Oil Market
Report (IEA), the total demand for oil in 2013 was 90.9 million barrels. Whereas
in 2015, EIA forecasted the average prices for the Brent and WTI crude oil market,
are $60.00/barrel and $55.00/barrel respectively.
EIA also forecasted the total demand for year 2015 will be around 93.6 million
barrels. By taking the Brent crude oil market as example, using the price multiply
with the volume, the total wealth distributed from oil producing nations to oil
consuming nations is amounted to $1.55 trillion per year.
From the economic point of view, during the World War II (WWII) aftermath, the
economy was experiencing stable oil price, low inflation rate and high
employment rate. That shows a good sign to economy back then. After the 1974
Gulf War, the high inflation and unemployment caused a shock decline in
economy growth due to the drastically increase in the oil price.
Oil is one of the major inputs in the economy. Most of the activities such as
fuelling transportation, production and manufacturing required this input to
operate. When the oil price increases, this effect will then pass to consumer with
bearing higher cost. Hence, it eventually causes inflation. However, when oil price
decreases, it is a good sign for investors and consumers which allow them to have
more money to spend on their investments and the daily expenses. Subsequently, a
continuous decrease in price will reduce the interest rate. This will result in
earning lower income saving and potentially affect the share price.
Page 7 of 40
1.3 Research Questions
1) Does manipulation occur in Brent and WTI crude oil futures markets
respectively?
1.4 Research Objectives
The following three objectives are stated as below:
To test the market efficiency of Brent and WTI crude oil futures markets.
To determine whether manipulation occurs in Brent and WTI crude oil
futures markets.
To examine price-volume relationship for the detection of manipulation in
Brent and WTI crude oil futures markets.
1.5 Hypotheses Development
This study attempts to test the following five hypotheses.
The study of Fama (1970) explains the idea of market efficiency. He proposes the
Efficient Market Hypothesis (EMH). The author suggests that the price of an
efficient market is fully reflect by the available information is so general that it
has no empirically testable implications. For the case of efficient market, the
return from the market will be in random walk return which prices will react
quickly and fully reflect the all available information. Hence, this will disallow
manipulators to earn abnormal return. This prompts the hypothesis of H1.
Hypothesis of H1: Informational inefficiency is found in Brent and WTI crude oil
futures markets.
Page 8 of 40
After testing the market efficiency, we proceed to test hypotheses from H2 to H5.
The authors of the referred study suggest that at the starting period of the
manipulation will experience a huge increase in the buying volume that causes the
increase of price. This motivates to test the following hypothesis of H2:
Hypothesis of H2: During the manipulation period, there is a significant increase
in the trading volume.
Next, if there is existence of information asymmetry among uniformed traders,
when manipulator increases the buying volume, the price will be increased too.
Kapoff (1987) strongly believed that there is causal relationship between price and
volume. The early studies on price-volume relation suggest that there are positive
relations between the absolute value of daily price changes and daily volume for
both market indices and individual stocks. This suggests that there is an existence
of positive price-volume relationship before the crash of price.
Hypothesis of H3: There is a positive price-volume relationship exists before the
crash.
After most of the contracts had sold by the manipulator, there was a decrease in
the total volume during the last phase of the crisis. This will considerably in the
post manipulation period, as there was an end of the period of artificially inflated
volume.
Hypothesis of H4: During the post manipulation period, a decline in trading
volume exists.
When the manipulated price bubble bursts in the last phase of the manipulation
period, the contracts sold excessively. Hence, it will cause a sharp decline in the
price of contracts. This suggests that in the last phases of the crisis, there’s a
strong negative price-volume relationship.
Hypothesis of H5: At the end of the manipulation period, there is a negative price-
volume relationship.

Page 9 of 40
After tested all hypotheses, we can determine whether manipulation occur in the
Brent and WTI crude oil futures markets. Other than that, the detection of
manipulation through the price-volume relationship is able to examine in both
crude oil futures markets.
1.6 Significance of Study
This study delivers information to Commodities Futures Trading Commission
(CFTC) about the manipulation in the Brent and WTI crude oil futures markets.
The CFTC can take note of the study manipulation cases. For instance, CFTC can
differentiate the characteristics of the manipulation by categories it into three
periods which are pre-manipulation, crash period and post manipulation.
After that, CFTC able to detect the presence of manipulation in the crude oil
futures markets with the price-volume relationship. Therefore, the result obtained
able to help CFTC to avoid the manipulation from happening. Furthermore, the
study allows CFTC to revise the existing policies (Dodd Frank Act). CFTC allows
implementing Dodd Frank Act for the protection of public and market users from
fraud manipulation and abusive financial practice. CFTC can take the price-
volume relationship for manipulation detection to increase the transparency and
accountable of the Dodd Frank Act.
Page 10 of 40
1.7 Chapter Layout
The remaining chapters are organizing as follows. Chapter 2 provides the
literatures review about the concept of manipulation and price-volume
relationship. After that, Chapter 3 discusses the data and methodologies that will
be used to investigate the occurrence of manipulation. Next, the obtained
empirical results and findings are explained and shown in Chapter 4. The last
chapter would be the discussion based on our findings in previous chapter, and
policy implications that could be taken and conclusion for the study.
Page 11 of 40
CHAPTER 2: LITERATURE REVIEW
This section discusses about the types of market manipulation and the price-
volume relationship. Then, a further discussion conducts based on the relationship
between these two. In the crude oil market, there is lack of study that carried out
to examine the presence of manipulation. Most of the past studies are mainly
focus in the stock market manipulation. Based on the past studies about the
manipulation in stock market, we adopt the five hypotheses that using the price-
volume relationship to test the unchecked manipulation in Brent and WTI crude
oil futures markets. In order to examine the manipulation in both crude oil futures
markets, we need to study the market efficiency of crude oil futures market.
2. 1 Types of Market Manipulation
Theoretically, the explanation of manipulation is defined as adjusting or changing
in accounts, data and records to fulfill one's purpose of benefits (Abrants-Metz &
Addanki, 2007). Ogut, Dogany, Ceylan and Aktas (2012) state that the
manipulation is an intervention or action to the mechanism of financial market
that avoids a fair and retail price to prevail.
The study of Allen and Gale (1992) was focused on the stock price manipulation.
The fundamental of manipulation in crude oil futures market was on the basis of
demand-supply balance. The demand of oil price was reflected the economic cycle
in the market. While the supply of crude oil price was determined by the oil
producer (Dulaimi, 2014). Manipulation practices able to bring abnormal profit to
the manipulators.
In the crude oil futures markets, the intense speculation caused the oil price to
increase and the manipulators able to seek profit through this process.
Furthermore, the participants that involved in the crude oil futures markets
manipulation are producer, trader, investors and consumers. The producers able to
Page 12 of 40
influence its competitors' production decision by get involved in the futures
market (Dulaimi, 2014). Hence, the producers can control and affect the price
level of the crude oil. Traders were the person who executed trading in the
financial or commodities markets in the capacity of speculators, hedgers and
arbitrageurs. The allocation of capital that expected a return in the future was
known as the investor. Lastly, consumers were known as the party who took the
oil for their personal use.
Generally, manipulation can be classified into three types (Allen & Gale, 1992).
The finding was supported by Azad, Azmat, Fang, and Edirisuriya (2014) who
also found that manipulation can classified into three types. The first can be
known as action based manipulation. For this type of manipulation, the actual or
perceived value of the assets affected by the cautions or manipulation action by
one party.
The second type was the information based manipulation. The market
manipulators released the false information or rumours to give the market a wrong
perception towards the market movement (Van Bommel, 2003). Hence, the
manipulation took place in the market.
The trade based manipulation was the third type of manipulation. It occurred
where the manipulators simply buy and sell the stocks without taking additional
observation into account to affect the firm's value (pump and dump). These well
informed participants would then prevent the manipulators to earn abnormal profit.
The impact of buying excessive (pumping) or selling (dumping) stocks by
manipulators would be offset by the act of traders who buy or sell off their stocks.
The uninformed traders will leave overprice stock on hand.
The act of “pumping" can be described as manipulators buy stock at rising high
prices and send the false signals to the market (Khwaja & Mian, 2005). The
traders that are uninformed would expect the price to increase, hence buying more
stocks. During the “dumping”, manipulators can sell off the stock at much higher
price and exit the market, causing a slump in the stock price. The uninformed

Page 13 of 40
traders would then act after the manipulators, sell off those stocks they own which
allow the manipulators to re-enter the market with lower price.
The researchers Allen and Gale (1992) study the stock price history manipulation
by using the Twentieth Century Fund’s securities as their discussion in the study.
They concluded that it is hard to disallow trade based manipulation as the
manipulation able to occur in different way by the action of release false
information by the insiders.
On the other hand, Van Bommel (2003) studied the information based
manipulation in stock market manipulation based on the public and non-public
announcement. The finding was consistent with Aggarwal and Wu (2006) that
established a model to explain trade based manipulation on the cases of Securities
and Exchange Commission (SEC) stock market manipulation from January 1990
to October 2001. The authors found that the higher volatility of stock, greater
liquidity, and the return is high were the signs of manipulation period began.
The manipulation practice can take place due to the market become inefficient.
The idea of market efficiency refers to Fama (1970) as he proposes the theory of
EMH. The author suggests that the price of an efficient market is fully reflect by
the available information is general that it has no empirically testable implications.
For the case of efficient market, the return from the market will be in random walk
return which prices will react quickly and fully reflect the all available
information. Hence, this will disallow manipulators to earn abnormal return. In the
same paper, Fama (1970) points out three forms of market efficiency. But we just
adopt the first form which is weak-form efficiency. It indicates that the
information is purely based on historical prices.
Based on Aggarwal and Wu (2006)’s model, there was no existent of manipulator
in the market with more information seekers. Besides that, the market was more
efficient, where information was reflected rapidly in stock price when there were
high information seekers. However, when there were many information seekers, it
was possible that manipulators pool with informed party and earn profit from the
trade with information seekers. Therefore, when there were more manipulators in
Page 14 of 40
the market, the information seekers lost more. As a result, there were less
information seekers in the market and caused the market to become informational
inefficient. In short, Aggarwal and Wu (2006) concluded that more information
seekers can improve market efficiency yet can also increase manipulation.
2.2 Price-Volume Relationship
To study the price-volume relationship in stock market, Azad et al. (2014) had
taken the markets are informationally inefficient into account as the first
hypothesis. Then, the researchers continued the other four hypotheses that
employed several econometric tests and included the evidence of legal case of
manipulation periods in order to carry out the investigation. The results of the
investigation proved the case evidence of manipulation bubbles was resulting
from excessive buying and burst later through selling stocks.
They found that manipulation occurred in South Asian stock markets which
“pump and dump” take place in the market. After the manipulator sends
misleading information by buying stock excessively in order to drive up the stock
price, uninformed investors will have false impression toward stock price and tend
to buy more stock in hoping stock price will increase. Thus, traded volume will
increase dramatically during manipulation.
Before the crash, the price and volume relationship is positive because of the
increasing buying volume accompany by increasing price in manipulation period.
Then, trade volume will slightly fall during the last phrase of the crash which due
to the manipulator will sell most of the stock. In the end, when manipulation
bubble burst, there will be excessive selling of stock that causes decrease in prices.
In other word, negative relationship of price and volume occur at post-
manipulation period.
In the early study of price-volume relationship, Ying (1966) highlighted the
importance of traded volume in forecasting price. He found that the correlation
Page 15 of 40
between price and volume is positive by applying chi-square tests, analysis of
variance (ANOVA) and cross-spectral analysis to price and volume data from
1957 to 1962 in the New York Stock Exchange (NYSE). Easley, Kiefer and
O'Hara (1997) conducted a study on Ashland Oil during 1990 from Institution for
the Study of Security Markets (ISSM) transaction database, their findings is
consistent with previous study. Chevallier and Sévi (2012) studied on the crude oil
price and volume relationship by reporting strong significant and positive
relationship between price and volume. They used GARCH test to examine this
relationship period from January 2007 to December 2010 on NYMEX. He, Yang,
Xie, and Han (2014) found a positive unidirectional causality relationship between
return and volume.
In contrast, Stickel and Verrecchia (1994) found price and trading volume were
negative correlated. He used multivariate analysis and graphical analysis to
examine price and volume relationship on NASDAQ National Market System for
fiscal years from 1982 to 1990. Kocagil and Shachmurove (1998) documented
negative correlation between price and volume in orange juice futures contract. In
NYMEX, Moosa, Silvapulle and Silvapulle (2003) identified a strong negative
correlation between price and volume in WTI crude oil.
On the other hand, Pathirawasam (2011) found stock return is positively related to
contemporary changes of trading volume but past changes of trading volume is
negatively related to stock return. He examined these relationships of listed stock
from 2000 and 2008 in Colombo Stock Exchange (CSE) data.
Information Flow Hypothesis
When new information is arrived in the market and associate with trading volume,
significant relationship between price and volume will occur price will respond to
arrival of new information. In order to explain how information is affect price and
volume, there are three basic hypotheses underpinning in the price-volume
including mixture of distribution hypothesis (MDH), sequential arrival of
information hypothesis (SAIH) and noise traders’ hypothesis.
Page 16 of 40
Most of the past studies supported MDH in the examination of price and volume
relationship. In MDH, price and volume is responding contemporaneously toward
new information. All participants receive the new information simultaneously and
thus past price can be used to predict the volume (vice versa). For cotton futures
market, Clark (1973) used Bayes' tests and Kolmogorov-Smirnov tests to
investigate on price-volume relationship, he found a positive correlation on both
variables on cotton futures market from 1945 to 1958.
There was similar finding found by other researcher. For instance, Cornell (1981)
studied commodities futures, Tauchen and Pitts (1983) studied 90-Day T-Bills
Futures, Grammatikos and Saunders (1986) studied Foreign currency futures,
Bessembinder and Seguin (1993) studied eight futures market and Easley et al.
(1997) studied Ashland oil common Stock, they reported positive
contemporaneous relationship between these two variables in different market.
In SAIH, traders receives new information in dynamic effect which mean when
new information arrives in market traders will change their position because past
volume has ability to forecast future return. Copeland (1976) proposed SAIH
where information on volume needs time to be reflected on change of price in the
future. His findings were further supported by other studies. For example, Fujihara
and Mougoué (1997) examined nonlinear causality relationship for crude oil from
1984 to 1993. They used third-order moment test and found nonlinearities in
futures price and volume for crude oil futures contracts. They then used GARCH-
filtered data to test nonlinear Granger-causality. The result is significant
bidirectional nonlinear Granger-causality between price and volume.
Besides that, Moosa and Silvapulle (2000) and Moosa et al. (2003) examined in
crude oil futures also found bidirectional causality one after another. However, He
et al. (2014) investigated on agriculture commodity futures contract found a
positive unidirectional causality relationship between return and volume.
Kocagil and Shachmurove (1998) examined of contemporaneous and
intertemporal causality relationship between price and traded volume of crude oil
and other futures commodity from 1980 to 1995. They used Granger causality test

Page 17 of 40
and obtaining result is consistence with both sequential information arrival
hypotheses, mixture of distribution hypothesis and heterogeneous investor model
of Wang’s (1994). However, the result of high volume market such as crude oil
has no causality in both directions.
In Noise trader hypothesis, due to traders’ actions are not based on economic
fundamentals and relevant information, their decisions are unpredictable and tends
to cause stock prices temporary mispricing in the short run. The trade of noise
traders are conducted on the basis of price movement. In the study of Delong,
Shleifer, Summers, and Waldmann (1990), they found that there is significant
causal relationship from movement of futures prices to volume of trading. The
result indicated that the trading volume is affected by the movement of futures
price. Besides that, Bhar and Hamori (2005) investigated on crude oil futures
market from 1990 to 2000. They found one-way causality from price to volume.
However, Fujihara and Mougoué (1997) reported futures return and volume have
bidirectional nonlinear Granger causality in Petroleum Futures during 1984-1993.
Asymmetric Hypothesis
The presence of heterogeneity of trading behavior can lead market adjusts to new
information partially. The information arrival will cause investors to response
differently on market shock and this will cause asymmetric in information. Epps
(1975) developed a hypothesis indicated the existence of an asymmetric
relationship between price and volume. The heterogeneity of traders’ hypothesis
can be tested by distinction between bull and bear. Bull is more optimistic and
will react to positive information whereas bear will react to negative information.
Therefore volume is greater on positive price than negative price.
Jennings, Starks and Fellingham (1981) extended Copeland (1976)’s model by
included margin requirement to restrict on short sales. The restriction made short
seller to be less responsive to information that affected price and caused short
position to be more costly compare to long positions. Thus, they have also found
asymmetric price-volume relationship which the positive relationship is greater
than negative relationship. The studies of Smirlock and Starks (1985),
Page 18 of 40
Bessembinder and Seguin (1993), Brailsford (1996) and Cooper, Downs, and
Patterson (2000) likewise provided empirical evidence of an asymmetric price and
volume relationship where positive relationship is greater than negative.
On the contrary, Wood, McInish and Ord (1985) studied in NYSE stock and
Moosa et al. (2003) studied in crude oil futures markets, they documented
asymmetric price and volume relation which negative price and volue changes are
greater than the positive price and volume changes. In contrast, Foster (1995) used
Generalized ARCH (GARCH) and generalized method of moments (GMM) and
found symmetric price and volume relation in crude oil futures market. The results
indicated that trading volume is not affected by price change.
Page 19 of 40
CHAPTER 3: DATA AND METHODOLOGY
In this chapter, we explain the data used in the first section. The following section
is to explain Variance-Ratio (VR) test in examining market efficiency. Then, we
explain equation of Aggarwal and Wu (2006) in examining trading-induced
manipulation. Then, it is followed by equation of Lee and Rui (2002) in
examining price-volume relationship.
3.1 Data
This study uses daily closing price of New York Mercantile Exchange (NYMEX)
West Texas Intermediate (WTI) Crude Oil Futures and Intercontinental Exchange
(ICE) Brent Crude Oil Futures. The daily data of WTI futures cover from January
1, 2005 to December 31, 2014, with total 2518 observations. Due to different
scheme of market holidays, daily data of Brent futures are covered from January 1,
2005 to December 31, 2014 with 2576 observations.
These data are collected from Bloomberg, where daily closing prices of Brent and
WTI are recorded in Dollar, while trading volume of both futures markets which
is equals to 1,000 barrels per contract and the trading. Both data of price and
volume are transformed into logarithmic form in order to reduce the variances.
3.2 Methodology
This study involves three steps in testing five hypotheses. First, in testing market
efficiency, Variance-Ratio (VR) test from Lo and MacKinlay (1988) and Charles
and Darn ́ (2009) is used to check the validity of hypothesis of H1. Lo and
MacKinlay (1988) proposed the asymptotic distribution of VR (x;k) by assuming
that k is fixed when T → ∞. They showed that under the assumption of

Page 20 of 40
conditional heteroscedasticity, then under null hypothesis that V(k) = 1, the test
statistic M(x;k) is given by:
which follows the standard normal distribution asymptotically, where:
If the VR is equal to 1, the price series is a pure random walk series, any trial to
create profitable trading and predictions on the price series will fail. While, if VR
is lesser than 1, indicating that it is mean reversion and the price will tend to move
back to average price over time. Whereas for VR larger than 1, indicating it is
mean aversion and the price will tend not to move back to the average price over
time. The null hypothesis of the test is written as:
H0: Market is following Random Walk process.
Hypothesis of H1 is supported when the test statistic computed from Equation (1)
is greater than the critical values, rejecting the null hypothesis and indicating that
market is not efficient.
To test the hypotheses of H2, H3, H4 and H5, we use one sub-period for each
market according to the published news and legal cases that justified the existence
of manipulation. Referring to the legal case U.S. Commodity Futures Trading
Commission (CFTC) v. Parnon Energy Inc. & Anors and U.S. CFTC official

Page 21 of 40
released statement; U.S. CFTC sued Parnon Energy Inc. and others with
manipulation and attempted manipulation of the WTI crude oil futures market
from late 2007 to April 2008. According to Bloomberg, Reuters, Law360 and
Yahoo Finance, several oil majors and trading houses have been manipulating the
Brent crude oil futures since 2002. The manipulators are BP, Trafigura Beheer,
Phibro Trading, Royal Dutch Shell, Vitol and Morgan Stanley.
Then, how the volume changes before, during and after the manipulation period is
examined. Following Aggarwal and Wu (2006), the pre-manipulation period is
used as the base case, while dummy variables are included for the manipulation
and post-manipulation periods. Equation (4) is written as:
where Vt represents the volume on day t. SMi,t are the dummies capturing the start
of the manipulation period, Ci,t stands for the crash period dummies and PMi,t is
the post-manipulation period dummies. This equation is used to test the
hypotheses of H2 and H4. H2 is supported if the coefficient of the dummy
variables (SMi,t) that capture the start of the manipulation period is positive and
significant. This indicates that an increase in the volume happened during the
manipulation period. H4 is supported if the coefficient of the dummy variables
(Ci,t) that capture the crash period and coefficient of the post-manipulation (PMi,t)
is statistically relatively small or insignificant. This indicates that when the
manipulation ends, the volume fell during the post-manipulation period.
For third step, we use the following Equation (5) which is adopted from Lee and
Rui (2002) to test the hypotheses of H3 and H5 based on price-volume
relationship during the manipulation period. This equation consists of the slope
dummies to capture the effect of manipulation. The slope dummies are calculated
by multiplying the daily trading volume with the time-period dummy.
Page 22 of 40
where Rt is the return on the day t. The lagged volumes (Vt-1) and lagged returns
(Rt-1) are included according to the research. For this equation, the pre-
manipulation periods is used as the base case, while the slope dummies in the
equation are to capture the manipulation effect and post-manipulation periods of
the price-volume relationship. The positive and significant value of slope dummy
that capturing the start of the manipulation support the hypothesis H3, indicates
the increase in price is accompanied by the increase in volume. The negative and
significant value of slope dummy variable that capture the crash period supports
hypothesis H5, suggest that there is an excessive selling at the end of the
manipulation period and hence causes the price to crash.
Page 23 of 40
CHAPTER 4: EMPIRICAL RESULTS
We present estimated results for Variance-Ratio (VR) test at first section. The
estimated results of Brent and WTI crude oil futures market regarding the trading-
induced manipulation and price-volume relationships are presented and
interpreted in second and third sections, respectively.
4.1 Market Efficiency
Variance-Ratio (VR) test (Lo and MacKinlay, 1988) is used to compute test
statistics for weekly returns for two crude oil futures markets. This test allows us
to test the hypothesis of H1, to check whether the market is informational efficient
or inefficient. The critical values assume that the test is conducted for a single
value of lagged, k. If the test is conducted for several values of k, the probability
of rejecting the null hypothesis for some value of k is greater than the size of the
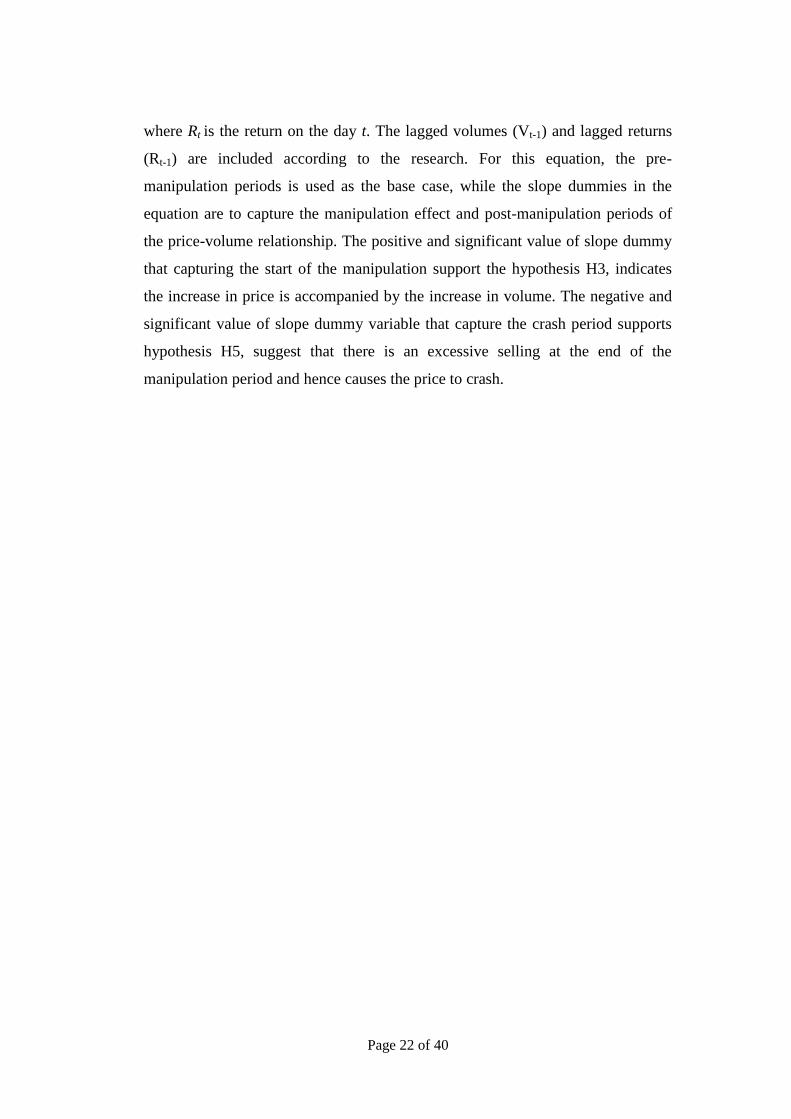
test, even asymptotically. From Table 4.1, VR test gives mixed results, rejecting
the null hypothesis for lag of 16 but not for others. Almost all of the existing
studies about the VR tests provide the same inferences, rejecting the null
hypothesis for some values of k but not for all.
Table 4.1: Variance-Ratio (VR) test statistics
Lag (k) 2 4 8 16
Brent -0.893826 0.444016 1.016388 1.712818*
WTI -0.930430 0.037346 0.589777 1.348071
Notes: The study covers the weekly data from January 2005 to December 2014. *** indicates that
the rejections are significant at the 1%. ** indicates that the rejections are significant at the 5%.
* indicates that the rejections are significant at the 10%.
As shown in Table 4.1, the result of Brent crude oil futures market at value k
equals to 16 with test statistics of 1.712818. This shows a rejection of null
hypothesis at 10% level of significance. For value k of 2, 4, 8, there is no rejection
of null hypothesis at any level of significance. These results indicate that Brent
Page 24 of 40
crude oil futures market is less efficient. However, in the WTI crude oil futures
market, no rejection is found for any lagged value k. This suggests that the WTI
crude oil futures market is efficient. This empirical test tells us that the Brent
crude oil futures market is less efficient whereas the WTI crude oil futures market
is in weak form efficient. Although the WTI crude oil futures market follows
Random Walk process, there are supporting evidences such as published news and
legal cases proved that manipulation occurred during the selected time period.
Market manipulators tend to enter into an efficient market to use the advantage of
information efficiency to manipulate the market (Aggarwal and Wu, 2006).
Therefore, manipulation can still happen in an efficient market. Thus, we proceed
to test the remaining four hypotheses for both markets.
4.2 Manipulation in the Brent Crude Oil Futures
Market
Table 4.2: Trading-induced manipulation in Brent crude oil futures market
Parameters Variable Coefficient Std. Error t-statistic Prob.
α0 Constant 184244.4 4746.048 38.82059 0.0000
α1 JUN_2012 48750.27 10885.63 4.478404 0.0000
α2 JULY_2012 20784.24 7536.258 2.757899 0.0061
α3 AUG_2012 18051.40 7329.186 2.462947 0.0142
α4 SEPT_2012 -3902.757 11329.81 0.344468 0.7307
α5 OCT_2012 37767.361 9364.317 0.402310 0.6877
α6 NOV_2012 1359.668 12440.42 0.109294 0.9130
α7 DEC_2012 -18687.58 18529.68 1.008521 0.3138
α8 POSTM_2013 1667.117 6922.285 0.240833 0.8098
Adjusted R2
0.073479
F-Stat 5.014893
Notes: Result from the above OLS regression model (expanded from Eq. (4)): Vt = α0 + α1
JUN2012 + α2 JUL2012 + α3 AUG2012 + α4 SEP2012 + α5 OCT2012 + α6 NOV2012 + α7
DEC2012 + α8 POSTM2013 + et where the dependent variables Vt is the volume of the day t.
Month dummies are taken to capture the manipulations. SEP2012 is when the price crashed.
Standard errors of the estimated coefficients are corrected for autocorrelation and
heteroskedasticity by using the Newey-West methods (with lag truncation = 6). Sample covers the
period from September 2011 to March 2013 with 406 daily observations.
Page 25 of 40
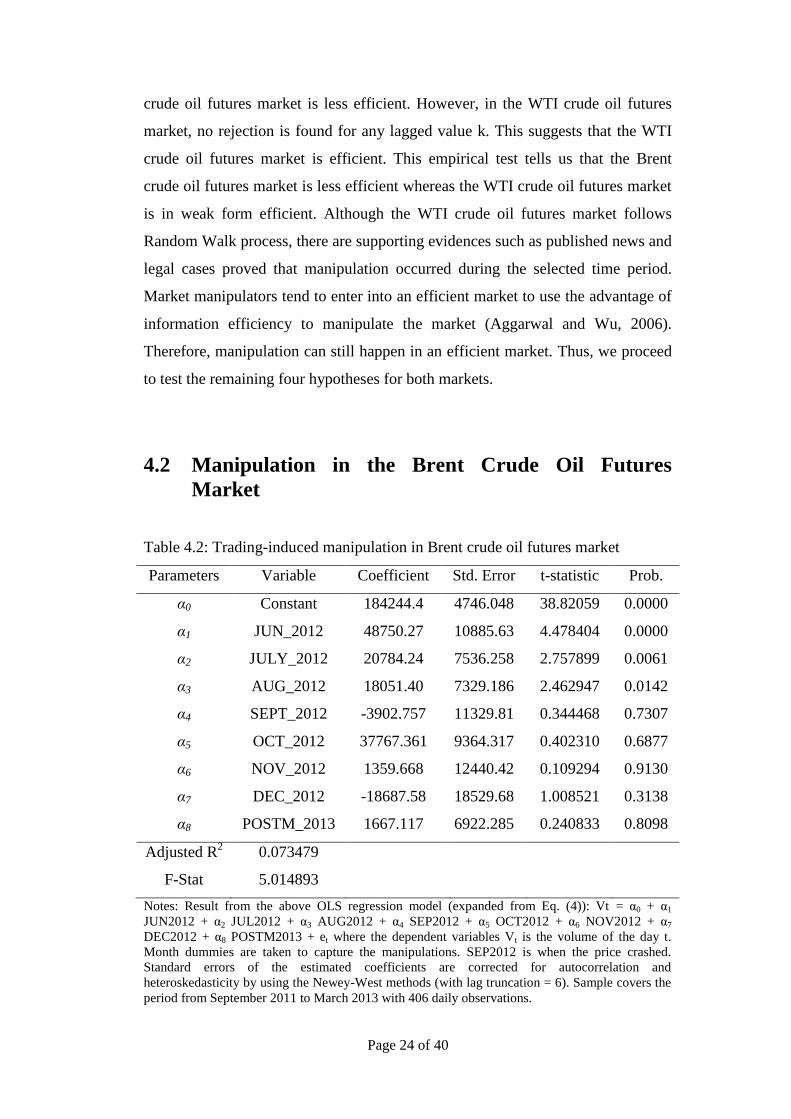
Referring to the Bloomberg news (Voris, Nguyen and Olson, 2013) the
manipulation was happened during September 2012. We then consider the
manipulation period, one year before and six months after September 2012. Table
4.2 shows the results of Brent crude oil futures estimated from Equation (4) during
September 2011 - March 2013.
As shown in Table 4.2, it indicates that monthly dummies which is capturing the
period before September 2012 crash namely June 2012, July 2012 and August
2012 have large coefficients and statistically significant. This result supports
hypothesis of H2 that the trading volume increases significantly before crash and
throughout the beginning of the manipulation. With this result, we can say that the
manipulation has begun since June 2012.
Next, insignificant dummy of September 2012 provides the relatively small
coefficient of -3902.757 shows that trading volume has dropped significantly
during the crash. Besides that, dummies of October 2012, November 2012,
December 2012 and post-manipulation 2013 has the relatively small coefficient
values are found to be insignificant even at the 10% level. These insignificant
dummies indicate that there was a significantly decline in trading volume by
comparing to pre-manipulation’s (June 2012, July 2012 and August 2012). This
supports hypothesis of H4, where the trading volume was declined during the
post-manipulation period.
Page 26 of 40
Table 4.3: Manipulations and price-volume relationship for Brent crude oil futures market
Parameters Variable Coefficient Std. Error t-statistic Prob.
b0 Constant 0.037729 0.017011 2.217904 0.0271
b1 Volume -0.005646 0.002843 -1.986088 0.0477
b2 Volume (-1) -0.001719 0.002841 -0.605040 0.5455
b3 Return (-1) -0.104929 0.050465 -2.079258 0.0382
b4 SLOPE_JUN_2012 -0.000101 0.000605 -0.167127 0.8674
b5 SLOPE_JUL_2012 0.001025 0.000597 1.716878 0.0868
b6 SLOPE_AUG_2012 0.001033 0.000581 1.779390 0.0759
b7 SLOPE_SEP_2012 -0.000191 0.000630 -0.302542 0.7624
b8 SLOPE_OCT_2012 -0.000156 0.000584 -0.267635 0.7891
b9 SLOPE_NOV_2012 0.000338 0.000598 0.565382 0.5721
b10 SLOPE_DEC_2012 -9.22E-05 0.000642 -0.143584 0.8859
Adjusted R2
0.008466
F-Stat 1.344100
Notes: Results from the following OLS regression model (expanded from Eq. (5)): Rt = b0 + b1Vt + b2Vt−1 + b3Rt−1 + b4 SLOPEJUN2012 + b5 SLOPEJUL2012 + b6
SLOPEAUG2012 + b7 SLOPESEP2012 + b8 SLOPEOCT2012 + b9 SLOPENOV2012 + b10 SLOPEDEC2012 + et where, Rt is the return on day t and Vt is the volume on day t.
SEP2012 is when the price crashed. The lagged volume and lagged returns are included following Lee and Rui (2002). Standard errors of the estimated
coefficients are corrected for autocorrelation and heteroskedasticity by using the Newey–West method (lag truncation = 6). Sample covers the period from
September 2011 to March 2013 with 406 daily observations.
Page 27 of 40
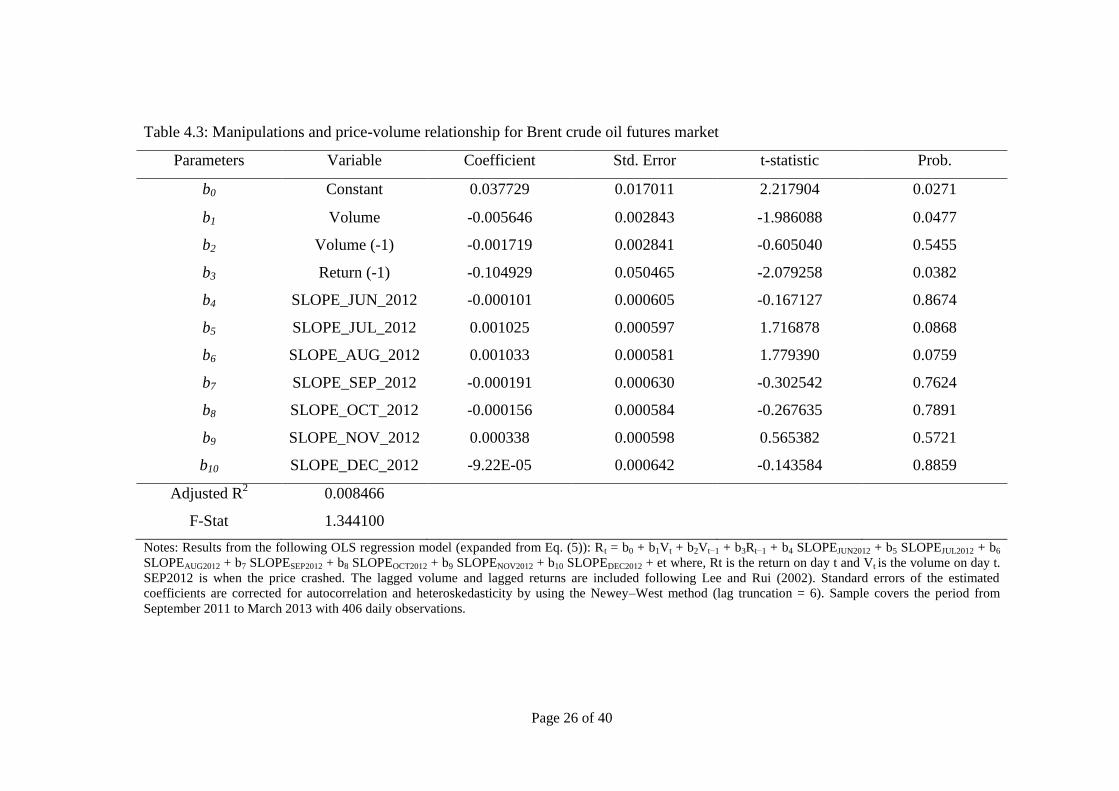
Table 4.3 shows the estimated results of price-volume relationship for Brent crude
oil futures market by using Equation (5). As observed in Table 4.3, the slope
dummies of July 2012 and August 2012 are statistically significant at 10%. The
coefficients of 0.001025 and 0.001033 for both dummies indicate that increase in
volume in July and August 2012 was accompanied by huge increase in price. This
finding supports hypothesis of H3, indicating that there is a positive price-volume
relationship at the start of the manipulation.
In addition, the slope dummy of September 2012 is found to be statistically
insignificant with negative sign of coefficient. This shows that there is no price-
volume relationship at the post manipulation period. Thus, hypothesis of H5 is not
supported. For a series of volume, coefficient of -0.005646 suggests that there is
no price-volume relationship in the pre-manipulation period from June 2012 to
August 2012.
Page 28 of 40
4.3 Manipulation in the WTI Crude Oil Futures Market
Table 4.4: Trading-induced manipulation in WTI crude oil futures market
Parameters Variable Coefficient Std. Error t-statistic Prob.
α0 Constant 222146.8 6044.530 36.75171 0.0000
α1 SEPT_2007 38398.35 11253.28 3.412192 0.0007
α2 OCT_2007 51459.13 12649.32 4.068135 0.0001
α3 NOV_2007 76429.13 22249.33 3.435121 0.0007
α4 DEC_2007 -38.83787 35137.91 -0.001105 0.9991
α5 JAN_2008 47245.84 10996.60 4.296403 0.0000
α6 FEB_2008 45046.54 11095.55 4.059874 0.0001
α7 MAR_2008 91669.81 15437.20 5.938242 0.0000
α8 POSTM_2008 79351.39 15130.02 5.244633 0.0000
Adjusted R2
0.010249
F-Stat 1.406941
Notes: Result from the above OLS regression model (expanded from Eq. (4)): Vt = α0 + α1
SEP2007 + α2 OCT2007 + α3 NOV2007 + α4 DEC2007 + α5 JAN2008 + α6 FEB2008 + α7
MAR2008 + α8 POSTM2008 + et where the dependent variables Vt is the volume of the day t.
Month dummies are taken to capture the manipulations. DEC07 is when the price crashed.
Standard errors of the estimated coefficients are corrected for autocorrelation and
heteroskedasticity by using the Newey-West methods (with lag function = 6). Sample covers the
period from December 2006 to June 2008 with 396 daily observations.
For the case of WTI, the legal case of CFTC versus Parnon Energy Inc. & Anors
has identified month that manipulation happened was during December 2007. We
then consider the sub period: one year before the manipulation happened and six
months after the manipulation happened. Table 4.4 shows the results of WTI
crude oil futures market estimated from Equation (4) during December 2006 to
June 2008.
As shown in Table 4.2, it indicate that monthly dummies which are capturing the
period before December 2007 crash namely September 2007, October 2007 and
November 2007 are statistically significant and have large coefficients. This result
supports hypothesis of H2 that the trading volume increases significantly before
crash and throughout the beginning of manipulation. With this result, we can say
that the manipulation has begun since September 2007
Page 29 of 40
Next, insignificant dummy of December 2007 provides the relatively small
coefficients of -38.83787 shows that trading volume has dropped significantly
during the crash. Besides that, dummies of January 2008, February 2008, March
2008 and post-manipulation 2008 have the relatively small coefficient values.
These dummies indicate that there was a significantly decline in trading volume
by comparing to pre-manipulation’s (September 2007, October 2007 and
November 2007). This supports hypothesis of H4, where the trading volume was
declined during the post-manipulation period.
Page 30 of 40
Table 4.5: Manipulations and price-volume relationship for WTI crude oil futures market
Parameters Variable Coefficient. Std. Error t-statistic Prob.
b0 Constant -0.002414 0.022751 -0.106124 0.9155
b1 Volume -0.006682 0.004751 -1.406493 0.1604
b2 Volume (-1) 0.007514 0.004676 1.607156 0.1088
b3 Return (-1) -0.103551 0.050502 -2.050427 0.0410
b4 SLOPE_SEP_2007 0.000710 0.000831 0.854133 0.3936
b5 SLOPE_OCT_2007 0.000855 0.000758 1.127932 0.2601
b6 SLOPE_NOV_2007 -0.001003 0.000791 -1.268164 0.2055
b7 SLOPE_DEC_2007 0.000342 0.000843 0.405945 0.6850
b8 SLOPE_JAN_2008 -0.000771 0.000791 -0.974294 0.3305
b9 SLOPE_FEB_2008 0.000616 0.000810 0.760023 0.4477
b10 SLOPE_MAR_2008 -0.000354 0.000807 -0.439038 0.6609
Adjusted R2
0.007753
F-Stat 1.307064
Notes: Results from the following OLS regression model (expanded from Eq. (5)): Rt = b0 + b1Vt + b2Vt−1 + b3Rt−1 + b4 SLOPESEP2007 + b5 SLOPEOCT2007 + b6
SLOPENOV2007 + b7 SLOPEDEC2007 + b8 SLOPEJAN2008 + b9 SLOPEFEB2008 + b10 SLOPEMAR2008 + et where, Rt is the return on day t and Vt is the volume on day t.
DEC2007 is when the price crashed. The lagged volume and lagged returns are included following Lee and Rui (2002). Standard errors of the estimated
coefficients are corrected for autocorrelation and heteroskedasticity by using the Newey–West method (lag truncation = 6). Sample covers the period from May
2006 to June 2008 with 394 daily observations.
Page 31 of 40
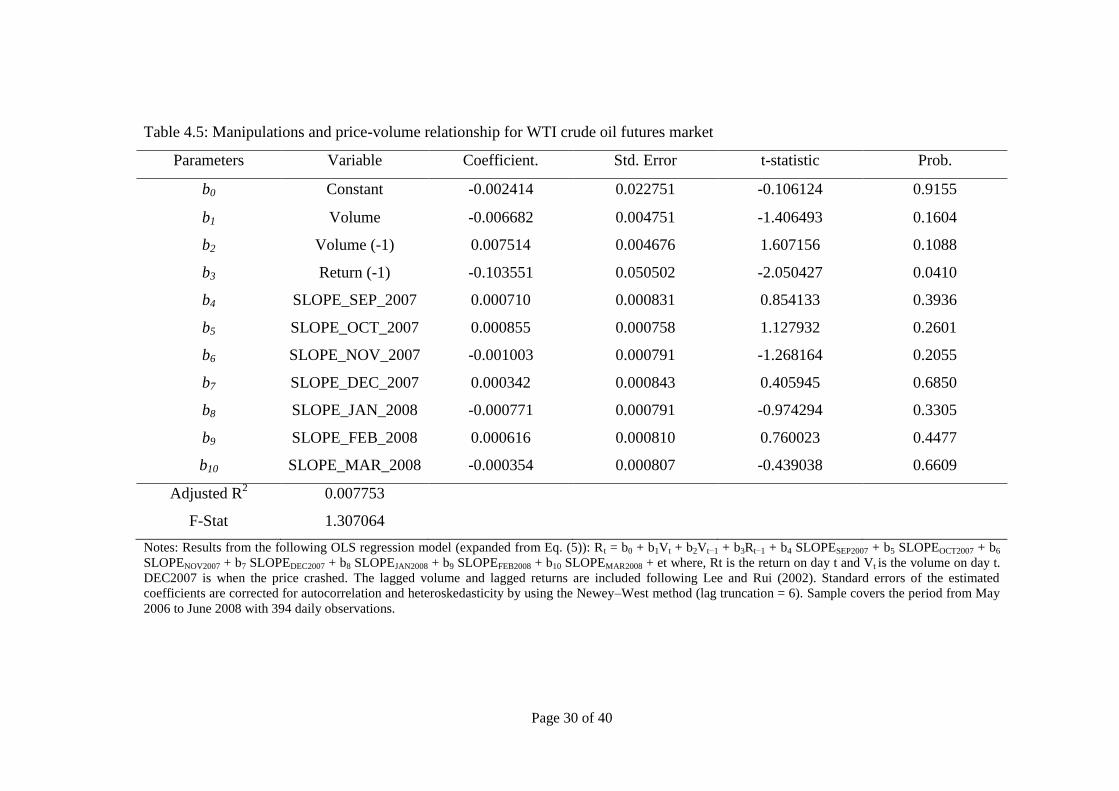
Table 4.5 shows the estimated results of price-volume relationship for WTI crude
oil futures market using Equation (5). As observed in Table 4.5, the slope
dummies of September 2007, October 2007 and November 2007 are statistically
insignificant at 10%. The positive coefficients of 0.000710 and 0.000855 for
September and October 2007 indicate that there is no increase in volume
accompanied by huge increase in price. This finding does not support hypothesis
of H3, no positive price-volume relationship is observed.
In addition, the slope dummy of December 2007 is found to be statistically
insignificant with positive sign of coefficient. This shows that there is no price-
volume relationship at the post manipulation period. Thus, hypothesis of H5 is not
supported. For a series of volume, coefficient of -0.006682 suggests that there is
no price-volume relationship in the pre-manipulation period from September 2007
to November 2007.
4.4 Comparison between manipulation in the Brent and
WTI Crude Oil Futures Markets
Table 4.6: Summary of hypotheses results
Hypothesis Brent WTI
H1: Informational inefficiency is
found in the market. Support Not Support
H2: Trading volume increases
during pre-manipulation. Support Support
H3: Positive price-volume
relationship before crash. Support Not Support
H4: Trading volume declines
during post-manipulation. Support Support
H5: Negative price-volume
relationship after crash. Not Support Not Support
Page 32 of 40
For hypothesis of H1, as compared between market efficiency for Brent and WTI
futures market which is measured by Variance-Ratio (VR) test, the Brent futures
market is found to be less efficient. This indicates that WTI futures market is more
efficient than the Brent futures market. By referring to the supporting evidences
from the legal case CFTC versus Parnon Energy Inc. & Anors, although VR test
shows that WTI is in the weak form market efficiency, market participants still
have opportunities to manipulate the market. In this regard, this study proceeds to
test price-volume relationship during the selected manipulation period.
For hypothesis of H3, before the crash period, price and volume in the Brent
futures market has positive relationship. However, both price and volume in the
WTI futures market are found to be as independent. This is due to different market
characteristics between the Brent and WTI futures markets. For example, WTI is
used as a benchmark in United States and Brent is used by approximately two-
third of participants around the world. Participants in WTI crude oil market can
switch to Brent crude oil market as benchmark, but participants of Brent futures
market cannot switch to WTI futures market for benchmarking purpose.
Hypothesis of H3 is found to be not supported in the WTI futures market. The
reason is crude oil for WTI is extracted from wells located in United States by
using land-locked approach and is refined at Gulf Coast and Midwest region in
United States. While, crude oil for Brent is extracted from North Sea (Brent,
Forties, Oseberg, Ekofisk) via water-borne approach and is refined at Northwest
of Europe.
With different sources of supply, crude oil price in the Brent market is more
expensive than the WTI market, where buyers of crude oil are willing to pay a
higher price to the crude oil which has lower transportation cost. Due to the
pricing gap between Brent and WTI, when the price of WTI is closer to Brent
during the pre-manipulation period, market participants switch from WTI to Brent
crude oil futures market.
Page 33 of 40
For Hypothesis of H5, there is no price-volume relationship in both Brent and
WTI futures markets after the manipulation period. The reason is due to structure
differences between stocks and crude oil markets. Stock investors normally seek
for income earnings from capital gains and dividends. Thereby, after the price
crashes, investors will exit the market due to psychological behavior and
minimizing their losses. They may not enter into the market for a certain period.
This causes a large increase in the stock market volume due to the excessive
selling. At the same time, manipulators will re-enter into market to purchase those
stocks with low price in order to make sure their ownerships are undiluted.
Furthermore, in both crude oil futures market, no negative relationship between
price and volume is found after the price crash in post-manipulation period
because there is no excessive selling of contracts.
Market participants anticipate that price to rebound after the price crash. Besides,
they can enter long position or short position where the long party expects the
price to increase while the short party expects the price to decrease in future.
Therefore, after the price crash in the post-manipulation period, market
participants can easily switch from long position to short position or even close up
their position. This leads to no negative relationship between price and volume
after crash.
Other than making profits from price changes, market participants enter into the
markets for the consumption of crude oils. It is used in daily fuelling activities,
transporting and manufacturing. The crude oil futures market is also depends on
its supply and demand. Therefore, the price of the market will not be as volatile as
stock market at the end of the manipulation period.
Page 34 of 40
CHAPTER 5: CONCLUSION
5.1 Major Findings
As overall, this study concludes that the Brent crude oil futures market is
inefficient. It is possible that manipulation is occurred from January 2005 to
December 2014. Based on empirical results in testing five hypotheses, we find
three findings.
First, Brent futures market is inefficient and WTI futures market is found to be
efficient. By referring to the supporting evidences from the legal case CFTC
versus Parnon Energy Inc. & Anors., although VR test shows that WTI is in the
weak form market efficiency, market participants still have opportunities to
manipulate the market.
Second, hypothesis of H3 is found to be supported for Brent futures market. There
is a positive price and volume relationship in the post-manipulation period where
the trading volume increases with increasing of price and trading volume
decreases after the price crash. The supporting hypothesis of H3 indicates that the
existence of pump and dump scheme where trading volume increases significantly
during the manipulation period and declines during the post-manipulation period.
However, the pump and dump scheme is not found during the manipulation period
in the WTI futures market due to both price and volume do not has relationship.
Third, hypothesis of H5 is not supported for both futures markets. After the price
crash, no sign of negative relationship between price and volume is observed. The
reason resulting to this contrast of findings is due to difference of market structure
between stocks market and crude oil futures market. For instance, short selling is
prohibited in stocks market. So, stock market participants are unable to make
profits like futures market participants when the stock price dropping.
Page 35 of 40
5.2 Policies Implications
Commodities Futures Trading Commission (CFTC) plays an important role to
solve market manipulation because the issue of manipulation is now associating
with futures market. In futures market, manipulators use the loopholes in the
regulations to artificially influence price and volume to earn abnormal profits.
Therefore, CFTC should consistently monitor both Brent and WTI crude oil
futures markets because both markets are interrelated.
Moreover, CFTC should aware of any unusual market activities such as large
increase of volume which causes the movement of the price. For example, they
should take intermediate investigation to capture the unusual market activities. If
the price movement is caused by other than the factor of supply and demand, it
indicates that there is a high chance of manipulation.
In addition, CFTC should have the new technology on hands and knowing the
trading patterns in the market. So far, there is no single database that provides
access to all market orders and executions. Thus, CFTC should seek for more
efficient access to data through a far more effective market order and execution
trading system. Furthermore, punishments against the manipulators should be
taken to protect uninformed, small and weak market participants. With these
practices, the crude oil futures market will be more efficient and operate in fair
condition.
5.3 Recommendations
This study suggests two recommendations for future researchers. First, since this
study emphasizes on trading based manipulation, therefore, we suggests that
future researchers should focus on action based manipulation and information
based manipulation. This is because there are insufficient studies on market
manipulation especially for crude oils.

Page 36 of 40
Second, future researchers should examine market manipulation for major traded
vegetable oils such as crude palm oil and soybean oil because they have different
characteristics in terms of transportation cost, storage cost and lifespan. Moreover,
vegetable oil is important to fulfill the global consumptions of oil and fats in
producing food, manufactured products and biodiesel.

Page 37 of 40
REFERENCES
Abrantes-Metz, R. M. & Addanki, S. (2007). Is the market being fooled? An
error-based screen for manipulation. Social Science Research Network, 9
(3), 1-51.
Aggarwal, R. K., & Wu, G. (2006). Stock market manipulation. The Journal of
Business, 79 (4), 1915-1953.
Allen, F., & Gale, D. (1992). Stock price manipulation. The Review of Financial
Studies, 5 (3), 503-529.
Bessembinder, H., and Seguin, P. J. (1993). Price volatility, trading volume and
market depth: Evidence from futures markets. Journal of Financial and
Quantitative Analysis, 28 (1), 21-39.
Bommel, J. V. (2003). Rumors. The Journal of Finance, 58 (4), 1499-1519.
Brailsford, T.J. (1996). An evolution of volatility forecasting techniques. Journal
of Banking & Finance, 20 (3), 419-438.
Charles, A., & Darne, O. (2009). The efficiency of the crude oil markets:
Evidence from variance ratio tests. Energy Policy, 37 (3), 4267-4272.
Chevallier, J., & Sévi, B. (2012). On the volatility–volume relationship in energy
futures markets using intraday data. Energy Economics, 34 (6), 1896-
1909.
Clark, P. K. (1973). Subordinated stochastic process model with finite variance
for speculative prices. Journal of The Econometric Society, 41 (1), 135-
155.
Cornell, B. (1981). The relationship between volume and price variability in
futures markets. Journal of Futures Markets, 1 (3), 303-316.Ying., C. C.
(1966). Stock market prices and volumes of sales. Journal of The
Econometric Society, 34 (3), 676-685.
Cooper, M., Downs, D. H., and Patterson, G. A. (2000). Asymmetric information
and the predictability of real estate return. The Journal of Real Estate
Finance and Economics, 20 (2), 225-244.
Page 38 of 40
Copeland, T. E. (1976). A model of asset trading under the assumptions of
sequential information arrival. The Journal of Finance, 31 (4), 1149-
1168.
DeLong, J. B., Shleifer, A. , Summers, L. H., and Waldmann, R. J. (1990). Noise
trader risk in financial markets. Journal of Political Economy. 23 (2),
703-738.
Dulaimi, H. A. M. (2014). The collapse of crude oil prices: Cyclical evolition or
market manipulation? Economic Insights, 3 (4), 89-96.
Easler, D., Kiefer, N. M., & O'Hara, M. (1997). One day in the life of a very of
common stock. Journal of Finance, 47 (2), 577-604.
Epps, T. W. (1975). Security price changes and transaction volumes: Theory and
Evidence. American Economic Review, 65 (1), 586-597.
Fama, E. F. (1969). Efficient capital markets: A review of theory and empirical
work. The Journal of Finance, 25 (2), 28-30.
Foster, A. J. (1995). Volume-volatility relationships for crude oil futures market.
Journal of futures Markets, 15 (8), 929-951.
Fujihara, R. A., & Mougoué, M. (1997). An examination of linear and nonlinear
causal relationships between price variability and volume in petroleum
futures markets. Journal of Futures Markets, 17(4), 385-416.
Gallant, A. R., Rossi, P. E., and Tauchen, G. (1992). Stock price and volume.
Review of Financial Studies, 5 (2), 199-242.
Grammatikos, T., & Saunders, A. (1986). Futures price variability: A test of
maturity and volume effects. The Journal of Business, 59 (2), 319-330.
Gosden, E. (2013). BP and Shell 'rigged Brent oil price for a decade', traders claim.
Retrieved July 9, 2015 from
http://www.telegraph.co.uk/finance/newsbysector/energy/10429918/BP-
and-Shell-rigged-Brent-oil-price-for-a-decade-traders-claim.html
Page 39 of 40
He, L. Y., Yang, S., Xie, W. S., and Han, Z. H. (2014). Contemporaneous and
asymmetric properties in the price volume relationship in China's
agricultural furtures market. Emerging Market Finance & Trade, 50 (1),
148-166.
Karpoff , J. M. (1987). The relation between price changes and trading volume: A
survey. Journal of Financial and Quantitative, 22 (1), 109-126.
Khwaja, A. I., & Mian, A. (2005). Unchecked intermediaries: Price manipulation
in an emerging stock market. Journal of Financial Economics, 78 (2),
203-241.
Kocagil, A. E., & Shachmurove, Y. (1998). Return-Volume dynamics in futures
markets. Journal of Futures Markets, 18 (4), 399-426.
Lee, B. S., & Rui, O. M. (2002). The dynamic relationship between stock returns
and trading volume: Domestic and cross-country evidence. Journal of
Banking & Finance, 26 (1), 51-78.
Lo, A. and MacKinlay, A. (1988). Stock market prices do not follow random
walks: Evidence from a simple specification tets. Review of Financial
Studies, 1 (1), 41-66.
Moosa, I. A., & Silvapulle, P. (2000). The price–volume relationship in the crude
oil futures market Some results based on linear and nonlinear causality
testing. International Review of Economics & Finance, 9 (1), 11-30.
Moosa, I. A., Silvapulle, P., & Silvapulle, M. (2003). Testing for Temporal
Asymmetry in the Price‐Volume Relationship. Bulletin of Economic
Research, 55 (4), 373-389.
Nicolau, M., Palomba, G., and Traini, I. (2013). Are futures prices influenced by
spot prices or vice-versa? An analysis of crude oil, natural gas and gold
markets. Department of Economic and Social Sciences, 3 (2), 1-23.
Ogut, H., Doganay, M. M., Ceylan, N. B., & Aktas, R. (2012). Prediction of bank
financial strength ratings: The Turkish case. Economic Modelling, 29 (1),
632-640.
Page 40 of 40
Pathirawasam, C. (2011). The relationship between trading volume and stock
returns. Journal of Competitiveness, 11 (3), 41-49.
Stickel, S. E., & Verrecchia, E. (1994). Evidence that trading volume sustains
stock price changes. Financial Analysts Journal, 50 (6), 57-67.
Smirlock, M., and Starks, L. (1985). A further examination of stock price changes
and transactions volume. Journal of Financial Research, 8 (3), 217-226.
Tauchen, G. E., & Pitts, M. (1983). the price variability-volume relationship on
speculative markets. Journal of The Econometric, 51 (2), 485-505.
Vorris, B.V., Nguyen, L., and Olson, B. (2013). Brent crude traders claim proof
BFOE Boys rigged market. Retrieved May 8, 2015 from
http://www.bloomberg.com/news/articles/2013-11-06/brent-crude-
traders-claim-proof-bfoe-boys-rigged-market
Wang, J. (1994). A model of competitive stock trading volume. Journal of
Political Economy, 102 (2), 127-168.
Wood, R. A., Mclnish, T. H., & Ord, J.K. (1985). An investigation of transactions
data for NYSE stocks. The Journal of Finance, 40 (3), 723-739.
Ying, C. C. (1966).Stock market prices and volumes of sales. Journal of the
Economic Society, 34 (3), 676-685.
Zhang, Y. J., & Wei, Y. M. (2010). The crude oil market and the god market:
Evidence for cointegration, causality and price discovery. Resources
Policy, 35 (3). 168-177.


![What's the difference between WTI and Brent Crude Oil? [PPT]](https://img.dokumen.tips/doc/110x75/589ff76a1a28ab46598b5a77/whats-the-difference-between-wti-and-brent-crude-oil-ppt.jpg)