Embed Size (px)
Citation preview

Manifestation of Chaos in Real ComplexSystems: Case of Parkinson’s Disease
Renat M. Yulmetyev1, Sergey A. Demin1, and Peter Hanggi2
1 Department of Physics, Kazan State Pedagogical University, 420021 Kazan,Mezhlauk Street, 1 Russia [email protected], [email protected]
2 Department of Physics, University of Augsburg, Universitatsstrasse 1, D-86135Augsburg, Germany
In this paper we present a new approach to the research of manifestations ofchaos in real complex system. Recently we have achieved the following infor-mation. In real complex systems the informational measure of chaos (IMC)can serve as a reliable quantitative estimation of the state of a complex systemand help to estimate the deviation of this state from its normal condition.As the IMC we suggest the statistical spectrum of the non-Markovity pa-rameter (NMP) and its frequency behavior. Our preliminary studies of realcomplex systems in cardiology, neurophysiology and seismology have shown,that the NMP has diverse frequency dependence. It testifies to the competi-tion between Markovian and non-Markovian, random and regular processesand makes a crossover from one relaxation scenario to the other possible. Onthis basis we can formulate the new concept in the study of the manifestationof chaos. We suggest the statistical theory of discrete non-Markov stochasticprocesses to calculate the NMP and the quantitative evaluation of the IMCin real complex systems. With the help of the IMC we have found out theevident manifestation of chaos in a normal (healthy) state of the studied sys-tem, its sharp reduction in the period of crises and catastrophes and varioushuman diseases. It means, one can improve the state of a patient (of any sys-tem) appreciably by increasing the IMC of the studied live system. The givenobservation creates a reliable basis for predicting crises and catastrophes, aswell as for diagnosing and treatment various human diseases, Parkinson’sdisease, in particular.
1 Introduction
Today the research of manifestations of chaos in real complex systems of di-verse nature has acquired great importance. The analysis of some propertiesand characteristics of real complex systems is impossible without quantita-tive estimate of various manifestation of chaos. The dynamics or evolution ofthe system can be predicted by the change of its chaosity or regularity. Thediscovery of the phenomenon of chaos in dynamic systems has changed theattitude to the functioning of complex systems, a human organism, in par-ticular. The chaos is the absence of regularity. It characterizes randomness

2 Renat M. Yulmetyev, Sergey A. Demin, and Peter Hanggi
and unpredictability of changes of the behavior of a system. At the sametime, the presence of chaos in dynamic systems does not mean it can notbe taken under control. Instability of dynamic systems in the state of chaoscreates special sensitivity to both external and internal influences and per-turbations. The series of weak perturbations of the parameters of the systemallows to change its characteristics in the required direction. ”Chaos” is fre-quently understood as a determined dynamic chaos, that is, the dynamicsdependent on the initial conditions, parameters.
Lasers, liquid near to a threshold of turbulence, devices of nonlinear optics,chemical reactions, accelerators of particles, classical multipartite systems,some biological dynamic models are the examples of nonlinear systems withthe manifestation of the determined chaos. Now manifestations of chaos arebeing studied in different spheres of human activity.
The control of the behavior of chaotic systems is one of the most importantproblems. Most of the authors see two basic directions in the solution of theproblems [1, 2]. Both directions envisage a preliminary choice of a certainperturbation. The selected perturbation is used to exercise influence on thechaotic system. The first direction is focused on an internal perturbation, thechoice of which is based on the state of the system. The perturbation changesthe parameter or the set of parameters of the system, which results in theordered behavior of the chaotic systems. The methods focused on the choice ofsuch parameters (perturbations) are referred to as ”methods with a feedback”[1]-[6]. They do not dependent on the studied chaotic system (model) asthese parameters can be selected by observing the system for some period oftime. The methods with a delayed feedback [3, 7] can also be referred to thefirst direction. The second direction presupposes that the choice of externalperturbation does not dependent on the state of the studied chaotic system.By affecting the studied system with the similar perturbation, it is possibleto change its behavior. The present group of methods is an alternative tothe first one. These methods can be used in cases when internal parametersdepend on the environment [1, 8, 9].
Generally, when choosing internal (external) perturbations it is possibleto determine three basic stapes: the estimation of the initial information,the choice of perturbation and the bringing the chosen strategy of controlinto action (its practical realization). At the first stage the information onthe state of the studied system is collected. At the second stage the receivedinformation is processed according to the plan or strategy of the control. Onthe basis of the achieved results the decision on the choice of the internal(of the external) perturbation is accepted. After that the chosen strategy ofchaos control is put into practice [2].
The initial idea of the present concept was to separate Markovian (withshort-range time memory) and non-Markovian (with long-range time mem-ory) stochastic processes. However, the study of real complex systems hasallowed to reveal additional possibilities of the given parameter. Actually,

Manifestation of Chaos in Real Complex Systems 3
the parameter of non-Markovity represents a quantitative measure of chaos-ity or regularity of various states of the studied system. The increase of thegiven parameter (ε1(0) À 1) corresponds to the increase of chaosity of thestate of the system. The decrease of the non-Markovity parameter charac-terizes greater ordering (regularity) of the state of the system. The givenobservation allows to define a new strategy of estimate of chaosity in realsystems. The new approach in the theory of chaos can be presented as analternative to the existing methods. Further analysis of the non-Markovityparameter allows to define the degree of chaosity or regularity of the state ofthe system.
In this work the new strategy for the study of manifestations of chaos isapplied to real complex systems. The possibilities of the new approach arerevealed at the analysis of the experimental data on various states of a humanorganism with Parkinson’s disease. Parkinson’s disease is a chronic progress-ing disease of the brain observed in 1-2 % of elderly people. The given diseasewas described in 1817 by James Parkinson in the book ”An essay on the shak-ing palsy”. In 19th century the French neurologist Pierre Marie Charcot calledthis disease ”Parkinson’s disease”. The steady progress of the symptoms andyearly impairment of motor function is typical of Parkinson’s disease. Com-plex biochemical processes characteristic of Parkinson’s disease result in thelack of chemical substance of dopamine mediator which is a carrier of signalsfrom one nerve cell to another. The basic symptoms typical of Parkinson’sdisease form the so-called classical triad: tremor, rigidity of muscles (disorderof speech, amimia), and depression (anxiety, irritability, apathy). The diseasesteadily progresses and eventually the patient becomes a helpless invalid. Theexisting therapy comprises a set of three basic treatments: medical treatment,surgical treatment and electromagnetic stimulation of the affected area of thebrain with the help of an electromagnetic stimulator. Today this disease isconsidered practically incurable. The treatment of patients with Parkinson’sdisease requires an exact estimate of the current state of the person. Theoffered concept of research of manifestations of chaos allows to track downthe least changes in the patient with the help of an exact quantitative levelof description.
Earlier we found out an opportunity for defining the predisposition of aperson to the frustration of the central nervous system due to Parkinson’sdisease [13]. Our work is an expansion and development of informationalpossibilities of the statistical theory of discrete non-Markov random processesand the search for parameters affecting the health of a subject.

4 Renat M. Yulmetyev, Sergey A. Demin, and Peter Hanggi
2 The statistical theory of discrete non-Markov randomprocesses. Non-Markovity parameter and its frequencyspectrum
The statistical theory of discrete non-Markov random processes [10]-[12]forms a mathematical basis for our study of complex live systems. The theoryallows to calculate the wide quantitative set of dynamic variables, correlationfunctions and memory functions, power spectra, statistical non-Markovityparameter, kinetic and relaxation parameters. The full interconnected set ofthese variables, functions and parameters creates a quantitative measure ofchaos used for the description of processes, connected with functioning ofalive organism.
We use the non-Markovity parameter ε as a quantitative estimate of thenon-Markov properties of the statistical system. The non-Markovity parame-ter allows to real statistical processes into Markov processes (ε →∞), quasi-Markov processes (ε > 1) and non-Markov processes (ε ∼1). Besides thenon-Markovity parameter we also use the concept of the spectrum of thenon-Markovity parameter. We define the spectrum as a set of all values ofthe physical parameter used for describing the state of a system or a process.Let’s consider the first and the nth kinetic equations of the chain of connectednon-Markov finite-difference kinetic equations [10, 11]:
∆a(t)∆t
= λ1a(t)− τΛ1
m−1∑
j=0
M1(jτ)a(t− jτ), (1)
· · ·∆Mn(t)
∆t= λn+1Mn(t)− τΛn+1
m−1∑
j=0
Mn+1(jτ)Mn(t− jτ).
The first equation is based on the Zwanzig’-Mori’s kinetic equation innonequilibrium statistical physics:
da(t)dt
= −Ω21
∫ t
0
dτM1(jτ)a(t− jτ). (2)
Here a(t) is a normalized time correlation function (TCF):
limt→0
a(t) = 1, limt→∞
a(t) = 0. (3)
The zero memory function a(t) and the first order memory function M1(t)in Eqn. (1):
M0(t) = a(t) =< A0
k(0)Amm+k(t) >
< |A0k(0)|2 >
, t = mτ,
M1(jτ) =< A0
k(0)L121 + iτ L22jL21A0k(0) >
< A0k(0)L12L21A0
k(0) >, M1(0) = 1.

Manifestation of Chaos in Real Complex Systems 5
A0k(0) = (δx0, δx1, δx2, · · · , δxk−1),
Amm+k(t) = δxm, δxm+1, δxm+2, · · · , δxm+k−1,
describes statistical memory in complex systems with a discrete time (A0k(0)
and Amm+k(t) are the vectors of the initial and final states of the studied
system). The operator L is a finite-difference operator:
iL =44t
, 4t = τ,
where τ is a discretization time step, Lij = ΠiLΠj (i, j = 1, 2) are matrixelements of the splittable Liouville’s quasioperator, Π1 = Π, Π2 = P = 1−Πand Π are projection operators.
Let’s define the relaxation times of the initial TCF and of the first-ordermemory functions as follows M1(t):
τa = Re
∫ ∞
0
a(t)dt, τM1 = Re
∫ ∞
0
M1(t)dt, · · · , τMn= Re
∫ ∞
0
Mn(t)dt. (4)
Then the spectrum of non-Markovity parameter ε is defined as an infi-nite set of dimensionless numbers:
εi = ε1, ε2, ..., εn, ...,ε1 = τa/τM1 , ε2 = τM1/τM2 , · · · , εn = τMn/τMn+1 ,
ε = τrel/τmem. (5)
Note, that a(t) = M0(t). The number εn characterizes the ratio of relaxationtimes of the memory functions Mn and Mn+1. If at some n the value ofthe parameter εn → ∞, then this relaxation level is Markov. If εn changesin limits from zero to a unit value, then the relaxation level is defined asnon-Markov. The times τrel (relaxation time) and τmem (memory life time)appear when the effects of the statistical memory in the complex discretesystem are taken into account by means of the Zwanzig’-Mori’s method ofkinetic equations. Thus, the non-Markovity parameter spectrum is definedby the stochastic properties of the TCF.
In the work [10] the concept of the generalized non-Markovity parameterfor a frequency - dependent case:
εi(ω) =
µi−1(ω)µi(ω)
12
(6)
was introduced. Here as µi(ω) we have the frequency power spectrum of ithmemory functions: µ1(ω) = |Re
∫∞0
M1(t)eiωtdt|2, · · · , µi(ω) = |Re∫∞0
Mi(t)eiωtdt|2.The use of εi(ω) allows to find the details of the frequency behavior of
the power spectra of time correlations and memory functions.

6 Renat M. Yulmetyev, Sergey A. Demin, and Peter Hanggi
3 The universal property of informational manifestationof chaos in complex systems
In our work the discussion of manifestation of chaos is carried out on thebasis of a statistical invariant which includes a quantitative informationalmeasure of chaos and pathology in a covariant form. The existence of thegiven invariant is very important for the decision of the problems existingin medicine, and for the analysis of a wide circle of problems of physics ofcomplex systems of various nature.
In each live organism there is a universal informational property of thefollowing form:
IMC + IMP = Invariant. (7)
Here IMC is a informational (quantitative) measure of chaos for the givenconcrete live system, IMP is an informational measure of a pathological stateof a live organism. As an informational (quantitative) measure of the degreeof chaosity (regularity) we offer to use the first point of the non-Markovity
parameter at zero frequency: ε1(0) =
µ0(0)µ1(0)
12. The physical sense of the
given parameter consists in comparing the relaxation scales of the time cor-relation function (a(ω)) to the memory functions of the first order (µ(ω)).Depending on the values of this parameter one can discriminate Markov pro-cesses (with short-range memory) and non-Markov processes (with effectslong-range memory). Thus, the phenomena distinguished by the greatestchaosity correspond to Markov processes. Non-Markov processes are con-nected with greater regularity. The informational measure of a pathologicalstate (IMP) defines the qualitative state of a real live system.
The quantitative estimate of the degree of the chaosity of system IMCcontains the information on a pathological state of the system. It testifiesto the close interrelation of the given quantities. A high degree of chaosityis characteristic of a normal physiological state. In a pathological state thedegree of chaosity decreases. A high degree of regularity is typical of thiscondition. Thus, the quantitative estimate of chaos in live systems allows todefine their physiological or pathological state with a high degree of accuracy.In the right part of Eqn. (7) we have a statistical invariant, which reflectsindependence of the physical (as well as biophysical, biochemical and biolog-ical) laws in the given live organism from the concrete situations as well asthe methods of description of these situations. The invariance, submitted inEqn. (7), is formulated as the generalization of the experimental data. Amongother physical laws the properties of invariance reflect the most general andprofound properties of the studied systems and characterize a wide sphere ofphenomena. Eqn. (7) reflects an informational observation. It consists of twoinformational measures: the measure of chaos and the measure of pathology(disease).
Let’s use the operator of transformation T (S′, S) in both parts of Eqn.(7). It reflects the transition of the system from one state S to other S′. By
Manifestation of Chaos in Real Complex Systems 7
taking into account the statistical invariance I(S′) = T (S′, S)I(S) = I(S) inthe right part Eqn. (7) we receive:
∆P = P (S′)− P (S) = −∆C = −C(S′)− C(S),∆P + ∆C = 0. (8)
Here the following designations are entered : I(S) = Invariant, P (S) =IMP (S) is an informational measure of pathology (of disease) for the givenstate S, C(S) = IMC(S) is an informational measure of chaos for the givenstate of patient S. Besides in Eqn. (8) into account we take the rules oftransformation:
C(S′) = T (S′, S)C(S), P (S′) = T (S′, S)P (S). (9)
Eqns. (7)-(9) are rather simple but they make the quantitative descrip-tion of the state of a patient possible, both during the disease and under themedical treatment. Eqns. (7)-(9) have a general character. They are true formany complex natural and social systems. It is possible to develop the algo-rithms of prediction of various demonstrations of chaos in complex systemsof diverse nature on the basis of these equations.
4 The quantitative factor of quality of treatment
One of the major problems of the medical physics consists in the develop-ment of a reliable criterion of quality of medical treatment, diagnostics andforecasting of the behavior of real live complex systems. As one can see fromthe previous section, the criterion should include the parameter of the de-gree of randomness in a live organism. The creation of a quantitative factorof the quality of treatment QT is based on the law of behavior of the non-Markovity parameter ε1(0) in the stochastic dynamics of complex systems.The greater values of the parameter ε1(0) are characteristic of stable physio-logical states of systems. The minimal values of this parameter are peculiarfor pathological states of live systems. Thus, by the increase or reductionof the non-Markovity parameter one can judge the physiological state of alive organism with a high degree of accuracy. Therefore the non-Markovityparameter allows to define a deviation of the physiological state of a systemfrom a normal state.
The factor QT defines the efficacy or the quality of the treatment and isdirectly connected with the changes in the quantitative measure of chaos ina live organism. We shall calculate it on a concrete example. Let us consider1 as the patient’s state before therapy, and 2 the state of the patient aftercertain medical intervention. Then ε1(1) and ε1(2) represent quantitativemeasures of chaosity for the physiological states 1 and 2. The ratio δ of thesevalues (δ = ε1(2)
ε1(1)) will define efficacy of therapy. Various j processes occur
simultaneously in therapy. Therefore the total value of δ can be defined inthe following way:

8 Renat M. Yulmetyev, Sergey A. Demin, and Peter Hanggi
δ =n∏
j=1
εj1(2)
εj1(1)
, (10)
where j = 1, 2...n is the number of the factors affecting the behavior ofthe non-Markovity parameter. However, the natural logarithm ln δ is moreconvenient for use.
Then we have:
δ > 1, ln δ > 0;δ = 1, ln δ = 0;δ < 1, ln δ < 0.
The above mentioned three values of δ correspond to the three differentsituations of quality of treatment: effective, inefficient and destructive treat-ment. They reflect an increase, preservation and reduction of the measureof chaosity in therapy. Thus, one can define QT (ε) = ln δ according to theequation (10) as follows:
QT (ε) = lnn∏
j=1
εj1(2)
εj1(1)
. (11)
However, the total factor QT is defined both by the quantitative measuresof chaos and by other physiological and biochemical data. Now we shall con-sider the transition of the patient from state 1 into state 2. Then by analogy,one can introduce physiological parameter k(1), determined for state 1, andk(2) for state 2. In case of Parkinson’s disease one can introduce the am-plitude or the dispersion of the tremor velocity of extremities (hand or leg)of the patient as this parameter. In other cases any medical data, which areconsidered for diagnostic purposes, can be used. For greater reliability it isnecessary to use the combination of various parameters kj(1) and (kj(2)).
The value:
QT = lnn∏
j=1
εj1(2)
εj1(1)
∗
kj(2)kj(1)
(12)
will be considered as a generalized quantitative factor of quality of the ther-apy.
However in real conditions it is necessary to increase or weaken the mag-nitude of chaotic, or physiological contributions to the equation (12). For thispurpose we shall take the simple ratio:
ln∏
(anbm...) = n ln a + m ln b + ... (13)
By analogy, we can reinforce or weaken various contributions depending onthe concrete situation:

Manifestation of Chaos in Real Complex Systems 9
QT = lnn∏
j=1
(εj1(2)
εj1(1)
)mj
∗
kj(2)kj(1)
pj
. (14)
If incomplete experimental data are available in some situations, so one canassume pj = 1 (attenuation of the physiological contribution). The value ofmj > 1 can mean the amplification of the chaotic contribution. Otherwise,if we want to weaken the chaotic contribution, we should take (mj = 1) andif we reinforce the physiological contribution we come towards (pj > 1). Wehave presented the results of the calculation of the quantitative factor QT inthe 6th section.
5 Experimental data
We have taken the experimental data from Ref. [15]. They represent thetime records of the velocity of tremor of an index finger of a patient withParkinson’s disease (see, also http://physionet.org/physiobank/database/).The effect of chronic high frequency deep brain stimulation (DBS) on therest tremor was investigated [15] in group of subjects with Parkinson’s dis-ease (PD) (16 subjects). Eight PD subjects with high amplitude tremor andeight PD subjects with low amplitude tremor were examined by a clinicalneurologist and tested with a velocity laser to quantify time and frequencydomain characteristics of tremor. The participants received DBS of the inter-nal globus pallidus (GPi), the subthalamic nucleus (STN) or the ventrointer-mediate nucleus of the thalamus (Vim). Tremor was recorded with a velocitylaser under two conditions of DBS (on-off) and two conditions of medication(L-Dopa on-off).
All the subjects gave informed consent and institutional ethics procedureswere followed. The selected subjects were asked to refrain from taking theirmedication at least 12 h before the beginning of the tests and were allowedto have no more than one coffee at breakfast on the two testing days. Resttremor was recorded on the most affected side with a velocity-transducinglaser [16, 17]. This laser is a safe helium-neon laser. The laser was placedat about 30 cm from the index finger tip and the laser beam was directedperpendicular to a piece of reflective tape placed on the finger tip. Positivevelocity was recorded when the subjects extended the finger and negativevelocity when the subjects flexed the finger.
The conditions, counterbalanced across subjects, included the following:1. The L-Dopa condition (no stimulation).2. The DBS condition (stimulation only).3. The ”off” condition (no medication and no stimulation).4. The ”on” condition (on medication and on stimulation).5. The effect of stopping DBS on tremor (time record of the tremor after
15, 30, 45, 60 min since switching off of the stimulator).

10 Renat M. Yulmetyev, Sergey A. Demin, and Peter Hanggi
In Fig. 1. the time records of the velocity of changing tremor of anindex finger of the second patient’s hand (man, 52 years old) under variousconditions of influence on the organism are submitted as an example. Highvelocity of tremor is observed: 1) in a natural condition of the patient (a),2) in 15 (45) minutes after the stimulator was switched off. Lower speed oftremor is in cases: 1) when both methods (stimulation, medication)are used,2) when each of these methods is used separately, 3) in 30 (60) minutes afterthe stimulator was switched off. The similar results are received in Refs. [15].
0 5000 10000−1
−0.5
0
0.5
1
(a)
Vel
ocity
[m/τ]
0 5000 10000−1
−0.5
0
0.5
1
(b)
0 5000 10000−1
−0.5
0
0.5
1
(c)
0 5000 10000−1
−0.5
0
0.5
1
(d)
0 5000 10000−1
−0.5
0
0.5
1
(e)
0 5000 10000−1
−0.5
0
0.5
1
(f)
0 5000 10000−1
−0.5
0
0.5
1
(g)
0 5000 10000−1
−0.5
0
0.5
1
(h)
Time [τ=10−2 sec]
Fig. 1. The velocity of the change of tremor of the right index finger of the patient’shand (the second subject) with Parkinson’s disease under various conditions of theexperiment. (a)-deep brain stimulation off, medication off; (b)-the subject wasreceiving stimulation of the GPi, medication on; (c)-deep brain stimulation off,medication on; (d)-the subject was receiving stimulation of the GPi, medicationoff; (e)-(h)-the recording of rest tremor in the right index finger of the subject15 (30, 45, 60) minutes after the stimulator was switched off, this subject was offmedication for at least 12 hours.
6 Results
In the given section the results of processing of the experimental data for oneof the patients (the subject 2) are shown. The similar pictures are observedin the experimental data of other subjects.

Manifestation of Chaos in Real Complex Systems 11
6.1 The non-Markovity parameter as a quantitative measure ofdefining chaos
In this subsection the technique of the calculation of quantitative and qual-itative criteria under various conditions that influence the state a patient isgiven. The basic idea of the given approach consists in defining the quantita-tive ratio between chaosity and regularity of the observed process. It allowsto judge the physiological (pathological) state of a live system by the degreeof chaosity or of regularity. The highest degree of chaosity in the behavior ofa live system corresponds to a normal physiological state. Higher degree ofregularity or specific ordering is characteristic of various pathological statesof a live system. In the given work we use the non-Markovity parameter ε1(0)as a special quantitative measure defining chaosity or regularity of the stud-ied process. The examples [10]-[14], [18] which have been investigated by usearlier serve as a basis for such reasoning. As one of the examples we shallconsider the tremor velocity of the changing of the subject’s index fingers incase of Parkinson’s disease.
The comparative analysis of the initial time record and the non-Markovityparameter for all the submitted experimental data allows to discover the fol-lowing regularity. The value of the non-Markovity parameter ε1(0) decreaseswith the increase of the tremor velocity of the patient fingers (deteriorationof the physiological state) and grows with the decrease of the tremor velocity(improvement of the state of the patient). We shall also consider the powerspectra of the initial TCF µ0(ω) under various conditions that influence anorganism, the window-time behavior of the power spectrum µ0(ω) and thenon-Markovity parameter ε1(ω), the time dependence local averaging relax-ation parameter λ1(t) as an additional sources of information.
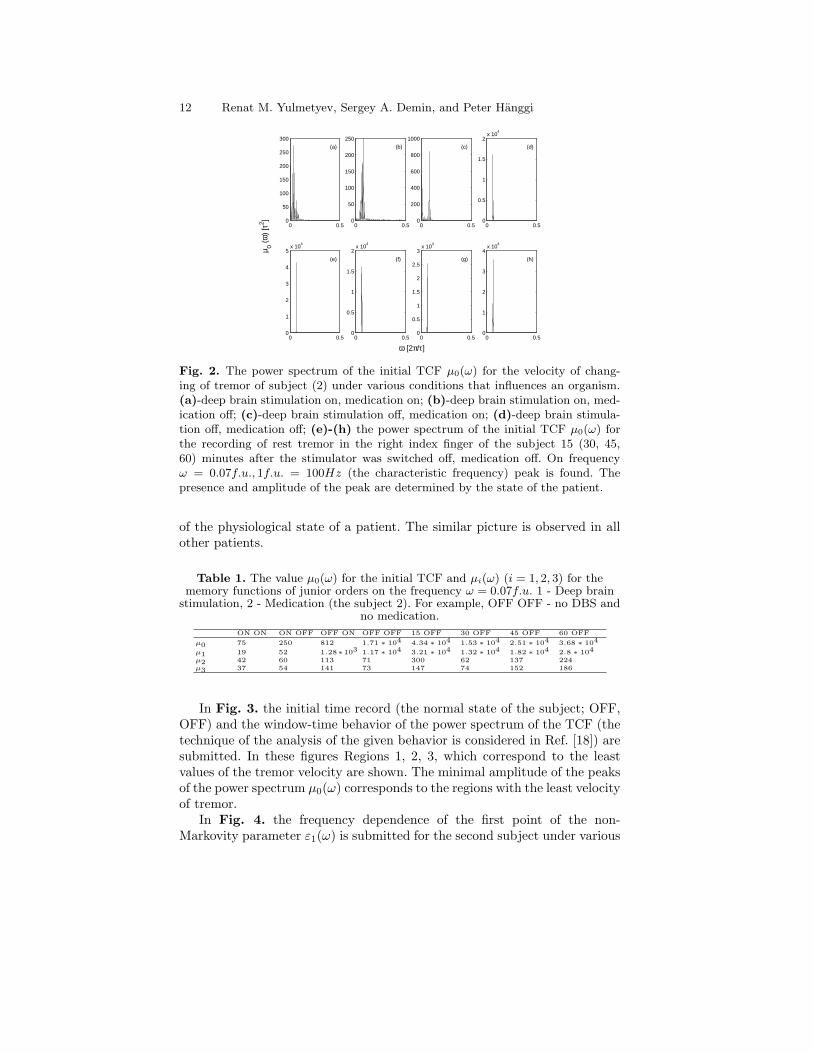
Fig. 2. represents the power spectra of the initial TCF for various condi-tions of the experiment. One can observe the powerful peak for the all figuresat the characteristic frequency ω = 0.07f.u.(ω = 2πν, 1f.u. = 2π/τ, 1τ =10−2 second). The amplitude values of this peak for µi(ω) (i = 1, 2, 3) aregiven in Table 1. The given peak testifies to a pathological state of thestudied system. The similar picture is observed in patients with myocardialinfarction [11]. The comparison of these values reflects the amplitude of ve-locity of tremor at the initial record of time.
In Table 1 the second patient’s amplitude values µ0(ω) for the initial TCFand the memory functions of the younger order µi(ω) (i = 1, 2, 3) at frequencyω = 0.07f.u. are submitted. Terms in Table content define the conditionsunder which the experiment is carried out. Under all conditions the peak ofpower on the frequency ω = 0.07f.u. can be observed. Amplitude values ofthe given peak (in power spectrum µ0(ω) in particular) reflect the amplitudeof tremor velocity. For example, the least amplitude 75 τ2 corresponds tothe condition (ON, ON; or: deep brain stimulation on, medication on). Thehighest amplitude 4.34 ∗ 104τ2 corresponds to the greatest speed of tremor(see, Figs. 1e, 2e). Thus, the given parameter can be used for the estimate
12 Renat M. Yulmetyev, Sergey A. Demin, and Peter Hanggi
0 0.50
50
100
150
200
250
300
(a)
0 0.50
50
100
150
200
250
(b)
0 0.50
200
400
600
800
1000
(c)
0 0.50
0.5
1
1.5
2x 10
4
(d)
0 0.50
1
2
3
4
5x 10
4
(e)µ 0 (
ω)
[τ2 ]
0 0.50
0.5
1
1.5
2x 10
4
(f)
ω [2π/τ]
0 0.50
0.5
1
1.5
2
2.5
3x 10
4
(g)
0 0.50
1
2
3
4x 10
4
(h)
Fig. 2. The power spectrum of the initial TCF µ0(ω) for the velocity of chang-ing of tremor of subject (2) under various conditions that influences an organism.(a)-deep brain stimulation on, medication on; (b)-deep brain stimulation on, med-ication off; (c)-deep brain stimulation off, medication on; (d)-deep brain stimula-tion off, medication off; (e)-(h) the power spectrum of the initial TCF µ0(ω) forthe recording of rest tremor in the right index finger of the subject 15 (30, 45,60) minutes after the stimulator was switched off, medication off. On frequencyω = 0.07f.u., 1f.u. = 100Hz (the characteristic frequency) peak is found. Thepresence and amplitude of the peak are determined by the state of the patient.
of the physiological state of a patient. The similar picture is observed in allother patients.
Table 1. The value µ0(ω) for the initial TCF and µi(ω) (i = 1, 2, 3) for thememory functions of junior orders on the frequency ω = 0.07f.u. 1 - Deep brain
stimulation, 2 - Medication (the subject 2). For example, OFF OFF - no DBS andno medication.
ON ON ON OFF OFF ON OFF OFF 15 OFF 30 OFF 45 OFF 60 OFFµ0 75 250 812 1.71 ∗ 104 4.34 ∗ 104 1.53 ∗ 104 2.51 ∗ 104 3.68 ∗ 104
µ1 19 52 1.28∗103 1.17 ∗ 104 3.21 ∗ 104 1.32 ∗ 104 1.82 ∗ 104 2.8 ∗ 104
µ2 42 60 113 71 300 62 137 224µ3 37 54 141 73 147 74 152 186
In Fig. 3. the initial time record (the normal state of the subject; OFF,OFF) and the window-time behavior of the power spectrum of the TCF (thetechnique of the analysis of the given behavior is considered in Ref. [18]) aresubmitted. In these figures Regions 1, 2, 3, which correspond to the leastvalues of the tremor velocity are shown. The minimal amplitude of the peaksof the power spectrum µ0(ω) corresponds to the regions with the least velocityof tremor.
In Fig. 4. the frequency dependence of the first point of the non-Markovity parameter ε1(ω) is submitted for the second subject under various

Manifestation of Chaos in Real Complex Systems 13
0 1000 2000 3000 4000 5000 6000 7000 8000−0.6
−0.4
−0.2
0
0.2
0.4
0.6
0.8
Time [τ=10−2 sec]
t [28 τ]
0
0.1
0.2
0.3 0 5 10 15 20 25 30
0
1000
2000
3000
ω [2 π / τ]
µ 0 (ω
)V
eloc
ity [m
/τ] 1 2 3
1 2 3
Fig. 3. The initial time series and the window-time behavior of the power spectrumof the TCF µ0(ω). Two figures are submitted to illustrate the case of subject 2:stimulation of and medication of the brain are not applied. The change of regimesin the initial time series is reflected in the decrease of the velocity of tremor (regions1, 2 and 3) and becomes visible as a sharp reduction of the power of spectrum µ0(ω)(see, the 1th, 12th, 17th windows for more detail).
0 0.50
5
10
15
20
25
(a)
0 0.50
2
4
6
8
(b)
0 0.50
0.5
1
1.5
2
2.5
3
(c)
0 0.50
0.5
1
1.5
2
2.5
(d)
0 0.50
0.5
1
1.5
2
2.5
(e)
ε 1 (ω
)
0 0.50
0.5
1
1.5
2
2.5
(f)
ω [2π / τ]
0 0.50
0.5
1
1.5
2
2.5
3
3.5
(g)
0 0.50
0.5
1
1.5
2
2.5
(h)
Fig. 4. The first point of the non-Markovity parameter ε1(ω) for the second subjectunder various conditions of the experiment: (a)-deep brain stimulation off, medi-cation on; (b)-deep brain stimulation on, medication on; (c)-deep brain stimula-tion on, medication off; (d)-deep brain stimulation off, medication off; (e)-(h)-therecording of rest tremor in the right index finger of the subject 15 (30, 45, 60)minutes after the stimulator was switched off, medication off. The non-Markovityparameter at zero frequency ε1(0) has a special role. These values (6.02 in the firstcase and 1.0043 in the last one) define chaosity or regularity of the studied states.The amplitudes of these values also characterize the state of the subject.
14 Renat M. Yulmetyev, Sergey A. Demin, and Peter Hanggi
conditions of the experiment. The value of the parameter ε1(0) on zero fre-quency is of special importance for our the research of manifestations of chaos.It is possible to judge the change of the state of a subject by the increase(or by the decrease) of this value. The comparative analysis of the initialtime records allows to come to the similar conclusions. In Figs. 4d-h welldefined frequency structure of the non-Markovity parameter can be seen. Thegiven structure is completely suppressed and disappears only at treatment.The characteristic frequency of fluctuations corresponds, approximately, toω = 0.06f.u. These multiple peaks are most appreciable on low frequencies.On higher frequencies these fluctuations are smoothed out. As can be seenin these figures, the 2nd subject has a strong peak which remains stable overtime. As our data show, the comb-like structure with multiple frequenciescan observed in all patients with high velocity of tremor. In a group of pa-tients with low velocity of tremor it disappears, and a wider spectrum thatpresents some fluctuations over time is observed. The present structure tes-tifies to the presence of characteristic frequency of fluctuations of tremor ofhuman extremities.
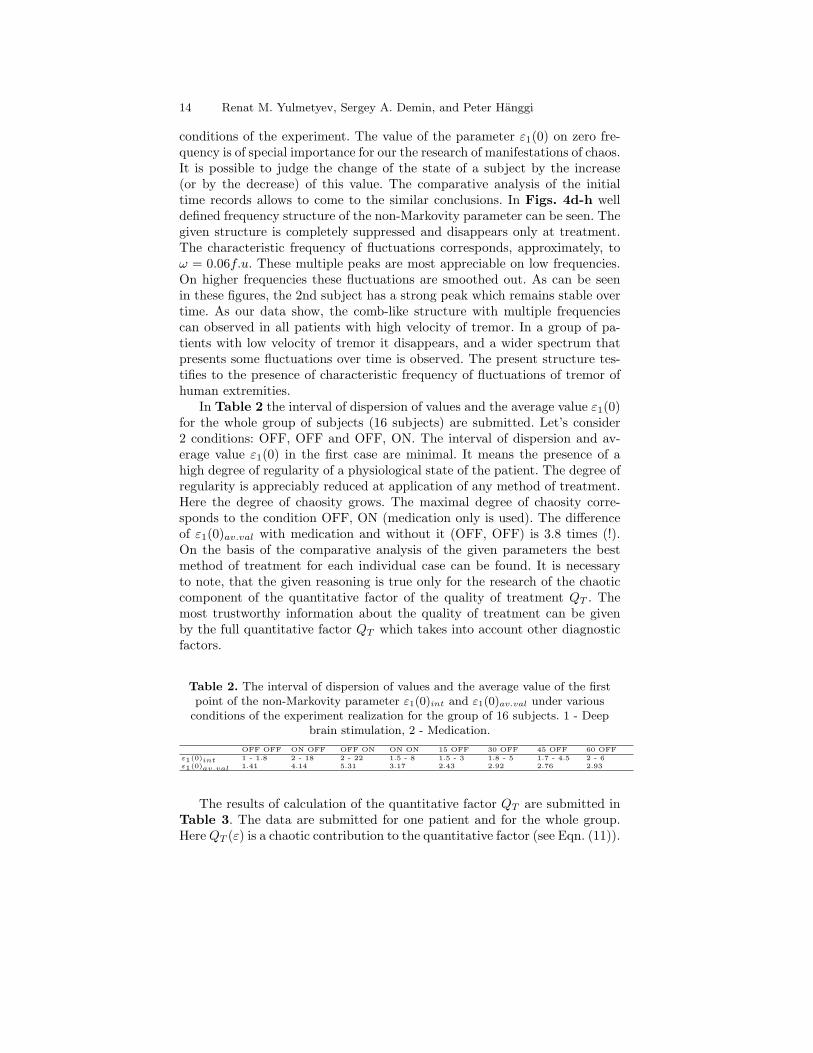
In Table 2 the interval of dispersion of values and the average value ε1(0)for the whole group of subjects (16 subjects) are submitted. Let’s consider2 conditions: OFF, OFF and OFF, ON. The interval of dispersion and av-erage value ε1(0) in the first case are minimal. It means the presence of ahigh degree of regularity of a physiological state of the patient. The degree ofregularity is appreciably reduced at application of any method of treatment.Here the degree of chaosity grows. The maximal degree of chaosity corre-sponds to the condition OFF, ON (medication only is used). The differenceof ε1(0)av.val with medication and without it (OFF, OFF) is 3.8 times (!).On the basis of the comparative analysis of the given parameters the bestmethod of treatment for each individual case can be found. It is necessaryto note, that the given reasoning is true only for the research of the chaoticcomponent of the quantitative factor of the quality of treatment QT . Themost trustworthy information about the quality of treatment can be givenby the full quantitative factor QT which takes into account other diagnosticfactors.
Table 2. The interval of dispersion of values and the average value of the firstpoint of the non-Markovity parameter ε1(0)int and ε1(0)av.val under various
conditions of the experiment realization for the group of 16 subjects. 1 - Deepbrain stimulation, 2 - Medication.
OFF OFF ON OFF OFF ON ON ON 15 OFF 30 OFF 45 OFF 60 OFFε1(0)int 1 - 1.8 2 - 18 2 - 22 1.5 - 8 1.5 - 3 1.8 - 5 1.7 - 4.5 2 - 6ε1(0)av.val 1.41 4.14 5.31 3.17 2.43 2.92 2.76 2.93
The results of calculation of the quantitative factor QT are submitted inTable 3. The data are submitted for one patient and for the whole group.Here QT (ε) is a chaotic contribution to the quantitative factor (see Eqn. (11)).

Manifestation of Chaos in Real Complex Systems 15
QT is a total quantitative factor (see Eqn. (14)), where ε(1)(1) and ε(1)(2)are chaotic contributions for the tremor amplitudes k(1)(1), k(1)(2); ε(2)(1)and ε(2)(2) are dispersions of tremor amplitude k(2)(1), k(2)(2) (physiologicalcontributions). The full factor QT provides detailed information about thequality of treatment. The present factor includes both the chaotic componentQT (ε), and the physiological contribution QT (k). The calculation QT (k) isdescribed in Section 4. One can define the quality of treatment by meansof QT . The positive value of the given factor defines an effective methodof treatment. For a separate patient and for the whole group QT has themaximal value under condition of ON, ON. The total quantitative factor issupplemented by a diagnostic (physiological) component. It allows to takeinto account those features of the system which the chaotic component doesnot contain. For the second patient under condition 15 OFF (see, Table 3)the factor QT has a negative value. It testifies to the negative influence ofthe given method of treatment on the organism of the patient. Thus, thebest method of treatment is the combination of the two medical methods:electromagnetic stimulation and medication.
Table 3. The quantitative factor QT (ε) and the total quantitative factor QT forthe second patient and for the whole group (16 subjects). 1 - Deep brain
stimulation, 2 - Medication. mj = 1, pj = 1.
The 2 patientOFF OFF ON OFF OFF ON ON ON 15 OFF 30 OFF 45 OFF 60 OFF
QT (ε) 0.758 2.556 1.756 0.291 0.438 0.041 0.017QT 1.763 2.013 2.654 -0.013 0.883 -0.004 0.856
The all groupQT (ε) 1.077 1.326 0.810 0.544 0.728 0.671 0.731QT 3.661 2.883 4.071 1.47 1. 734 1.624 1.742
Fig. 5. reflects the behavior of the parameter ε1(0) for the four subjects.The points lying above the horizontal line, testify to the improvement of thestate the subject and the efficacy of the method of treatment. The points,lying below the horizontal line, testify to the deterioration of the state ofthe subject and inefficiency of the applied method. For example, Fig. 5bcorresponds to the sevenfold change of the quantitative measure of chaos forthe 9th patient. In case of the 8th patient (see Fig. 5c) no influence couldchange the measure of chaos, therefore there was practically no change in thestate of the subject either. In some cases (see Figs. 5b, 5d) the DBS or themedication reduces the measure of chaos which testifies to the deteriorationof the state of the subject. This approach allows to define the most effective(or inefficient) method of treatment in each individual case.
6.2 The definition of the predictor of the sudden changes of thetremor velocity
In this subsection the window-time behavior of the non-Markovity parameterε1(ω) for a certain case (the second patient, two methods of medical treatment

16 Renat M. Yulmetyev, Sergey A. Demin, and Peter Hanggi
1 2 3 4 5 6 70
1
2
3
4
5
6
7
ε 1(0) 1 2 3 4 5 6 7
0
1
2
3
4
5
6
7
1 2 3 4 5 6 70
0.5
1
1.5
2
2.5
1 2 3 4 5 6 70
0.5
1
1.5
2
2.5
Point
(a) (b)
(c) (d)
Fig. 5. The behavior of the parameter ε1(0) for four various patients: (a)-thesecond subject, high amplitude tremor, (b)-the 9th subject, low amplitude tremor(the stimulation of the GPi); (c)-the 8th subject, high amplitude tremor, (d)-the15th subject, low amplitude tremor (the stimulation of the STN). The value ε1(0)for seven consecutive conditions of the experiment: 1 point - both methods are used;2 - treatment by medication is applied only; 3 - the DBS only is used; 4 (5, 6, 7)- value of the parameter 15 (30, 45, 60) minutes after the stimulator was switchedoff; the horizontal line corresponds to the value of the parameter when no methodis used. This representation allows to define the most effective method of treatmentfor each patient.
were used) and the procedure of local averaging of the relaxation parameterswere considered. These procedures allow to determine specific predictors ofthe change of regimes in the initial time records.
The idea of the first procedure is, that the optimum length of the timewindow (28 = 256 points) is found first. In the studied dependence (in ourcase the frequency dependence of the first point of the non-Markovity param-eter) the first window is cut out. Then the second window is cut out (frompoint 257 points to point 512) etc. This construction allows to find the lo-cal time behavior of the non-Markovity parameter. At the critical momentswhen the tremor velocity increases the value of the non-Markovity parametercomes nearer to the value of a unit. One can observe that the value of thenon-Markovity parameter starts to decrease by 2-2.5 sec before the increaseof the velocity of tremor (see Fig. 6.).
The idea of the second procedure consists in the following. One can con-sider the initial data set and take an N-long sampling. We can calculatekinetic and relaxation parameters for the given sampling. Then we can carryout the operation of ”step-by-step one shift to the right”. Then we calculatekinetic and relaxation parameters. After that we execute one more ”step-by-step shift to the right” and continue the procedure up to the end of the time

Manifestation of Chaos in Real Complex Systems 17
0 1000 2000 3000 4000 5000 6000 7000 8000−1
−0.5
0
0.5
1
Time [τ=10−2 sec]
Vel
ocity
[m/τ]
0
0.1
0.2
0.30 5 10 15 20 25 30
0
5
10
ω [2 π / τ]
t [28 τ]
ε 1 (ω
)
1 2
3
4 5 6
7
1 2 3 4 5 6 7
Fig. 6. The initial signal - the change of velocity of tremor when the second patientis treated by two methods and the window-time behavior of the first point of non-Markovity parameter ε1(ω). At the time of the sharp change of the mode (sharpincrease of velocity of tremor) in the behavior of the initial time series (regions1-7) gradual decrease of the non-Markovity parameter up to the value of a unit(the 3th, 6th, 10th, 14th, 17th, 20th, 27th windows) is observed. The decrease of thenon-Markovity parameter begins 2-2,5 sec earlier of acceleration of tremor on aninitial series.
0 1000 2000 3000 4000 5000 6000 7000 8000−0.6
−0.4
−0.2
0
0.2
0.4
0.6
0.8
Vel
ocity
[m/t]
0 1000 2000 3000 4000 5000 6000 7000 8000−0.2
−0.15
−0.1
−0.05
0
λ 1(t)
Time [t=10−2 sec]
Fig. 7. The change of the tremor velocity for the second patient (stimulation of thebrain and medication are not used) and the time dependence of the local relaxationparameter λ1(t). The procedure of localization allows to find sudden changes ofrelaxation regimes of the researched system. The amplitude values of the localrelaxation parameter are in the region of the lowest velocity of tremor. The changein the time behavior of the parameter λ1(t) begins 2-3 sec earlier than the changeof the regimes in the initial time series appears.

18 Renat M. Yulmetyev, Sergey A. Demin, and Peter Hanggi
series. Thus the local averaged parameters have high sensitivity to the effectsof intermittency and non-stationarity. Any non-regularity in the initial timeseries is reflected instantly in the behavior of local average parameters. Theoptimum length of the sampling is 120 points. In Figs. 7, 8 the initial timerecord and the time dependence of local relaxation parameter λ1(t) are sub-mitted for two cases. The change in the time behavior of the parameter λ1(t)begins 2-3 sec prior to the change of the regimes of the time record of thetremor velocity . The increase of speed of relaxation (λ1(t)) testifies to thedecrease of velocity of the tremor.
0 1000 2000 3000 4000 5000 6000 7000−1
−0.5
0
0.5
1
Vel
ocity
[m/t]
0 1000 2000 3000 4000 5000 6000 7000−0.25
−0.2
−0.15
−0.1
−0.05
0
0.05
0.1
λ 1(t)
Time [t=10−2 sec]
Fig. 8. The change of the tremor velocity for the second patient (15 minutes afterthe stimulator was switched off, medication off) and the time dependence of thelocal relaxation parameter λ1(t). The site characterizing the minimal velocity ofthe tremor is allocated. The increase and decrease of the local relaxation param-eter occurs 2.5 sec before the decrease or increase of the velocity of tremor. Thesimilar behavior of the parameter λ1(t) can be explained by its high sensitivity tononstationarity of the initial signal.
7 Conclusions
In the given work we offer a new concept of the study of manifestations ofchaos. It is based on the application of the statistical non-Markovity param-eter and its spectrum as an informational measure of chaos. This approachallows to define the difference between a healthy person and a patient bymeans of a numerical value of the non-Markovity parameter. This observa-tion gives a reliable tool for the strict quantitative estimates for the diagnosisand quantification of the treatment of patients. As an example we have con-
Manifestation of Chaos in Real Complex Systems 19
sidered the changes of various dynamic conditions of patients with Parkin-son’s disease. The quantitative and qualitative criteria used by us for thedefinition of chaosity and regularity of investigated processes in live systems,allows to reveal new informational opportunities of the statistical theory ofdiscrete non-Markov random processes. The new concept allows to estimatequantitatively the efficacy and the quality of treatment of different patientswith Parkinson’s disease. She allows to investigate various dynamic states ofcomplex systems in real time.
The statistical parameter of non-Markovity ε1(0) can serve as a reliablequantitative informational measure of chaos. It allows to use ε1(0) for thestudy of the behavior of different chaotic systems. In case of Parkinson’sdisease the change of the given parameter defines the change of a quantitativemeasure of chaosity or regularity of a physiological system. The increaseof chaosity reflects the decrease of the quantitative measure of pathologyand improvement of the state of the patient. The increase of the regularitydefines high degree of manifestation of pathological states of live systems.The combined power spectra of the initial TCF µ0(ω), the three memoryfunctions of junior orders and the frequency dependence of the non-Markovityparameter compose an informational measure which defines the degree ofpathological changes in a human organism.
The new procedures (the window-time procedure and the procedure oflocal averaging) show evident predictors of the change of the initial timesignal. The window-time behavior of the non-Markovity parameter ε1(ω) re-flects the increase of the tremor velocity 2-2.5 s earlier. It happens when thenon-Markovity parameter approaches a unit value. The procedure of localaveraging of the relaxation parameter λ1(t) reflects the relaxation changes ofphysiological processes in a live system. The behavior of the local parameterλ1(t) reacts to the change of relaxation regimes in the initial time record 2-3s earlier. These predictors allow to lower the probability of ineffective use ofdifferent methods of treatment.
In the course of the study we have come to the following conclusions.The application of medication for the given group of patients proved be themost efficient way of the treatment of patients with Parkinson’s disease. Thecombination of different methods (medication, electromagnetic stimulator)is less effective in comparison with application either of medication or ofstimulator. After the stimulator is switched off its aftereffect has an oscillatorycharacter with characteristic low frequency corresponding to the period of 30min. Used separately stimulation is less effective, than the use of medication.In some cases both medication and stimulation exert a negative influence onstate of subject. The efficacy of various medical procedures and the qualityof treatment can be estimated quantitatively for each subject separately withutmost precision.
However, if we take both chaotic and physiological components into ac-count, the general estimation of the quality of treatment will be more uni-

20 Renat M. Yulmetyev, Sergey A. Demin, and Peter Hanggi
versal. Two methods (DBS and medication, QT = 4.071) produce the mosteffective result in comparison with the effect of DBS (3.661) or of medica-tion (2.883) given separately. This is connected with additional aspect ofestimation of the quality of treatment due to the study both of chaotic anddiagnostic components of a live system. The given conclusion corresponds tothe results of work [15].
In conclusion we would like to state that our study gives a unique op-portunity for the exact quantitative description of the states of patients withParkinson’s disease at various stages of the disease as well as the treatmentand recovery of the patient. On the whole, the offered concept of manifes-tations of chaos opens up great opportunities for the alternative analysis,diagnosis and forecasting of the chaotic behavior of real complex system of alive nature.
8 Acknowledgements
This work supported by the RHSF (Grant No. 03-06-00218a), RFBR (GrantNo. 02-02-16146) and CCBR of Ministry of Education RF (Grant No. E 02-3.1-538). The authors acknowledge Prof. Anne Beuter for stimulating criti-cism and valuable discussion and Dr. L.O. Svirina for technical assistance.
References
1. S. Boccaletti, C. Grebogi, Y.-C. Lai et. al: Phys. Reports 329, 103 (2000)2. H. Touchette, S. Lloyd: Physica A 331, 140 (2004)3. K. Pyragas: Phys. Lett. A 170, 421 (1992)4. E.R. Hunt: Phys. Rev. Lett. 67, 1953 (1991)5. V. Petrov, V. Gaspar, J. Masere et. al: Nature 361, 240 (1993)6. B.B. Plapp, A.W. Huebler: Phys. Rev. Lett. 65, 2302 (1990)7. W. Just, H. Benner, E. Reibold: Chaos 13, 259 (2003)8. R. Lima, M. Pettini: Phys. Rev. A 41, 726 (1990)9. Y. Braiman, J. Goldhirsch: Phys. Rev. Lett. 66, 2545 (1991)
10. R.M. Yulmetyev, P. Hanggi, F.M. Gafarov: Phys. Rev. E 62, 6178 (2000)11. R.M. Yulmetyev, P. Hanggi, F. Gafarov: Phys. Rev. E 65, 046107 (2002)12. R.M. Yulmetyev, F.M. Gafarov, P. Hanggi et. al: Phys. Rev. E 64, 066132
(2001)13. R.M. Yulmetyev, S.A. Demin, N.A. Emelyanova et. al: Physica A 319, 432
(2003)14. R.M. Yulmetyev, N.A. Emelyanova, S.A. Demin et. al: Physica A 331, 300
(2003)15. A. Beuter, M. Titcombe, F. Richer et. al: Thalamus & Related Systems 1,
203 (2001); M. Titcombe, L. Glass, D. Guehl et. al: Chaos 11, 766 (2001)16. A. Beuter, A. de Geoffroy, P. Cordo: J. Neurosci. Meth. 53, 47 (1994)17. K.E. Norman, R. Edwards, A. Beuter: J. Neurosci. Meth. 92, 41 (1999)18. R.M. Yulmetyev, P. Hanggi, F.M. Gafarov: JETP 123, 643 (2003)


![Chaos, Complexity, and Creativity · Chaos theory acts as a conceptual umbrella for various approaches and explorations of complex systems, like dynamical system theory [3], self-organization](https://img.dokumen.tips/doc/110x75/605d99b7426a38780b7cf9ea/chaos-complexity-and-chaos-theory-acts-as-a-conceptual-umbrella-for-various-approaches.jpg)