Embed Size (px)
Citation preview

GVA Grimley Ltd 10 Stratton Street London W1J 8JR 084 4902 0304 www.gvagrimley.co.uk
MANCHESTER CITY COUNCIL
INDEPENDENT RETAILERS STUDY:
CHORLTON
December 2009
Manchester City Council Independent Retailers Study - Chorlton
December 2009
CONTENTS
1. INTRODUCTION .............................................................................................................. 3
2. POLICY FRAMEWORK ................................................................................................... 5
3. NATIONAL RETAIL TRENDS........................................................................................ 15
4. CHORLTON: HEALTH CHECK..................................................................................... 24
5. CAPACITY PROJECTIONS........................................................................................... 35
6. STRATEGIC OPTIONS/RECOMMENDATIONS............................................................ 45
PLANS
Plan 1: Survey Area
Plan 2: Leakage of Convenience Spend
APPENDICES
Appendix 1: Convenience Capacity Tables Appendix 2: Comparison Capacity Tables Appendix 3: Leakage/Claw-back Assessment: Main Food Expenditure Appendix 4: Leakage/Claw-back Assessment: Top-up Food Expenditure

Manchester City Council Independent Retailers Study - Chorlton
December 2009
3
1. INTRODUCTION
1.1 GVA Grimley was instructed in January 2009 by Manchester City Council to undertake an Independent
Retailers Study for Chorlton. This study draws and extends upon the Quantitative Need Study undertaken by
GVA Grimley for the City Council back in 2005 with the purpose to examine the role of multiple and independent
retailers within Chorlton and provide an up-to-date picture of current and future retail capacity in the centre. The
study also examines a range of planning measures in order to support the independent sector in Chorlton going
forward through the LDF period.
1.2 The study will inform the evidence base for the Council’s Local Development Framework. This information will
also be at the Council’s disposal to assist in the determination of any future planning applications.
1.3 Our terms of reference are to update the quantitative capacity analysis previously undertaken for the Council to
provide:
• A detailed up-to-date audit of the vitality and viability of Chorlton;
• An up to date and realistic assessment of the quantitative and qualitative scope for new retail and other
development within Chorlton, and views on the appropriateness of alternative types of retail development
including if appropriate a new food store, other multiple convenience/comparison retailers and the role of
the independent sector;
• In addition to guidance on the appropriate scale and form of new development, a review of the alternative
development opportunities, in order to inform the City Council’s strategies for the Centre and to guide the
determination of any future development proposals in Chorlton.
• Understanding of smaller retailers contribution to the wider economy;
• Solutions put forward on how the Independent sector can be supported into the future. Proposals for how
the City Council and partners can help create the right conditions to help support diversity in centres with
strong independent sector presence; and
• Establish the extent to which the current retail provision in the centre satisfies the level and nature of
consumer demand within Chorlton’s catchment area.
1.4 In order to produce a comprehensive up-to-date review of retailing needs in Chorlton we have drawn on a
household telephone survey, an in centre survey and a survey of businesses in Chorlton, as well as town centre
health checks. This sets out the range, choice and distribution of the existing retail provision and highlights any
apparent deficiencies.

Manchester City Council Independent Retailers Study - Chorlton
December 2009
4
1.5 The quantitative capacity exercise draws on the household telephone survey results to establish the current
performance of Chorlton District Centre in terms of convenience and comparison goods floorspace; which
informs the forecasts of the future retail floorspace capacity. The results of the full analysis are drawn together
to provide a set of recommendations and advice to feed into the Local Development Framework.
Structure
1.6 The next section of this report sets out our review of national, strategic and local planning policies relevant to
retail planning in the City. Section 3 highlights current retail trends, focusing on the likely implications for
retailing within the City’s District Centres.
1.7 In Section 4 we present our qualitative assessment of Chorlton District Centre which draws on customer and
business views and behaviour as identified from the telephone and business surveys. In Section 5 we present
our quantitative assessment and the potential for new retail development in Chorlton. In Section 6 we review
the findings of our study and consider the strategic options for the future development of Chorlton in terms of
retail strategy.
Manchester City Council Independent Retailers Study - Chorlton
December 2009
5
2. POLICY FRAMEWORK
2.1 In this section we examine key features of national, regional and local planning policy guidance.
National Policy Context
2.2 Government guidance makes it clear that sustainable development is the core principle underpinning planning.
Accordingly PPS1 sets out a range of overarching policies aimed at facilitating sustainable patterns of urban
and rural development through a number of initiatives, including the need to ensure that new developments
provide good access to jobs and key services for all members of the community.
2.3 PPS6 reaffirms the Government’s commitment to protecting/sustaining town centres. Accordingly the central
objective of the guidance is to promote the vitality and viability of town centres by planning for the growth of
existing centres and enhancing existing centres by promoting them as the focus for new development.
3.1 PPS6 sets out a number of key objectives which need to be taken into account in the context of the key
objectives outlined above, which are as follows:
• enhancing consumer choice by making provision for a range of shopping, leisure and local services which
allow genuine choice to meet the needs of the entire community, and particularly socially excluded groups;
• supporting efficient, competitive and innovative retail, leisure, tourism and other sectors, with improving
productivity; and
• improving accessibility, ensuring that existing or new development is, or will be, accessible and well-served
by a choice of means of transport.
3.2 The guidance also makes it clear that other, wider, Government policy objectives remain relevant, including the
promotion of social inclusion, regeneration of deprived area, promoting economic growth; sustainable patterns
of development, transport choices and high quality and inclusive design.
2.4 In allocating sites and assessing proposed development, PPS6 requires local planning authorities to:
• assess the need for the development;
• identify the appropriate scale;
• apply the sequential approach;
• assess the impact on existing centres; and
• ensure locations are accessible and well served by a choice of means of transport.

Manchester City Council Independent Retailers Study - Chorlton
December 2009
6
2.5 In the context of development control, applicants are required to demonstrate conformity with the key tests
outlined above. However, need must only be demonstrated for any application for a main town centre use
which would in an edge-of-centre or out-of-centre location and which is not in accordance with an up-to-date
development plan document strategy. Furthermore, impact assessments should be undertaken on a similar
basis. However, where significant development in a centre, not in accordance with the development plan
strategy, would substantially increase the attraction of the centre and could have an impact on other centres,
the impact on other centres will also need to be assessed. Impact assessments should only be provided for all
retail and leisure proposals over 2,500 sq m gross, although they may be necessary for smaller developments,
such as those likely to have a significant impact on smaller centres.
2.6 In 2007 the Planning White Paper, ‘Planning for a Sustainable Future’ announced the current approach in PPS6
to assessing the impact of proposals outside town centres would be reviewed. It announced that the need and
impact tests would be replaced with a new test which has a strong focus on the Government’s town centre first
policy, and which promotes competition and improves consumer choice, avoiding the unintended effects of the
current need test.
2.7 In July 2008 Proposed Changes to Planning Policy Statement 6: Planning for Town Centres was published for
consultation. These sought to refine the policy approach rather than make significant policy changes and
proposed to strengthen the Government’s policy on positive planning for town centres. With regards to policy
formulation, Local authorities would still be expected to assess the need for new town centre development and
to take account of scale, impact, accessibility and the sequential approach in selecting sites for development
plans.
2.8 Following this, the consultation paper on the new PPS4 was published in May 2009 accompanied by good
practice guidance prepared by GVA Grimley. In its final form the PPS will replace PPS4: Industrial, commercial
development and small firms; PPS5: Simplified Planning Zones; and PPS6: Planning for Town Centres.
2.9 The stated intentions of the proposed PPS4 are to support town centre investment, and to ensure that planning
promotes competition and consumer choice and does not unduly or disproportionately constrain the market.
The proposed changes include reinforcing the other government objectives identified in PPS6, to highlight the
need to promote competition between retailers and enable consumer choice, by raising productivity growth rate
in the UK and by supporting efficient, competitive and innovative retail sectors with improving productivity and
taking measures to conserve and, where appropriate, enhance the established character and diversity of town
centres. The increased focus on productivity is consistent with the findings of the Barker review and the
Government’s wider policy objective to promote sustainable economic growth.
2.10 Plan Making Policies set out the required evidence base at the regional and local level. Policy EC1.4 highlights
criteria for Local Planning Authorities (LPAs) to consider in assessing the need for retail and leisure
development including the need to take account of quantitative need for additional floorspace as well as any
qualitative considerations. In terms of assessing the need for office floorspace at the local level, Policy EC5.2

Manchester City Council Independent Retailers Study - Chorlton
December 2009
7
highlights that this will need to be informed by an assessment at the regional level and the physical capacity for
centres to accommodate new development giving consideration to the role of centres in the hierarchy.
2.11 The thrust of the local planning approach to town centres (Policy EC5) is in many respects similar to the current
PPS6 guidance although there is greater encouragement for flexible town centre polices which are able to
respond to changing economic circumstances. Policy continues to reinforce the principle that development
should be accessible by a range of transport modes, that it should promote greater choice and retail diversity,
and that it should encourage job creation in disadvantaged areas. Policy EC6 encourages LPAs to proactively
plan for consumer choice and to promote competitive town centre environments by supporting the diversification
of uses; planning for a strong retail mix that meets the requirements of the local catchment area; whilst also
recognising the role that smaller shops play in enhancing the character and vibrancy of a centre.
2.12 In terms of assessing planning applications for development, it removes the needs test, and where need is a
relevant factor, it highlights the importance of qualitative as well as quantitative considerations (Policy EC18-
20). While the draft PPS proposes to retain the sequential approach as a key element of National Policy
Guidance, it also retains the need for flexibility and recognises the role for alternative business models.
Specifically, in seeking to demonstrate flexibility, developers and operators should consider the scale of their
development, the format of their development, car parking provision and the scope for disaggregation.
2.13 The draft PPS widens the current impact test in its scope to include consideration of ‘town centre’ impacts, e.g.
impact on town centre trade/turnover and effects on vitality and viability; as well as a range of other, wider
impacts set out in Policy EC20. The guidance also acknowledges that these can be positive and negative and it
is for the local planning authority to seek an overall judgement, focusing in particular on the first 5 years after
implementation of a proposal. ‘Wider’ impacts include the impact of allocated sites outside town centres being
developed in accordance with the development plan, impact on deprived areas and social inclusion objectives,
impact on local employment; and impact on economic and physical regeneration in the area.
2.14 Further points of relevance to this study are:
• The need to take a more proactive approach to accommodating town centre uses in central locations
including, where appropriate, the promotion of the expansion of town centres; and, conversely a realistic
approach to the management of decline where justified;
• The need to establish a hierarchy of centres in each region and sub-region, with any change in the role
and function of centres to be secured as part of the preparation of regional spatial strategies (RSSs) and
through the preparation of development plans, rather than through individual applications;
• The need to assemble town centre and edge-of-centre sites for larger stores where need is identified, and
to promote higher density, mixed-use multi-storey development;
• The need to encourage a wider range of services and land uses for centres in decline;

Manchester City Council Independent Retailers Study - Chorlton
December 2009
8
• The need to avoid over-concentration of growth in the highest level centres, and for regional spatial
strategies to make clear strategic choices as to where growth is to be encouraged and decline managed;
• The need to assess the quantitative need for additional floorspace for retail, leisure and office uses over
the plan period and for five year periods within it, and the capacity of existing centres to accommodate
additional development (in the case of long-term strategic policy guidance, a longer term forecasting
horizon is required);
• The need to improve public transport linkages to existing out-of-centre facilities, but not as a justification
for their extension;
• The need for development plans to set out the roles of different centres and explain how each centre will
contribute to the local authority’s overall vision for its area;
• The need for development plans to encourage a diversification of uses in the town centre as a whole and
to promote positive management of the evening economy, perhaps identifying distinct quarters where the
evening economy is to be concentrated;
• The need for development plans to include policies which guide the appropriate scale of development to
be encouraged, setting upper limits for the scale of developments that will be allowed in different types of
centres;
• The need for plans to positively allocate sufficient sites within and at the edge of town centres so as to
meet anticipated demand for the next five years, anticipating the use of CPO powers where needed; and
• The need to promote a more balanced network of centres by strengthening local centres through
preparation of local strategies to remedy deficiencies in the local shopping provision.
Regional Policy Context
North West of England Plan – Regional Spatial Strategy to 2021 (September 2008)
2.15 The Regional Spatial Strategy for the North West of England was adopted in September 2008, replacing the
existing Regional Planning Guidance (RPG 13).
2.16 The Strategy describes Manchester as the North West’s largest sub-regional economy, with the Manchester
City Region representing the greatest potential for boosting economic performance in both the North West and
the North of England as a whole. Manchester’s strategic position is identified as lying at the intersection of two
international transport routes. The Strategy identifies potential for Manchester to close the gap that exists with
Southern England. However, the Strategy also describes the Manchester City Region as having problems with
marked social and economic inequality.

Manchester City Council Independent Retailers Study - Chorlton
December 2009
9
2.17 Policy W5 addresses retail development within the region. It identifies the connection between retail and wider
regeneration and, as such, seeks to promote retail investment where it assists in economic growth in the
region’s town and city centres. It states that schemes should be consistent with the scale and function of the
centre and should not undermine the vitality and viability of any other centre or result in the creation of
unsustainable shopping patterns.
2.18 Additionally, the policy identifies Manchester/Salford and Liverpool City Centres as the North West’s primary
retail centres and seeks to preserve their status as such. The policy lists a number of centres in which
comparison retailing facilities should be encouraged and enhanced in order to ensure a sustainable distribution
of high quality retail facilities. However, the policy also allows for investment of an appropriate scale to take
place in centres that do not appear in this list. Policy W5 also supports the principle of retail development that
facilitates entrepreneurship, particularly increasing the number of independent retailers.
2.19 Finally, the policy states that new out-of-centre regional or sub-regional comparison retailing facilities are to be
discouraged. This places the onus on Local Authorities to be pro-active in identifying and creating opportunities
for development within town centres. The policy also seeks to discourage large-scale extensions to such
facilities (2,500 sq m or more) unless they are in line with the sequential approach as established in PPS6 and
maintained in the new PPS4. This means that it is unlikely that the expansion of the Trafford Centre
(recognised as an important retail facility in the North West) will be encouraged.
2.20 Manchester City Region policy MCR1 supports interventions such as encouraging investment and sustainable
development in Regional Centres, surrounding, inner areas and towns and cities and accessible suburban
locations. It views these as necessary steps in order to achieve a significant improvement in the sub-region’s
economic performance.
Local Policy Context
Unitary Development Plan
2.21 The Manchester City Council Unitary Development Plan (UDP) was formally adopted in July 1995, and sets out
the Local Planning Authority’s policies and proposals for development within the city. The Plan was adopted
prior to the publication of PPG6 in 1996, and therefore fails to fully take account of the provisions of the
guidance which have subsequently been updated in PPS6. There have been a number of revisions and
alterations since it was first adopted, the most recent being the expiry of a number of policies, under Paragraph
1 (3) of Schedule 8 to the Planning and Compulsory Purchase Act 2004 in September 2007.
2.22 The UDP establishes the Council’s desire to see the City Centre continue as the regional shopping centre which
it sees as part and parcel of the wider regional function which Manchester plays. Policy S1.1 pledges that the
Council will work in partnership with the private sector to improve the City Centre environment for shoppers and
pedestrians, so that it is clean, safe, attractive and accessible to all.
Manchester City Council Independent Retailers Study - Chorlton
December 2009
10
2.23 Policy S1.2 seeks to enhance existing shopping provision, especially in the City Centre and in the District
Centres. The policy lists the District Centres – however, these have changed since the UDP was first adopted.
Key changes are the replacement of Beswick by Sports City and Moss Side with Hulme. The District Centres
are now:
Cheetham Fallowfield Harpurhey Newton Heath Rusholme Wythenshawe
Chorlton Gorton Levenshulme Northenden Sport City
Didsbury Hulme Longsight Openshaw Withington
2.24 The main objective of this policy is to protect the District Centres as major social and economic assets so that
they may continue to benefit from investment and renewal. The policy seeks to direct investment geared
towards improving safety, enhancing environmental quality, tackling traffic problems and increasing economic
viability in the centres of Cheetham, Sport City, Gorton, Harpurhey, Levenshulme, Longsight, Newton Heath,
Openshaw and Wythenshawe. The UDP recognises that the economic vitality of the District Centres varies
widely and there is an obvious need to target particular areas where the current provision is poor or inadequate.
2.25 Policy S1.3 establishes the Council’s objective to enhance the City’s market trading areas in order to enhance
existing shopping provision, especially in the City Centre and in the District Centres. The Council recognises
that the City’s publically and privately owned market trading areas provide a valuable service to local people
2.26 Policy S2.1 sets out the Council’s objective to ensure that all parts of the City are well provided for in terms of
good quality local and convenience shopping facilities within easy reach of people’s homes. As such, new
shops that meet local needs will be encouraged.
2.27 Policy S2.2 sets out the council’s considerations in assessing proposals for large out of centre stores (2,500 sq
m of gross floorspace or more). These include ensuring that development: will not undermine the vitality or
viability of the City Centre or a nearby District Centre or town centre; will not undermine the viability or vitality of
nearby local shopping centres which cater for day-to-day needs which are not so easily met by larger stores; is
accessible to a wide cross-section of people including disabled people and non-car users and that will not give
rise to unacceptable environmental or traffic problems.
2.28 Policy S2.3 permits the limited expansion of retail parks at Queen’s Road, Cheetham Hill and Central Retail
Park (Gt. Ancoats Street). It also seeks to enhance accessibility for disabled people to both of these parks and,
in the case of Central Retail Park, states that the Council will aim to secure improvements in car-parking
facilities. These measures are intended to help ensure the provision of a full range of shopping facilities for all
people in the City.
2.29 Residential amenities are protected by Policy S2.4 which states that new shopping facilities should not
significantly affect them, particularly through increased traffic congestion, noise and pollution from cars.
Manchester City Council Independent Retailers Study - Chorlton
December 2009
11
2.30 Design considerations are taken into account in Policy S2.5 which seeks to ensure that shopping facilities are of
a high standard of design with adequate parking provision and which provide a safe and attractive environment
for all shoppers.
2.31 Finally, Policy S2.6 states that the Council will ensure that all major shopping developments provide a range of
facilities and benefits for the comfort and convenience of shoppers including access for disabled people.
2.32 The UDP also gives policy direction for specific parts of the City, which it divides into 17 areas. Area 13 is
Chorlton and Barlow Moor. Policies are geared towards protecting and improving Chorlton as a District Centre.
Its character is described as mainly residential. None of the policies specifically relating to the economy of Area
13 have been ‘saved’ by the Secretary of State, while only one of the two policies relating to retail has survived.
Policy CB 10 seeks to ensure that no further food and drink uses will be permitted on two frontages within
Chorlton District Centre: 503-555 (odd) Barlow Moor Road and 93 – 129 (odd) Manchester Road.
Refining Options for the Core Strategy (April 2009)
2.33 The Core Strategy Issues and Options was consulted on from December 2007 until February 2008 and the
responses analysed. The Council has now published a Core Strategy Refining Options Consultation document
which should be read in conjunction with a set of background Issues Papers, one of which (Centres) is
summarised here. Consultation on these documents ended on 29th May 2009. The Council anticipates that the
following consultation on the Draft Core Strategy will be informal and is currently scheduled for November 2009.
Publication of the Core Strategy is scheduled for July 2010 with submission to the Secretary of State scheduled
for November 2010. It is anticipated that the document will be examined in March 2011 and adopted in
September 2011.
2.34 The Core Strategy initially gives an overview of Manchester’s key characteristics – demographically, physically,
economically and environmentally. It divides the city into five regeneration areas that, along with the City
Centre, cover the entire City. Of interest are the City Centre regeneration area and the South Manchester
regeneration area which contains the District Centre of Chorlton.
2.35 The City Centre regeneration area is defined as the area inside the Inner Relief Route and extends beyond this
to encompass the Oxford Road Corridor to the southern margin. The City Centre has undergone significant
change since the publication of the UDP. Residential development has increased with the effect of increasing
the population to nearly 19,000. There has also been marked economic growth. This is exemplified by
Spinningfields accommodating 20,000 jobs. The Core Strategy states that the City Centre will remain the largest
driver of employment growth in the North West and, as such, is a focus for retail, leisure, evening economy,
visitor destinations, cultural and arts facilities and regionally significant office development. The Core Strategy
identifies the need to create more effective transport connections between the City Centre and Manchester’s
more disadvantaged residents.

Manchester City Council Independent Retailers Study - Chorlton
December 2009
12
2.36 The South Manchester regeneration area runs from Whalley Range, Fallowfield and Levenshulme in the north
to the Mersey Valley and the M60 Motorway in the south. It encompasses five District Centres, of which
Chorlton is one. South Manchester is a largely residential area – over one third of Manchester’s population live
there. The Core Strategy states that the five District Centres are a focal point for neighbourhood activity and are
home to ‘niche’ markets and independent retailers. Chorlton in particular is identified as having a broad
independent retail offer. Development will be supported in all five District Centres.
2.37 The Core Strategy identifies a number of Strategic Objectives. Strategic Objective 4 seeks to provide a network
of high quality centres providing a minimum of essential services and local access to food. It states that
developments providing additional services and retail will be encouraged in the major district/urban centres.
Particular emphasis will be given to development in all centres that help to create distinctive local character.
2.38 The Core Strategy seeks to ensure that the scale of new development in existing centres should reflect the role
and function of the centre within the retail hierarchy, promote competition and not adversely effect diversity of
provision in that centre and neighbouring centres. Additionally, it states that opportunities should be taken to
support the continued vitality and viability of the centre and support the role of Independent businesses.
2.39 Strategic Objective 5 seeks to improve the physical connectivity of the City to enhance its functioning and
competitiveness and provide access to jobs, education, services, retail, green infrastructure, leisure and
recreation.
Core Strategy Refining Options Consultation – Centres Issues Paper (April 2009)
2.40 The Centres Issues Paper was produced in conjunction with the Core Strategy Refining Options Consultation
document. It provides additional detail on responses to the Core Strategy Issues and Options consultation in
connection with Manchester’s designated centres.
2.41 A majority of respondents (90%) stated that District Centres should provide residents with core goods and
services to support a sustainable centre. Additionally, respondents wanted a range of independent shops, cafes
and pubs protected from ‘unfair competition/monopolies’. They also wanted a limit on retail floorspace in retail
outlets in order to help protect existing shops and small independent businesses.
2.42 A distinction is made between centres such as Hulme and Sports City which are anchored by modern
convenience retail facilities and Chorlton and Didsbury which are described as more traditional with a broader
range of retailers and services.
Manchester City Council Independent Retailers Study - Chorlton
December 2009
13
South Manchester Strategic Regeneration Framework (2008)
2.43 The South Manchester Strategic Regeneration Framework, which covers the District Centre of Chorlton, sets
out the Council’s key priorities and activities in order to guide public and private investment in the area over the
next ten to fifteen years. The regeneration area is home to one of the most successful neighbourhoods within
the city, but there are also areas of deprivation.
2.44 Chorlton, along with Whalley Range, West Didsbury, Didsbury Village and East Didsbury, is described as a
‘high-quality’ neighbourhood, offering good-quality housing, a range of services and centres, strong areas of
heritage value and open space. The document describes Didsbury Village and Chorlton as being focused
around their District Centres, which are largely covered by conservation areas. They offer a mix of large
traditional properties and newer apartments, close to a range of facilities and public transport. The areas are
extremely popular for house buyers.
2.45 The document identifies a number of key issues, challenges and opportunities for South Manchester, including
improving the quality of the environment and improving the quality and vitality of the centres. The centres are
described as being at the core of the successful neighbourhood strategy for South Manchester. They should
provide for local retail and service provision as well as acting as a hub for the community. The document
reiterates the concept of a centre hierarchy and states that the five District Centres in South Manchester
(including Chorlton) provide the higher level of the South Manchester centre hierarchy.
2.46 It outlines the key characteristics of each centre. Chorlton is described as a large District Centre with over 250
outlets compared to a centre average of 100. It performs well in comparison with other centres across
Manchester. It has a large number of independent retailers and this is a strong focus for its overall retail and
service offer. The document also states that Chorlton retains more people for non-food shopping than any of the
other centres in Manchester (excluding the city centre). Nevertheless, the document states that there is
significant leakage of expenditure from this centre. A number of issues are outlined which need to be addressed
in progressing the development of the area:
• Increase the amount of time people spend in the centre in order to increase expenditure;
• There is a quantitative need for both food and non-food retailing;
• The mix of national and local independent retailers is an asset that needs to be protected;
• Current commercial premises do not cater for the requirements of small businesses wishing to locate to
Chorlton;
• Slight increase in crime against businesses and robbery;
• Civic community provision is poor;

Manchester City Council Independent Retailers Study - Chorlton
December 2009
14
• Shopping environment and public realm is in need of significant improvement;
• Centre is accessible by public transport but dominated by traffic;
• Need to assess all public transport movements in light of Metrolink extension.
Summary
• The key objectives of New Draft PPS4 are to support town centre investment and in line, with existing
PPS6 promote consumer choice between retailers and enable consumer choice. It also encourages
Council’s to recognise the role that smaller shops play in enhancing the character and vibrancy of a centre.
• The adopted North West RSS supports the expansion of centres and stipulates that any investment made
should be consistent with the scale and function of the centre, should not undermine the vitality of any
other centres or result in the creation of unsustainable shopping patterns. It also supports the principle of
retail development that facilitates entrepreneurship, particularly increasing the number of independent
retailers.
• The UDP aims to enhance existing shopping provision in the City Centre and in the District Centres such
as Chorlton. The Core Strategy Issues and Options paper seeks to provide a network of high quality
centres providing a minimum of essential services and local access to food and which will, in turn,
encourage development which provides additional services and retail which will support the continued
vitality and viability of the centres.

Manchester City Council Independent Retailers Study - Chorlton
December 2009
15
3. NATIONAL RETAIL TRENDS
3.1 To put this latest assessment of need into context, it is relevant to consider the wider economic and social
trends likely to influence retailing in across the Manchester area in the future. A number of trends are likely to
have a bearing on the future pattern of retail provision in the sub region, and the opportunities arising from
development proposals.
3.2 This section examines key trends and drivers for change in the retail industry since the 2005 Study was
undertaken. We outline the key national trends in retailing and service provision of particular relevance to
Manchester and Chorlton from a range of published data sources, including research by Verdict Analysis, Mintel
and the New Economics Foundation.
Demographics
3.3 Over the last 15 years UK population has increased at a rate of approximately 0.4% pa, whilst the number of
households has increased by 0.5% pa, as average household size has decreased to 2.34 in 2006, with smaller
families, more divorces, people living longer etc. The population is also ageing. These trends are forecast to
continue and will affect spending habits, how much we spend, on what and where.
3.4 Over the next 20 years the 65 and over age group is expected to grow by 4.5m or 47% and the under 65s age
group by only 8%. Older shoppers have a younger mindset than in the past, are more fashion aware and
financially better off as a result of general house price growth as well as income growth (but post retirement
income from pensions could be a concern if they do not achieve anticipated values). They will have more time
to shop, will spend more on DIY and gardening and will expect good customer service. Clearly, the economic
slowdown will impact upon disposable income and pension pots with more cautious spending patterns in the
immediate future.
3.5 Younger shoppers will have higher education fees to pay, will experience higher housing costs, will be more
computer literate and spend more on-line, and will spend more on entertainment/leisure so they may have less
to spend in retail shops.
Income & Expenditure
3.6 Incomes and expenditure have shown strong growth over the last 20 years, with retail expenditure growing
faster than incomes. Overall, retail expenditure has increased by about 3.9% pa in real terms over the last 20
years, with most of this growth on comparison goods rather than convenience goods, where growth has been
less than 1% pa. Comparison goods growth has been close to 5.3% pa over the last 30 years, over 6% pa over
the last 20 years and even stronger over the last 10 years. These strong trends are not expected to continue in

Manchester City Council Independent Retailers Study - Chorlton
December 2009
16
the foreseeable future due to current high levels of consumer debt, an already low savings ratio and a weaker
housing market.
3.7 The recent credit crunch has had massive impacts on the retail sector. It is estimated that 1.4 million
homeowners will need to re-mortgage over the next year. A study by the insurance company AXA found that
three in four families with an income of more than £30,000 were planning to curb spending this year as
household budgets become increasingly stretched.
3.8 According to Verdict, as customers become more concerned about the economic outlook, they are becoming
more selective in their purchasing habits. With rising living costs, disposable incomes are being squeezed, and
as a result customers are shopping around more to find the best possible value. Increasingly retailers are
finding it harder to please customers, and across all sectors, retailers are converting fewer customers into main
users and shoppers are less loyal to their main stores. Such circumstances will have implications on retail
capacity forecasting, particularly over the short term, and this is discussed in more detail in Section 5.
3.9 It is recognised that the UK economy is now firmly in the grips of a recession. The deterioration has been rapid
with the fourth quarter of 2008 seeing a year-on-year decline of 1.5% - one of the sharpest contractions in
economic growth since the early 1980’s. Although 2009 will bring a sharp contraction in activity, we do not
believe that the pain will ease quickly. Indeed, we are forecasting that the economy will continue to shrink into
2009 with Verdict forecasting that it will not be until the final quarter of 2010 that we will see positive year on
year GDP growth.
3.10 Moving beyond 2010, economic growth is predicted to return to positive territory but will be sluggish for a
number of years as consumers, the private and public sectors all continue to pay down debt. Since we
undertook the Quantitative Retail Study for the City (2006), there have been significant changes to forecast
levels of growth. Experian and MapInfo, the main economic retail forecasters have published significantly
reduced growth rates in available expenditure which consequently reduces identified capacity for additional
floorspace. Notably, Experian report as follows:
“The detailed consumer spending forecasts used in the October document [Experian Retail
Planner Briefing Note 2008] were based on figures available before the eruption of the
major financial crisis in September, the collapse of consumer and business confidence and
the sharp decline in the global economy.
Since that forecast, there have been dramatic changes in the UK’s performance. The new
forecast incorporates the substantial decline in GDP in the second half of 2008; the sharp
increase in unemployment in recent months; gloomy survey evidence that has emerged in
2009; fiscal measures adopted in an attempt to shore up the economy and the steep decline
in Bank rate in the past few months.”
Experian Business Strategies, February 2009

Manchester City Council Independent Retailers Study - Chorlton
December 2009
17
3.11 The growth projections used in forecasting capacity should therefore respond to advice in respect of the use of
trend line (historic) growth rates and forecast growth rates based on consumer expectations. Due to the retail
expenditure boom in the latter half of the 1990’s and the first half of the 2000’s and the major economic
recession which is now underway, there are significant differences between these two approaches.
3.12 On this basis, we are advised to use economic forecasts prepared by MapInfo/Oxford Economic Forecasting
and Experian Business Strategies which take into consideration current and future economic instability.
Evidently, the growth rates being used for retail capacity forecasting have changed as a consequence, and
have considerable implications on the levels of floorspace that can be accommodated in the short-medium term,
i.e. up to 2016.
Sales Density Increases
3.13 Although hard quantitative evidence is limited, comparison businesses in particular have, over time, increased
sales densities by achieving improvements in productivity in the use of floorspace. PPS6 (paragraph 2.34)
requires that quantitative need/capacity assessments have regard to a realistic assessment of such
improvement. Analysis of past data is difficult as over the last 20 years sales densities increases have been
affected by changes in the use of retail floorspace, with higher value space-efficient electrical goods replacing
lower value space intensive goods, the growth in out-of-centre retailing, a number of one-off events like Sunday
Trading and longer opening hours, and the very strong growth of retail expenditure relative to the growth in
floorspace.
3.14 The future growth in sales densities will undoubtedly be affected by the way in which retail space evolves and is
used in the future. At the current time, as a consequence of the credit crunch, sales efficiency growth is unlikely
to reach more than 0.5% returning to 2.0% beyond 2016. This is reflected within our retail capacity forecasts
set out in section 5.
Employment
3.15 Over the last 20 years retail expenditure has increased at about 4% pa, but retail employment has increased
much more slowly. Total employees in retail employment have increased from 2.2 million to 3.0 million, an
increase of 1.5% pa. However, this growth has been in part time employees. Full time equivalent (FTE)
employment has hardly increased at all, from about 2.1 million to 2.2 million, a 0.4% pa increase. Over the next
15 years Experian Business Strategies expect a marginal increase in FTE employment in the retail sector with a
slightly higher increase in part time employment. Evidently, this needs to be monitored in the forthcoming years
based on the slow down in the economy and corresponding growing levels of unemployment with significant
consequences for available retail expenditure and retail sector employment positions.

Manchester City Council Independent Retailers Study - Chorlton
December 2009
18
Location
3.16 Strong income and expenditure growth has affected retailing in another important way – the rise in car
ownership and mobility. In 1961 only 30% of households had a car (one or more cars) and only 2% had more
than one car. With public transport (and walking and cycling) the dominant mode of transport, shopping choices
were limited and distances travelled were short. By 1970 car ownership had increased significantly so that
nearly 50% of households had one or more cars and the number of households with two or more cars had
quadrupled but was still under 10%.
3.17 Currently about 77% of households have one or more cars and a third of households have two or more cars, a
huge increase in mobility over the last 30-40 years. Households are now much more mobile than they were and
therefore their choices of where to shop and the distances they can travel are much greater. These trends will
continue but the rate of change may well diminish, particularly in light of the economic slow-down. It would
seem likely, however, that levels of mobility will be retained although frequency of travel may decline as the
number of cars per household may fall in the economic downturn.
3.18 Increased mobility and affluence has favoured larger centres over smaller centres. As a result larger centres
have increased in size and importance relative to smaller centres which has further reinforced the attraction of
larger centres to more mobile shoppers. Smaller centres have, therefore, lost market share and have seen
much less new development than the overall rate of expenditure growth would imply. This is recognised by
PPS6, which urges local authorities to be pro-active in trying to encourage development in smaller centres.
3.19 Increased mobility and affluence has also stimulated out-of-centre development, which has grown much more
rapidly than town centre development. Over the last 20 years the majority of retail development has been in
edge or out-of-centre locations. This has led to increasingly restrictive planning policy in favour of town centres
over the last 10 years, but only recently has the growth in out-of-centre development started to slow. This slow
down is expected to continue, but Verdict still expect sales at out-of-centre locations to increase at a faster rate
than at in-centre locations. They consider that out of town retailing, if provided effectively with improvements to
the mix of retailers and facilities on offer, could emerge from the current downturn a more desirable shopping
location.
3.20 In May 2006 the Office of Fair Trading (OFT) referred the supply of groceries by retailers in the UK to the
Competition Commission (CC) for investigation under Section 131 of the Enterprise Act 2002. The CC’s
published its findings in April 2008 and reported that “in many respects, competition in the UK groceries industry
is effective and delivers good outcomes for consumers, but not all is well”. The two main areas of concern
highlighted were:
1) that a number of grocery retailers have strong positions in several local markets. Barriers faced by
competing retailers that could otherwise enter these markets mean that consumers get a poorer retail

Manchester City Council Independent Retailers Study - Chorlton
December 2009
19
offer than would otherwise be the case, while those grocery retailers with strong local market positions
earn additional profits due to weak competition in those markets, and
2) the transfer of risk and unexpected costs by grocery retailers to their suppliers through various supply
chain practices if unchecked will have an adverse effect on investment and innovation on the supply
chain and therefore, on consumers.
3.21 A number of steps to address the problems were posed including the recommendation of the introduction of a
competition test as part of the planning process for new stores, to favour new retailers other than those which
already have significant market shares in an area. Planning for consumer choice and the promotion of
competition have been included within the Proposed Changes to PPS6 Planning for Town Centres, consultation
document, with final recommendations expected when the guidance is adopted later in 2009.
Recommendations were also made by the Competition Commission to try and prevent retailers using the
control of land sites in highly concentrated markets as a means of inhibiting entry by competing retailers. These
steps would have implications on the potential new locations that some retailers could look to develop within.
3.22 Tesco Stores Ltd challenged the fairness of the proposed new test, and the Competition Appeals Tribunal has
now upheld the supermarket’s complaints in March 2009, saying the Commission failed to properly assess the
implications of the proposed competition test. We understand that the Competition Commission has indicated
that it may try to revive the test in a revised form.
Size of Units
3.23 The growth of multiple traders and increased competition between companies has meant that the retail structure
is increasingly dominated by large companies requiring larger shop units. Shopping centres and out-of-centre
development that has been able to accommodate this demand for larger sized units (typically 500-2,000 sq m or
larger) have grown in importance, reinforcing the trend of higher order centres and out-of-centre retailing
growing in relative importance (i.e. polarisation in the retail hierarchy).
3.24 The growth in the size of stores has caused a contraction in the number of shop units and consumer choice.
This is particularly evident in the food sector, with a marked decline in the number of smaller and more
specialist food retailers (greengrocers, butchers, fishmongers, bakers etc), and a large increase of superstores.
This is indicated by Verdict Research which shows a 31% reduction in the total number of convenience stores
over the last 10 years, as space is concentrated into a smaller number of larger stores.
3.25 Whilst the number of superstores (>25,000 sq ft) has increased by 37%, food specialists and off
licences/tobacconists have declined by 35% and 57% respectively. These trends may well weaken in the future
due to possible market saturation of large foodstores and concerns over lack of competition due to the market
dominance of a few key multiples.

Manchester City Council Independent Retailers Study - Chorlton
December 2009
20
Foodstores
3.26 A by product of the restriction of new development of large foodstores is the growth in applications to extend
existing stores and the changing composition of floorspace within existing foodstores. There is an increasing
emphasis on the sale of comparison goods at the expense of convenience goods, as expenditure growth rates
for comparison goods are much higher than for convenience goods and margins are greater, although sales
densities are often lower. This trend poses an increasing threat to smaller centres, as larger foodstores will
increasingly sell a wider product range of day-to-day convenience and comparison goods and services.
According to Verdict, non-food floorspace in the larger format stores of the top 4 grocers now accounts for
between 28% (Morrisons) and 50% (Asda) of sales floorspace.
Independent Retailing
3.27 According to the House of Commons All-Party Parliamentary Small Shops Group’s High Street Britain 2015
(2006) report, the small retail sector is a key driver of entrepreneurship, employment, skills, local economies,
innovation, and sophisticated business networks, as well as accessibility to vital goods and services, diversity,
social inclusion and community activities. However, contributors to the report expressed concern regarding the
pressure independent retailers are coming under from market-led forces and external (macro-environmental)
forces.
3.28 The report lists factors which have caused concern to small retail operators, namely:
• Aggressive expansion and competition by larger competitors;
• Distortion of the supply chain;
• Rising costs of property;
• Crime;
• Poor planning decisions;
• Lack of appropriate business support;
• Disproportional regulatory burdens;
3.29 To this list can be added the contemporary concern of dramatically reduced consumer spending brought about
by the ‘credit crunch’ and subsequent recession. These are challenges which small, independent retailers are
less well equipped to overcome than their larger competitors. The sector worst affected by this downturn in the
economy is clothing & footwear, with this sector accounting for 41.5% of total casualties’ sales in a study of 100
retail casualties carried out by Verdict, a research and database provider (UK Retail Casualties during the
Credit Crunch: Insight 2009). The study does not follow the many small retailers put out of business during the
recession, instead focusing on medium-to-high profile retailers. Nevertheless, it may be assumed that this is a

Manchester City Council Independent Retailers Study - Chorlton
December 2009
21
trend reflected amongst independents as non-essential items are the first to be jettisoned by anxious
consumers.
3.30 The Verdict study states that the trend in retail casualties followed three stages. At the beginning of the period,
weak operators in challenging sectors continued to fail, followed by retailers hit by the housing market’s collapse
and, finally, by those connected to the banking crisis. The report points out that the credit crunch and
subsequent recession did not, in itself, cause these casualties. Instead, it simply precipitated a trend that was
already in place – the shakeout of weaker retailers and surplus space in an industry that was suffering from
overcapacity. Again, the Verdict report concentrates on medium to large retailers. It is unlikely that small
independents are guilty of having surplus space, but it is more than likely that the recession has hastened the
demise of weaker independents in the same way as it has their larger counterparts.
3.31 Multiples have been able to under-cut smaller independent retailers, prompting customers to migrate for
cheaper goods. High Street Britain 2015 (2006) states that between 1991 and 2004, 8380 petrol forecourts went
out of business with hypermarkets now selling over 30% of all fuel sold in the UK despite only operating from
10% of the sites. Additionally, at least 30,000 independent food, beverage and tobacco retailers have gone out
of business in the last decade. Pressure is also being exerted by multiples diversifying their offer, for example
food supermarkets extending into non-food areas.
3.32 Small shops rely on a number of other industries for survival, such as agriculture and manufacturing.
Disruptions or changes in this supply chain can have a detrimental effect on the health of retail businesses, an
effect which is exacerbated in the case of smaller businesses.
3.33 High Street Britain 2015 (2006) describes how promotions by large multiple retailers can mean that goods are
being sold at below-cost. This meets the short term needs of the retailer and the consumer, but has the effect of
exerting downward pressure on prices across an entire industry which can have severe implications for the
margins of smaller suppliers and retailers.
3.34 Property costs, the second biggest cost for retailers after wages, have also been a concern to independents.
They have historically risen much faster than sales growth, although recent contraction in average commercial
rents has put a halt to this for the moment. Nevertheless, smaller retailers have been placed under pressure by
this historic increase in rents.
Shopping & Leisure
3.35 Due to increased affluence and mobility, and the rise of the internet, shoppers no longer merely shop to satisfy
‘needs’, they increasingly shop to satisfy ‘wants’ as well. Retailing in the higher order centres and the more
attractive smaller centres is changing and arguably becoming more of a quasi leisure experience. Leisure
spending growth is continuing to outstrip that of retail, and despite the economic slowdown, at the moment
consumers seem to be willing to continue spending on leisure.

Manchester City Council Independent Retailers Study - Chorlton
December 2009
22
3.36 Quality restaurants, coffee shops, cafes and bars, as well as health and fitness centres and multiplexes in larger
centres, are therefore important to attract shoppers and encourage longer stays and higher spending. Better
integration of retail and leisure facilities mutually benefits both sectors. Pedestrianised streets and covered
retail areas are also important in attracting shoppers, as is the overall attractiveness of the town centre, along
with good accessibility and car parking.
3.37 A number of factors have helped drive the growth of leisure provision in town centres. Planning policy is
important as is the fact that urban living is fashionable. Town centres can offer consumers a much more vibrant
atmosphere in which to eat and drink and they also offer a much wider choice of leisure venues, allowing more
spontaneous decisions. For bars, restaurants and health & fitness clubs, the attraction of the town centre is
‘daytime trade’ and the ability to capitalise on proximity to businesses and shoppers.
Internet Shopping/E-Tailing
3.38 Online spending is growing at its fastest rate for six years, driven by convenience and low prices, and so far e-
retailing is showing no signs of being affected by the recent economic downturn. According to Verdict (2008),
the e-retail market grew by 35% between 2006 and 2007, which is considerably higher than the 3.6% growth in
the total retail market, and e-retail is expected to continue outperforming the total retail sector over the next five
years.
3.39 Worth £14.7bn in 2007, the online market is becoming an increasingly important contributor to retail, accounting
for 5.2% of all retail sales, (up from 3.8% in 2006). Verdict’s research found that almost 66% of UK households
now have access to the Internet, with 55.5% having broadband access, which is making online shopping easier,
faster and more reliable. As technology continues to improve, it will fuel further growth in the market. Overall
the internet shopper population is forecast to grow by approximately 50% between 2007 and 2012.
3.40 The online market is dominated by the electrical and food & grocery sub-sectors, which between them account
for around half of all sales. The food & grocery sub-sector, with rapid growth of 39.5% in 2007 is expected to
overtake electricals in the top spot. Online clothing and footwear sales grew 38% during 2007, and with sales of
£1.7bn, clothing & footwear is the UK’s third largest online market.
3.41 Although only accounting for a very small share of online spending, the market which saw the most dramatic
online growth in 2007 was furniture and floor coverings, growing by 41% from £0.4bn to £0.7bn, despite the
slowdown in the sector overall, with Ikea’s launch of a transactional website being sited as one of the drivers of
growth. The music & video sector continues to have the overall highest online market penetration at 30.8% of
total sector sales, and this is forecast to double by 2012, which could have implications for physical store
requirements.
3.42 As a consequence of this growth, there are huge pressures on retailers as the Internet has provided an
attractive alternative for many consumers. Shoppers are selecting their own retail mix online and shopping

Manchester City Council Independent Retailers Study - Chorlton
December 2009
23
centres need to compete with this choice, which is not only driven by price and range, but also service and
expertise. Town centres will increasingly have to provide a retail experience that the Internet and supermarkets
are unable to match, and the market will respond in some way to the varying impacts on different retail sectors.
In accordance with PPS6, the emphasis should be on the overall town centre experience, the mix of uses, and
not just the retail offer.
Summary
• Incomes and expenditure have shown strong growth over the last 20 years, with retail expenditure growing
faster than incomes. This has seen corresponding increases in sales densities within existing retail
floorspace, which has also been driven by factors such as high value space efficiency and longer opening
hours. Crucially, for Manchester City Council the current economic slow down as in other areas will have
significant impacts on the retail sector and growth forecasts will need to reflect recent publications from
Experian Business Strategies. This is reflected in Section 5.
• Heightened mobility through increased car ownership, alongside growth in affluence, has favoured larger
centres over smaller centres. Shoppers are more willing to travel further a field to higher order centres
which have increased in size and importance relative to smaller centres, leading to a consequent fall in
their market share. As such, PPS6 now encourages local authorities to be pro-active in trying to
encourage development in smaller centres; for example, Chorlton within the catchment of larger centres
such as Manchester City Centre and the Trafford Centre.
• The composition of town centres has changed through new development, with a growing number of
companies requiring larger shop units to meet their shop format ratios. This has again favoured the larger
centres which generally have the space to meet such requirements and are able to accommodate this
demand. This is particular noticeable in the convenience sector, which has seen a 37% increase in food
superstores, but a 31% fall in total number of convenience stores over the last 10 years. This has led to
current concerns in respect of lack of competition and market dominance.
• Leisure spending growth is continuing to outstrip that of retail, and despite the economic slowdown, at the
moment consumers seem to be willing to continue spending on leisure – although this may change in the
coming months. Nevertheless, the mix of uses in a town centre is vital to offer choice to shoppers, and
quality restaurants, coffee shops, cafes, bars and other leisure facilities are all important to encourage
frequency of visit and longer stay times.

Manchester City Council Independent Retailers Study - Chorlton
December 2009
24
4. CHORLTON: HEALTH CHECK
4.1 This section sets out the detailed assessment of our audit and healthcheck of Chorlton District Centre based on
the key performance indicators set out in Chapter 4 of PPS6.
Introduction
4.2 Chorlton District Centre is a vibrant suburban centre within the southern part of Manchester. The layout of the
retail area is cruciform and consists of a short main road (Wilbraham Road), which runs east to west and
accommodates densely packed retail units including a number of multiple retailers such as Morrisons and
Somerfield, and a linear high street (Manchester Road/Barlow Moor Road) which intersects Wilbraham Road,
runs north to south. The retail provision along Barlow Moor Road is less dense, and there are significant gaps
in the retail frontage to the south of the centre along Barlow Moor Road where residential use breaks up and
divides the retail provision. The centre also includes the 1970s The Square Shopping Precinct which is located
off the north side of Wilbraham Road in the western part of the centre.
Diversity of Town Centre Uses / Retailer Representation
4.3 Experian Goad surveyed the centre in March 2007 and established the concentration of different types of town
centre uses, including:
• shops selling comparison goods (clothing, footwear and other non-perishable goods);
• convenience retailers (supermarkets, foodstores, newsagents, butchers, bakers etc.);
• retail services (dry cleaners, health and beauty parlours, opticians);
• leisure services (bars, cafes, cinemas, restaurants and takeaways etc.) and
• financial services (building societies, banks, legal services, property services etc.)
4.4 The Experian survey does not cover the entire centre as it is identified in the Manchester UDP and unfortunately
omits a stretch of town centre uses on Manchester Road north of the Library. Accordingly, the Experian
Category Report identifies 216 units within their survey area, comprising approximately 32,860 sqm of gross
centre floorspace. Given this omission we examined the exact proportion of comparison and convenience
provision in the centre by unit count based on a site visit in February 2009.
4.5 The results indicate that the split between the different retail categories in Chorlton is generally in line with the
UK average, although the Chorlton’s retail provision is more heavily weighted in favour of service uses at the
expense of comparison shopping which is underrepresented. We identify the provision of each retail category
below examining the proportion of multiple and independent retailers in the centre. For the purpose of
differentiating between an independent/multiple retailer we draw on Experian who define a multiple retailer as
being part of a national network of nine or more outlets.

Manchester City Council Independent Retailers Study - Chorlton
December 2009
25
Comparison Provision
4.6 With 54 units composing just 25% of the overall unit count, comparison shopping in Chorlton compares poorly
with the national average of 34.8%, which is not surprising given Chorlton’s role as a district centre where the
focus is more on convenience and service provision. Most of this comparison provision is made up of
independent retailers (76%).
4.7 The presence of multiple outlets in conjunction with a good range of independent retailers can enhance the
appeal of a town centre. In Chorlton multiple retailers compose only 24% of the comparison shopping offer,
including such operators as Boots the Chemist, Ethel Austin and a number of charity shops. This amounts to a
fairly weak representation of comparison multiple retailers as is to be expected from a District Centre. There
are very few well known high street retailers; conversely independent retailing in Chorlton is very strong.
4.8 In terms of the breakdown of specific uses, our survey identified that there are nine clothes shops, seven of
which were independent retailers. There are five hardware/household goods shops, four of which were
independent; and of the four florists in Chorlton, three of which are independent. There are also nine charity
shops, with only one independently run. Whilst, there are five units selling household goods, with one
independent and five independent furniture shops.
Convenience Provision
4.9 With approximately 35 units, convenience shopping is better represented with 5,316 sq m net of floorspace
taking up approximately 16% of the overall unit count as opposed to the national average of only 8.8%. Again
this is to be expected given Chorlton’s role as a district centre. The majority (66%) of convenience units are run
by independent retailers and a full list of independent retailers is located in Table 6 of Appendix 1.
4.10 Convenience shopping is reasonably well represented in terms of floorspace and there is a wide range of
different independent convenience retailers in the centre. The schedule of independent convenience retailers
contained in Table 6 (Appendix 1) shows that there is approximately 2,003 sq m net of convenience retail
floorspace that is currently occupied by independent retailers in Chorlton. Including both independent and small
chain shops we identify three bakers, three butchers, one fishmongers, four green grocers and two
delicatessens.
4.11 There are also many larger multiple convenience stores and supermarkets including Morrisons and Somerfield
(which has recently been re-branded as Co-op) on Wilbraham Road, Quality Save in the precinct, a recently
opened Tesco Express in the north of the centre on Manchester Road and a Co-op in the south of the centre on
Barlow Moor Road. Unicorn, which is an independently store selling a range of organic and local produce, is
also situated to the north of Tesco Express off Manchester Road.

Manchester City Council Independent Retailers Study - Chorlton
December 2009
26
Service Provision
4.12 By contrast the service based retail provision in Chorlton is strong with 116 units, this accounts for 53.7% of the
overall unit count which exceeds the national average of 45.8%. In terms of floorspace however, the 18,958 sq
m of service use floorspace (including retail, leisure and financial services) composes 57.7% of all floorspace in
the survey area, which is well in excess of the 38.8% national average. This demonstrates that Chorlton is
predominantly a local service centre with a generally weak comparison shopping offer, while the local
convenience and service offer is strong and well represented.
4.13 According to the Experian category report, 69% of all service units in Chorlton are independently operated, and
most of these are ‘leisure services’ including fast food takeaways, nine restaurants, two public houses, five
cafes and four bars/wine bars. The independent ‘retail services’ included 15 health and beauty salons, two dry
cleaners and three opticians, among others.
Vacant Property
4.14 The proportion of vacant retail property is one of the relevant indicators that is taken into account when
assessing the vitality and viability of a centre. Vacancy levels are low in Chorlton with 14 premises accounting
for just 6.5% of the overall unit count at the time of the Experian survey, this compares very favourably with the
national average of 10.4%. Vacancy levels are even more positive when the quantum of floorspace is taken
into account: only 1,208 sq m were vacant amounting to 3.7% of the centre floorspace, this is very encouraging
considering the national average is 8.5%.
Retailer Demand
4.15 The number of retailer requirements that are lodged for a particular centre is an indication of how keen
operators are to locate premises in the centre. According to the Focus database, there are currently only three
requirements for premises in Chorlton, indicating that the centre is not a priority location for retailers to set up
operations, which is not surprising given the localised shopping role of the centre. The retailers with a
registered requirement include Appna Continental Cash & Carry Ltd, British Red Cross Charity Shop and Ego
Restaurants. The British Red Cross already have a presence in the centre and it is unclear whether they have
additional requirements.
4.16 There are no registered requirements from convenience retailers, although this should be treated with caution,
as some food store operators do not register requirements on publicly accessible databases due to the strong
market competition for development sites.

Manchester City Council Independent Retailers Study - Chorlton
December 2009
27
Javelin Ranking
4.17 Our qualitative analysis of Chorlton indicates that the centre is healthy and performing well in a number of
health check indicators. There are, however, some areas of concern which indicate that close attention needs
to be paid to the future development of Chorlton to ensure it retains its role in the retail network.
4.18 The Javelin Venuescore rankings of town centres is based primarily on the range of shopping services and
major multiple retailers that are in operation in each town. The centre is currently identified at 845th place in the
rankings (Javelin Venuescore 2009). This is a deterioration compared with Chorlton’s performance in recent
years as the centre was ranked at 834th position in both 2008 and in 2007. This drop in the rankings indicates
that Chorlton’s performance has slipped slightly since 2007 in comparison with other UK centres.
Physical Environment
4.19 The quality of the environment throughout the centre is generally good. Wilbraham Road has a mix of building
styles including a number of poorer quality modern buildings including units occupied by Somerfield at the
western end of the centre and Ethel Austin at the eastern end. The quality of the shopping environment along
Wilbraham Road is also impeded by the two-way road network and the narrow pavements particularly at the
eastern end of the centre on both north and south sides of the road. Pavements are in a reasonable condition.
4.20 The open air pedestrianised Precinct along Wilbraham Road is well maintained and provides a reasonable
shopper friendly environment, although architectural quality is not high and the scheme built in the 1970s is
looking fairly dated. However, the precinct is busy and vibrant with the majority of shops occupied.
4.21 Barlow Moor Road is more of a secondary retail frontage with a more varied mix of retail provision. The quality
of the environment along this stretch is generally good, with signs of investment in shop fronts although more
vacant units are located particularly on the western side of this stretch in the south of centre.
4.22 Overall, we consider that there are opportunities to improve the physical environment in Chorlton. There could
be some scope for more environmental enhancements and greening, including the provision of more soft
landscaping including hanging baskets and trees which would enhance the general shopping environment.
4.23 Investment in the physical environment is necessary to ensure shoppers in the catchment area view the centre
as a pleasant place to shop. A high quality environment will also continue to generate interest from retailers for
new premises and will help retain retailers already represented. A declining physical environment will push
shoppers away to competing centres and retailers are less likely to seek space in Chorlton.

Manchester City Council Independent Retailers Study - Chorlton
December 2009
28
Accessibility and Parking Provision
4.24 Accessibility is an important consideration when considering the health and future prospects of town centres.
Ease of access and parking are key factors influencing the underlying success and attraction of a centre for
customers, businesses and visitors.
4.25 The centre currently has a reasonable level of accessibility to other centres in this part of Manchester but there
is no train station or tram providing direct linkages to the City Centre, only a bus service. We understand there
are confirmed plans to extend Manchester’s Metrolink through Chorlton on the site of the former train station
near the Morrison’s store with the new line expected to be completed by 2011/12.
4.26 We have drawn on the survey data which revealed how people generally choose to travel to Chorlton. The in
centre survey highlighted that 57% of respondents walked to the centre, while 25.7% came by car. A further
15.8% came by bus and 2.0% cycled. The Telephone Survey revealed that the highest proportion of people
travel by car, with c.46% of people indicating that they visit Chorlton in such a way, while 29.4% walk, 15.2%
come by bus, and 4.6% cycle to the centre.
4.27 The discrepancy between the two surveys is presumably because the in centre survey would catch more
regular local visitors who walk into the centre, whilst the household survey reflects the wider catchment area
who are not always within walking distance of the centre and are therefore more likely to drive.
4.28 The survey data showing mode of travel and length of journeys underlines the importance of the car to
shoppers visiting Chorlton and the need for the centre to provide some quality parking provision to serve the
visitors. The main car parks in the centre are currently located to the north of the precinct where approximately
140 spaces are available, while approximately 200 spaces available at the Morrison’s store. On street parking
is also available at various points throughout the centre.
4.29 The business survey commissioned as part of this study also asked operators if they felt they had appropriate
car parking facilities outside their premises. Opinion was evenly divided on this issue with 50% answering that
they did, and 50% saying they did not. When asking what businesses considered was the key weakness of
Chorlton the majority of respondents (75%) cited the cost/availability of car parking as being the key issue.
Customer Views and Behaviours
In-Centre Survey Results
4.30 In order to understand the views and behaviours of visitors to Chorlton, an in-centre survey was conducted in
the centre in March 2009. In total, 100 visitors were surveyed over the week between 10am – 4pm, which is a
robust sample for the size of the centre. Our analysis of the results is set out below.

Manchester City Council Independent Retailers Study - Chorlton
December 2009
29
4.31 Of the 100 people who took part in the In-Centre survey 86.1% classed themselves as shoppers and 3.0%
considered themselves visitors/day-trippers. 54.5% stated that the main purpose of their visit was food
shopping, while 9.9% came to Chorlton for non-food shopping (clothing, footwear, soft furnishings or electrical
goods). Of the 54.5% of people who visited for food shopping, 43.1% said they were there to visit Morrisons,
18.5% were visiting Quality Save, 13.8% were visiting Unicorn and 10.8% were visiting WH Frost. When asked
how much money they expected to spend in the centre that day 55.5% answered £10 or less.
4.32 Respondents were asked why they chose Chorlton over other District Centres, 80.1% cited reasons of
convenience such as the centre being close to home, work, or friends and family. 7.9% or respondents chose
Chorlton because it had a good range of shops and services, while another 7.9% credited Chorlton’s good
range of independent shops. Interestingly 6.9% of people chose to come to Chorlton to support the local shops
in the centre. One person cited Chorlton’s pleasant environment as the main reason for choosing the centre.
4.33 When asked how often they visited the centre for shopping purposes 91.1% said they visited at least once a
week and almost a third of those people claimed they came to shop in Chorlton almost every day. 66.3% of
respondents said they never do late night shopping in Chorlton and 21.9% said they did late night shopping
once a month or more often. 30.7% of people said they come to Chorlton during the day once a week or more
frequently for the purposes of eating or drinking, while 42.6% claimed they never visited Chorlton during the day
for the purposes of eating of drinking. The results for visiting the centre at night time for eating and drinking
were similar although only 18.9% claimed they came once a week or more frequently and 46.5% said they
never visited at night for those purposes.
4.34 When asked to name any number of things they liked about Chorlton 64.5% of respondents cited its convenient
location or its accessibility among other things. 48.5% of people mentioned the good range of independent
stores. When these people who liked the range of independents were asked what it was they liked about such
stores the following answers were given;
• 38.8% said it was the friendly service,
• 36.7% stated it was the different and interesting items one could find in these stores, and
• 36.6% claimed it was the better quality of produce on offer.
• 26.5% said they preferred the ethics of the local independent shopping model.
• 14.7% of people said that they liked the local seasonal products that were sold in local shops, and;
• 12.2% said that they liked the thought of supporting the local economy.
4.35 When asked what they disliked about Chorlton 36.6% of people said there was nothing or very little that they did
not like, however 12.9% said it was difficult to park, 10.9% cited traffic congestion as their major complaint and
6.9% of people said there were too many eating and drinking places. Interestingly only 5.9% of people
identified a lack of non-food stores and only 2% claimed there was a lack of foodstores. Inevitably an in centre
survey will tend to highlight higher satisfaction for a centre as that is why they are using the centre.

Manchester City Council Independent Retailers Study - Chorlton
December 2009
30
4.36 Respondents were asked where they mainly shopped for clothing, footwear and other non-food shopping; only
8.9% cited Chorlton, while 45.5% said Manchester City Centre and 16.8% said they shop in the Trafford Centre.
Interestingly, Stretford, Stockport and Didsbury accounted for 5.0%, 3.0% and 2.0% of responses respectively.
Business Survey Results
4.37 In consultation with Manchester City Council, we prepared a local business survey questionnaire as part of our
evidence gathering exercise. We targeted 20 different business operators in Chorlton District Centre and
sought a balanced mix of independent and multiple retailers from a wide range of retail categories and service
types to ensure that the survey sample represented the broadest spectrum of the centre’s retailers. The survey
was designed to gain a deeper understanding of the composition and profile of Chorlton’s shops and services,
as well as to gauge operators’ opinions about and their level of satisfaction with their trading premises, the
accessibility of the centre, the level of car parking and other strengths and weaknesses of Chorlton.
4.38 Of all the businesses surveyed 65% have been trading in Chorlton for over ten years; most of those have
remained in the same premises during that time. Only 5% respondents began trading in Chorlton within the last
two years. When asked if their current premises satisfied their needs in terms of location, 90% replied positively.
A similar level of satisfaction was recorded for respondents in relation to the size and format of their stores with
85% of respondents satisfied in that respect.
4.39 When asked what their future plans for their business was the majority of respondents (80%) declared their
intentions to continue on as before or stated that they have no plans for the future. According to the survey 10%
of operators intend to expand their operations, and a further 10% intend to relocate to a different premises
within the centre.
4.40 Of those operators who have more than one store in the UK, a third stated that their Chorlton store’s turnover
was the same as the company’s regional average. 8.3% claimed that their turnover was less, while 41.7%
claimed it was higher than the company’s national average. This indicates that the businesses surveyed appear
to be trading well.
4.41 On a scale where -1 is bad and +1 is good the mean response from the 20 operators when asked to rate the
accessibility of Chorlton was -0.03, which indicates that the average opinion is marginally worst than “neither
good nor bad”.
4.42 Regarding respondents’ opinions of the centre’s environmental quality, the results were slightly better with a
mean response of +0.10. Nobody felt the environmental quality was “very bad” but one respondent thought it
was “very good”, while 10% of people felt it was “bad” compared to 30% who felt it was “good”, 45% were
indifferent.
4.43 When asked what they considered the strengths of Chorlton’s retail offer, 45% of respondents cited the centre’s
range of independent shops, and 10% said the range of major national multiples. 20% cited the mix of types of

Manchester City Council Independent Retailers Study - Chorlton
December 2009
31
goods of different categories. 20% of operators said that nothing was considered a strength or that they did not
know.
4.44 Conversely, when asked what Chorlton’s weaknesses were in terms of its retail offer 20% said the poor range of
retailers in general. 20% cited the lack of menswear and 15% said a poor range of major national multiple
retailers. 35% had no complaints to make.
4.45 Eating and drinking in the centre during the evening time was generally perceived very positively with a mean
response of +0.53 on a scale where -1 is “bad” and +1 is “good”. The response for eating during the day was
less positive but still generally good with a mean response of 0.34.
4.46 Respondents were asked how they thought Chorlton should be aiming to develop itself and providing a more
varied retail /service offer. 30% were of the opinion that Chorlton should create its own niche for an independent
retail offer, while 5% thought Chorlton should try and attract more established multiple retailers. 60% thought
that a balance between the two approaches is the best way forward.
4.47 When asked what it was they liked, from their business perspective, about Chorlton district centre 30% cited the
provision of boutique/independent retailers, 20% liked the friendly customers in the centre, 40% cited the
environment and landscaping or the historic buildings and character of the area, while 15% felt that the size and
compactness of the centre was its best attribute. Negative attributes from a business perspective were also
explored with the majority of respondents (75%) citing the cost/availability of car parking as their main criticism,
and 15% felt that there was poor street cleaning, a further 10% criticised the appearance of shop frontages.
10% of respondents felt the limited range of national multiple retailers or the limited mix of retailers was the
centre’s biggest drawback.
4.48 The business survey probed the main issues facing Chorlton and when this question was put to the local
business operators 75% cited car parking availability as one of the main issue, 25% felt that improving the
general environment and appearance of the centre was a priority, and 15% were concerned about the loss of
independent shops. The need to increase the range of national multiple retailers was identified as a priority by
10% of respondents.
4.49 These responses filter down into the potential improvements to Chorlton, traffic and parking issues were highest
up on the agenda. 70% thought more car parking would be most appropriate and 30% mentioned an
improvement of the general appearance of the centre. 20% of people thought that cheaper car parking was the
answer. While 20% were of the opinion that the centre could be improved by accommodating a better range of
shops. 15% were in favour of redeveloping the shopping precinct.
Household Telephone Survey Results
4.50 In order to provide detailed factual information on shopping patterns in Chorlton, we commissioned a household
telephone survey covering 600 households. GVA Grimley designed the survey questionnaire in consultation
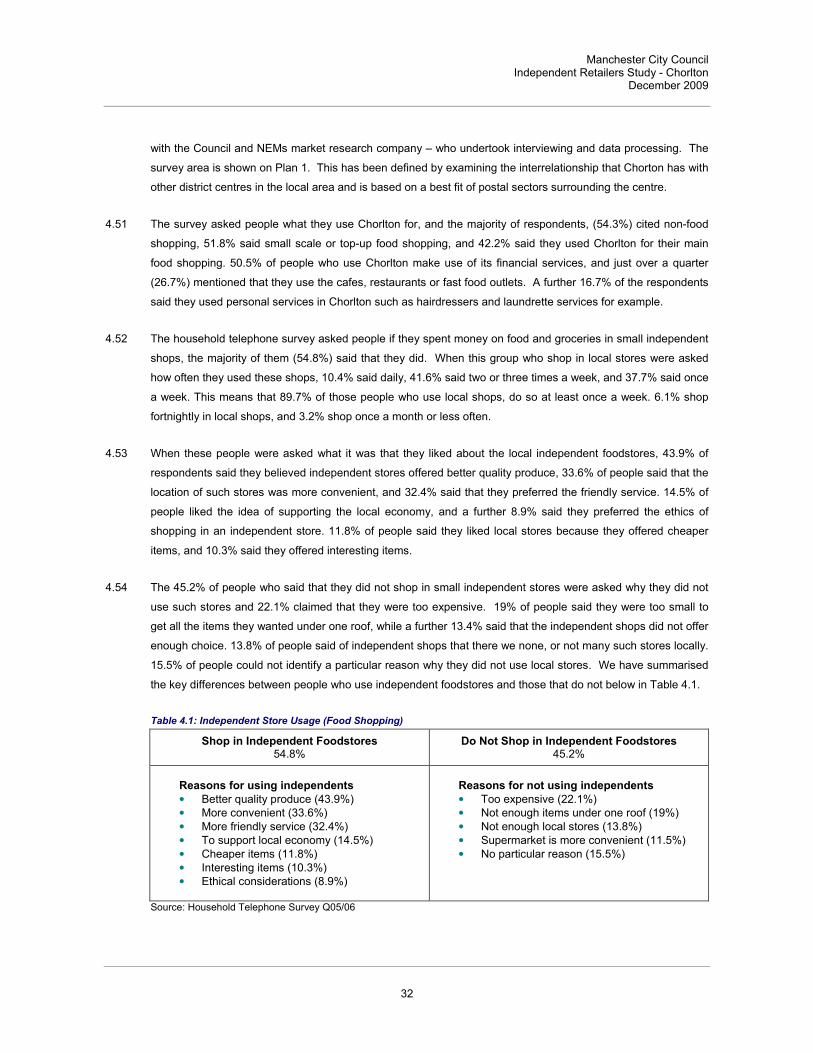
Manchester City Council Independent Retailers Study - Chorlton
December 2009
32
with the Council and NEMs market research company – who undertook interviewing and data processing. The
survey area is shown on Plan 1. This has been defined by examining the interrelationship that Chorton has with
other district centres in the local area and is based on a best fit of postal sectors surrounding the centre.
4.51 The survey asked people what they use Chorlton for, and the majority of respondents, (54.3%) cited non-food
shopping, 51.8% said small scale or top-up food shopping, and 42.2% said they used Chorlton for their main
food shopping. 50.5% of people who use Chorlton make use of its financial services, and just over a quarter
(26.7%) mentioned that they use the cafes, restaurants or fast food outlets. A further 16.7% of the respondents
said they used personal services in Chorlton such as hairdressers and laundrette services for example.
4.52 The household telephone survey asked people if they spent money on food and groceries in small independent
shops, the majority of them (54.8%) said that they did. When this group who shop in local stores were asked
how often they used these shops, 10.4% said daily, 41.6% said two or three times a week, and 37.7% said once
a week. This means that 89.7% of those people who use local shops, do so at least once a week. 6.1% shop
fortnightly in local shops, and 3.2% shop once a month or less often.
4.53 When these people were asked what it was that they liked about the local independent foodstores, 43.9% of
respondents said they believed independent stores offered better quality produce, 33.6% of people said that the
location of such stores was more convenient, and 32.4% said that they preferred the friendly service. 14.5% of
people liked the idea of supporting the local economy, and a further 8.9% said they preferred the ethics of
shopping in an independent store. 11.8% of people said they liked local stores because they offered cheaper
items, and 10.3% said they offered interesting items.
4.54 The 45.2% of people who said that they did not shop in small independent stores were asked why they did not
use such stores and 22.1% claimed that they were too expensive. 19% of people said they were too small to
get all the items they wanted under one roof, while a further 13.4% said that the independent shops did not offer
enough choice. 13.8% of people said of independent shops that there we none, or not many such stores locally.
15.5% of people could not identify a particular reason why they did not use local stores. We have summarised
the key differences between people who use independent foodstores and those that do not below in Table 4.1.
Table 4.1: Independent Store Usage (Food Shopping)
Shop in Independent Foodstores 54.8%
Do Not Shop in Independent Foodstores 45.2%
Reasons for using independents
• Better quality produce (43.9%)
• More convenient (33.6%)
• More friendly service (32.4%)
• To support local economy (14.5%)
• Cheaper items (11.8%)
• Interesting items (10.3%)
• Ethical considerations (8.9%)
Reasons for not using independents
• Too expensive (22.1%)
• Not enough items under one roof (19%)
• Not enough local stores (13.8%)
• Supermarket is more convenient (11.5%)
• No particular reason (15.5%)
Source: Household Telephone Survey Q05/06
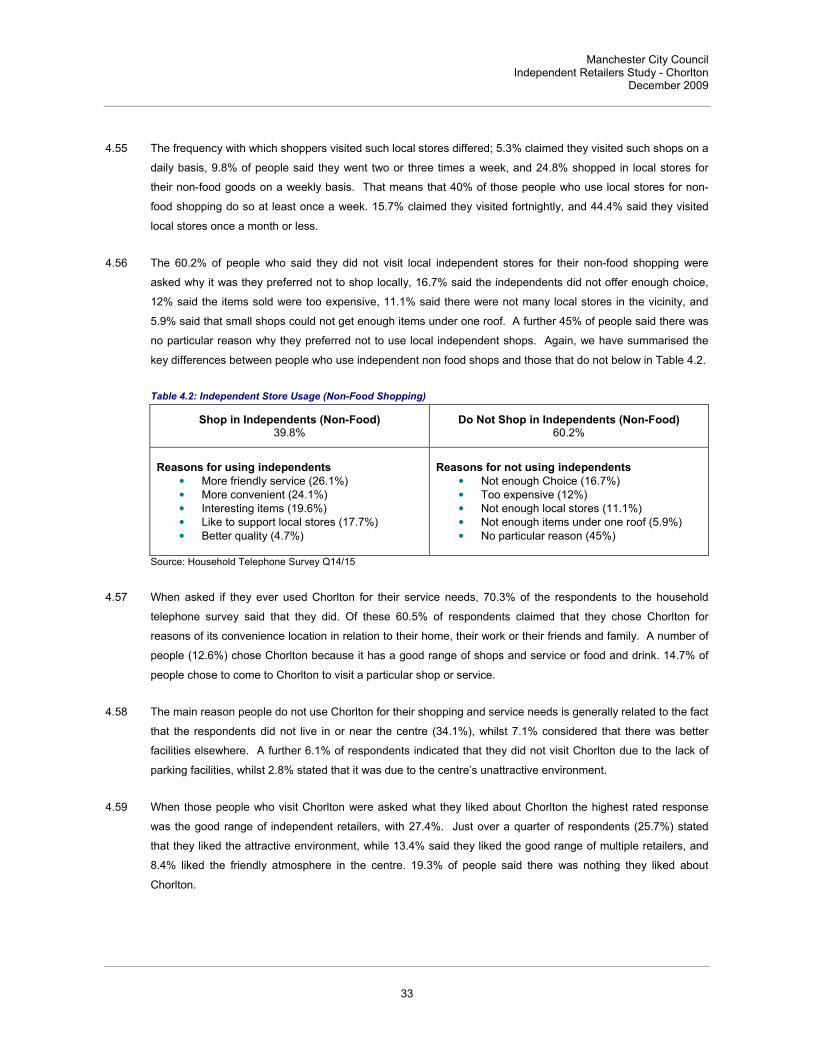
Manchester City Council Independent Retailers Study - Chorlton
December 2009
33
4.55 The frequency with which shoppers visited such local stores differed; 5.3% claimed they visited such shops on a
daily basis, 9.8% of people said they went two or three times a week, and 24.8% shopped in local stores for
their non-food goods on a weekly basis. That means that 40% of those people who use local stores for non-
food shopping do so at least once a week. 15.7% claimed they visited fortnightly, and 44.4% said they visited
local stores once a month or less.
4.56 The 60.2% of people who said they did not visit local independent stores for their non-food shopping were
asked why it was they preferred not to shop locally, 16.7% said the independents did not offer enough choice,
12% said the items sold were too expensive, 11.1% said there were not many local stores in the vicinity, and
5.9% said that small shops could not get enough items under one roof. A further 45% of people said there was
no particular reason why they preferred not to use local independent shops. Again, we have summarised the
key differences between people who use independent non food shops and those that do not below in Table 4.2.
Table 4.2: Independent Store Usage (Non-Food Shopping)
Shop in Independents (Non-Food) 39.8%
Do Not Shop in Independents (Non-Food) 60.2%
Reasons for using independents
• More friendly service (26.1%)
• More convenient (24.1%)
• Interesting items (19.6%)
• Like to support local stores (17.7%)
• Better quality (4.7%)
Reasons for not using independents
• Not enough Choice (16.7%)
• Too expensive (12%)
• Not enough local stores (11.1%)
• Not enough items under one roof (5.9%)
• No particular reason (45%)
Source: Household Telephone Survey Q14/15
4.57 When asked if they ever used Chorlton for their service needs, 70.3% of the respondents to the household
telephone survey said that they did. Of these 60.5% of respondents claimed that they chose Chorlton for
reasons of its convenience location in relation to their home, their work or their friends and family. A number of
people (12.6%) chose Chorlton because it has a good range of shops and service or food and drink. 14.7% of
people chose to come to Chorlton to visit a particular shop or service.
4.58 The main reason people do not use Chorlton for their shopping and service needs is generally related to the fact
that the respondents did not live in or near the centre (34.1%), whilst 7.1% considered that there was better
facilities elsewhere. A further 6.1% of respondents indicated that they did not visit Chorlton due to the lack of
parking facilities, whilst 2.8% stated that it was due to the centre’s unattractive environment.
4.59 When those people who visit Chorlton were asked what they liked about Chorlton the highest rated response
was the good range of independent retailers, with 27.4%. Just over a quarter of respondents (25.7%) stated
that they liked the attractive environment, while 13.4% said they liked the good range of multiple retailers, and
8.4% liked the friendly atmosphere in the centre. 19.3% of people said there was nothing they liked about
Chorlton.

Manchester City Council Independent Retailers Study - Chorlton
December 2009
34
4.60 Respondent’s dislikes in relation to the centre include 15.8% of people who felt that it was too expensive to park
in the centre, and 10.4% said their main dislike of the centre was the problem of traffic congestion. Whilst 4.7%
of people said that there were too many socialising venues in the centre such as bars, cafes and takeaways,
and 3.7% cited litter as their main dislike of the centre. These results are in contrast to the 50.6% of
respondents who said there was nothing they disliked about Chorlton.
4.61 People were asked to name up to three types of improvements that would persuade them to visit Chorlton more
often, and although 41.4% mentioned nothing in particular, 7.6% said they would like to see an improved choice
of multiple retailers, while 6% said they would like to see more independent shops. In terms of parking
provision, 7.6% said that more short stay parking spaces would be an attraction, 6.3% said they would like to
see more long stay parking, and a further 6.7% said they would prefer more parking altogether. A further 6.5%
of people said they would visit more if the cost of parking was reduced, whilst 5.7% mentioned improvements to
the public transport linkages and 5.2% would welcome a reduction in traffic congestion. It was also stated by
3.9% of respondents that they would be encouraged to visit the centre more if the shopping streets were
cleaner.
Summary
• Chorlton is a busy and vibrant district centre with a broad range of shops and services. There are many
independent retailers represented particularly in the convenience sector, vacancy levels are very low and
the centre appears to be performing healthily.
• From reviewing the results of the telephone, in-centre and the business survey we can build a reliable
picture of customer and retailer opinions and views. Our research has distilled the main issues that
Chorlton faces. Car parking availability and pricing, and traffic congestion appear to be a problem in the
centre, while the range and availability of independent retailers has shown up as an enduring strength
which underpins the attractiveness of Chorlton for many. Respondents have also indicated that they
would like to see a greater proportion of both independent and multiple retailers coming forward in the
centre and better public transport links. While our audit has identified that major multiples, particularly in
the comparison sector, are under-represented we consider their accommodation could enhance the overall
offer and diversity of the centre as long as they are facilitated with care and respect to the established
pattern of retailing and provided they are consistent with the role and function of the centre in the local
hierarchy.

Manchester City Council Independent Retailers Study - Chorlton
December 2009
35
5. CAPACITY PROJECTIONS
5.1 In this section we estimate the current performance of Chorlton District Centre as the basis for forecasting the
need for additional retail floorspace to the period 2026, incorporating the interim years of 2011, 2016 and 2021.
The capacity tables accompanying this assessment are attached in Appendix 1 and 2.
5.2 We have used a conventional and widely accepted step-by-step methodology, consistent with best practice,
which draws upon the results of the household telephone survey of existing shopping patterns to model the
existing flow of available expenditure to Chorlton and its competing centres. In order to develop the baseline
position, we have:
• Calculated the total amount of convenience and comparison goods expenditure which is available within
the postal sectors that compose the estimated Chorlton catchment area;
• Allocated the available expenditure to the convenience and comparison goods shopping destinations, on
the basis of the household telephone survey of spend patterns, so as to provide estimates on current sales
and forecasts of future sales;
• Compared the total expenditure attracted to each shopping destination with current retail floorspace to
assess sales densities in each shopping destination.
5.3 Building on the baseline position, we have explored the capacity for further convenience and comparison goods
retail floorspace within the District Centre.
Data Inputs
Survey Area and Household Survey
5.4 The survey results identify shopping habits of households for both convenience and comparison goods. Where
necessary, the survey results have been re-based to remove certain responses, such as ‘internet/mail order
shopping’, to ensure consistency with categories excluded in the expenditure projections. For convenience
goods, the household telephone survey included the questions on main food and top-up food shopping but also
importantly a series of questions on people’s usage of small independent shops including their spend habits on
bread, meat, fish, diary products, fruit and vegetables and other food types. This approach avoids people
gearing their responses solely to larger multiple supermarkets and also takes into account the fact that people’s
convenience shopping habits often do not always follow a standard approach of shopping at only one or two
locations. This approach appears to be particularly relevant to a centre like Chorlton where there is a strong
provision of small independent shops.

Manchester City Council Independent Retailers Study - Chorlton
December 2009
36
5.5 In order to avoid any double counting with responses e.g. the same responses being given when answering the
small independent question and the main/food top-up questions we have merged the three types of food
expenditure through an application of weight which reflects the estimated proportion of expenditure accounted
for by each type of shopping. Therefore this approach applies a 70%/20% main food/top-up food weighting,
with a further 10% weighting attributed to the small independent retailers at Q02.
5.6 It should be noted that the spend allocation for small independents shops is in some cases higher then the 10%
allocation as people have also indicated that they use independent shops for their main food and top up
shopping (Q07 & 09). Therefore the weighting has only been applied to the three different questions and not
specifically to the total market shares going to individual stores/supermarkets. Overall, this approach forms a
composite pattern of convenience spending, expressed as a market share for each shop or foodstore, for each
survey zone.
5.7 In relation to comparison goods, the survey also includes five questions on specific comparison goods types,
which coincide with Experian Business Strategies definitions of comparison goods expenditure. The retail and
needs modelling exercise uses the weighted averages of the household survey responses for each goods type
based on the proportion of per capita spend on that goods type. This process establishes the pattern of
spending for residents of each zone in terms of the following types of goods:
• Clothing and footwear;
• Furniture, floor coverings and household textiles;
• DIY, decorating supplies, and tools;
• Domestic and small electrical appliances (TV, hi-fi, radio etc.);
• Personal goods (jewellery, china, glassware, books, stationery, cosmetics, musical instruments, and sports
equipment).
Estimates of Population in the Survey Area
5.8 Population estimates and forecasts were prepared from the Experian E-marketer in-house system. This
provides estimates of population based on trend-line projections and the 2001 census for small, localised areas.
This section discusses the performance of existing floorspace using 2009 as the base year.
5.9 Overall, the population of the survey area is currently 106,261. It is forecast to grow to 108,998 by 2011,
115,574 by 2016, to 121,386 by 2021 and finally to 126,177 by 2026 (Table 1, Appendix 1). Overall, population
is forecast to grow by 18.7% between 2009 and 2026 within the whole survey area.
5.10 Table 5.1 highlights the social economic grade of Chorlton’s catchment area. It is apparent that the proportion
of people in the AB category is broadly in line with the national average. However, it is evident that there is a

Manchester City Council Independent Retailers Study - Chorlton
December 2009
37
lower proportion of the population in the C2 category, although in contrast, a higher number of people in the
catchment area are in the lowest social grade (E).
Table 5.1: Social economic grade of catchment area
AB C1 C2 D E
Catchment Area % 21.65 29.62 10.67 18.35 19.72
National Average % 21.57 29.42 15.23 17.36 16.42
Source: Experian
AB: Higher and Intermediate manager/admin/prof
C1: Supervisory, clerical, junior manager/admin/prof
C2: Skilled manual workers
D: Semi-skilled and unskilled manual workers
E: On state benefit unemployed, lowest grade workers
Available Expenditure in the Survey Area
5.11 The Experian E-Marketer System provides estimates of the per capita expenditure for convenience and
comparison goods in 2007 prices. We have made deductions for special forms of trading (SFT) which
represents expenditure not available to spend in the shops, i.e. Internet and catalogue shopping. We have
applied individual per capita expenditure figures across each survey zone to provide a more detailed
understanding of available expenditure in different parts of the catchment area.
5.12 In terms of expenditure growth in the area, we have drawn on convenience and comparison goods growth rates
provided by Experian Business Strategies. These indicate that more growth will take place on comparison
goods as opposed to convenience goods; the scope to purchase more food is more limited than the scope to
purchase non-food goods. Recent turbulence in the market has caused disruption to expenditure growth rates
whereby limited growth is expected for the immediate future, but a return to growth is expected in the medium to
long-term. Experian Business Solutions estimate that there will be no growth in convenience goods expenditure
between 2009 and 2011, to rise by 0.8% per annum between 2011 and 2016; they expect growth to return to a
steady rate of 0.9% per annum from 2016 onwards.
5.13 Based on Experian’s forecasts we estimate that expenditure on comparison goods will grow by 0.1% per annum
from now until 2011, growing to 2.5% per annum between 2011 and 2016, increasing again to 2.8% from 2016
onwards as the economy is expected to return to normal. We have generated expenditure by zone to highlight
variations across the survey area.
5.14 Table 2, Appendix 1, applies per capita expenditure within each zone to population forecasts, which indicates
that total available convenience goods expenditure within the survey area is currently £166.1m. This is forecast
to grow to £169.4m by 2011, to £185.8 by 2016, to £204m by 2021 and finally to £211.7m by 2026, equating to
an overall growth of £55.6m (33%) between 2009 and 2026 (Table 3, Appendix 1).

Manchester City Council Independent Retailers Study - Chorlton
December 2009
38
5.15 Comparison expenditure at £254.7m, is currently higher than convenience spend, and is expected to grow to
£304.4m by 2016, and to £366.7m by 2021, and finally to £437.1m by 2026. This amounts to an overall growth
of £182.5m (71.7%) between 2009 and 2026.
Floorspace Data
5.16 The comparison and convenience floorspace data used in our modelling, and verified by the Council, has been
drawn from a range of data sources including the Institute of Grocery Distribution (IGD), and Experian Goad
town centre category reports. Our floorspace assumptions for the foodstores include, where appropriate, an
adjustment to identify the proportion of purely convenience goods floorspace. Most superstores include a
proportion of non-food floorspace; we have adjusted the net floorspace to identify the proportion of sales space
allocated for convenience goods. This accords with the expenditure data and the expenditure assumptions
used.
Convenience Goods Capacity Projections
Chorlton District Centre
5.17 Our methodology estimates the trade draw of Chorlton District Centre for convenience goods (Table 4,
Appendix 1). This comprises an examination of the trade drawn to the Morrisons, Somerfield, Unicorn, Tesco
Express, Co-op Late shop, Cool Trader, Quality Save and the combined independent convenience offer.
Chorlton has a strong convenience goods provision, especially in terms of the choice of independents.
5.18 Based on the results of the telephone survey we examine the performance of the key stores in the centre are
trading, we estimate:
• Morrison’s in the east of the centre has a total convenience goods turnover of £31.8m, which equates to a
sales density of £19,019 per sq m net, based on a net convenience sales area of 1,672 sq m net. This is
significantly higher than the company average sales density of a typical Morrison’s store (£10,593 per sq
m net).
• Somerfield, (which has recently been re-branded as Co-op, although was trading as Somerfield when the
household survey was undertaken) is achieving a turnover of £0.32m. Based on the store’s convenience
goods sales area of 280 sq m, this produces an average sales density of approximately £1,143 per sq m
net. This is far lower than the company average for a typical Somerfield store elsewhere in the UK of
£7,040 per sq m net.
• Unicorn, an independent store in the north of centre, has a turnover of £2.1m. We estimate that the store
is likely to have a sales density of c.£5,390 per sq m net based on a convenience floorspace of 390 sq m
net. Based on the store’s location away from the core retail area of the centre we consider that it is trading
well.

Manchester City Council Independent Retailers Study - Chorlton
December 2009
39
• The new Tesco Express, which opened in spring 2009, has a turnover of £0.66m. Based on a floorspace
figure of 216 sq m net we estimate that the store has a sales density of £3,055 per sq m. This is much
lower than the Tesco company average of £10,873 per sq m. The relatively recent opening of the store
might be the reason for the slow performance, we also expect the turnover of the store may be increased
as a result of passing trade from beyond the catchment area.
• Co-op Late Shop in the south of the centre is trading very well and has a turnover of c.£3.3m, and with
327 sq m of net convenience floorspace it is trading at £10,092 per sq m, this is better than what a typical
Co-op store would normally trade at (£5,314 per sq m net).
• Quality Save appears to be turning over £0.29m annually, which based on a floorspace of 322 sq m net
translates to a current sales density of £901 per sq m net. There are not published sales density figures
for Quality Save, although we would expect the store to trading at a higher level nearer the £2,000 per sq
m mark.
5.19 We advise that the baseline turnover estimates for Chorlton’s foodstores, as derived from the household survey,
should be interpreted with care as the telephone survey can sometimes underestimate their performance and
specifically their important roles as ‘top-up’ destinations for shoppers, visitors, local employees, particularly at
lunchtimes for snack/lunch time trade and minimal ‘pint of milk ‘top up shopping. Based on these factors it is
likely that the Somerfield and Quality Save would be trading at a higher level than the telephone survey is
currently estimating.
5.20 In relation to the smaller independent shops in Chorlton, we have examined the market shares going to each
individual store from the series of questions at Q2a-f) of the household survey. We have also included the
market shares going to these stores from the main food (Qu07) and top-up (Qu09) questions and, as previously
explained, weighted the total responses to average annual per person spend to avoid any double counting.
5.21 The column in Table 5 (Appendix 1) entitled ‘other stores’ assesses the combined turnover of the smaller
independent stores in the centre. We estimate based on the results of the household survey that this provision,
detailed in Table 7 (Appendix 1), has a total current turnover of approximately £5.5m. The total convenience
floorspace of this combined provision is 2,024 sq m net which equates to a sales density of approximately
£2,700 sq m net. Based on experience elsewhere, we estimate that this provision is trading broadly in line with
what we would expect this provision to be trading at (£2,500 - £3,000 per sq m net).
5.22 It should be noted that the turnover of the ‘other stores’ includes the response of people who said they shop at
‘food stores in Chorlton’. As this response could mean a variety of stores in Chorlton it could indicate that the
actual turnover of some of the larger stores is higher.
5.23 In total, we estimate that convenience provision in Chorlton has a combined turnover of £44.4m from the survey
area which equates to a sales density of £8352 sq m net. This is significantly higher than what we would expect
the centre to be achieving and is largely as a result of the very good trading levels of the Morrison’s store which
appears to be significantly overtrading.

Manchester City Council Independent Retailers Study - Chorlton
December 2009
40
5.24 Table 4 (Appendix 1), indicates that 36% of the combined convenience turnover of Chorlton is derived from
Zone 1, its location zone. Overall, the centre has a convenience goods market share of 69.7% within Zone 1,
whilst there is also a relatively high market share in Zone 2 of 60% in the south of the catchment which might
reflect the fact that there is limited convenience provision within and to the south of the zone. Chorlton also has
a market share of 31% and 28% in Zones 5 and 6, respectively. It is evident that Asda, Hulme would also
attract a high proportion of shoppers from these two zones given that they separate Chorlton from Hulme district
centre. The centre has a very low market share in Zone 3 (1.2%), which reflects is positioning next to Sale
which contains a Sainsbury’s and Tesco store. Chorlton also has a market share in Zone 4 of 13.4% and Zone
7 of 6.7%. This again reflects their positioning next to other centres in the local hierarchy including Stretford for
shoppers in Zone 4 and Hulme, Rusholme, Withington and Fallowfield for shoppers in Zone 7.
Convenience Goods Global Capacity
5.25 Based on population and expenditure growth, and the detailed performance analysis of existing floorspace
within the centre, we believe there is capacity to support further convenience goods floorspace in Chorlton
based on current market shares to the centre. Our projections are summarised in Table 5.2 below which
indicates that by 2016 there will be an identified residual expenditure of £16.1m, with this is set to grow to
£19.9m by 2021 and £23.4m by 2026. It should be noted that projections beyond 2021 should be treated with
caution given the fact that margins of error increase over longer time periods. Based on a large store format
average sales density of approximately £10,000 per sq m net we forecast capacity for 1,231 sq m net by 2011,
1,592 sq m net by 2016, growing to 1,919 sq m net by 2021, and 2,204 sq m net by 2026.
5.26 If we apply a lower sales density of £4,500 per sq m net, which is more typical of a discount format store, the
proportion of convenience floorspace that the centre could support increases. For instance, we estimate that
the level of available expenditure should be able to support 2,735 sq m by 2011, 3,537 sq m in 2016, rising to
4,265 sq m in 2021 and £4,898 sq m by 2026.
Table 5.2: Projected Residual Expenditure and Capacity based on different store formats
Year
2011 2016 2021 2026
Residual Expenditure
£12.3m £16.1m £19.9m £23.4m
Capacity Assuming Large Store Format (£10,000 per
sq m net)
1,231 sq m 1,592 sq m 1,919 sq m 2,204 sq m
Capacity Assuming store with lower sales density (4,500 per sq m net)
2,735 sq m 3,537 sq m 4,265 sq m 4,898 sq m
Manchester City Council Independent Retailers Study - Chorlton
December 2009
41
Scope for claw-back
5.27 The assessment above only examines the capacity for additional convenience floorspace based on current
market shares to the existing provision within Chorlton. The telephone survey highlights that a significant
proportion of spend is leaking to other convenience destinations which it could be argued should be redirected
towards Chorlton, to achieve more sustainable travel/shopping patterns. Therefore there may be potential for
Chorlton to claw back a proportion of this expenditure to support convenience floorspace beyond that identified
above (Table 5.2). However, where this spend will be clawed back from will require careful consideration in
relation to the impact this could have on other centres/destinations. Furthermore, the scale of any new
development will also need to be assessed further to ensure that it relates to the role and function of the centre
within the wider hierarchy.
5.28 The survey area used for the telephone survey area is based on a ‘best fit’ of postal sectors around Chorlton
and resembles a realistic area where the centre is likely to draw trade from. However, in planning for new
convenience provision in Chorlton, it is necessary to look at the spatial relationship of Chorlton with other
centres in the immediate surrounding area, including Stretford Town Centre to the west, Withington, Fallowfield
and Rusholme to the east and Hulme to the north east to define where Chorlton should realistically be drawing
trade from.
5.29 Based on the network of other centres in the area we therefore assume that in planning for new retail
development a reasonable ‘core’ catchment area for Chorlton is as follows:
Zone 1 – 100% of the zone
Zone 2 – 80% of the zone
Zone 3 - 10% of the zone
Zone 4 - 10% of the zone
Zone 5 - 40% of the zone
Zone 6 - 40% of the zone
Zone 7 - 0% of the zone
5.30 Given the interrelationship of the district centre network in this part of Manchester there will clearly be
catchment overlaps between the centres. Therefore this catchment area for Chorlton should not be viewed
rigidly as evidently there will be inflow and out flows of spend from this area. However, for this assessment it
serves the purpose of examining the proportion of spend that is reasonable for Chorlton to claw-back. Our
assessment of expenditure claw-back for both main food and top-up expenditure is set out in appendices 3 and
4.

Manchester City Council Independent Retailers Study - Chorlton
December 2009
42
Claw-back of main food expenditure
5.31 We have calculated the proportion of trade leaving the catchment area based on where people spend most
money on food and groceries from the household telephone survey (Qu07). We have applied the percentage
allocation set out above to the market shares to bring the overall leakage of spend down so that the focus of this
assessment is solely based on Chorlton’s core catchment area. In line with our standard approach we have
applied the 70% main food weighting to the market shares.
5.32 Examining main food shopping habits reveals that approximately £24.9m is leaking from Chorlton’s immediate
catchment area to a variety of destinations (Table 4, Appendix 3). For example, it is apparent that £8.2m of
spend is currently being diverted to Asda, Hulme, £4.2m is drawn to Asda, (Barton Dock Road) in Old Trafford
and £2.7m is diverted further north to Sainsbury’s, Regent Road (Salford). Plan 2 illustrates the leakage of
spend to other destinations.
5.33 We calculate, based on this assessment, that if Chorlton was able to claw back all this leakage of spend it
would be possible for the centre to increase the capacity for additional main food convenience floorspace as set
out in Table 5.1 by 2,529 sq m net at 2011, which would rise to 2,907 sq m net by 2021, based on a sales
density of £10,000 per sq m net (Table 6, Appendix 3).
Claw back of top-up food expenditure
5.34 Based on the same approach, we have also examined the proportion of top-up trade that is currently leaking
from Chorlton’s core catchment area based on shopping habits from Qu09 of the telephone survey. Consistent
with our capacity assessment we have applied a 20% top up food weighting to the market shares.
5.35 Our assessment highlights that approximately £3.5m of top-up convenience expenditure is leaking to
destinations beyond Chorlton’s core catchment area (Table 5, Appendix 4). It is apparent that this expenditure
is leaking to a variety of destinations including Asda, Hulme and foodstores in Sale Moor, Whally Range,
Stretford and Old Trafford.
5.36 Clearly not all top-up food trips take place directly from where people live as such trips can take place, in some
cases, next to where people work for convenience reasons. However, assuming that all this expenditure could
be clawed back to Chorlton we estimate, based on a sales density of £10,000 per sq m net, that an additional
350 sq m net of floorspace could be supported in Chorlton by 2011, with this rising to 433 sq m net by 2026
(Table 5, Appendix 4).
5.37 Evidently, this assessment of claw-back is a theoretical scenario and would require all the spend that is
currently leaving Chorlton’s core catchment area to be diverted back to the centre. Clearly this is not entirely
realistic as it does not take account of commitments/proposals coming forward such as the proposal for a new
foodstore at Old Trafford cricket ground. However, without new development in Chorlton, this leakage is likely
to grow.
Manchester City Council Independent Retailers Study - Chorlton
December 2009
43
5.38 As with the claw-back of main food spend this scenario does not take account of the fact that people are likely
to be shopping at these different locations for other reasons beyond the supermarket limitations of Chorlton.
Undoubtedly, leakage of convenience spend will occur in any location mainly due to the location of convenience
provision to people’s work and the ease of using this over visiting their nearby centre. Thus, although our
assessment assesses the scope to claw-back all this trade to Chorlton it should be, to a degree, treated with
caution for the reasons set out above.
5.39 A detailed examination will be required to understand what the impact could be on the stores and destinations
that this main food spend will be clawed back from.
Comparison Goods Assessment
Chorlton District Centre
5.40 The results of the household telephone survey indicate that comparison shopping in Chorlton district centre
draws 6.6% of available comparison spend from the survey area, which is not surprising given the role it
performs as a District Centre. It is evident that the centre exerts the most influence over survey zones 1, 2 and
6 with a market share of 13%, 16.8% and 9.7% respectively. There is some trade draw from Zone 5 (4.0%), but
very little spend from Zone 7 is attracted to Chorlton with a less than 1% trade draw. Shoppers from Zones 3, 4
and 7 look to Manchester, White City Retail Park, Stockport, Trafford and Sale for their comparison shopping
needs.
5.41 On the basis of current market shares, taking account of SFT, we estimate that Chorlton district centre will turn
over £17m of comparison goods expenditure in 2011, rising to £20m in 2016, to £24m in 2021 and £28.4m in
2026 (Table 5). Similarly, on the basis of current market shares, we estimate that the district centre currently
has a comparison goods sales density of approximately £3,280 per sq m net which is broadly in line with what
we would expect the centre to be achieving.
5.42 In assessing capacity for future comparison goods floorspace, we have assumed that the efficiency with which
existing floorspace is being used will increase over time, and GVA Grimley has estimated based on forecasts
provided by Experian that annual growth in existing sales per sq m (net) will improve from 1.5% between 2011
and 2016, to 2% from 2016 onwards. Drawing on our experience, we have also assumed that any that new
floorspace should achieve approximately £3,500 per sq m (net) on the basis that new floorspace should achieve
a similar sales density to what it is currently doing (Table 7, Appendix 2). This assessment has assumed that
Chorlton district centre will maintain its existing market share and we have translated the expected growth in
available comparison expenditure to an emerging capacity for new floorspace for the target years 2011, 2016,
2021 and 2026.
5.43 By virtue of projected growth in population and the estimated increases in available comparison expenditure we
expect Chorlton to have the capacity to accommodate an additional 55 sq m of net retail floorspace by 2011,

Manchester City Council Independent Retailers Study - Chorlton
December 2009
44
growing to 490 sq m by 2016, to 946 sq m by 2021, and 1,365 sq m by 2026 (See Table 5.3 below). Clearly the
scope for additional floorspace is fairly negligible and it is therefore apparent that the main scope for additional
comparison floorspace will be based increasing market share in the centre.
Table 5.3: Projected Residual Expenditure and Capacity for further comparison floorspace based
Year 2011 2016 2021 2026
Residual Expenditure (£000s)
£0.19m £1.85m £3.94m £6.28m
Capacity Assuming Sales Density
(£3,000 per sq m) 55 sq m 490 sq m 946 sq m 1,365 sq m
5.44 Given that approximately 93% of comparison spend is leaving the survey area to other out of centre
destinations or centres further up in the hierarchy there may be scope for Chorlton to claw back a proportion of
spend to support further comparison floorspace beyond that set out below. In line with PPS6, any new
comparison retail development within Chorlton would need to relate to the role and function of the centre within
the wider hierarchy and the catchment served. However, it is likely that given its role as a district centre in the
local retail hierarchy it is not entirely realistic to plan for a significant proportion of new comparison floorspace
unless there is a significant development opportunity that can attract key retailers.

Manchester City Council Independent Retailers Study - Chorlton
December 2009
45
6. STRATEGIC OPTIONS/RECOMMENDATIONS
6.1 Drawing on our qualitative and quantitative analysis, this section considers the key conclusions and policy
recommendations moving forwards over the forthcoming LDF period.
6.2 Our detailed qualitative analysis set out in Section 4 has confirmed that Chorlton is a vibrant and healthy district
centre, in line with its role as an important district centre in the south of Manchester. For example, some of the
key performance indicators show that:
• The centre has a good range of independent retailers, including a number of quality independently run
convenience shops which are well used and attract people to the centre;
• There is a strong provision of multiple convenience stores with Morrisons, Tesco Express, Quality Save
and Co-op all occupying units;
• Vacancies are below the national average and there are no major concentrations of vacant units in the
centre.
Scope for further retail provision
6.3 The results of the quantitative assessment set out in Section 5 to this study, which is itself underpinned by the
findings of the household and in-centre surveys, also confirms that the centre is performing well at present
particularly in the convenience sector. Our assessment indicates that the centre’s convenience goods
floorspace is currently achieving a potential turnover of c.£48.3m. Based on the current floorspace we estimate
that the centre could be achieving an average sales density of £9,086 sq m net, which indicates to us that the
district centre is performing strongly as a convenience shopping destination.
6.4 Based on the performance of the convenience provision within the centre we have identified capacity for further
convenience provision in the region of 1,700 sq m net by 2011 in the centre although this by itself would not be
sufficient to support a large store format. We have also assessed the scope for Chorlton to claw back a
proportion of spend that is currently leaving what we have defined as Chorlton’s core catchment area. We have
identified that £24.9m of main food spend is leaking from Chorlton’s core catchment area and there may be
scope for Chorlton to claw back a proportion of this spend to accommodate further convenience floorspace
beyond that set out in Table 5.2 (Section 5).
6.5 The scope to accommodate further convenience floorspace in Chorlton is supported by local policy in the form
of the South Manchester Strategic Regeneration Framework and by PPS6 and new draft PPS4. With particular
emphasis in the latter on encouraging an efficient, competitive and innovative retail sector in centres, by
enhancing consumer choice and remedying deficiencies in local shopping provision. The draft policy statement
aims to achieve sustainable economic growth, promote social inclusion and ensure that deficiencies in provision
in areas with poor access to facilities are remedied, and to raise the productivity growth rate of the UK economy.
PPS1 further emphasises the importance of providing improved access for all to a range of uses including

Manchester City Council Independent Retailers Study - Chorlton
December 2009
46
shops by ensuring that new development is located where everyone can access services or facilities on foot,
bicycle or public transport rather than having to rely on access by car.
6.6 In terms of suitable sites to accommodate further convenience floorspace, CBRE examined as part of their
Centre’s Study (2004) for Manchester City Council a range of options for the centre including developing the
existing shopping precinct, examining the possibility of developing Oswald Road Primary School and adjoining
land and also the potential to reconfigure and integrate the Morrison’s store more successfully into the centre.
6.7 Evidently, the scale of such a store on any of the sites identified would need to be considered carefully given the
associated issues surrounding accessibility and parking. Depending on the size of a store and where it is
located its associated impacts on other centres would also need to be considered carefully.
Maintaining Diversity
6.8 Overall, we consider that the district centre’s role and function appears to meet the expectations in the UDP as
a second tier centre below the principal centre of Manchester, but there are clear signs pointing to areas for
improvement and consolidation over the LDF period. Research shows that it is also important that a centre’s
retail offer comprises a mix of smaller independent and specialist operators. The can help to underpin the
character and uniqueness of centres, and avoid the criticism that all high streets look the same because they
comprise the same retailers.
6.9 At the current time the centre has a reasonable representation of multiple retailers for its size and equally a
good representation of independent retailers particularly in the convenience sector. However, the greatest
threat to Chorlton appears to be maintaining its varied mix of retailers, whilst also accommodating sustainable
growth.
6.10 If a new foodstore was to be located in the centre boundary of Chorlton there is no requirement within
PPS6/draft PPS4 to assess the impact of the proposal on other provision, particularly the impact that a
foodstore could have on other independent provision within Chorlton.
6.11 For a store to be a key anchor in the centre it will have to be of suitable scale to claw-back shoppers to Chorlton
that are currently leaving its immediate catchment area. If the store is located in the defined boundary of the
centre/primary shopping area it will be difficult to add conditions which would restrict the range of goods, such
as an in house butchers or fishmongers, that could be sold from the store. Therefore, the Council will need to
examine other ways of ensuring that a new store compliments rather than erodes the existing retail provision,
particularly the independent offer.
6.12 The telephone and in centre surveys do suggest that people who shop in the independent shops, particularly
the convenience provision, in Chorlton are very committed to these shops for various reasons as previously set
out in section 4. This suggests that should a new supermarket be accommodated in Chorlton the people who
currently shop in independent stores in Chorlton are likely to continue to use the existing offer regardless. This

Manchester City Council Independent Retailers Study - Chorlton
December 2009
47
suggests that the actual impact on smaller shops in Chorlton could be less severe than in other centres where
the independent offer is not so strong.
6.13 Clearly the provision of a new foodstore will bring about associated benefits by clawing back more shoppers
that are currently being lost to other less sustainable destinations. However, for such benefits to be fully
realised the design of any potential retail development is of critical importance and must integrate fully within the
existing fabric of the current centre.
6.14 The positioning of an anchor store in Chorlton, such as the precinct, will therefore need to ensure that it has due
regard to the creation of clear pedestrian flows and be not isolated from existing retail provision thereby
encouraging linked trips. If successfully achieved this will help to support and improve the existing business
community. If suitably integrated, it will enhance the centre’s attraction and act as a catalyst for wider benefits
by generating higher levels of footfall with the potential for spin-off spend to other businesses and uses.
6.15 Evidently, there are other benefits to the local business community that can be brought about through new retail
development by way of planning obligations, including:
• Public realm improvements;
• Local highway improvements; and
• The likely provision of more modern town centre parking.
6.16 Clearly introducing more car parking into the centre would be of benefit to local businesses who acknowledged
in the business survey the cost/availability of car parking as their main dislike in Chorlton. However, any
additional car parking would need to be successfully integrated into the centre and not be dedicated solely to
any new foodstore in order for local business to benefit.
6.17 Improvements to the physical environment brought about through a new foodstore would also be of benefit to
local businesses who also cited this as a key weakness in Chorlton. The quality of the physical and pedestrian
environment in Chorlton will be crucial to attract and maintain existing retailers and service businesses and
encourage people to keep visiting the centre.
6.18 The LDF and future strategy for Chorlton should therefore also seek to enhance the environment and facilitate
pedestrian movement around the centre and provide initiatives to maintain and improve shop frontages. As we
have seen in policy and through our assessment of the centre’s retail structure, Chorlton is not envisaged to
expand significantly and the focus should be on enhancing the existing composition and environment in order to
consolidate its role and attract new multiple/independent retailers to the centre.
6.19 Controlling the specific uses within a centre can also help to protect the prime retail areas within a centre. We
would recommend that Chorlton introduces primary and secondary frontages which comprise a Primary
Shopping Area. More recently, the revised Use Classes Order has given local authorities greater control over
the mix of A3/4 and 5 restaurant, café, pubs and fast food take-aways, and this could be taken advantage of in
Manchester City Council Independent Retailers Study - Chorlton
December 2009
48
Chorlton to protect the vitality and viability of centres. It would seem appropriate therefore for the LDF, in line
with existing policy CB10 of the UDP, to provide greater protection of uses in the primary and secondary
frontages resisting fast food restaurants where necessary, and allowing more flexibility beyond these frontages
but perhaps still within the primary shopping area.
Management Tools
6.20 Overall, it is important to consolidate Chorlton’s position and retail offer but also examine the possibility, where
necessary, to increase the retail provision in the centre, particularly its convenience offer provided it is of an
appropriate scale and is consistent with the centre’s role and function. Evidently, the key objective should be to
maintain the diverse retail offer in the centre whilst also exploring options to enhance the environment and
connectivity of the centre. Planning polices can help to deliver such objectives. However centres such as
Chorlton can also benefit significantly from focused management to facilitate business partnership working
between key stakeholders, commercial contacts with key operators (both existing and potential), the monitoring
of key performance indicators, and the promotion of marketing and publicity campaigns. This could take the
form of a town centre partnership or the appointment of a centre manager.
6.21 The recent Government initiative ‘Looking After our Town Centres’, published in April 2009 by the DCLG
recognises that a strong partnership between local people, local businesses and local councils can help to set a
clear vision for their future of a centre and implement strategies for achieving that vision. It recognises that local
interest groups working together in the form of a town centre partnerships can:
• Create a forum to engage local stakeholders to discussion and collaboration;
• Shape and influence organisational agendas to develop a shared strategic approach to town centre
development;
• Deliver more services and/or provide a channel for additional services and enhanced delivery;
• Facilitate access to funding and resource opportunities to enhance town centres;
• Provide flexibility, innovation and extra financial and human resources to help solve problems.
6.22 Based on the issues identified in Chorlton, we would recommend the establishment of a centre manager role or
a town centre partnership in order to facilitate its future direction, growth and enhanced vitality and viability.
6.23 Other initiatives which could be explored include the potential to set up a Business Improvement District (BIDs)
in order to provide sustainable funding for Chorlton over the course of the LDF period. The UK models differ
from the North American model in that it is the operators/occupiers rather than the owners that are subject to a
levy (similar to a service charge for shopping centres) which goes towards an agreed objective for the centre.
This can range from additional community policing or street cleaning, through to marketing and promotional
events, over and above the local authority’s existing funding and services. It is important to state that BIDs are
not a replacement for existing Council’s services, but represent ‘added value’. The success of these BIDs

Manchester City Council Independent Retailers Study - Chorlton
December 2009
49
depends on the development of a strong and robust business plan at the outset that has the backing of the key
stakeholders.

PLAN 1
SURVEY AREA

PLAN 2
LEAKAGE OF CONVENIENCE SPEND


APPENDICES

APPENDIX 1
CONVENIENCE CAPACITY TABLES
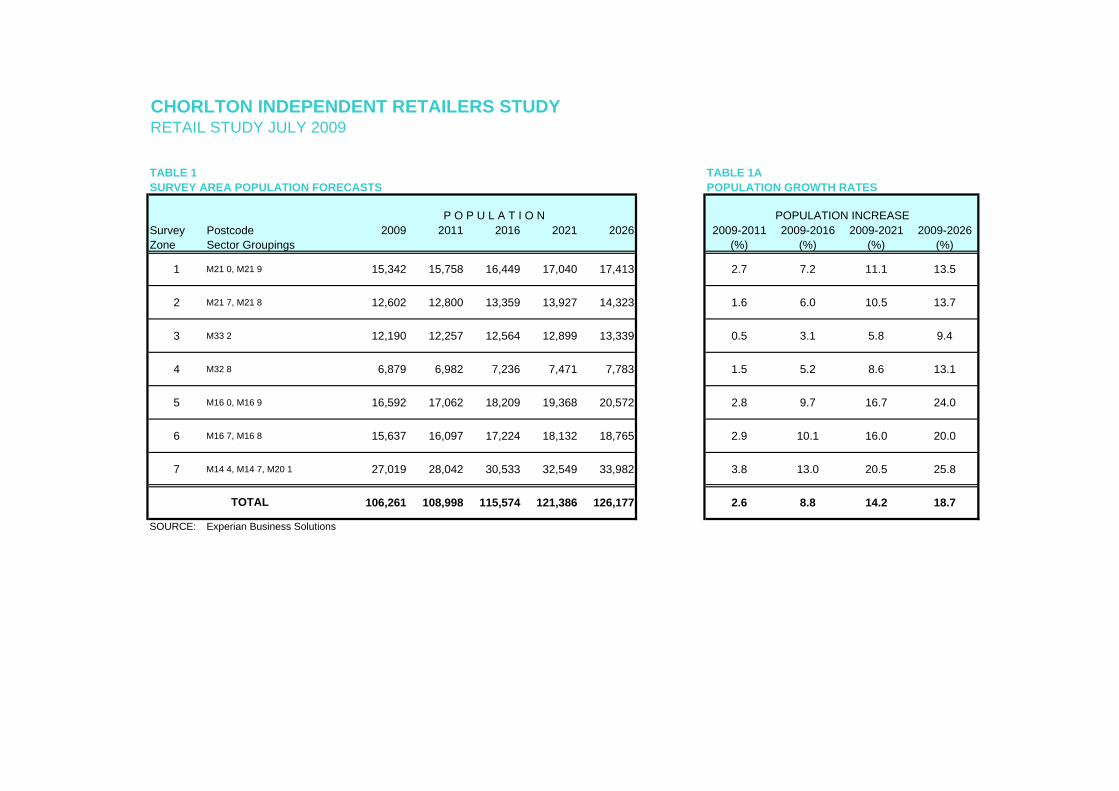
CHORLTON INDEPENDENT RETAILERS STUDYRETAIL STUDY JULY 2009
TABLE 1 TABLE 1ASURVEY AREA POPULATION FORECASTS POPULATION GROWTH RATES
Survey Postcode 2009 2011 2016 2021 2026 2009-2011 2009-2016 2009-2021 2009-2026Zone Sector Groupings (%) (%) (%) (%)
1 M21 0, M21 9 15,342 15,758 16,449 17,040 17,413 2.7 7.2 11.1 13.5
2 M21 7, M21 8 12,602 12,800 13,359 13,927 14,323 1.6 6.0 10.5 13.7
3 M33 2 12,190 12,257 12,564 12,899 13,339 0.5 3.1 5.8 9.4
4 M32 8 6,879 6,982 7,236 7,471 7,783 1.5 5.2 8.6 13.1
5 M16 0, M16 9 16,592 17,062 18,209 19,368 20,572 2.8 9.7 16.7 24.0
6 M16 7, M16 8 15,637 16,097 17,224 18,132 18,765 2.9 10.1 16.0 20.0
7 M14 4, M14 7, M20 1 27,019 28,042 30,533 32,549 33,982 3.8 13.0 20.5 25.8
106,261 108,998 115,574 121,386 126,177 2.6 8.8 14.2 18.7
SOURCE: Experian Business Solutions
P O P U L A T I O N POPULATION INCREASE
TOTAL

CHORLTON INDEPENDENT RETAILERS STUDYRETAIL STUDY JULY 2009
TABLE 2CONVENIENCE GOODS RETAIL EXPENDITURE FORECASTS PER CAPITA (2007 PRICES)GROWTH IN PER CAPITA RETAIL EXPENDITURE: 2007-2009 0.2% pa
2009-2011 0.0% pa
2011-2016 0.8% pa
2016-2021 0.9% pa
2021-2026 0.9% pa
Minus SFT at 2.3% Minus SFT at 3.0% Minus SFT at 3.5% Minus SFT at 4.0% Minus SFT at 4.0% Minus SFT at 4.0%
1 1,690 1,651 1,697 1,646 1,697 1,637 1,766 1,695 1,847 1,773 1,931 1,854 2 1,619 1,581 1,625 1,577 1,625 1,569 1,691 1,624 1,769 1,698 1,850 1,776 3 1,748 1,707 1,755 1,702 1,755 1,693 1,826 1,753 1,910 1,834 1,997 1,918 4 1,672 1,633 1,679 1,628 1,679 1,620 1,747 1,677 1,827 1,754 1,911 1,834 5 1,534 1,498 1,540 1,494 1,540 1,486 1,603 1,539 1,676 1,609 1,753 1,683 6 1,568 1,531 1,574 1,527 1,574 1,519 1,638 1,573 1,713 1,645 1,792 1,720 7 1,534 1,498 1,540 1,494 1,540 1,486 1,603 1,539 1,676 1,609 1,753 1,683
Source: Experian
TABLE 3SURVEY AREA CONVENIENCE GOODS RETAIL EXPENDITURE FORECASTS
GROWTH IN PER CAPITA RETAIL EXPENDITURE:2007-2009 0.2% pa2009-2011 0.0% pa2011-2016 0.8% pa2016-2021 0.9% pa2021-2026 0.9% pa
2009 2011 2016 2021 2026(£000) (£000) (£000) (£000) (£000)
1 25,250 25,801 27,881 30,206 32,282
2 19,869 20,077 21,692 23,651 25,4383 20,751 20,757 22,027 23,651 25,5784 11,201 11,310 12,135 13,103 14,2755 24,786 25,357 28,016 31,164 34,6186 23,877 24,453 27,087 29,822 32,2777 40,363 41,675 46,977 52,373 57,184
TOTAL 166,096 169,430 185,815 203,970 221,652
Source: Tables 1 & 2
20262007 2009 2011 2016
ZONE
ZONE
Convenience Goods
2021

CHORLTON INDEPENDENT RETAILERS STUDYRETAIL STUDY JULY 2009
CONVENIENCE GOODS - CHORLTONTABLE 4CONVENIENCE GOODS ALLOCATION - % MARKET SHARE
Catchment 2009 2011 2016 2021 2026 2009 2011 2016 2021 2026 2009 2011 2016 2021 2026 2009 2011 2016 2021 2026 2009 2011 2016 2021 2026 2009 2011 2016 2021 2026 2009 2011 2016 2021 2026 2009 2011 2016 2021 2026 2009 2011 2016 2021 2026
Zone (%) (%) (%) (%) (%) (%) (%) (%) (%) (%) (%) (%) (%) (%) (%) (%) (%) (%) (%) (%) (%) (%) (%) (%) (%) (%) (%) (%) (%) (%) (%) (%) (%) (%) (%) (%) (%) (%) (%) (%) (%) (%) (%) (%) (%)
1 41.7 41.7 41.7 41.7 41.7 4.1 4.1 4.1 4.1 4.1 1.1 1.1 1.1 1.1 1.1 0.4 0.4 0.4 0.4 0.4 3.8 3.8 3.8 3.8 3.8 0.9 0.9 0.9 0.9 0.9 0.4 0.4 0.4 0.4 0.4 12.4 12.4 12.4 12.4 12.4 64.8 64.4 64.4 64.4 64.42 36.7 36.7 36.7 36.7 36.7 2.1 2.1 2.1 2.1 2.1 0.0 0.0 0.0 0.0 0.0 0.0 0.0 0.0 0.0 0.0 11.4 11.4 11.4 11.4 11.4 0.0 0.0 0.0 0.0 0.0 0.0 0.0 0.0 0.0 0.0 3.6 3.6 3.6 3.6 3.6 53.7 53.7 53.7 53.7 53.73 0.0 0.0 0.0 0.0 0.0 0.0 0.0 0.0 0.0 0.0 0.0 0.0 0.0 0.0 0.0 0.0 0.0 0.0 0.0 0.0 0.0 0.0 0.0 0.0 0.0 0.0 0.0 0.0 0.0 0.0 0.0 0.0 0.0 0.0 0.0 1.2 1.2 1.2 1.2 1.2 1.2 1.2 1.2 1.2 1.24 6.7 6.7 6.7 6.7 6.7 1.4 1.4 1.4 1.4 1.4 0.4 0.4 0.4 0.4 0.4 1.1 1.1 1.1 1.1 1.1 1.1 1.1 1.1 1.1 1.1 0.0 0.0 0.0 0.0 0.0 0.0 0.0 0.0 0.0 0.0 1.9 1.9 1.9 1.9 1.9 12.6 11.6 11.6 11.6 11.65 23.2 23.2 23.2 23.2 23.2 0.4 0.4 0.4 0.4 0.4 0.0 0.0 0.0 0.0 0.0 0.9 0.9 0.9 0.9 0.9 0.0 0.0 0.0 0.0 0.0 0.8 0.8 0.8 0.8 0.8 0.8 0.8 0.8 0.8 0.8 2.1 2.1 2.1 2.1 2.1 28.2 27.2 27.2 27.2 27.26 21.2 21.2 21.2 21.2 21.2 1.6 1.6 1.6 1.6 1.6 0.0 0.0 0.0 0.0 0.0 0.9 0.9 0.9 0.9 0.9 0.0 0.0 0.0 0.0 0.0 0.0 0.0 0.0 0.0 0.0 0.0 0.0 0.0 0.0 0.0 2.6 2.6 2.6 2.6 2.6 26.3 25.4 25.4 25.4 25.47 6.0 6.0 6.0 6.0 6.0 0.0 0.0 0.0 0.0 0.0 0.0 0.0 0.0 0.0 0.0 0.0 0.0 0.0 0.0 0.0 0.0 0.0 0.0 0.0 0.0 0.0 0.0 0.0 0.0 0.0 0.0 0.0 0.0 0.0 0.0 0.2 0.2 0.2 0.2 0.2 6.2 6.2 6.2 6.2 6.2
SOURCE: Household Survey
TABLE 5CONVENIENCE GOODS ALLOCATION - SPEND (£) 2007 PRICES
Catchment 2009 2011 2016 2021 2026 2009 2011 2016 2021 2026 2009 2011 2016 2021 2026 2009 2011 2016 2021 2026 2009 2011 2016 2021 2026 2009 2011 2016 2021 2026 2009 2011 2016 2021 2026 2009 2011 2016 2021 2026 2009 2011 2016 2021 2026Zone (£000) (£000) (£000) (£000) (£000) (£000) (£000) (£000) (£000) (£000) (%) (%) (%) (%) (%) (%) (%) (%) (%) (%) (£000) (£000) (£000) (£000) (£000) (£000) (£000) (£000) (£000) (£000) (£000) (£000) (£000) (£000) (£000) (£000) (£000) (£000) (£000) (£000) (£000) (£000) (£000) (£000) (£000)
1 10,529 10,759 11,627 12,596 13,462 1,031 1,053 1,138 1,233 1,318 273 279 301 326 349 96 98 106 115 123 967 988 1,068 1,157 1,236 230 235 254 275 294 96 98 106 115 123 3,130 3,198 3,456 3,744 4,002 16,351 16,708 18,056 19,561 20,9052 7,282 7,358 7,950 8,668 9,323 418 422 456 497 535 0 0 0 0 0 0 0 0 0 0 2,257 2,281 2,464 2,687 2,890 0 0 0 0 0 0 0 0 0 0 715 723 781 852 916 10,672 10,784 11,652 12,704 13,6633 0 0 0 0 0 5 5 5 5 6 0 0 0 0 0 0 0 0 0 0 0 0 0 0 0 0 0 0 0 0 0 0 0 0 0 242 242 257 276 298 246 246 262 281 3044 753 760 815 880 959 161 162 174 188 205 47 48 51 55 60 118 119 127 138 150 118 119 127 138 150 0 0 0 0 0 0 0 0 0 0 217 219 235 253 276 1,412 1,426 1,530 1,652 1,8005 5,740 5,873 6,488 7,218 8,018 101 103 114 127 141 0 0 0 0 0 228 233 258 287 318 0 0 0 0 0 191 195 216 240 267 191 195 216 240 267 530 542 599 666 740 6,981 7,142 7,891 8,777 9,7506 5,072 5,194 5,753 6,334 6,856 370 379 420 463 501 0 0 0 0 0 217 223 246 271 294 0 0 0 0 0 0 0 0 0 0 0 0 0 0 0 612 626 694 764 827 6,271 6,422 7,114 7,832 8,4777 2,406 2,484 2,800 3,121 3,408 0 0 0 0 0 0 0 0 0 0 0 0 0 0 0 0 0 0 0 0 0 0 0 0 0 0 0 0 0 0 87 90 101 113 123 2,493 2,574 2,901 3,234 3,531
TOTALS 31,781 32,427 35,434 38,818 42,025 2,085 2,125 2,307 2,513 2,705 320 326 352 381 409 659 673 738 810 885 3,342 3,388 3,660 3,981 4,276 421 430 469 515 560 287 293 322 355 389 5,532 5,640 6,123 6,668 7,182 44,427 45,302 49,405 54,042 58,431
SOURCE: Tables 3 & 4OTHER STORES includes market shares for the following:
1 Barbakan, Barbecue Butchers, Kays CTN, WH Frost, Star News, Hampsons, Martins, Khwari Brothers, AJ Adams, Out of the Blue, "Foodstores in Chorlton", ''Chorlton Fruit & Veg, Chorlton Meat Market, Inshore Fisheries, ''local delicatessen-Chorlton'', ''local foodstores-Chorlton (Qu2), Local Butchers-Chorlton, Local Bakers-Chorlton, Greggs, Local Fishmonger-Chorlton, Local Vegetarian Shop-Chorlton, Northstar Deli
COOL TRADER QUALITY SAVE
COOL TRADER QUALITY SAVE OTHER STORES TOTAL
MORRISONS UNICORN CO-OP LATE SHOPSOMERFIELD
SOMERFIELDMORRISONS UNICORN
TESCO EXPRESS
TESCO EXPRESS CO-OP LATE SHOP
TOTALOTHER STORES

CHORLTON INDEPENDENT RETAILERS STUDYRETAIL STUDY JULY 2009
TABLE 6CHORLTON SMALL & INDEPENDENT RETAILERSStore Net Benchmark Benchmark
Retail Category Convenience Sales Turnover
(sqm) (£ per sq m net) (£000s)
Martins Bakery Wilbraham Road Bakers 79 3,000 236
Barbecue Butchers Wilbraham Road Butchers 60 3,000 181
Frosts Butchers Precinct Centre Butchers 85 3,000 255
Chorlton Meat Market Wilbraham Road Butchers 42 3,000 127
Today Express Shop Wilbraham Road Convenience 201 3,000 603
A&S Convenience Store Wilbraham Road Convenience 48 3,000 144
Chorlton Newsagents Barlow Moor Road CTN 42 3,000 127
Grove News Barlow Moor Road CTN 49 3,000 146
Newsagent Wilbraham Road CTN 57 3,000 170
Martins Precinct Centre CTN 42 3,000 125
Star News Wilbraham Road CTN 55 3,000 164
Star News 2 Wilbraham Road CTN 72 3,000 216
Kay News Manchester Road CTN 44 3,000 131
North Star Deli Wilbraham Road Delicatesssen 80 3,000 240
Barbakan Deli Manchester Road Delicatesssen 236 3,000 708
Out of the Blue Wilbraham Road Fishmonger 60 3,000 181
AJ Adams (Grocers) Precinct Centre Grocers 84 3,000 252
So Fresh Precinct Centre Grocers 42 3,000 127
Chorlton Fruit and Veg Wilbraham Road Grocers 42 3,000 125
Blossoms Barlow Moor Road Grocers 43 3,000 129
Khwari Brothers Grocery Manchester Road Grocers 95 3,000 285
Bargain Booze Manchester Road Off Licence 56 3,000 168
Sub Total 1,613 4,838
Holland & Barratt Manchester Road Health 57 3,000 172
Greggs Wilbraham Road Bakers 53 3,000 160
Hampsons Precinct Centre Bakers 39 3,000 117
Thresher Manchester Road Off Licence 88 3,000 265
Oddbins Manchester Road Off Licence 118 3,000 353
Londis Wilbraham Road Convenience 56 3,000 168
Sub Total 411 1,234
TOTAL 2,024 3,000 6,072
Source: Manchester City Council/KCI - shaded stores are not independent
TABLE 7CHORLTON LARGE INDEPENDENT RETAILERS
Store Net Benchmark/Co Average Average
Convenience Sales Turnover
(sqm) (£ per sq m net) (£000s)
Unicorn 390 6,000 2,340
TOTAL 390 6,000 2,340
Source: Manchester City Council/KCI - shaded stores are not independent
TABLE 8CHORLTON CHAIN FOODSTORESStore Net Net Co Average Average
Flsp Convenience Sales Turnover
(sqm) (sqm) (£ per sq m net) (£000s)
Morrisons 1,858 1,672 10,593 17,711Somerfield 280 280 7,040 1,971Tesco Express 216 216 10,873 2,349
Co-op Late Shop 327 327 5,314 1,738
Cool Trader 85 85 2,000 170
Quality Save 644 322 2,000 644
TOTAL 3,410 2,902 8,471 24,583
IGD
TABLE 9TOTAL CONVENIENCE GOODS FLOORSPACEStore Net Net Co Average Average
Flsp Convenience Sales Turnover
(sqm) (sqm) (£ per sq m net) (£000s)
TOTAL 5,824 5,316 6,207 32,995

CHORLTON INDEPENDENT RETAILERS STUDYRETAIL STUDY JULY 2009
CAPACITY PROJECTIONS: CONVENIENCE GOODS
TABLE 10FUTURE SHOP FLOORSPACE CAPACITY IN CHORLTON - LARGER FOODSTORE FORMAT
Sales Efficiency Increase 2008-2011 02011-2016 0.20%2016 onwards 0.50%
2009 2011 2016 2021 2026
Residents Spending (£000) 44,427 45,302 49,405 54,042 58,431
Existing Shop Floorspace(sq m net) 5,316 5,316 5,316 5,316 5,316
Sales per sq m net £ 8,357 6,207 6,269 6,427 6,590
Sales from ExistingFloorspace (£000) 44,427 32,995 33,327 34,168 35,031
Sales from Committed Floorspace (£000) 0 0 0 0 0
Residual Spending toSupport new shops (£000) 0 12,307 16,078 19,874 23,400
Sales per sq m net in new shops (£)Based on large store format (see note 1) 9,000 10,000 10,100 10,355 10,617
Capacity for new floorspace (sq m net) 0 1,231 1,592 1,919 2,204
CONVENIENCE GOODS

CHORLTON INDEPENDENT RETAILERS STUDYRETAIL STUDY JULY 2009
CAPACITY PROJECTIONS: CONVENIENCE GOODS
TABLE 11FUTURE SHOP FLOORSPACE CAPACITY IN CHORLTON - LOWER SALES DENSITY
Sales Efficiency Increase 2008-2011 02011-2016 0.20%2016 onwards 0.50%
2009 2011 2016 2021 2026
Residents Spending (£000) 44,427 45,302 49,405 54,042 58,431
Existing Shop Floorspace(sq m net) 5,316 5,316 5,316 5,316 5,316
Sales per sq m net £ 8,357 6,207 6,269 6,427 6,590
Sales from ExistingFloorspace (£000) 44,427 32,995 33,327 34,168 35,031
Sales from Committed Floorspace (£000) 0 0 0 0 0
Residual Spending toSupport new shops (£000) 0 12,307 16,078 19,874 23,400
Sales per sq m net in new shops (£)Based on large store format (see note 1) 4,500 4,500 4,545 4,660 4,778
Capacity for new floorspace (sq m net) 0 2,735 3,537 4,265 4,898
CONVENIENCE GOODS
APPENDIX 2
COMPARISON CAPACITY TABLES

CHORLTON INDEPENDENT STUDYRETAIL STUDY MAY 2009
TABLE 1 TABLE 1ASURVEY AREA POPULATION FORECASTS POPULATION GROWTH RATES
Survey Postcode 2009 2011 2016 2021 2026 2009-2011 2009-2016 2009-2021 2009-2026Zone Sector Groupings (%) (%) (%) (%)
1 M21 0, M21 9 15,342 15,758 16,449 17,040 17,413 2.7 7.2 11.1 13.5
2 M21 7, M21 8 12,602 12,800 13,359 13,927 14,323 1.6 6.0 10.5 13.7
3 M33 2 12,190 12,257 12,564 12,899 13,339 0.5 3.1 5.8 9.4
4 M32 8 6,879 6,982 7,236 7,471 7,783 1.5 5.2 8.6 13.1
5 M16 0, M16 9 16,592 17,062 18,209 19,368 20,572 2.8 9.7 16.7 24.0
6 M16 7, M16 8 15,637 16,097 17,224 18,132 18,765 2.9 10.1 16.0 20.0
7 M14 4, M14 7, M20 1 27,019 28,042 30,533 32,549 33,982 3.8 13.0 20.5 25.8
106,261 108,998 115,574 121,386 126,177 2.6 8.8 14.2 18.7
SOURCE: Experian Business Solutions
P O P U L A T I O N POPULATION INCREASE
TOTAL

CHORLTON INDEPENDENT STUDYRETAIL STUDY MAY 2009
TABLE 2COMPARISON GOODS RETAIL EXPENDITURE FORECASTS PER CAPITA (2007 PRICES)GROWTH IN PER CAPITA RETAIL EXPENDITURE: 2007-2009 0.4% pa
2009-2011 0.1% pa
2011-2016 2.5% pa
2016-2021 2.8% pa
2021-2026 2.8% pa
Minus SFT at 8.0% Minus SFT at 10.0% Minus SFT at 11.3% Minus SFT at 12.5% Minus SFT at 12.5% Minus SFT at 12.5%
1 3,037 2,794 3,061 2,755 3,067 2,722 3,471 3,037 3,984 3,486 4,574 4,003 2 2,593 2,386 2,614 2,352 2,619 2,324 2,963 2,593 3,402 2,977 3,906 3,417 3 3,064 2,819 3,089 2,780 3,095 2,746 3,501 3,064 4,020 3,517 4,615 4,038 4 2,857 2,628 2,880 2,592 2,886 2,561 3,265 2,857 3,748 3,280 4,303 3,765 5 2,434 2,239 2,454 2,208 2,458 2,182 2,781 2,434 3,193 2,794 3,666 3,208 6 2,518 2,317 2,538 2,284 2,543 2,257 2,877 2,518 3,304 2,891 3,793 3,319 7 2,390 2,199 2,409 2,168 2,414 2,142 2,731 2,390 3,136 2,744 3,600 3,150
Source: Experian
TABLE 3SURVEY AREA CONVENIENCE GOODS RETAIL EXPENDITURE FORECASTS
GROWTH IN PER CAPITA RETAIL EXPENDITURE:2007-2009 0.4% pa2009-2011 0.1% pa2011-2016 2.5% pa2016-2021 2.8% pa2021-2026 2.8% pa
2009 2011 2016 2021 2026(£000) (£000) (£000) (£000) (£000)
1 42,270 42,894 49,951 59,408 69,697
2 29,645 29,749 34,637 41,456 48,9483 33,885 33,661 38,493 45,370 53,8654 17,830 17,879 20,671 24,503 29,3065 36,638 37,222 44,317 54,117 65,9926 35,721 36,329 43,366 52,412 62,2737 58,584 60,071 72,968 89,303 107,039
TOTAL 254,572 257,806 304,403 366,569 437,118
Source: Tables 1 & 2
ZONE
ZONE
Comparison Goods
2021 20262007 2009 2011 2016
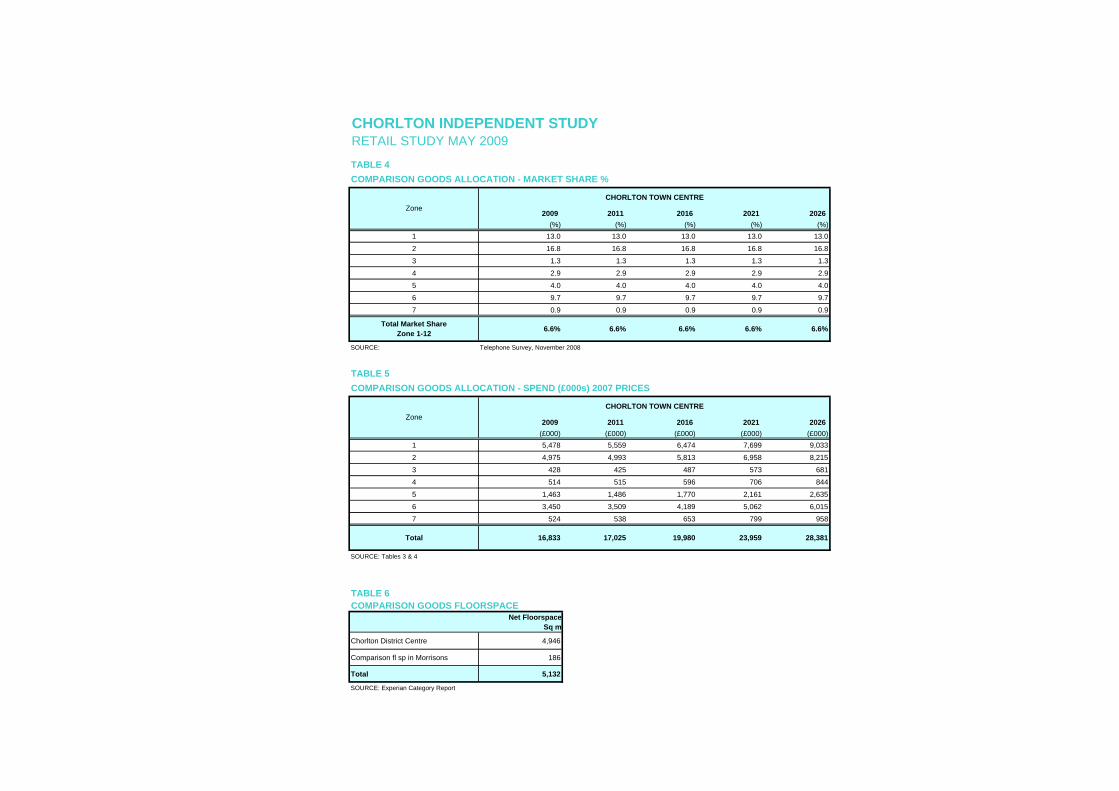
CHORLTON INDEPENDENT STUDYRETAIL STUDY MAY 2009
TABLE 4
2009 2011 2016 2021 2026(%) (%) (%) (%) (%)
1 13.0 13.0 13.0 13.0 13.0
2 16.8 16.8 16.8 16.8 16.8
3 1.3 1.3 1.3 1.3 1.3
4 2.9 2.9 2.9 2.9 2.9
5 4.0 4.0 4.0 4.0 4.0
6 9.7 9.7 9.7 9.7 9.7
7 0.9 0.9 0.9 0.9 0.9
Total Market ShareZone 1-12 6.6% 6.6% 6.6% 6.6% 6.6%
SOURCE: Telephone Survey, November 2008
TABLE 5
2009 2011 2016 2021 2026(£000) (£000) (£000) (£000) (£000)
1 5,478 5,559 6,474 7,699 9,033
2 4,975 4,993 5,813 6,958 8,215
3 428 425 487 573 681
4 514 515 596 706 844
5 1,463 1,486 1,770 2,161 2,635
6 3,450 3,509 4,189 5,062 6,015
7 524 538 653 799 958
Total 16,833 17,025 19,980 23,959 28,381
SOURCE: Tables 3 & 4
TABLE 6COMPARISON GOODS FLOORSPACE
Net FloorspaceSq m
Chorlton District Centre 4,946
Comparison fl sp in Morrisons 186
Total 5,132
SOURCE: Experian Category Report
ZoneCHORLTON TOWN CENTRE
COMPARISON GOODS ALLOCATION - SPEND (£000s) 2007 PRICES
COMPARISON GOODS ALLOCATION - MARKET SHARE %
CHORLTON TOWN CENTREZone

CHORLTON INDEPENDENT STUDYRETAIL STUDY MAY 2009
Comparison Goods Sales Efficientcy Increase 2009-2011 0.0%
2011-2016 1.5%
2016 Onwards 2.0%
2009 2011 2016 2021 2026
1 Total Spend from Survey Area (000s) 254,572 257,806 304,403 366,569 437,118
3 Market Share of Comparison Goods 6.6 6.6 6.6 6.6 6.6
5 Total Town Centre Turnover (£000s) 16,833 17,025 19,980 23,959 28,381
6 Existing Comparison Retail Floorspace in Town Centre (sq m net) 5,132 5,132 5,132 5,132 5,132
7 Sales (£ per sq m) net 3,280 3,280 3,534 3,901 4,307
8 Sales from Existing Floorspace (£000s) 16,833 16,833 18,134 20,021 22,105
9 Residual Expenditure (£000s) 0 192 1,846 3,938 6,276
11 Sales per sq m net in new shops (£) 3,000 3,000 3,232 3,568 3,940
12 Capacity for new floorspace (sq m net) 0 64 571 1,104 1,593
SOURCE:
(12) Derived from steps 9 and 10.
(11) Assumes new comparison goods floorspace is £4,500 with an annual increasing sales efficiency .
(9) Derived from subtracting step 8 from step 5.
(10) Application details from Council.
(5) Derived from steps 2 and 4.
(6) Derived from table 6.
(7) Derived from steps 5 and 6.
(8) Derived from steps 6 and 7.
(1) Derived from Table 3.
(2) Derived from Table 5.
(3) Derived from Table 4.
(4) Assumption extrapolated from market share of outer survey zones.
NOTE: Sales Efficiency (Row 7) grown 1.5% 2011-2016 then 2.0% from 2016 onwards
TOWN CENTRE COMPARISON GOODS
TABLE 7
FUTURE COMPARISON RETAIL FLOORSPACE CAPACITY

APPENDIX 3
LEAKAGE/CLAW-BACK ASSESSMENT: MAIN FOOD EXPENDITURE

CHORLTON INDEPENDENT RETAILERS STUDYRETAIL STUDY MAY 2009
TABLE 1 TABLE 1ASURVEY AREA POPULATION FORECASTS POPULATION GROWTH RATES
Survey Postcode 2009 2011 2016 2021 2026 2009-2011 2009-2016 2009-2021 2009-2026Zone Sector Groupings (%) (%) (%) (%)
1 M21 0, M21 9 15,342 15,758 16,449 17,040 17,413 2.7 7.2 11.1 13.5
2 M21 7, M21 8 12,602 12,800 13,359 13,927 14,323 1.6 6.0 10.5 13.7
3 M33 2 12,190 12,257 12,564 12,899 13,339 0.5 3.1 5.8 9.4
4 M32 8 6,879 6,982 7,236 7,471 7,783 1.5 5.2 8.6 13.1
5 M16 0, M16 9 16,592 17,062 18,209 19,368 20,572 2.8 9.7 16.7 24.0
6 M16 7, M16 8 15,637 16,097 17,224 18,132 18,765 2.9 10.1 16.0 20.0
7 M14 4, M14 7, M20 1 27,019 28,042 30,533 32,549 33,982 3.8 13.0 20.5 25.8
106,261 108,998 115,574 121,386 126,177 2.6 8.8 14.2 18.7
SOURCE: Experian Business Solutions
P O P U L A T I O N POPULATION INCREASE
TOTAL

CHORLTON INDEPENDENT RETAILERS STUDYRETAIL STUDY MAY 2009
TABLE 2CONVENIENCE GOODS RETAIL EXPENDITURE FORECASTS PER CAPITA (2007 PRICES)GROWTH IN PER CAPITA RETAIL EXPENDITURE: 2007-2009 0.2% pa
2009-2011 0.0% pa
2011-2016 0.8% pa
2016-2021 0.9% pa
2021-2026 0.9% pa
Minus SFT at 2.3% Minus SFT at 3.0% Minus SFT at 3.5% Minus SFT at 4.0% Minus SFT at 4.0% Minus SFT at 4.0%
1 1,690 1,651 1,697 1,646 1,697 1,637 1,766 1,695 1,847 1,773 1,931 1,854 2 1,619 1,581 1,625 1,577 1,625 1,569 1,691 1,624 1,769 1,698 1,850 1,776 3 1,748 1,707 1,755 1,702 1,755 1,693 1,826 1,753 1,910 1,834 1,997 1,918 4 1,672 1,633 1,679 1,628 1,679 1,620 1,747 1,677 1,827 1,754 1,911 1,834 5 1,534 1,498 1,540 1,494 1,540 1,486 1,603 1,539 1,676 1,609 1,753 1,683 6 1,568 1,531 1,574 1,527 1,574 1,519 1,638 1,573 1,713 1,645 1,792 1,720 7 1,534 1,498 1,540 1,494 1,540 1,486 1,603 1,539 1,676 1,609 1,753 1,683
Source: Experian
TABLE 3SURVEY AREA CONVENIENCE GOODS RETAIL EXPENDITURE FORECASTS
GROWTH IN PER CAPITA RETAIL EXPENDITURE:2007-2009 0.2% pa2009-2011 0.0% pa2011-2016 0.8% pa2016-2021 0.9% pa2021-2026 0.9% pa
2009 2011 2016 2021 2026(£000) (£000) (£000) (£000) (£000)
1 25,250 25,801 27,881 30,206 32,282
2 19,869 20,077 21,692 23,651 25,4383 20,751 20,757 22,027 23,651 25,5784 11,201 11,310 12,135 13,103 14,2755 24,786 25,357 28,016 31,164 34,6186 23,877 24,453 27,087 29,822 32,2777 40,363 41,675 46,977 52,373 57,184
TOTAL 166,096 169,430 185,815 203,970 221,652
Source: Tables 1 & 2
ZONE
ZONE
Convenience Goods
2021 20262007 2009 2011 2016

CHORLTON INDEPENDENT RETAILERS STUDYRETAIL STUDY MAY 2009
CONVENIENCE GOODS - CHORLTONTABLE 4CONVENIENCE GOODS ALLOCATION FROM CHORLTON'S CORE CATCHMENT AREA - % MARKET SHARE
Catchment 2009 2011 2016 2021 2026 2009 2011 2016 2021 2026 2009 2011 2016 2021 2026 2009 2011 2016 2021 2026 2009 2011 2016 2021 2026 2009 2011 2016 2021 2026 2009 2011 2016 2021 2026 2009 2011 2016 2021 2026 2009 2011 2016 2021 2026 2009 2011 2016 2021 2026
Zone (%) (%) (%) (%) (%) (%) (%) (%) (%) (%) (%) (%) (%) (%) (%) (%) (%) (%) (%) (%) (%) (%) (%) (%) (%) (%) (%) (%) (%) (%) (%) (%) (%) (%) (%) (%) (%) (%) (%) (%) (%) (%) (%) (%) (%) (%) (%) (%) (%) (%)1 10 10 10 10 10 2 2 2 2 2 5 5 5 5 5 3 3 3 3 3 2 2 2 2 2 1 1 1 1 1 1 1 1 1 1 3 3 3 3 3 0 0 0 0 0 25 25 25 25 252 8 8 8 8 8 1 1 1 1 1 2 2 2 2 2 1 1 1 1 1 2 2 2 2 2 0 0 0 0 0 2 2 2 2 2 0 0 0 0 0 9 9 9 9 9 24 24 24 24 243 0 0 0 0 0 2 2 2 2 2 0 0 0 0 0 2 2 2 2 2 0 0 0 0 0 2 2 2 2 2 0 0 0 0 0 0 0 0 0 0 3 3 3 3 3 9 9 9 9 94 0 0 0 0 0 0 0 0 0 0 0 0 0 0 0 16 16 16 16 16 0 0 0 0 0 0 0 0 0 0 0 0 0 0 0 0 0 0 0 0 2 2 2 2 2 19 19 19 19 195 7 7 7 7 7 1 1 1 1 1 2 2 2 2 2 4 4 4 4 4 2 2 2 2 2 0 0 0 0 0 0 0 0 0 0 0 0 0 0 0 5 5 5 5 5 20 20 20 20 206 11 11 11 11 11 0 0 0 0 0 3 3 3 3 3 0 0 0 0 0 1 1 1 1 1 1 1 1 1 1 0 0 0 0 0 0 0 0 0 0 4 4 4 4 4 20 20 20 20 207 0 0 0 0 0 0 0 0 0 0 0 0 0 0 0 0 0 0 0 0 0 0 0 0 0 0 0 0 0 0 0 0 0 0 0 0 0 0 0 0 0 0 0 0 0 0 0 0 0 0
SOURCE: Household Survey
TABLE 5CONVENIENCE GOODS ALLOCATION FROM CHORLTON'S CORE CATCHMENT AREA - SPEND (£) 2007 PRICES
Catchment 2009 2011 2016 2021 2026 2009 2011 2016 2021 2026 2009 2011 2016 2021 2026 2009 2011 2016 2021 2026 2009 2011 2016 2021 2026 2009 2011 2016 2021 2026 2009 2011 2016 2021 2026 2009 2011 2016 2021 2026 2009 2011 2016 2021 2026 2009 2011 2016 2021 2026Zone (£000) (£000) (£000) (£000) (£000) (£000) (£000) (£000) (£000) (£000) (%) (%) (%) (%) (%) (%) (%) (%) (%) (%) (£000) (£000) (£000) (£000) (£000) (£000) (£000) (£000) (£000) (£000) (£000) (£000) (£000) (£000) (£000) (£000) (£000) (£000) (£000) (£000) (£000) (£000) (£000) (£000) (£000) (£000) (£000) (£000) (£000) (£000)
1 2,421 2,474 2,674 2,897 3,096 460 470 507 550 588 1,184 1,210 1,308 1,417 1,514 689 704 761 825 881 460 470 507 550 588 230 235 254 275 294 230 235 254 275 294 707 722 781 846 904 0 0 0 0 0 6,381 6,520 7,046 7,633 8,158
2 1,591 1,608 1,737 1,894 2,037 156 157 170 185 199 323 326 352 384 413 195 197 213 232 249 323 326 352 384 413 0 0 0 0 0 478 483 522 570 613 0 0 0 0 0 1,758 1,776 1,919 2,093 2,251 4,823 4,874 5,266 5,742 6,175
3 0 0 0 0 0 363 363 385 414 448 0 0 0 0 0 421 421 447 480 519 0 0 0 0 0 407 407 432 464 501 0 0 0 0 0 0 0 0 0 0 578 578 614 659 713 1,769 1,770 1,878 2,016 2,181
4 24 24 25 28 30 24 24 25 28 30 0 0 0 0 0 1,756 1,773 1,903 2,054 2,238 35 36 38 41 45 0 0 0 0 0 0 0 0 0 0 12 12 13 14 15 270 272 292 316 344 2,120 2,141 2,297 2,480 2,702
5 1,693 1,732 1,914 2,129 2,365 146 149 165 183 204 444 454 502 558 620 1,110 1,136 1,255 1,396 1,551 437 447 494 550 611 0 0 0 0 0 0 0 0 0 0 0 0 0 0 0 1,173 1,200 1,326 1,475 1,638 5,004 5,119 5,656 6,291 6,989
6 2,541 2,602 2,882 3,173 3,434 0 0 0 0 0 735 753 834 919 994 0 0 0 0 0 160 164 182 200 217 174 178 197 217 235 0 0 0 0 0 74 75 83 92 99 1,070 1,095 1,214 1,336 1,446 4,753 4,868 5,393 5,937 6,426
7 0 0 0 0 0 0 0 0 0 0 0 0 0 0 0 0 0 0 0 0 0 0 0 0 0 0 0 0 0 0 0 0 0 0 0 0 0 0 0 0 0 0 0 0 0 0 0 0 0 0
TOTALS 8,270 8,440 9,233 10,120 10,962 1,148 1,163 1,253 1,360 1,468 2,686 2,744 2,996 3,278 3,542 4,172 4,232 4,579 4,987 5,439 1,415 1,443 1,574 1,725 1,873 810 820 883 956 1,030 708 718 776 844 906 792 810 877 951 1,018 4,848 4,922 5,364 5,878 6,391 24,851 25,291 27,535 30,100 32,630
SOURCE: Tables 3 & 4Note: 'OTHER STORES' includes market shares for the following:1) Sainsbury's, Followfield / Tesco Extra, Baguley / Tesco, Arndale Centre, Stretford / Netto, Whally Range / Morrisons, Stockport / Tesco Extra, Irlam / Iceland, Dennis St, Manchester / Tesco, Burnage / Asda, Longsight / Tesco, Middleton / Asda, Pilkington Way, Manchester2) Market Shares reduced by % allocation of Core Catchment area as follows: 100% of Zone 1, 80% of Zone 2, 10% of Zone 3, 10% of Zone 4, 40% of Zone 5, Zone
Aldi, Tennis ST, Old Trafford Tesco Express, Didsbury TOTALSainsburys, Regent RoadAsda, Hulme Sainsbury's, Cuzon Road, Sale
Asda, Barton Dock Road, Old Trafford
Asda, Barton Dock Road, Old Trafford
Asda, Hulme Sainsbury's, Cuzon Road, Sale Aldi, Tennis ST, Old TraffordSainsburys, Regent Road TOTALTesco Express, DidsburyTesco, Hereford Street, Sale Tesco, Parrs Wood, East Didsbury
Tesco, Hereford Street, Sale Tesco, Parrs Wood, East Didsbury
Other
Other

CHORLTON INDEPENDENT RETAILERS STUDY
RETAIL STUDY JULY 2009
CAPACITY PROJECTIONS: CLAWBACK OF MAIN FOOD CONVENIENCE SPEND
TABLE 6
FUTURE SHOP FLOORSPACE CAPACITY IN CHORLTON THROUGH CLAWBACK
Sales Efficiency Increase 2008-2011 02011-2016 0.20%2016 onwards 0.50%
2009 2011 2016 2021 2026
Residents Spending (£000) 24,851 25,291 27,535 30,100 32,630
Sales per sq m net in new shops (£)Based on large store format (see note 1) 10,000 10,000 10,100 10,355 10,617
Capacity for new floorspace (sq m net) 2,485 2,529 2,726 2,907 3,073
CONVENIENCE GOODS

APPENDIX 4
LEAKAGE/CLAW-BACK ASSESSMENT: TOP-UP FOOD EXPENDITURE

CHORLTON INDEPENDENT RETAILERS STUDYRETAIL STUDY JULY 2009
TABLE 1 TABLE 1ASURVEY AREA POPULATION FORECASTS POPULATION GROWTH RATES
Survey Postcode 2009 2011 2016 2021 2026 2009-2011 2009-2016 2009-2021 2009-2026Zone Sector Groupings (%) (%) (%) (%)
1 M21 0, M21 9 15,342 15,758 16,449 17,040 17,413 2.7 7.2 11.1 13.5
2 M21 7, M21 8 12,602 12,800 13,359 13,927 14,323 1.6 6.0 10.5 13.7
3 M33 2 12,190 12,257 12,564 12,899 13,339 0.5 3.1 5.8 9.4
4 M32 8 6,879 6,982 7,236 7,471 7,783 1.5 5.2 8.6 13.1
5 M16 0, M16 9 16,592 17,062 18,209 19,368 20,572 2.8 9.7 16.7 24.0
6 M16 7, M16 8 15,637 16,097 17,224 18,132 18,765 2.9 10.1 16.0 20.0
7 M14 4, M14 7, M20 1 27,019 28,042 30,533 32,549 33,982 3.8 13.0 20.5 25.8
106,261 108,998 115,574 121,386 126,177 2.6 8.8 14.2 18.7
SOURCE: Experian Business Solutions
P O P U L A T I O N POPULATION INCREASE
TOTAL

CHORLTON INDEPENDENT RETAILERS STUDYRETAIL STUDY JULY 2009
TABLE 2CONVENIENCE GOODS RETAIL EXPENDITURE FORECASTS PER CAPITA (2007 PRICES)GROWTH IN PER CAPITA RETAIL EXPENDITURE: 2007-2009 0.2% pa
2009-2011 0.0% pa
2011-2016 0.8% pa
2016-2021 0.9% pa
2021-2026 0.9% pa
Minus SFT at 2.3% Minus SFT at 3.0% Minus SFT at 3.5% Minus SFT at 4.0% Minus SFT at 4.0% Minus SFT at 4.0%
1 1,690 1,651 1,697 1,646 1,697 1,637 1,766 1,695 1,847 1,773 1,931 1,854 2 1,619 1,581 1,625 1,577 1,625 1,569 1,691 1,624 1,769 1,698 1,850 1,776 3 1,748 1,707 1,755 1,702 1,755 1,693 1,826 1,753 1,910 1,834 1,997 1,918 4 1,672 1,633 1,679 1,628 1,679 1,620 1,747 1,677 1,827 1,754 1,911 1,834 5 1,534 1,498 1,540 1,494 1,540 1,486 1,603 1,539 1,676 1,609 1,753 1,683 6 1,568 1,531 1,574 1,527 1,574 1,519 1,638 1,573 1,713 1,645 1,792 1,720 7 1,534 1,498 1,540 1,494 1,540 1,486 1,603 1,539 1,676 1,609 1,753 1,683
Source: Experian
TABLE 3SURVEY AREA CONVENIENCE GOODS RETAIL EXPENDITURE FORECASTS
GROWTH IN PER CAPITA RETAIL EXPENDITURE:2007-2009 0.2% pa2009-2011 0.0% pa2011-2016 0.8% pa2016-2021 0.9% pa2021-2026 0.9% pa
2009 2011 2016 2021 2026(£000) (£000) (£000) (£000) (£000)
1 25,250 25,801 27,881 30,206 32,282
2 19,869 20,077 21,692 23,651 25,4383 20,751 20,757 22,027 23,651 25,5784 11,201 11,310 12,135 13,103 14,2755 24,786 25,357 28,016 31,164 34,6186 23,877 24,453 27,087 29,822 32,2777 40,363 41,675 46,977 52,373 57,184
TOTAL 166,096 169,430 185,815 203,970 221,652
Source: Tables 1 & 2
ZONE
ZONE
Convenience Goods
2021 20262007 2009 2011 2016

CHORLTON INDEPENDENT RETAILERS STUDYRETAIL STUDY JULY 2009
TABLE 4TOP UP CONVENIENCE GOODS ALLOCATION FROM CHORLTON'S CORE CATCHMENT AREA - % MARKET SHARE
Catchment 2009 2011 2016 2021 2026Zone (%) (%) (%) (%) (%)
1 1 1 1 1 12 0 0 0 0 03 6 6 6 6 64 1 1 1 1 15 4 4 4 4 46 4 4 4 4 47 0 0 0 0 0
SOURCE:
TABLE 5CONVENIENCE GOODS ALLOCATION FROM CHORLTON'S CORE CATCHMENT AREA - SPEND (£) 2007 PRICES
Catchment 2009 2011 2016 2021 2026Zone (£000) (£000) (£000) (£000) (£000)
1 283 289 312 338 3622 67 67 73 79 853 1,184 1,185 1,257 1,350 1,4604 145 147 157 170 1855 914 935 1,033 1,149 1,2776 911 933 1,034 1,138 1,2327 0 0 0 0 0
TOTALS 3,504 3,556 3,867 4,225 4,600
SOURCE: Tables 3 & 4
2) Market Shares reduced by % allocation of Core Catchment area as follows: 100% of Zone 1, 80% of Zone 2, 10% of Zone 3, 10% of Zone 4, 40% of Zone 5, 40% of Zone 6, 0% of Z
Note: 1) The total top up market shares in table 4 includes trade leakage to Asda, Hulme / Sainsburys, Sale / Foodstores, Old Trafford / Foodstores, Whally Range / Tesco Express, Didsbury / Foodstores Stretford / Foodstores Sale / Iceland, Seymour Grove / Tesco Extra Baguley / Sainsburys, Regent Road
TOTAL
TOTAL

CAPACITY PROJECTIONS: CLAWBACK OF TOP UP FOOD CONVENIENCE SPEND
TABLE 6
FUTURE SHOP FLOORSPACE CAPACITY IN CHORLTON THROUGH CLAWBACK OF TOP-UP EXPENDITURE
Sales Efficiency Increase 2008-2011 02011-2016 0.20%2016 onwards 0.50%
2009 2011 2016 2021 2026
Residents Spending (£000) 3,504 3,556 3,867 4,225 4,600
Sales per sq m net in new shops (£)Based on large store format (see note 1)
10,000 10,000 10,100 10,355 10,617
Capacity for new floorspace (sq m net) 350 356 383 408 433
CONVENIENCE GOODS