Embed Size (px)
Citation preview

Final 2016 Progress Report for the
Manatee River Basin Management Action Plan
Division of Environmental Assessment and Restoration
Florida Department of Environmental Protection
January 2017
2600 Blair Stone Road Tallahassee, FL 32399
www.dep.state.fl.us
Final 2016 Progress Report for the Manatee River Basin Management Action Plan (BMAP), January 2017
Acknowledgments
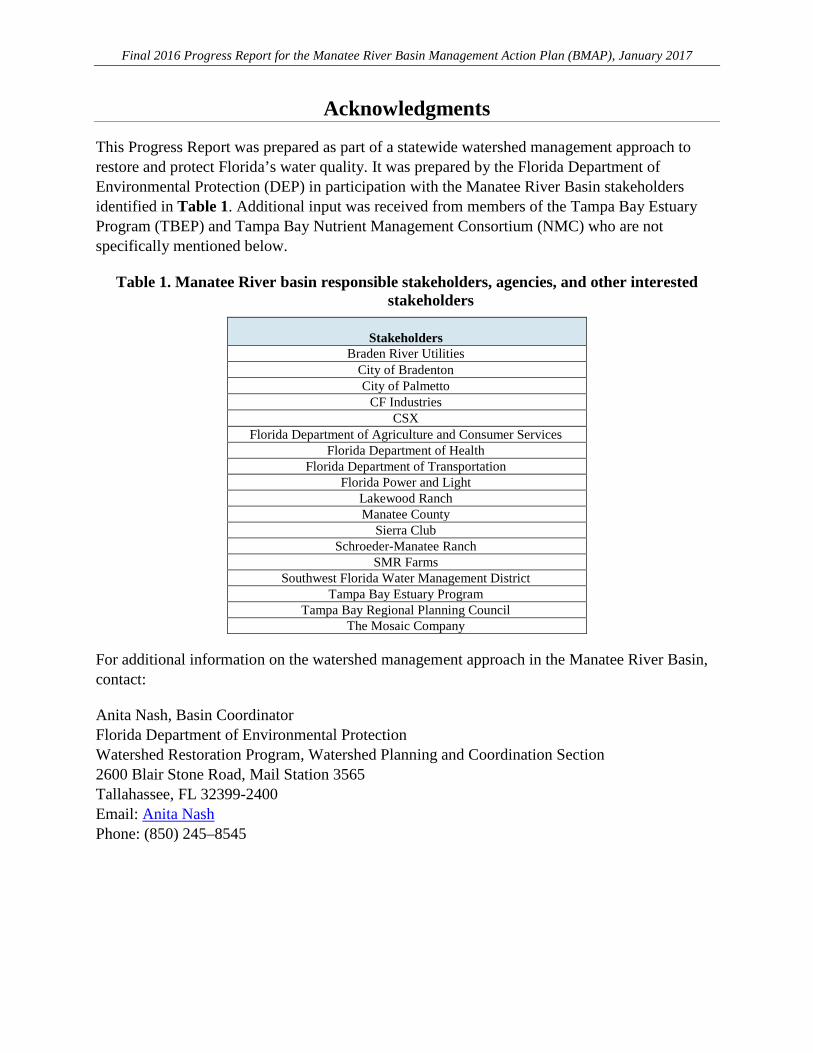
This Progress Report was prepared as part of a statewide watershed management approach to restore and protect Florida’s water quality. It was prepared by the Florida Department of Environmental Protection (DEP) in participation with the Manatee River Basin stakeholders identified in Table 1. Additional input was received from members of the Tampa Bay Estuary Program (TBEP) and Tampa Bay Nutrient Management Consortium (NMC) who are not specifically mentioned below.
Table 1. Manatee River basin responsible stakeholders, agencies, and other interested stakeholders
Stakeholders Braden River Utilities
City of Bradenton City of Palmetto
CF Industries CSX
Florida Department of Agriculture and Consumer Services Florida Department of Health
Florida Department of Transportation Florida Power and Light
Lakewood Ranch Manatee County
Sierra Club Schroeder-Manatee Ranch
SMR Farms Southwest Florida Water Management District
Tampa Bay Estuary Program Tampa Bay Regional Planning Council
The Mosaic Company
For additional information on the watershed management approach in the Manatee River Basin, contact:
Anita Nash, Basin Coordinator Florida Department of Environmental Protection Watershed Restoration Program, Watershed Planning and Coordination Section 2600 Blair Stone Road, Mail Station 3565 Tallahassee, FL 32399-2400 Email: Anita Nash Phone: (850) 245–8545

Final 2016 Progress Report for the Manatee River Basin Management Action Plan (BMAP), January 2017
Page 3 of 31
Table of Contents
Acknowledgments ......................................................................................................................... 2
List of Acronyms and Abbreviations .......................................................................................... 5
Section 1. Introduction and Background .................................................................................... 7
Section 2. Activities During the Reporting Period ................................................................... 10
2.1 FDACS 10
2.2 Walk the Waterbody (WTW) ....................................................................................... 13
Section 3. Water Quality Evaluation ......................................................................................... 14
3.1 Revised FIB Criteria ..................................................................................................... 14
3.2 Water Quality Monitoring ............................................................................................ 14
3.3 Fecal Coliform Reductions Since BMAP Adoption ................................................... 15
3.4 Nutrients and DO .......................................................................................................... 16
Appendices ................................................................................................................................... 20
Appendix A: Important Links............................................................................................ 20
Appendix B. Stakeholder Projects Completed, Ongoing, or Planned During the Reporting Period (April 1, 2015–March 31, 2016) ................. 21
Appendix C. Manatee River BMAP Onsite Sewage Treatment and Disposal Systems (OSTDS) Data Summary ............................................... 23
Appendix D. BMAP Water Quality Monitoring Stations................................................ 28
Appendix E. Trend Analysis Results ................................................................................. 30

Final 2016 Progress Report for the Manatee River Basin Management Action Plan (BMAP), January 2017
Page 4 of 31
List of Figures
Figure 1. Manatee River BMAP boundary ......................................................................................9
Figure 2. Agricultural land use based on 2008 SWFWMD data in the Manatee River Basin ......12
Figure 3. FDACS BMP Program enrollment in the Manatee River Basin as of March 31, 2016 .13
Figure C-1. Illustration of a typical OSTDS ..................................................................................24
Figure C-2. Wastewater disposal method for parcels within the Manatee River BMAP area as of March 3, 2017 ...........................................................................................................25
Figure D-1. Monitoring stations for fecal coliform in the Manatee River .....................................29
List of Tables
Table 2. Manatee River Basin TMDLs ............................................................................................8
Table 3. Agricultural acreage and FDACS BMP Program enrollment ..........................................11
Table 4. WTW status ......................................................................................................................13
Table 5. Comparison of FIB exceedances ......................................................................................16
Table B-1. Project table .................................................................................................................21
Table C-1. Summary of number of parcels using different wastewater methods by WBID .........26
Table C-2. Percent of OSTDS constructed before or after 1983 and average age of OSTDS from January 2017 by WBID ......................................................................26
Table C-3. New, repair, existing, and abandonment construction permits by year .......................27
Table D-1. List of active BMAP monitoring stations ....................................................................28
Table E-1. Seasonal Mann-Kendall trend analysis results (per station) ........................................30
Table E-2. Mann-Kendall trend analysis on AGM results (by WBID) .........................................30
Table E-3. Step trend analysis results (per station) ........................................................................31

Final 2016 Progress Report for the Manatee River Basin Management Action Plan (BMAP), January 2017
Page 5 of 31
List of Acronyms and Abbreviations
AGM Annual Geometric Mean BMAP Basin Management Action Plan BMP Best Management Practice BOD Biochemical Oxygen Demand BOD5 Five-Day Biochemical Oxygen Demand cfu Colony-Forming Units DEP Florida Department of Environmental Protection DO Dissolved Oxygen E. coli Escherichia coli EHD Environmental Health Database ERC Environmental Regulation Commission EPA U.S. Environmental Protection Agency F.A.C. Florida Administrative Code FDACS Florida Department of Agriculture and Consumer Services FDOH Florida Department of Health FDOT Florida Department of Transportation FIB Fecal Indicator Bacteria FLWMI Florida Water Management Inventory IWR Impaired Surface Waters Rule LA Load Allocation MGM Monthly Geometric Mean mL Milliliter mg/L Milligrams per Liter N/A Not Applicable NMC (Tampa Bay) Nitrogen Management Consortium NOI Notice of Intent NPDES National Pollutant Discharge Elimination System OSTDS Onsite Sewage Treatment and Disposal System POR Period of Record RAP Reasonable Assurance Plan SCI Stream Condition Index STORET STOrage and RETrieval (Database) SWFWMD Southwest Florida Water Management District TBD To Be Determined TBEP Tampa Bay Estuary Program TMDL Total Maximum Daily Load TN Total Nitrogen TP Total Phosphorus TPTV Ten Percent Threshold Value USGS U.S. Geological Survey WBID Waterbody Identification

Final 2016 Progress Report for the Manatee River Basin Management Action Plan (BMAP), January 2017
Page 6 of 31
WLA Wasteload Allocation WTW Walk the WBID (or Waterbody)

Final 2016 Progress Report for the Manatee River Basin Management Action Plan (BMAP), January 2017
Page 7 of 31
Section 1. Introduction and Background
This annual Progress Report describes activities associated with the second year of the Manatee River Basin Management Action Plan (BMAP) adopted in April 2014. Section 2 describes the projects and activities implemented by stakeholders during the reporting period (April 1, 2015–March 31, 2016), as well as planned projects for the next reporting period (April 1, 2016–March 31, 2017). Section 3 is an evaluation of water quality data for the monitoring period (January 1, 2015–December 31, 2015). Appendix A contains important web addresses that are embedded throughout the report. Appendix B contains tables that identify stakeholder projects and activities that were completed, continued (i.e., ongoing), or planned during the reporting period. Appendix C contains a Florida Department of Health (FDOH) septic system summary for the Manatee River BMAP area. Appendix D contains a list and a map of the BMAP monitoring stations. Appendix E contains the trend analysis results.
The Manatee River BMAP was developed in collaboration with areawide stakeholders with the assistance of the Tampa Bay Estuary Program (TBEP) and the Tampa Bay Nitrogen Management Consortium (NMC). The TBEP successfully developed the 2002 Tampa Bay Reasonable Assurance Plan (RAP) to reduce nutrient inputs to Tampa Bay. The TBEP worked with the Tampa Bay NMC to assess the nutrient loads generated, implement actions to reduce nitrogen loadings, and then monitor improvements in seagrass throughout the bay. The BMAP incorporates these efforts and adds a few elements beyond the requirements of the RAP to address the total maximum daily loads (TMDLs1).
Examples of additional BMAP elements include the implementation of source identification efforts such as Walk the Watershed, also known as Walk the WBID2 (WTW), and the implementation of efforts to reduce fecal indicator bacteria (FIB) loading to the waterbodies. The adopted BMAP also brings the requirement for production agricultural operations within the BMAP area to participate in the Florida Department of Agriculture and Consumer Services (FDACS) Best Management Practice (BMP) Program or elect to perform water quality monitoring of their operations.
Within portions of the Manatee River Basin, fecal coliform bacteria and nutrients were identified as the primary pollutants causing impairment. In 2009, DEP adopted TMDLs for four of the verified impaired waterbodies in the Manatee River Basin: Rattlesnake Slough (WBID 1923), Cedar Creek (WBID 1926), Nonsense Creek (WBID 1913), and Braden River Above Evers Reservoir (WBID 1914). Table 2 lists the WBIDs, specific parameters, and pollutant load allocations (LAs) for each TMDL addressed by the BMAP. The nutrient TMDLs for Nonsense
1 TMDLs are water quality targets for specific pollutants that are established for impaired waterbodies that do not meet designated uses based on Florida water quality standards. 2 DEP uses the acronym “WBID,” derived from the words “waterbody identification,” to identify the watersheds of tributaries, lakes, estuaries, beaches, and segments of large rivers. The state is divided into approximately 6,600 WBIDs for the purpose of watershed management.

Final 2016 Progress Report for the Manatee River Basin Management Action Plan (BMAP), January 2017
Page 8 of 31
Creek and Rattlesnake Slough, listed below, were developed to address dissolved oxygen (DO) impairments; however, these WBIDs are no longer impaired for DO. All four WBIDs have TMDLs for FIB. The TMDLs that define the required fecal coliform and nutrient reductions needed for each segment or tributary are available online. DEP adopted the Manatee River BMAP to implement the fecal coliform and nutrient TMDLs. Figure 1 depicts the BMAP geographic boundaries.
Table 2. Manatee River Basin TMDLs Note: All four waterbodies are Class I fresh waters.
WBID Waterbody Name TMDL Components
1923 Rattlesnake Slough
Total Phosphorus (TP) (% load reduction) – Wasteload Allocation (WLA) (National Pollutant Discharge Elimination System [NPDES] stormwater) = 21 % – LA = 21 % Total Nitrogen (TN) (% load reduction) – WLA (NPDES stormwater) = 30 % reduction – LA = 30 % reduction Five-Day Biochemical Oxygen Demand (BOD5) (% load reduction) – WLA (NPDES stormwater) = 31 % reduction – LA = 31 % reduction
1923 Rattlesnake Slough Fecal Coliform Concentration (% load reduction) – WLA (NPDES stormwater) = 43 % reduction – LA = 43 % reduction
1926 Cedar Creek Fecal Coliform Concentration (% load reduction) – WLA (NPDES stormwater) = 61 % reduction – LA = 61 % reduction
1913 Nonsense Creek Fecal Coliform Concentration (% reduction) – WLA (NPDES stormwater) = 57 % reduction – LA = 57 % reduction
1913 Nonsense Creek
TN (% load reduction) – WLA (NPDES stormwater) = 27 % reduction – LA = 27 % reduction BOD5 (% load reduction) – WLA (NPDES stormwater) = 36 % reduction – LA = 36 % reduction
1914 Braden River Above Evers
Reservoir
Fecal Coliform Concentration (% reduction) – WLA (NPDES stormwater) = 43 % reduction – LA = 43 % reduction

Final 2016 Progress Report for the Manatee River Basin Management Action Plan (BMAP), January 2017
Page 9 of 31
Figure 1. Manatee River BMAP boundary

Final 2016 Progress Report for the Manatee River Basin Management Action Plan (BMAP), January 2017
Page 10 of 31
Section 2. Activities During the Reporting Period
Stakeholders are implementing ongoing maintenance programs and planned projects. DEP and stakeholders continue to work together to identify the sources of FIB through field investigations and the monitoring of source indicator parameters.
Appendix B contains detailed tables of BMAP projects and activities that were completed, continued, or planned during the reporting period. Highlights of activities during the reporting period are described below.
2.1 FDACS FDACS has three field staff and two technicians assigned to the Southwest Florida Water Management District (SWFWMD) area. These staff enroll commercial agricultural producers in the appropriate FDACS BMP manual, administer cost-share funds, and conduct implementation assurance or follow-up visits with enrolled producers. During the reporting period from April 1, 2015, to March 31, 2016, FDACS adopted a revised vegetable and agronomic crop BMP manual as well as a dairy BMP manual.
Figure 2 shows agricultural land use in the Manatee River BMAP area. The acreage used to calculate the starting point agricultural nutrient load is based on 2008 land use information from the SWFWMD.
It is important to understand that even if all targeted agricultural operations are enrolled, not all of the acreage listed as agriculture in Figure 2 will be included in enrollment figures. The notices of intent (NOIs) document the estimated total number of acres on which applicable BMPs are implemented, not the entire parcel acreage. This is because land use data may contain nonproduction acres (such as buildings, parking lots, and fallow acres) that are not counted on the NOIs submitted to FDACS.
Significant acreage that does not need to be enrolled, such as lands that are not actively involved in commercial agriculture (operations conducted as a business), may exist in this BMAP area. These areas are often low-density residential uses on large parcels of grassed land, or land that was but is no longer in commercial agricultural production. This information is impossible to discern in the photo interpretation process used to generate land use data. Local governmental, SWFWMD, or DEP BMPs may address these noncommercial sources.
Based on aerial imagery and field staff observation, FDACS adjusted the land use acreages to reflect the current agricultural land use acreage more accurately. The FDACS-adjusted acreage shows approximately 8.8 % less total acreage than indicated in the 2008 figures. This decrease is the result of nonproduction lands that do not need to be enrolled but are included in agricultural land use and classified as "other open lands–rural." In addition, some acreage may have ceased production since 2008 and therefore does not need to be enrolled in the FDACS BMP Program. Figure 3 shows the acres enrolled in BMPs as of March 31, 2016.

Final 2016 Progress Report for the Manatee River Basin Management Action Plan (BMAP), January 2017
Page 11 of 31
Table 3 summarizes the land use data and the number of acres enrolled in the FDACS BMP Program in the Manatee River Basin. After accounting for the FDACS-adjusted acreage that is now urban and/or out of production, there is no remaining significant amount of unenrolled agricultural acreage in the BMAP area. Field staff will attempt to enroll any remaining small operations and will update the existing enrollment as needed through the implementation assurance process. It is also important to note that currently more agricultural acres are enrolled in the FDACS BMP Program than there are agricultural acres in the 2008 land use coverage. This difference can be attributed to potential inaccuracies in the original land use as well as changes in land use over time.
Because of inaccuracies in the land use information and changes in land use since 2008, agricultural loadings may be less than indicated in the TMDL. The region is expected to continue the shift from agricultural to residential/urban land uses, further reducing agricultural loadings. FDACS will work with DEP to identify appropriate nutrient reductions associated with agricultural BMPs.
Table 3. Agricultural acreage and FDACS BMP Program enrollment 1 FDACS-adjusted acreage for the purposes of enrollment is based on a review of more recent aerial imagery in the basin and local staff observations. N/A = Not applicable.
2008 SWFWMD Land Use 2008 Acres
FDACS-Adjusted Acres for Enrollment1
Related FDACS BMP Programs
Acreage Enrolled
Related NOIs
Certification
Pastureland and Rangeland 1,945.2 1,945.2 Cow/Calf
and Sod
1,828.2 and
416.5
3 and 1
Row/Field/Mixed Crops 604.7 335.9 Vegetable/ Agronomic Crops 1,017.8 3
Nurseries and Vineyards 1.0 1.0 Statewide Nurseries 0 0
Other Open Land–Rural 114.6 0 No Enrollment Needed N/A N/A
Total 2,665.5 2,282.1 3,262.4 7

Final 2016 Progress Report for the Manatee River Basin Management Action Plan (BMAP), January 2017
Page 12 of 31
Figure 2. Agricultural land use based on 2008 SWFWMD data in the Manatee River Basin

Final 2016 Progress Report for the Manatee River Basin Management Action Plan (BMAP), January 2017
Page 13 of 31
Figure 3. FDACS BMP Program enrollment in the Manatee River Basin as of March 31,
2016
2.2 Walk the Waterbody (WTW) When a waterbody has an adopted fecal coliform TMDL then DEP recommends carrying out a WTW exercise as a first step to determine sources and identify management strategies. Table 4 lists the status of the WTW exercise for each waterbody with a fecal coliform TMDL in the Manatee River Basin.
Table 4. WTW status TBD = To be determined.
WBID Waterbody Name WTW Status Lead Entity
1923 Rattlesnake Slough Completed Manatee County Parks and Natural Resources Department
1926 Cedar Creek Completed Manatee County Parks and Natural Resources Department
1913 Nonsense Creek TBD TBD 1914 Braden River above Evers Reservoir TBD TBD

Final 2016 Progress Report for the Manatee River Basin Management Action Plan (BMAP), January 2017
Page 14 of 31
Section 3. Water Quality Evaluation
3.1 Revised FIB Criteria In 2015, the Environmental Regulation Commission (ERC) approved proposed revisions to Florida’s water quality standards that included revised bacteria criteria. DEP adopted the U.S. Environmental Protection Agency's (EPA) bacteriological criteria for Escherichia coli (E. coli) bacteria (Class I and III fresh water) in waters and Enterococci bacteria (Class III marine water) to replace the existing criteria for fecal coliform bacteria. These new bacterial fecal indicators are based on the same recreational bather illness rate as the fecal coliform criteria, but they correlate better with bather illness than fecal coliforms and are thus more protective. Class II fecal coliform criteria are retained, since the federal and state shellfish harvesting programs continue to use this indicator.
The new criteria include a monthly geometric mean (MGM) and a ten percent threshold value (TPTV). The MGM is based on a minimum of either 5 samples (Class I) or 10 samples (Class III) taken over a 30-day period. Because of sample size, the criteria applicable to the BMAP are the TPTV. A TPTV is an upper value not to be exceeded in 10 % or more of the samples during an assessment period. E. coli will be used to assess fresh waters and the MGM is 126 colony-forming units/100 milliliters (cfu/100mL) and the TPTV is 410 cfu/100 mL. Enterococci will be used to assess Class III marine waters and the MGM is 35 cfu/100 mL and the TPTV is 130 cfu/100 mL. The waterbodies addressed in this BMAP are Class I freshwater streams.
While the criteria went into effect (for state purposes) on February 17, 2016, they will need EPA approval before going into effect for Clean Water Act purposes (impaired waters assessments and NPDES permits). For more information about the criteria, contact Ken Weaver of the DEP Standards Development Section.
To transition to the new state FIB criteria, the BMAP efforts will continue to implement the fecal coliform TMDLs while integrating sampling for E. coli, so that the waterbodies can be assessed using the new water quality standard during the next assessment cycle. The E. coli data will be used to guide future restoration efforts. In the meantime, high-magnitude fecal coliform exceedances remain a good tool to direct field investigations and management strategies.
3.2 Water Quality Monitoring The Manatee River BMAP monitoring plan supports the implementation of the BMAP by providing water quality data and other information that can be used to document status and track trends in FIB or nutrient levels in the six BMAP WBIDs. The information collected through the monitoring plan is used to evaluate progress toward achieving BMAP objectives, to demonstrate progress toward meeting the TMDLs, to facilitate comparisons of water quality in the BMAP watershed before and after the implementation of BMPs, and to provide information to help guide the selection of future BMPs.

Final 2016 Progress Report for the Manatee River Basin Management Action Plan (BMAP), January 2017
Page 15 of 31
The monitoring plan consists of ambient water quality sampling at six core stations. The stations are sampled monthly. The stations are monitored by the Manatee County Environmental Management Department. The county uploads its data to the DEP STOrage and RETrieval (STORET) Database regularly, at least twice a year. Appendix D lists the current stations in the monitoring network and provides a map of the station locations. Monitoring stations may be moved to different locations, but participants will carry out the same level of effort so that the impairments in the basin can be identified and addressed.
3.3 Fecal Coliform Reductions Since BMAP Adoption DEP determines progress towards meeting the FIB criterion for the 4 BMAP waterbodies by assessing the frequency with which the criterion for each tributary is exceeded. This approach mirrors the Impaired Surface Waters Rule (IWR) methodology in Chapter 62-303, Florida Administrative Code (F.A.C.). The prior Class I IWR criterion was set so that if more than 10 % of the data were to exceed 400 cfu/100mL during each verified period, the water was verified as impaired. As E. coli and Enterococci data become available, the frequency of exceedance of the new state criteria will be used in conjunction with frequency of exceedance of the old state criterion for BMAP progress assessments. This approach will allow a smooth transition to the new FIB criteria and provide the ability to assess progress as datasets of the new FIB parameters grow.
This section includes data from the BMAP monitoring network and other key stations that together make up the IWR monitoring network. Table 5 lists each WBID’s total number of fecal coliform samples, the total number of exceedances, the minimum number of exceedances to be considered impaired, and the percent exceedance for assessment Cycles 1 through 3. To continue comparing progress each year until the next assessment (Cycle 4), a rolling 7.5-year data period is evaluated (Table 5). Each year, the oldest 12 months of data are dropped off the data period reviewed the previous year, and the most recent 12 months of data are added to the dataset.
Column 5 in the table lists the minimum number of exceedances needed to place a waterbody on the Verified List with at least a 90 % confidence level. The minimum number of exceedances is compared with the number of exceedances to determine if the IWR criterion is being met. The last column in the table lists each WBID's percent exceedance, which is based on the number of exceedances (Column 4) relative to the total number of data points (Column 3) for each 7.5-year dataset (cycle).

Final 2016 Progress Report for the Manatee River Basin Management Action Plan (BMAP), January 2017
Page 16 of 31
Table 5. Comparison of FIB exceedances 1 The Cycle 1 verified period is January 1, 1996–June 30, 2003; the Cycle 2 verified period is January 1, 2001–June 30, 2008; the Cycle 3 verified period is January 1, 2007–June 30, 2014; the first 7.5-year verified period is January 1, 2008–June 30, 2015; and the current 7.5-year verified period is January 1, 2009–June 30, 2016. 2 Subsection 62-303.420(2), F.A.C., Table 3.
Waterbody Name Cycle1
Total Number of FIB Data
Points Number of
Exceedances
Minimum Number of
Exceedances to be Considered
Impaired2 %
Exceedance Rattlesnake Slough 1 72 32 12 44 Rattlesnake Slough 2 76 17 12 22 Rattlesnake Slough 3 78 20 12 26 Rattlesnake Slough First 7.5-year period 82 19 13 23
Rattlesnake Slough Current 7.5-year period 77 17 12 22
Cedar Creek 1 72 27 12 38 Cedar Creek 2 79 41 12 52 Cedar Creek 3 75 47 12 63 Cedar Creek First 7.5-year period 80 42 13 53
Cedar Creek Current 7.5-year period 74 37 12 50
Nonsense Creek 1 63 18 10 29 Nonsense Creek 2 73 24 12 33 Nonsense Creek 3 78 32 12 41 Nonsense Creek First 7.5-year period 81 35 13 43
Nonsense Creek Current 7.5-year period 75 36 12 48
Braden River Above Ward Lake 1 287 67 36 23
Braden River Above Ward Lake 2 283 60 36 21
Braden River Above Ward Lake 3 233 33 30 14
Braden River Above Ward Lake First 7.5-year period 258 45 33 17
Braden River Above Ward Lake
Current 7.5-year period 234 43 30 18
3.4 Nutrients and DO 3.4.1 Revised DO Criteria DEP conducted an extensive statewide freshwater DO study during 2005 to 2006 in lakes and streams to collect the data required to fully assess the accuracy of the previous DO criterion and to revise the state’s DO criterion. The study confirmed that DO concentrations in approximately 70 % of the minimally disturbed streams and 52 % of the minimally disturbed lakes sampled during the study do not relate well to the previous criterion of 5 milligrams per liter (mg/L) (with

Final 2016 Progress Report for the Manatee River Basin Management Action Plan (BMAP), January 2017
Page 17 of 31
10 % or more of the measurements falling below the criterion naturally). This threshold triggered the development of TMDLs for Rattlesnake Slough and Nonsense Creek.
After evaluating data from the DO study, DEP determined the minimum DO levels that fully protect healthy, well-balanced aquatic communities using information from unimpacted waterways in different regions of the state. DEP derived the revised freshwater DO criterion using the relationship between the daily average DO condition (percent saturation of DO) and a measure of stream aquatic life health, the Stream Condition Index (SCI). DEP determined the DO saturation required to achieve healthy biological conditions must have an average SCI score of 40 (healthy) at the 90th percentile confidence interval.
DEP selected DO percent saturation rather than concentration for two reasons: (1) the daily average DO saturation provided the best correlation with SCI scores; and (2) saturation automatically accounts for the inherent relationship between temperature and DO. DEP developed different regional criteria to account for the observed regional differences in measured DO levels and biological expectations, and used the confidence interval to add a protective safety factor accounting for the uncertainty in the relationships and the naturally expected diel fluctuations in DO levels. Additional information is available online on the DO criterion change and related studies.
During the recent Cycle 3 (January 1, 2007–June 30, 2014) assessment of the Manatee River Basin, Rattlesnake Slough and Nonsense Creek, which have TMDLs for nutrients, were determined to be unimpaired by DO in accordance with the new criterion.
3.4.2 DO Saturation, TN, and TP Trend Analysis Two forms of nonparametric trend analyses were conducted to assess changes of parameter values over time or between periods: (1) monotonic analyses (i.e., a gradual change over time consistent in a direction); and (2) step trend analyses (i.e., an abrupt shift at a specific point in time). Data are not required to conform to a particular distribution for nonparametric analyses. Nonparametric tests are also robust against outliers and large data gaps.
Trend analyses can be used to document the water quality response to implement specific or widespread management actions such as BMP projects (step trend). Furthermore, trend analyses can be used to evaluate how water quality has changed over a long-term period of record (POR) and answer questions such as “have nutrient concentrations or loads increased, decreased, or remained the same since a TMDL or BMAP was adopted?” (monotonic trend).
The intent of conducting trend analyses is to determine if water quality conditions have improved or degraded while the BMAP is in place. If trends show that conditions may begin to degrade, then DEP will initiate discussions with affected stakeholders to reverse the degradation. Trend analyses were conducted on water quality monitoring data to determine if DO saturation, TN, or TP values have changed throughout the selected POR for stations in the Manatee River Basin with appropriate data sufficiency.

Final 2016 Progress Report for the Manatee River Basin Management Action Plan (BMAP), January 2017
Page 18 of 31
The requirements for data sufficiency included an evaluation of the number of observations per year and the length of the record. Stations with less than quarterly data collection frequency were not used for trend analyses. Stations and associated data that did not meet the data sufficiency requirements at this time will be re-evaluated and may be included in future analysis efforts if data are uploaded to STORET and meet the minimum data requirements. Additional detailed documentation of the data processing and analysis methods can be acquired by contacting DEP.
The Seasonal Mann-Kendall test was used to identify monotonic trends in a statistically rigorous way for monthly and quarterly data (as described in Helsel, D.R., and R.M. Hirsch, 2002, Statistical methods in water resources, U.S. Geological Survey [USGS], as referenced in Rule 62-302.533, F.A.C.). For the Seasonal Mann-Kendall test, data from January 1, 2008, to June 30, 2016, were used as the POR. Data were collected monthly, and thus months of the year were used as seasons for the Seasonal Mann-Kendall test. The Mann-Kendall test was also used to identify monotonic trends for data aggregated into annual geometric means (AGMs) on a WBID scale.
Table E-1 and Table E-2 in Appendix E provide the results of the Seasonal Mann-Kendall test and Mann-Kendall tests on AGMs, respectively. Data plots associated with these tables can be acquired upon request from DEP. The Seasonal Mann-Kendall results showed several significant trends for TN, TP, and DO. For both stations, TN and TP declined, and DO increased over the POR, indicating an improvement in water quality conditions for both WBIDs (Rattlesnake Slough and Nonsense Creek). Data were only available from 2001 to 2008 for biochemical oxygen demand (BOD), outside the current assessment period. BOD showed no significant trend for either station or WBID for the POR that was available.
The Mann-Kendall tests on AGMs with data aggregated by WBID showed a significant increase in DO for Nonsense Creek, suggesting that water quality conditions are improving for this WBID. The time series data for Rattlesnake Slough did not show any significant change over the POR for TN, TP, or DO. No trend indicates that water quality conditions have not degraded—although since the Seasonal Mann-Kendall results showed water quality improvements for Rattlesnake Slough, then it is possible that seasonality may be dampening the signal and strength of the AGM trend results.
Step trend analysis can be used to evaluate the effects on water quality when the data can be divided into two logical groups such as the periods before and after a TMDL was implemented. For the Manatee River Basin, the Mann-Whitney statistical test was used for step trend analysis to test whether significant differences were found before and after the TMDL was implemented for the following two PORs:
• Period 1: TMDL Data Period January 1, 2001–June 30, 2008.
• Period 2: Post-TMDL Data Period July 1, 2008–June 30, 2016.

Final 2016 Progress Report for the Manatee River Basin Management Action Plan (BMAP), January 2017
Page 19 of 31
Table E-3 in Appendix E provides the results for the step trend analysis (data plots associated with the appendix table can be acquired upon request from DEP). Water quality conditions have improved in Rattlesnake Slough, with a significant increase in DO and decline in TN since the TMDL data period. Nonsense Creek also showed an increase in DO, indicating an improvement in water quality since the TMDL data period. No difference between the two periods was found for TP in Rattlesnake Slough or for TN in Nonsense Creek, indicating that water quality conditions have remained the same and have not degraded since the TMDL was implemented.

Final 2016 Progress Report for the Manatee River Basin Management Action Plan (BMAP), January 2017
Page 20 of 31
Appendices
Appendix A: Important Links The following lists the complete addresses for websites in this document, in the order in which they appear in the text:
• Cover page: DEP website – http://www.dep.state.fl.us/mainpage/default.htm
• Acknowledgments: Anita Nash email address – [email protected]
• Section 1: Manatee River BMAP and annual reports – http://www.dep.state.fl.us/water/watersheds/bmap.htm
• Section 1: Manatee River Basin TMDLs – http://www.dep.state.fl.us/water/tmdl/index.htm
• Section 3: Ken Weaver email address – [email protected]
• Section 3: STORET public access database – http://prodenv.dep.state.fl.us/DearSpa/public/welcome
• Section 3: Technical support document: Derivation of dissolved oxygen criteria to protect aquatic life in Florida’s fresh and marine waters – http://www.dep.state.fl.us/water/wqssp/docs/tsd-do-criteria-aquatic-life.pdf
• Appendix C: Florida Department of Health website: http://floridahealth.gov/flwmi
• Appendix C, Figure C-1: U.S. Environmental Protection Agency (EPA) publication, A homeowner's guide to septic systems: https://www3.epa.gov/npdes/pubs/homeowner_guide_long.pdf
Final 2016 Progress Report for the Manatee River Basin Management Action Plan (BMAP), January 2017
Page 21 of 31
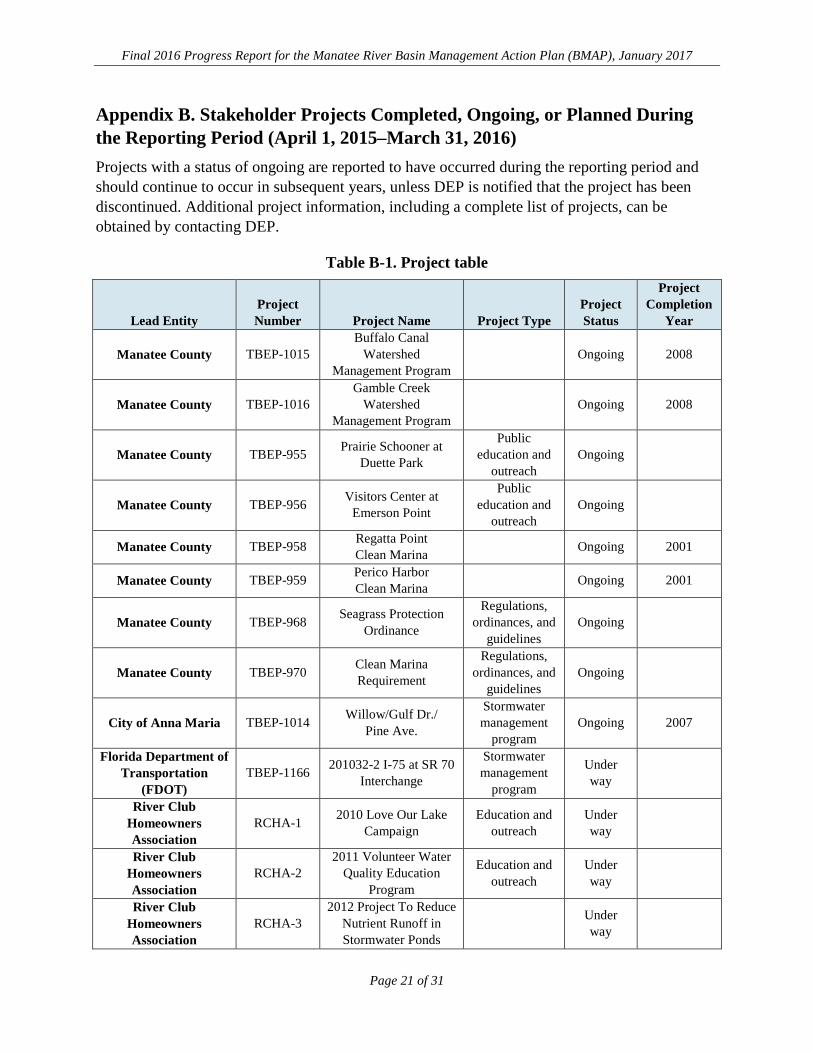
Appendix B. Stakeholder Projects Completed, Ongoing, or Planned During the Reporting Period (April 1, 2015–March 31, 2016) Projects with a status of ongoing are reported to have occurred during the reporting period and should continue to occur in subsequent years, unless DEP is notified that the project has been discontinued. Additional project information, including a complete list of projects, can be obtained by contacting DEP.
Table B-1. Project table
Lead Entity Project Number Project Name Project Type
Project Status
Project Completion
Year
Manatee County TBEP-1015 Buffalo Canal
Watershed Management Program
Ongoing 2008
Manatee County TBEP-1016 Gamble Creek
Watershed Management Program
Ongoing 2008
Manatee County TBEP-955 Prairie Schooner at Duette Park
Public education and
outreach Ongoing
Manatee County TBEP-956 Visitors Center at Emerson Point
Public education and
outreach Ongoing
Manatee County TBEP-958 Regatta Point Clean Marina Ongoing 2001
Manatee County TBEP-959 Perico Harbor Clean Marina Ongoing 2001
Manatee County TBEP-968 Seagrass Protection Ordinance
Regulations, ordinances, and
guidelines Ongoing
Manatee County TBEP-970 Clean Marina Requirement
Regulations, ordinances, and
guidelines Ongoing
City of Anna Maria TBEP-1014 Willow/Gulf Dr./ Pine Ave.
Stormwater management
program Ongoing 2007
Florida Department of Transportation
(FDOT) TBEP-1166 201032-2 I-75 at SR 70
Interchange
Stormwater management
program
Under way
River Club Homeowners Association
RCHA-1 2010 Love Our Lake Campaign
Education and outreach
Under way
River Club Homeowners Association
RCHA-2 2011 Volunteer Water
Quality Education Program
Education and outreach
Under way
River Club Homeowners Association
RCHA-3 2012 Project To Reduce
Nutrient Runoff in Stormwater Ponds
Under way

Final 2016 Progress Report for the Manatee River Basin Management Action Plan (BMAP), January 2017
Page 22 of 31
Lead Entity Project Number Project Name Project Type
Project Status
Project Completion
Year River Club
Homeowners Association
RCHA-4 Additional Projects Under way
Schroeder-Manatee Ranch SMR-1 Water Quality
Monitoring
Special studies, planning,
monitoring and assessment
Under way
Schroeder-Manatee Ranch SMR-2
Agricultural BMPs (Citrus, Cow/Calf,
Container Nurseries, Sod)
Agriculture BMPs
Under way
FDACS TBEP-1194 BMP Enrollment Agriculture BMPs
Under way

Final 2016 Progress Report for the Manatee River Basin Management Action Plan (BMAP), January 2017
Page 23 of 31
Appendix C. Manatee River BMAP Onsite Sewage Treatment and Disposal Systems (OSTDS) Data Summary Nonpoint source pollutants from OSTDS can have significant impacts on surface water and groundwater quality. Approximately 30 % of Florida’s population uses an OSTDS as their method of wastewater disposal. In Florida, OSTDS are regulated by FDOH and cover wastewater from establishments that generate domestic sewage up to 10,000 gallons per day, or commercial strength sewage waste up to 5,000 gallons per day. A typical OSTDS consists of a septic tank and drainfield (Figure C-1).
In the Manatee River BMAP there are an estimated 12,545 built parcels (Figure C-2 and Table C-1). Of those built parcels, about 6.7 % (842) are connected to an OSTDS, 89.5 % (11,228) are connected to a DEP-regulated wastewater treatment facility, and 3.8 % (475) are unknown. Of those parcels with OSTDS, 169 are known and 673 are likely to exist.
The known and likely data qualifiers were assigned based on factors related to the level of certainty for the source information. The information used comes from the FDOH Florida Water Management Inventory (FLWMI), which is a centralized geographic data map linking each built property in the state with a drinking water source (public water or private domestic well) and wastewater treatment method (central sewer or onsite septic). More information on this data source can be found online.
Further analysis was done by linking the data points with the FDOH Environmental Health Database (EHD). EHD is a statewide web-based permitting database that FDOH uses to keep track of Environmental Health Program information (permits issued, facilities regulated, etc.) EHD has electronic permitting and inspection data for onsite wastewater treatment systems covering a period from the mid-1990s onward. Information on the system installation date and type of system installed can be extracted and linked to the FLWMI map.
Table C-2 shows the proportion of permitted OSTDS that were constructed prior to or after 1983. Construction and use standards for OSTDS in Florida began in 1921. A major revision to the standards occurred in 1982, when a separation of 24 inches was required between the bottom of a newly constructed drainfield and the estimated seasonal high groundwater table. Research in Florida and elsewhere has shown that OSTDS installed to the 1982 standards effectively reduce the concentration of pathogens found in normal wastewater and that nitrogen levels are reduced as well. Knowing how many OSTDS were installed prior to this rule, and where they are located, could provide information to assist with future BMAP efforts.
Table C-2 also shows information on the estimated age of systems. This information was assigned to each parcel based on EHD data or from the Florida Department of Revenue for the year the structure was built if EHD data were not available. The average age of all OSTDS in the Manatee River BMAP area is 12 years, with those that are known having an average age of 9 years and those that are likely having an average age of 16 years.

Final 2016 Progress Report for the Manatee River Basin Management Action Plan (BMAP), January 2017
Page 24 of 31
Table C-3 breaks out EHD information from 2011 through 2016 on the permit types such as new construction, system in need of repair, evaluated existing, or abandoned system. This information may be useful to see any trends in new construction and system failures over time. The red points in Figure C-2 indicate the total number of repairs that were permitted between 2011 and 2016 in the BMAP area.
Figure C-1. Illustration of a typical OSTDS Source: EPA: A Homeowner’s Guide to Septic Systems

Final 2016 Progress Report for the Manatee River Basin Management Action Plan (BMAP), January 2017
Page 25 of 31
Figure C-2. Wastewater disposal method for parcels within the Manatee River BMAP area as of March 3, 2017

Final 2016 Progress Report for the Manatee River Basin Management Action Plan (BMAP), January 2017
Page 26 of 31
Table C-1. Summary of number of parcels using different wastewater methods by WBID Note: "Known" is assigned to parcels where the wastewater is confirmed from the permitting agency, "Likely" is assigned to parcels where there is some indication of the wastewater disposal method, "Undetermined" is assigned if two different data sources have equal opposing values, "Unknown" is assigned for built parcels with no intersecting source information, and "Not Built" is assigned to parcels with no structure that could generate wastewater.
WBIDs Known Septic
Likely Septic
Total Septic
Known Sewer
Likely Sewer
Total Sewer Undetermined Unknown Not Built Total
1913 11 61 72 903 25 928 0 41 96 1,137 1914 136 463 599 4,793 21 4,814 0 228 738 6,379 1923 22 128 150 4,076 9 4,085 0 135 296 4,666 1926 0 21 21 1,382 19 1,401 0 71 163 1,656 Total 169 673 842 11,154 74 11,228 0 475 1,293 13,838
Table C-2. Percent of OSTDS constructed before or after 1983 and average age of OSTDS from January 2017 by WBID N/A = Because there were no known OSTDS located in WBID 1926, the average age for known septic could not be calculated for this WBID.
WBID
Number of OSTDS Constructed Before 1983
(%)
Number of OSTDS Constructed after 1983
(%) Age of Known Septic
(Year) Age of Likely Septic
(Year) 1913 0.0 100.0 8.0 15.3 1914 0.2 99.8 10.1 14.6 1923 11.1 88.9 7.6 17.4 1926 0.0 100.0 N/A 14.5
Average 2.8 97.2 8.6 15.5

Final 2016 Progress Report for the Manatee River Basin Management Action Plan (BMAP), January 2017
Page 27 of 31
Table C-3. New, repair, existing, and abandonment construction permits by year Note: The number of systems permits for new OSTDS, repair OSTDS, OSTDS existing, abandoned OSTDS, and total with permits were obtained from EHD, which stores permit dates. The total number of parcels with OSTDS in the WBID shown in the last column were obtained from FLWMI, which indicates whether an OSTDS is present or absent on a parcel, but does not indicate the OSTDS permit date. Therefore, the values in the last column do not have associated date information, and the systems constructed each year are designated as N/A = Not applicable. The values in the rows are not intended to be summed across the columns.
WBID Year New OSTDS Repair OSTDS OSTDS Existing Abandoned OSTDS Total with Permits Total Parcels with OSTDS in WBID
1913 Subtotal 0 5 0 0 5 72 1913 2011 0 3 0 0 3 N/A 1913 2012 0 0 0 0 0 N/A 1913 2013 0 0 0 0 0 N/A 1913 2014 0 2 0 0 2 N/A 1913 2015 0 0 0 0 0 N/A 1913 2016 0 0 0 0 0 N/A 1914 Subtotal 8 42 1 0 51 599 1914 2011 0 8 1 0 9 N/A 1914 2012 0 6 0 0 6 N/A 1914 2013 1 6 0 0 7 N/A 1914 2014 4 9 0 0 13 N/A 1914 2015 2 9 0 0 11 N/A 1914 2016 1 4 0 0 5 N/A 1923 Subtotal 0 12 0 0 12 150 1923 2011 0 0 0 0 0 N/A 1923 2012 0 1 0 0 1 N/A 1923 2013 0 3 0 0 3 N/A 1923 2014 0 3 0 0 3 N/A 1923 2015 0 2 0 0 2 N/A 1923 2016 0 3 0 0 3 N/A 1926 Subtotal 0 0 0 0 0 21
Total 8 59 1 0 68 842

Final 2016 Progress Report for the Manatee River Basin Management Action Plan (BMAP), January 2017
Page 28 of 31
Appendix D. BMAP Water Quality Monitoring Stations
Table D-1. List of active BMAP monitoring stations 1 F = Freshwater; M = Marine
Waterbody Name WBID
Number Parent WBID
WBID Classification1 Monitoring Entity Station ID
Station Description
Sampling Frequency
TMDL Relevant Parameters
Rattlesnake Slough 1923 1923 IF Stream
Manatee County Environmental Management
Department 21FLMANATS1 Rattlesnake Slough Monthly
Fecal coliform, TN, TP, BOD, DO saturation
Cedar Creek 1926 1926 IF Stream
Manatee County Environmental Management
Department 21FLMANATS2 Cedar Creek Monthly Fecal coliform
Nonsense Creek 1913 1913 IF Stream
Manatee County Environmental Management
Department 21FLAMANATS7 Nonsense Creek Monthly
Fecal coliform, TN, BOD,
DO saturation
Braden River Above Ward Lake 1914 1914 IF
Stream
Manatee County Environmental Management
Department 21FLMANATABR2 Braden River
Above Ward Lake Monthly Fecal coliform
Braden River Above Ward Lake 1914 1914 IF
Stream
Manatee County Environmental Management
Department 21FLMANALL1 Braden River
Above Ward Lake Monthly Fecal coliform
Braden Above Lake Ward 1914 1914 IF
Stream
Manatee County Environmental Management
Department 21FLMANATS6 Braden River
Above Ward Lake Monthly Fecal coliform

Final 2016 Progress Report for the Manatee River Basin Management Action Plan (BMAP), January 2017
Page 29 of 31
Figure D-1. Monitoring stations for fecal coliform in the Manatee River

Final 2016 Progress Report for the Manatee River Basin Management Action Plan (BMAP), January 2017
Page 30 of 31
Appendix E. Trend Analysis Results
Table E-1. Seasonal Mann-Kendall trend analysis results (per station) Note: Boldface and highlighted P- values indicate statistical significance (p<0.05).
WBID Station Parameter POR Start POR End N (# of
Samples) Tau P-value Slope Trend Test
Interpretation 1923 TS1 TN (mg/L) 1/16/2008 8/18/2015 69 -0.22807 0.03598 -0.00010 Decreasing trend 1923 TS1 TP (mg/L) 1/16/2008 12/9/2015 83 -0.19679 0.03654 -0.00003 Decreasing trend 1923 TS1 DO (% sat.) 1/16/2008 12/9/2015 90 0.30405 0.00057 0.00695 Increasing trend 1923 TS1 BOD (mg/L) 1/23/2001 5/21/2008 76 -0.05314 0.61663 0.00000 No significant trend
WBID Station Parameter POR Start POR End N (# of
Samples) Tau P-value Slope Trend Test
Interpretation 1913 TS7 TN (mg/L) 1/16/2008 12/9/2015 64 -0.22973 0.04833 -0.00009 Decreasing trend 1913 TS7 DO (% sat.) 1/16/2008 12/9/2015 87 0.40648 0.00001 0.00916 Increasing trend 1913 TS7 BOD (mg/L) 2/20/2001 5/21/2008 76 -0.19139 0.05586 -0.00055 No significant trend
Table E-2. Mann-Kendall trend analysis on AGM results (by WBID) Note: Boldface and highlighted P-values indicate statistical significance (p<0.05).
WBID Parameter POR Start POR End N (# of
Samples) Tau P-value Slope Trend Test
Interpretation 1923 TN (mg/L) 2008 2014 7 -0.23810 0.54801 -0.01985 No significant trend 1923 TP (mg/L) 2008 2015 8 -0.50000 0.10776 -0.01115 No significant trend 1923 DO (% sat.) 2008 2015 8 0.28571 0.38648 2.39255 No significant trend
WBID Parameter POR Start POR End N (# of
Samples) Tau P-value Slope Trend Test
Interpretation 1913 TN (mg/L) 2008 2015 8 -0.21429 0.53619 -0.04560 No significant trend 1913 DO (% sat.) 2008 2015 8 0.64286 0.03545 3.99899 Increasing trend

Final 2016 Progress Report for the Manatee River Basin Management Action Plan (BMAP), January 2017
Page 31 of 31
Table E-3. Step trend analysis results (per station) Note: Boldface and highlighted P-values indicate statistical significance (p<0.05). Italicized and highlighted median values indicate statistically significantly higher median values for that particular data period. No italicized and highlighted values indicate no significant difference between the two data periods for that parameter. 1-TMDL Data Period 1: January 1, 2001–June 30, 2008. 2-Post-TMDL Data Period 2: July 1, 2008–June 30, 2016.
WBID Station Parameter 1–TMDL Data Period
Median Value 2–Post-TMDL Data
Period Median Value P-Value W
(Test Statistic) Test Interpretation 1923 TS1 DO (% Sat.) 67.32 73.32 0.00880 5919 Increase between Period 1 and Period 2 1923 TS1 TN (mg/L) 1.15 1.06 0.02710 5155 Decrease between Period 1 and Period 2 1923 TS1 TP (mg/L) 0.38 0.39 0.34530 5260 No difference between periods
WBID Station Parameter 1–TMDL Data Period
Median Value 2–Post-TMDL Data
Period Median Value P-Value W
(Test Statistic) Test Interpretation 1913 TS7 DO (% Sat.) 67.55 77.54 0.00000 6407 Increase between Period 1 and Period 2 1913 TS7 TN (mg/L) 1.01 0.97 0.55300 4676 No difference between periods