Embed Size (px)
Citation preview

OO
OCH3O
O
O
ManaginManaging g the risk the risk of of mycotoxmycotoxinsins
Damian Moore Biomin Australia Pty LtdDamian Moore Biomin Australia Pty LtdNZFMA Meeting 22.11.06

Overview
• General mycotoxin-related problems
• Mycotoxicoses
• Analysis of mycotoxins
• Strategies to counteract mycotoxins
• Occurrence of mycotoxins in Australia and New Zealand
… toxic, secondary
metabolitesof fungi
Fusaríum sp.
Aspergillus sp.
Penicillium sp.
Alternaria sp.
Claviceps sp., etc.
… produced on almost all
agriculturalcommodities
worldwide
Mycotoxins are… ?

weather conditions (temperature, humidity)
variety of graininsect manifestationcrop densityfertilization
crop maturitymoisture contentagricultural practice
moistureinsect controlpreservation
shipping conditionsprocessing
Production:
Mycotoxins – entering food chain
Harvest:
Storage:
Distribution:
Formation of mycotoxins

Penicillium sp.
Alternaria sp.
Claviceps sp., etc.
Field Situation
Fusarírr um sp.íí
Aspergillus sp.
FIELD FUNGI

Fusaríum sp.
sp
p.
Alternaria sp.
Claviceps sp., etc.
Field Situation
Aspergillus sp.
Penicillium sp.
Storage fungi

Mycotoxin-related problems
No existing safe levels!
Consequences of immune suppression:
• increased risk of infections
• severer disease processes
• more difficult therapies
• impaired vaccination response
• activation of tumour formation
• etc.
severe economic losses!Hamilton, 1984
death
clinical symptoms
metabolic disorders
immune suppression
RIS
K
MYCOTOXIN
Toxin + Interactant
Toxin

Mycotoxin-related problems
Hamilton, 1984
death
clinical symptoms
metabolic disorders
immune suppression
RIS
K
MYCOTOXIN
Toxin + Interactant
Toxin
No existing safe levels!
Consequences of immune suppression:
• increased risk of infections
• severer disease processes
• more difficult therapies
• impaired vaccination response
• activation of tumour formation
• etc.
severe economic losses!

Mycotoxin-related problems
• Great variety of possible symptoms
Difficult diagnosis!
Mycotoxin-related problems
• Great variety of possible symptoms
• Mycotoxicoses can occur at toxin concentrations below detection limit
Difficult diagnosis!

Mycotoxin-related problems
• Great variety of possible symptoms
• Mycotoxicoses can occur at toxin concentrations below detection limit
• Masked mycotoxins
Difficult diagnosis!
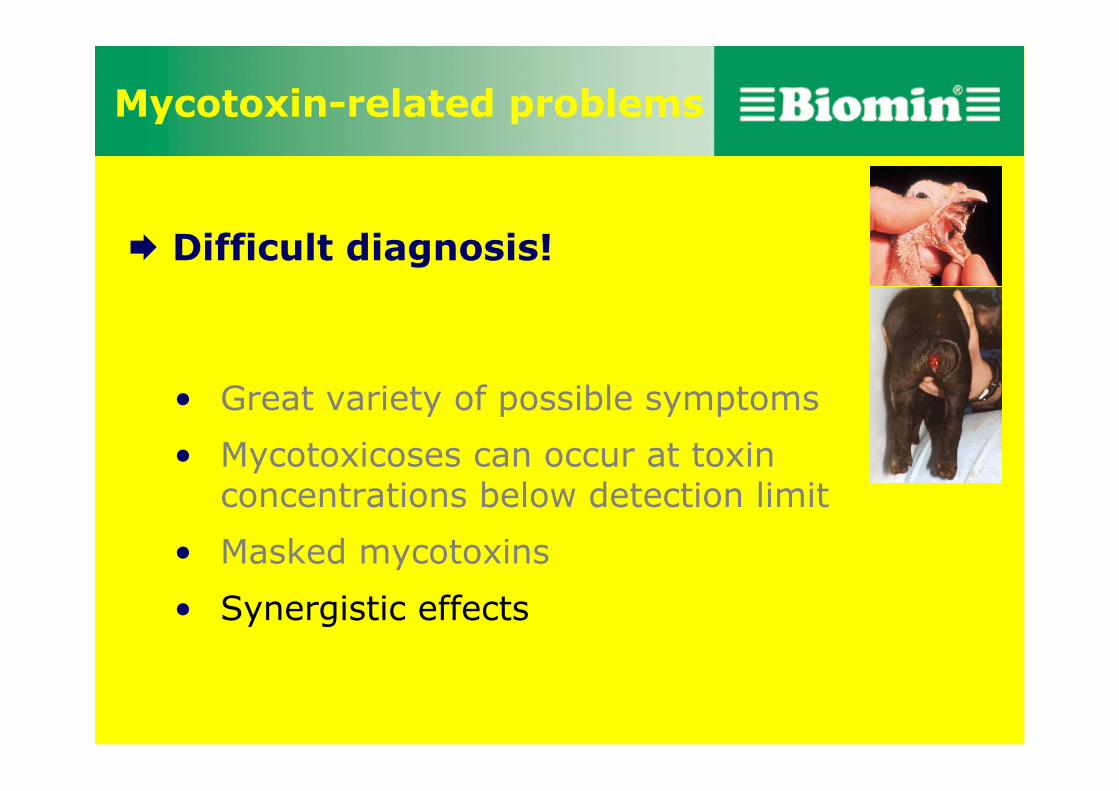
Mycotoxin-related problems
• Great variety of possible symptoms
• Mycotoxicoses can occur at toxin concentrations below detection limit
• Masked mycotoxins
• Synergistic effects
Difficult diagnosis!
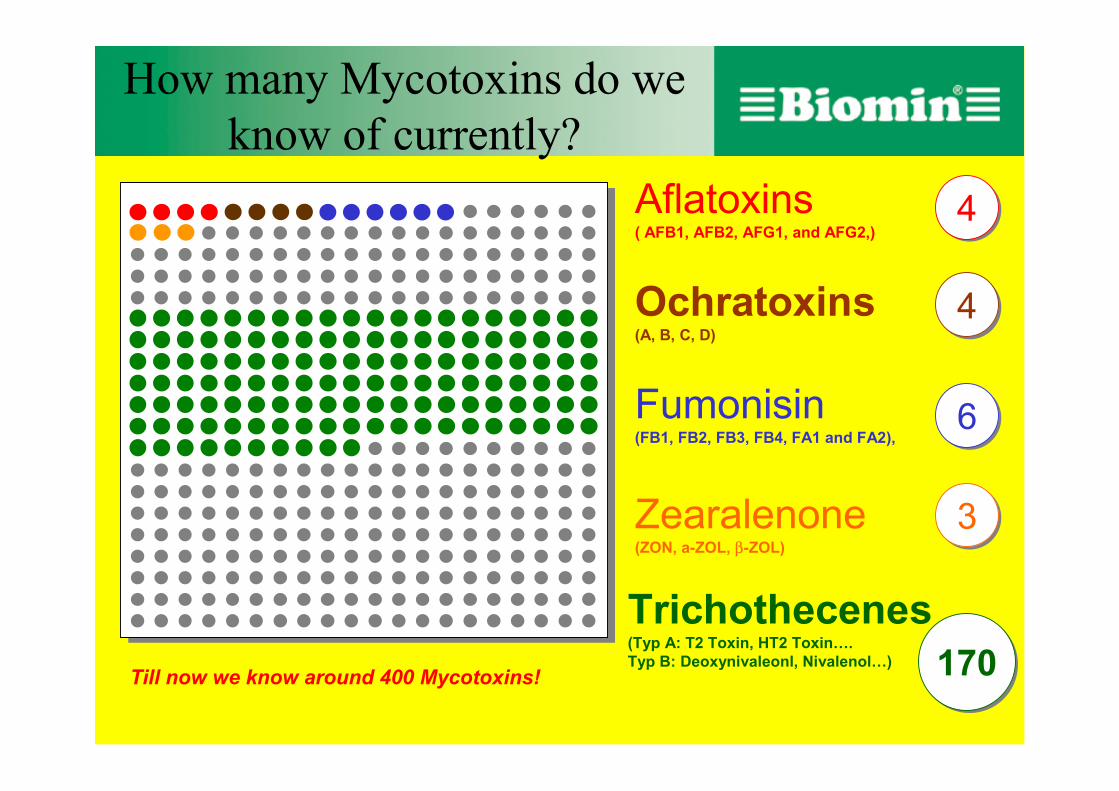
170
Aflatoxins( AFB1, AFB2, AFG1, and AFG2,)
Ochratoxins (A, B, C, D)
Fumonisin(FB1, FB2, FB3, FB4, FA1 and FA2),
Zearalenone(ZON, a-ZOL, β-ZOL)
Trichothecenes(Typ A: T2 Toxin, HT2 Toxin….Typ B: Deoxynivaleonl, Nivalenol…)
Till now we know around 400 Mycotoxins!
4
6
3
4
How many Mycotoxins do we know of currently?
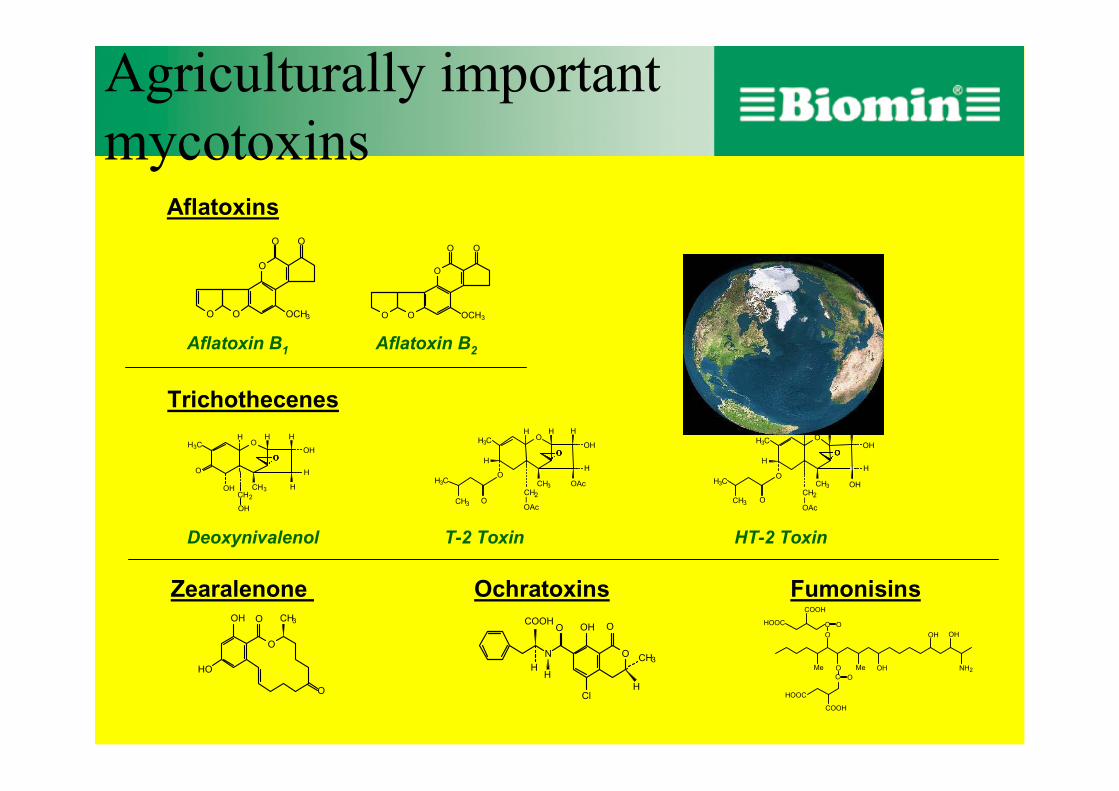
Agriculturally important mycotoxins
OO
OCH3O
O
O O O
O
OCH3
O O
O
H
O
CH3
O
OHHH
O
O
OH
OH
H
H3C
CH2
OH
CMe
O
O Me OH
OH OH
NH2
C O
COOH
HOOC
O
COOH
HOOC
O
CH2
OHH3C
CH3
H
HHH
H
O
OCH3 IOAc
OAc
O
OOO
H3C
OAcICH3 O
O
H
H H H
H
CH3
H3C OH
CH2
OH
O
OOOO
H3C
OH O
H
HH
COOH
Cl
O
CH3N O
O
O
OH
HO
O CH3
Aflatoxin B1 Aflatoxin B2
Zearalenone Ochratoxins Fumonisins
Deoxynivalenol T-2 Toxin HT-2 Toxin
Aflatoxins
Trichothecenes

OO
OCH3O
O
O
AFB1
Aflatoxins

Aflatoxins are hepatotoxins!
National Animal Disease Center,Ames, USA
Aflatoxins
LIVER
TARGET ORGAN
Pale liver syndrome
Aspergillosis-pneumonia
OO
OCH3O
O
O
Aspergillus flavus, Asp. parasiticus

Nervous syndrome
AflatoxicosisAcute symptoms
• nervous syndrome
• pale bird syndrome
• fatty liver syndrome
• haemorrhages
Aflatoxins-Poultry

Aflatoxicosis
Chronic symptoms• immune suppression
• impaired feathering
• inhomogeneous flocks
• reduced performance parameters (weight gain, feed efficiency, egg production, egg weight/size)
• delayed sexual maturation
• lowered semen volume
• mild anaemia in males
• decline of hatchability-embryonic deaths
Aflatoxins-Poultry
Residues• liver

Aflatoxins
Aflatoxicosisacute symptoms
o fatty liver syndrome
o haemorrhages
o nervous syndrome
o pale bird syndrome
OO
OCH3O
O
O
Aflatoxicosischronic symptoms
o immune suppression
o impaired feathering
o inhomogeneous flocks
o reduced weight gain
o reduced feed efficiency
o reduced egg production
o reduced egg weight/size
o lowered semen volume
o mild anaemia in males
o decline of hatchability-embryonic deaths
o delayed maturation
Aflatoxicosis
Immune suppression
• lowers body temperature-> no fever response possible
• reduced antibody production
Increased susceptibility to a variety of agentssalmonellosis, candidiasis, coccidiosis, Marek´s disease

Cattle
Acute symptomso increased liver weight
o increased kidney weight
Chronic symptomso immune suppression
o decreased performance
o reduced milk production
o carcinogenic effects
Residueso milk (AFM1)
Swine
Acute symptoms• liver damage
• haemorrhages
Chronic symptoms• immune suppression
• decreased performance
• carcinogenic effects
Residues• liver
• milk (AFM1)
Aflatoxins - Swine/Cattle

Aflatoxin M1
• Carry Over of Aflatoxin from Feed to Milk
H. Petersen, Univ. of Agricult. Sciences, Sweden
Average Carry Over:
2 %

AFB1, AFB2
AFG1, AFG2
toxins
Electron micrographs of A. flavus
OO
OCH3O
O
O
AFB1
metabolites of AFB1 and AFB2:AFM1, AFM2
0.3-6.2% of AFB1 in feed is transformed; Carcinogenicity one
magnitude lower
Milk containing AFM1 at 0.05ppb requires an average intake of AFB1 by dairy cows of 40µg/day with 12kg feed consumption content of AFB1 in feed 3.4ppb
Milk containing AFM1 at 0.05ppb requires an average intake of AFB1 by dairy cows of 40µg/day with 12kg feed consumption content of AFB1 in feed 3.4ppb
Aflatoxins

OH O
H
HH
COOH
Cl
O
CH3N O
OTA
Ochratoxins

Inflammation of kidney and bladder, caused by OTA
target organs
Dr. Roxas, Manila, Phillipines
Ochratoxins are nephrotoxins!
KIDNEY, LIVER, BLADDER
Ochratoxins
Humans: Balkan endemic nephropathy (renal tumors)

toxins Ochratoxin A (B, C, D)
OTA
OH O
H
HH
COOH
Cl
O
CH3N O
Contamination of food occurs mainly in Europe(estimated mean intake 45ng/kg bw per week)
Ochratoxins

O
H
O
CH 3
O
OHHH
O
O
OH
OH
H
H 3C
CH 2
OH DON
Trichothecenes
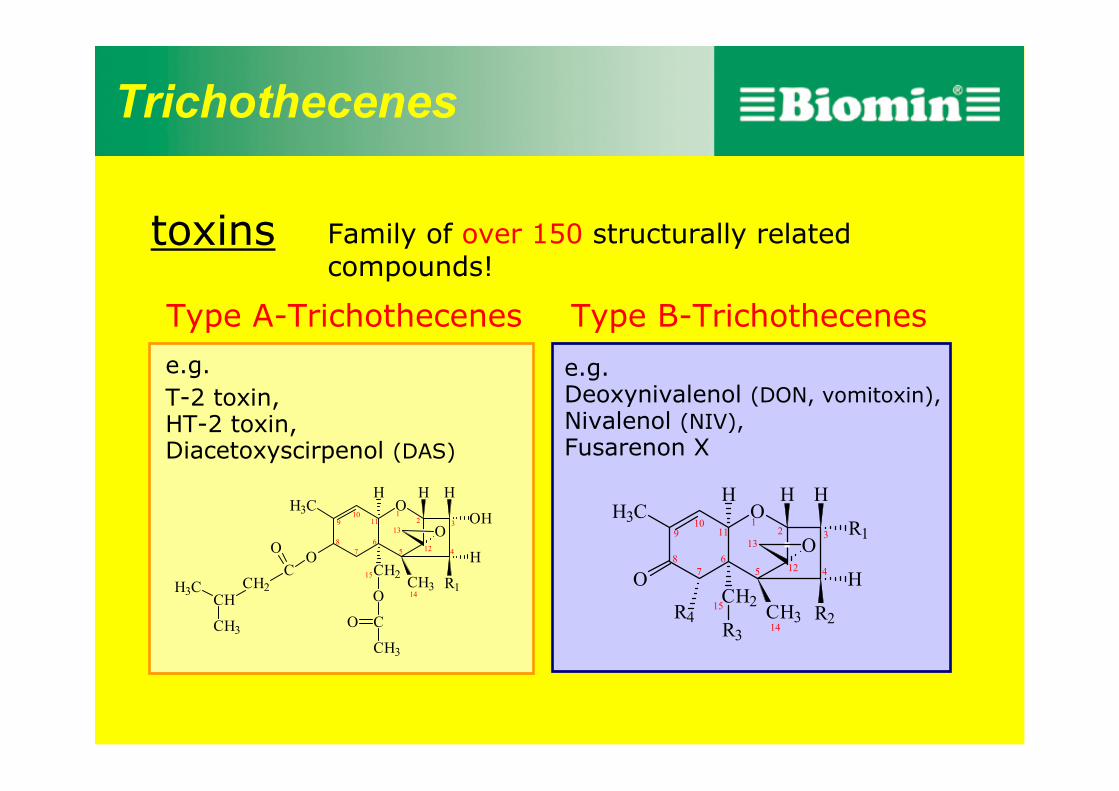
toxins Family of over 150 structurally related compounds!
e.g. Deoxynivalenol (DON, vomitoxin),Nivalenol (NIV),Fusarenon X
2
5 12
13
O
O
H3C
H
R1
H
R2
H
CH3CH2
R4
H
R3
O11
109
87
64
31
14
15
Type A-Trichothecenes Type B-Trichothecenes
2
5 12
13
O
O
H3C
H
OH
H
R1
H
CH3CH2
H
O
O
CO
CH3
C
O
CH2CH
CH3
H3C
1110
9
87
64
31
15
14
e.g.T-2 toxin,HT-2 toxin,Diacetoxyscirpenol (DAS)
Trichothecenes

Trichothecenes-Poultry
Chronic symptomso immune suppression
o inhomogeneous flocks
o impaired feathering
o neural disorders
ohaematological disorders
o rickets
o atrophy of ovaries
o reduced performance (weight gain, FCR, egg production, egg shell)
Acute symptoms• oral and dermal lesions
• gizzard lesions
• digestive disorders (diarrhea)
• feed refusal
• haemorrhages
Fusarium

Trichothecenes-Poultry
Chronic symptomso immune suppression
o inhomogeneous flocks
o impaired feathering
o neural disorders
o haematological disorders
o rickets
o atrophy of ovaries
o reduced performance (weight gain, FCR, egg production, egg shell)

O
CH2
OHH3C
CH3
H
HHH
H
O
OCH3 IOAc
OAc
O
OOO
H3CTrichothecenes
Immune suppression
• impairs immune response
• interfere with antibody production
• necrosis and depletion of lymphoid tissue
• Immunosuppression may precede tumor growth
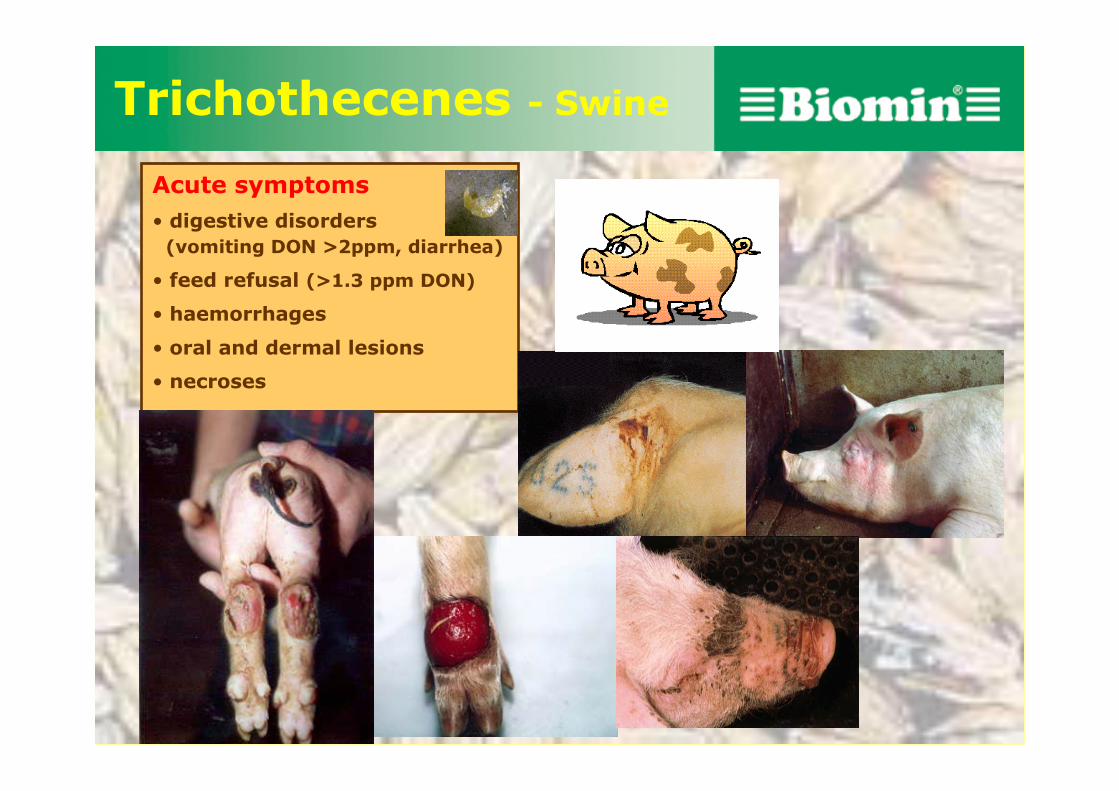
Trichothecenes - Swine
Acute symptoms• digestive disorders
(vomiting DON >2ppm, diarrhea)
• feed refusal (>1.3 ppm DON)
• haemorrhages
• oral and dermal lesions
• necroses

Trichothecenes - swine
Chronic symptoms• immune suppression
• haematological disorders
• decreased performance
• conjunctivitis
• decreased weight gain
• impaired FCR
Acute symptomso digestive disorders
(vomiting DON>2ppm, diarrhea)
o feed refusal (>1.3 ppm DON)
o haemorrhages
o oral and dermal lesions
o necrosis
Conjunctivitis

Trichothecenes - Cattle
Acute symptoms• inflammation of mouth
• gastroenteritis/ruminitis
• haemorrhages
• restlessness
Chronic symptoms• immune suppression
• reduced milk production
• reduced feed intake
T-2 toxin

humans Acute: Alimentary toxic aleukia (SU, 30-40ties)Necrotic lesions in digestive tract
Chronic: nauseavomitinggastrointestinal upsetheadache
O
H
O
CH 3
O
OHHH
O
O
OH
OH
H
H3C
CH 2
OH
DON
Trichothecenes, especially the A-TCs are potent immunosuppressive agents
Trichothecenes

ZON O
O
OH
HO
O CH3
Zearalenone

affected feeds/foods
• maize• wheat • sorghum• barley• oats• rice
Zearalenone
Co-occurring with DON!
O
O
OH
HO
O CH3
warm and moderate climate, prolonged cool, wet seasons high moisture environments
Fusarium graminearum

Major effect
Zearalenone
i.e. it mimics the activity of the female hormone oestrogen.
(“oestrogen-like syndrome”)
ZON = endocrine disrupterRILEY 1998, modified
“Hyperestrogenism”
O
O
OH
HO
O CH3

Affected animal species:
Zearalenone
• swine!
• cattle
• poultry
• laboratory rodents
Reference:
Hagler et al. (2001). Zearalenone: Mycotoxin or mycoestrogen?Pp. 321-331. In Summerell BA, Leslie JF, Backhouse D, Bryden WL and Burgess LW (Eds.). Fusarium: Paul E. Nelson Memorial Symposium. APS Press, St. Paul, Minnesota.
Mycofix Plus!
!!!
ZON
O
O
OH
HO
O CH3
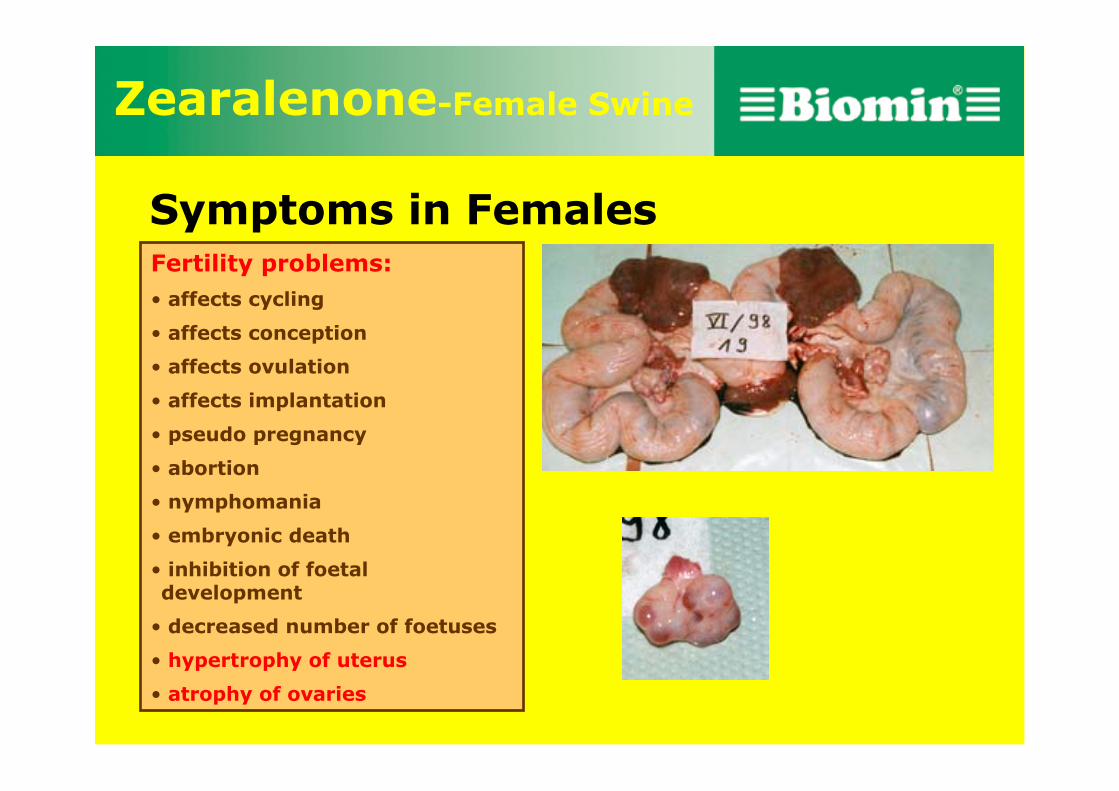
Symptoms in Females
Zearalenone-Female Swine
Fertility problems:• affects cycling
• affects conception
• affects ovulation
• affects implantation
• pseudo pregnancy
• abortion
• nymphomania
• embryonic death
• inhibition of foetal development
• decreased number of foetuses
• hypertrophy of uterus
• atrophy of ovaries

Zearalenone-Female Swine
enlargement of mammary glands
swelling and reddening of vulva
rectal and vaginal prolapse
Symptoms in Females

Zearalenone - Male Swine
Feminization
enlargement of mammary glands
impaired semen quality
testicular atrophy
swollen prepuce
Decreased spermatogenesis, caused by ZON
Symptoms in Males

Zearalenone - piglets
reddened teats
swelling and reddeningof vulva
splay legs
symptoms in piglets

cattle
Zearalenone – in …
• infertility
• decreased con-ception rates
• abortions
• teat enlargement
• udder secretions
• diarrhea
• decreased milk yield
poultry breeders
• vent enlargement• enhanced secondary sex characteristics
Reference:Mycotoxins: Risk in Plant, Animal and Human Systems (2003). Task Force Report, No. 139, Council for Agricultural Science and Technology, Ames, Iowa, USA. Pp. 75-76.

• More DA`s (displaced abomasum)
• Ketosis, fatty liver syndrome
• Retained placenta, Metritis
• Mastitis
Whitlow et al. (1986)Whitlow & Hagler (1998)Ministry of Agriculture and Food, Ontario
Postpartum Problems

Whitlow et al. (1986)
Whitlow & Hagler (1998)
Ministry of Agriculture and Food, Ontario
Cattle
CMe
O
O Me OH
OH OH
NH 2
C O
COOH
HOOC
O
COOH
HOOC
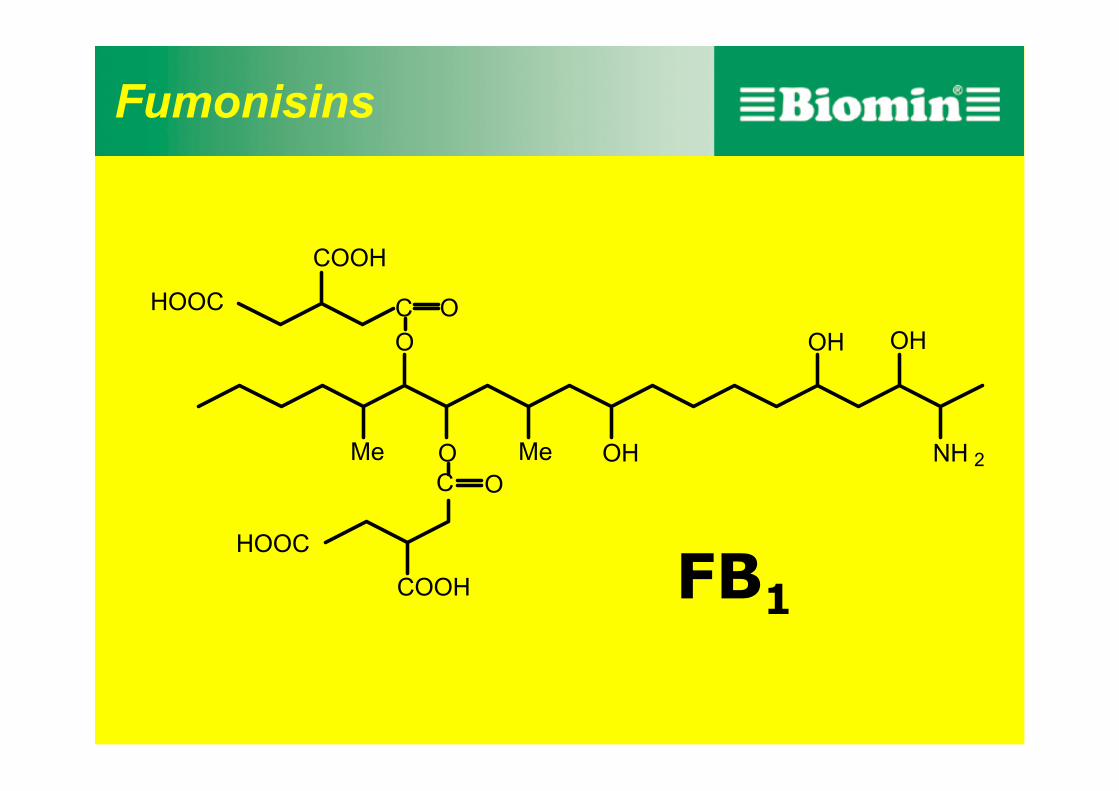
FB1
Fumonisins

pancreatic necrosis
porcine pulmonary edema (PPE)characterized by severe lung edema and hydrothorax that lead to rapid death
liver damagehematological disordersimmune suppression
equine leucoencephalomalacia (ELEM)
Acute effects
Chronic symptoms
Fumonisins

Incidence for association with cancer (oesophageal or liver)Neural tube defects
liver
kidney
In humans:
Residues
Fumonisins

Means, based on GEMS*/Food regional diets[µg/kg bw per day]
• African diet: 2.4• European-type diet: 0.2• Far Eastern diet: 0.7• Latin American diet: 1.0• Middle Eastern diet: 1.1
* WHO Global Environment Monitoring System-Food Contamination Monitoring and Assessment Programme
Estimated intake of FUMs

Ergot Alkaloids
1. The ryegrass endophyte
• Produces lolitrem B and ergot alkaloids which reducelivestock performance
• But, it improves plant performance:• - Seedling vigour• - Tillering • - Drought tolerance• /water use efficiency• - Insect resistance

Perennial Rye Grass Toxicity
• Tremors
• Heat Stress• Temperament: Nervy/flighty• Summer/autumn ill thrift• Staggers & Immobility• Scouring/dags• Lowered fertility • Death

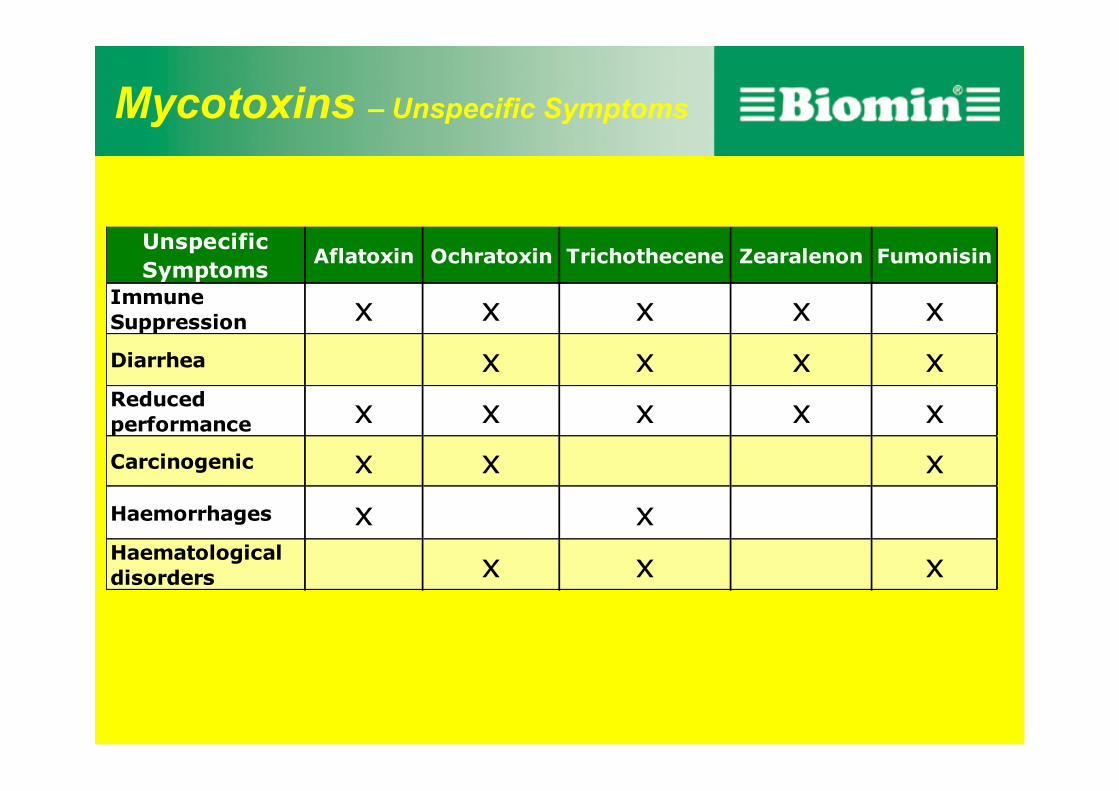
Mycotoxins – Unspecific Symptoms
Unspecific Symptoms
Aflatoxin Ochratoxin Trichothecene Zearalenon Fumonisin
Immune Suppression x x x x xDiarrhea x x x xReduced performance x x x x xCarcinogenic x x xHaemorrhages x xHaematological disorders x x x
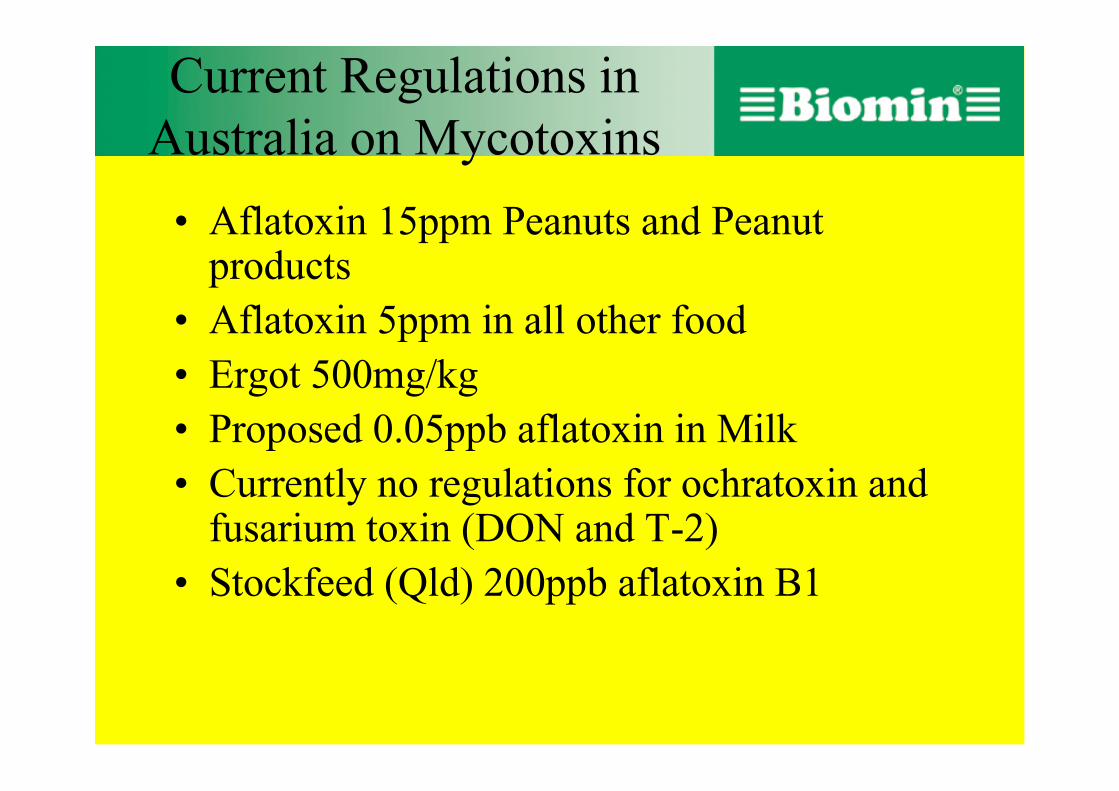
Current Regulations in Australia on Mycotoxins
• Aflatoxin 15ppm Peanuts and Peanut products
• Aflatoxin 5ppm in all other food• Ergot 500mg/kg• Proposed 0.05ppb aflatoxin in Milk• Currently no regulations for ochratoxin and
fusarium toxin (DON and T-2)• Stockfeed (Qld) 200ppb aflatoxin B1

Errors in Analytical Procedures
(Whitaker & Dicken,1974)
100% Error
LOT Sample Subsample
88% Sampling
Error
10%Subsampling
Error
Analysis
2%Analysis
Error
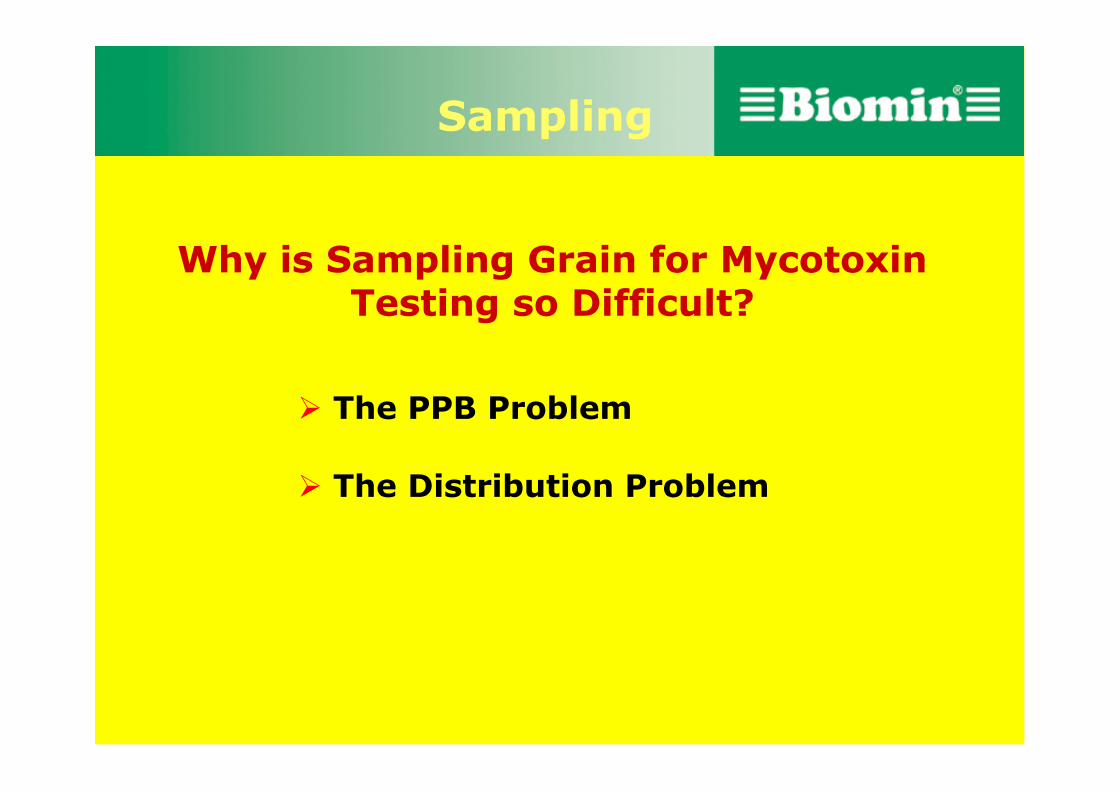
The PPB Problem
The Distribution Problem
Why is Sampling Grain for Mycotoxin Testing so Difficult?
Sampling

• 1 Part in 1,000,000,000
• 1 Second in 32 Years
• 1 Grain of Sand in 22 kg
• 1 Kernel of Corn in 3.5 Rail Cars
The ppb problem

What Is A Representative Sample?
EvenDistribution
UnevenDistribution
Protein Mycotoxins
Sampling – Distribution problem

Uneven Distribution
Corn - only 1 out of every 200 kernels were contaminated
Cottonseed - (8000 PPB) Only 18 seeds out of 150 (12%) were contaminated
Peanuts - only 5% of kernels were contaminated
Contaminated Kernels Are NOT Evenly Distributed

Example - Sampling Pattern
Probe - Sampling Pattern for Truck or Trailer Loads of Corn.
Sample all Points Marked “O” Initially. Sample all Points Marked “X” if More Grain Sample is Needed
Romer Labs’ Guide to Mycotoxins, Vol 2

results in FAPAS round 2212, DON in maize
0
1000
2000
3000
4000
5000
6000
1 3 5 7 9 11 13 15 17 19 21 23 25 27 29 31 33 35 37 39 41 43 45 47 49 51 53 55 57 59 61 63
laboratory number
µg
/kg
DO
N
Our results using using MycoSep 227 Trich+ and Biopure standard:
Assigned value, 2531.7µg/kgRomer Lab result: 2570 µg/kg, z-score 0.1
Example: Deoxynivalenol

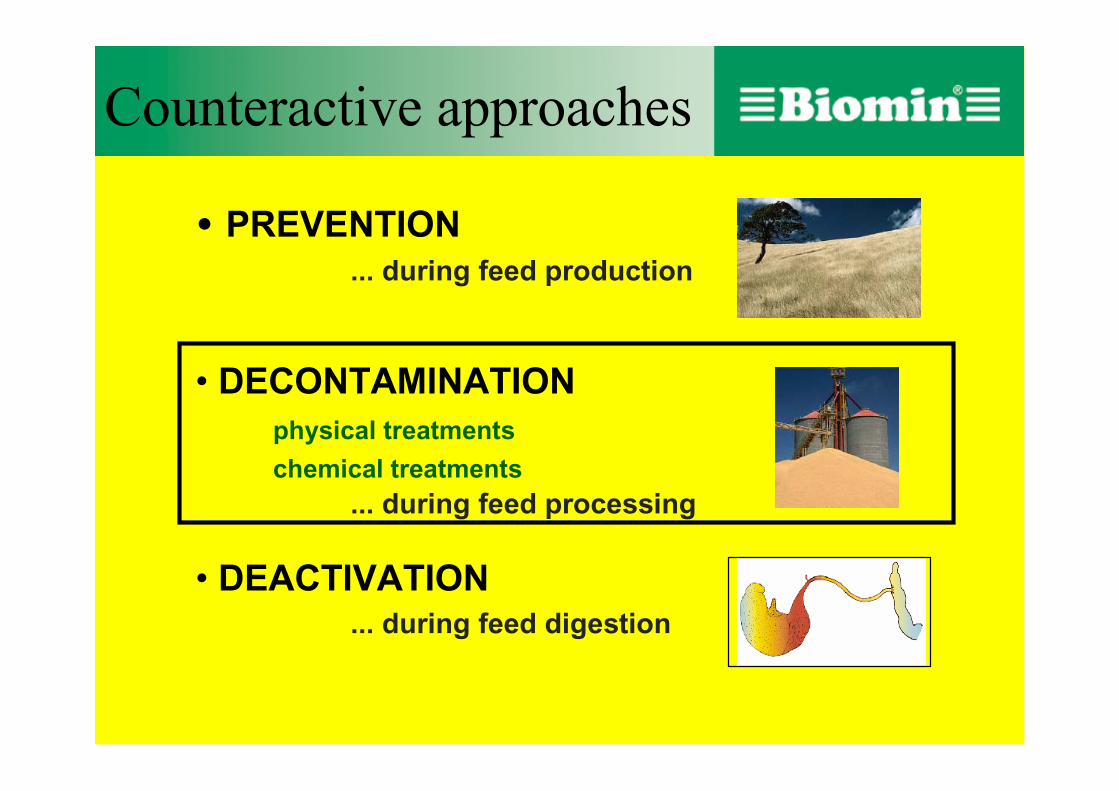
• PREVENTION... during feed production
• DECONTAMINATIONphysical treatments
chemical treatments... during feed processing
• DEACTIVATION... during feed digestion
Counteractive approaches

• PREVENTION... during feed production
• DECONTAMINATIONphysical treatments
chemical treatments... during feed processing
• DEACTIVATION... during feed digestion
Counteractive approaches

FIELD
HARVEST
STORAGE
Prevention

25 % of the annual world grain production contaminated!
Prevention reduces, but does not eliminate risk of mycotoxin-contamination!
Prevention
• PREVENTION... during feed production
• DECONTAMINATIONphysical treatments
chemical treatments... during feed processing
• DEACTIVATION... during feed digestion
Counteractive approaches

Physical treatments
• expensive
• uncertain results
• high feed losses
LIMITED PRACTICALAPPLICATION
• expensive and time consuming
• change in palatability and nutritive value
• decreased feed quality
• toxic by-products possible
NO PRACTICAL APPLICATION
Chemical treatments
Decontamination
Disadvantages

• PREVENTION... during feed production
• DECONTAMINATIONphysical treatments
chemical treatments... during feed processing
• DEACTIVATION... during feed digestion
Counteractive approaches

Agriculturally important mycotoxins
OO
OCH3O
O
O O O
O
OCH3
O O
O
H
O
CH3
O
OHHH
O
O
OH
OH
H
H3C
CH2
OH
CMe
O
O Me OH
OH OH
NH2
C O
COOH
HOOC
O
COOH
HOOC
O
CH2
OHH3C
CH3
H
HHH
H
O
OCH3 IOAc
OAc
O
OOO
H3C
OAcICH3 O
O
H
H H H
H
CH3
H3C OH
CH2
OH
O
OOOO
H3C
OH O
H
HH
COOH
Cl
O
CH3N O
O
O
OH
HO
O CH3
Aflatoxin B1 Aflatoxin B2
Zearalenone Ochratoxins Fumonisins
Deoxynivalenol T-2 Toxin HT-2 Toxin
Aflatoxins
Trichothecenes

Elimination of the toxins
Reduction of bioavailability
Adsorption
ADSORPTION
Minerals
Mycotoxin Adsorption
Aflatoxins
FumonisinsOchratoxin AZearalenone
DeoxynivalenolT2-toxinother Trichothecenes
( )( )( )
---

Product concentration = 0.2%
0
1 0
2 0
3 0
4 0
5 0
6 0
7 0
8 0
9 0
1 0 0
ben ton i te
_1b en to
n i te_19
b en ton i te
_24b en to
n i te_30
b en ton i te
_33
b en ton i te
_47b en to
n i te_10
b en ton i te
_36b en to
n i te_29
b en ton i te
_12b en to
n i te_42
z eo li te _5
z eo li te _16
z eo li te _26
z eo li te _28
d iato
mit e
_7d ia
tom
it e_18
va r iou s c
lays _
va r iou s c
lays _2
va r iou s c
lays _5
ve rmic
u l ite _4
ve rmic
u l ite _4
s a m p le c o d e
Ad
so
rpti
on
of
AF
B
p H 3
p H 6 .5
Adsorption of AFB1

0
10
20
30
40
50
60
70
80
90
100
47 48 29 41 18 51 45 46
sample code
FU
M-a
dso
rpti
on
[%
]
pH 3pH 6.5
Adsorption of FUM

Adsorption of OTA
0
10
20
30
40
50
60
70
80
90
100
47 48 29 41 18 51 49 50 45 46
sample code
OT
A-a
dso
rpti
on
[%
]
pH 6.5pH 3
Product concentration = 0.2%
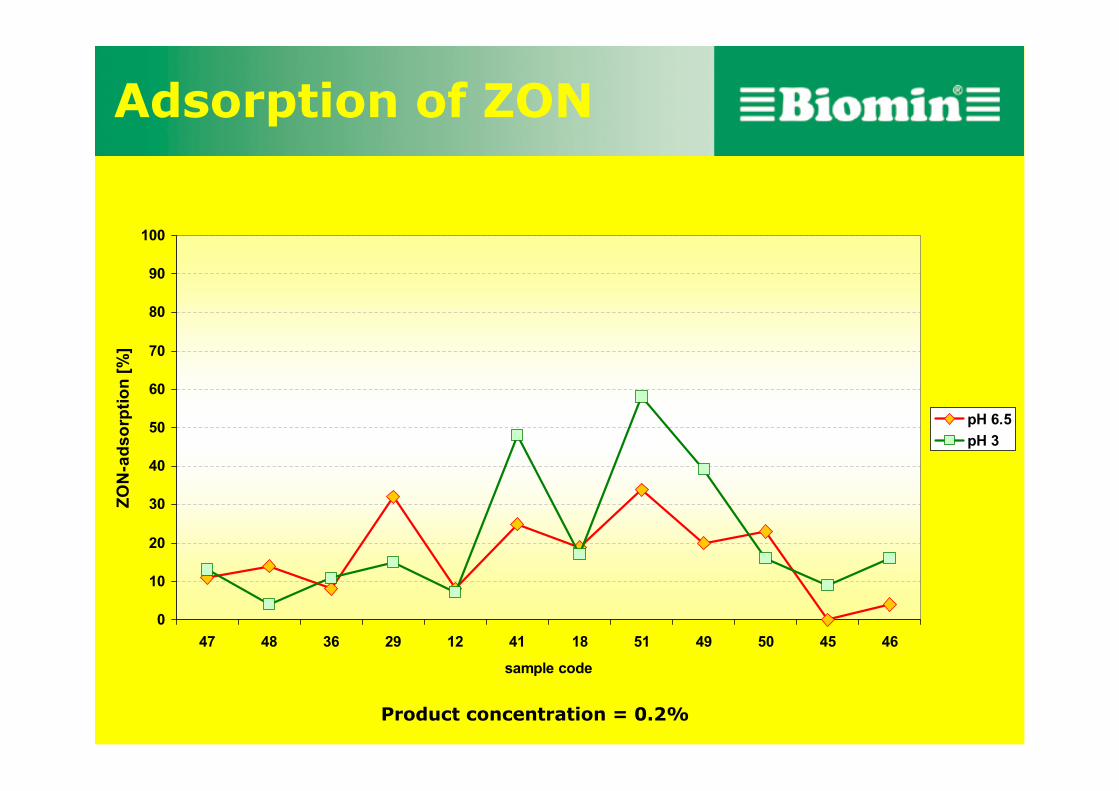
Adsorption of ZON
0
10
20
30
40
50
60
70
80
90
100
47 48 36 29 12 41 18 51 49 50 45 46
sample code
ZO
N-a
dso
rpti
on
[%
]
pH 6.5pH 3
Product concentration = 0.2%

0
10
20
30
40
50
60
70
80
90
100
A B C D
sample code
DO
N-a
dso
rpti
on
[%
]
pH 3pH 6.5
Adsorption of DON
Product concentration = 0.2%
University of Vienna, Institute of Geology
NO Adsorption of Vomitoxin (DON) and other Trichothecenes !!!
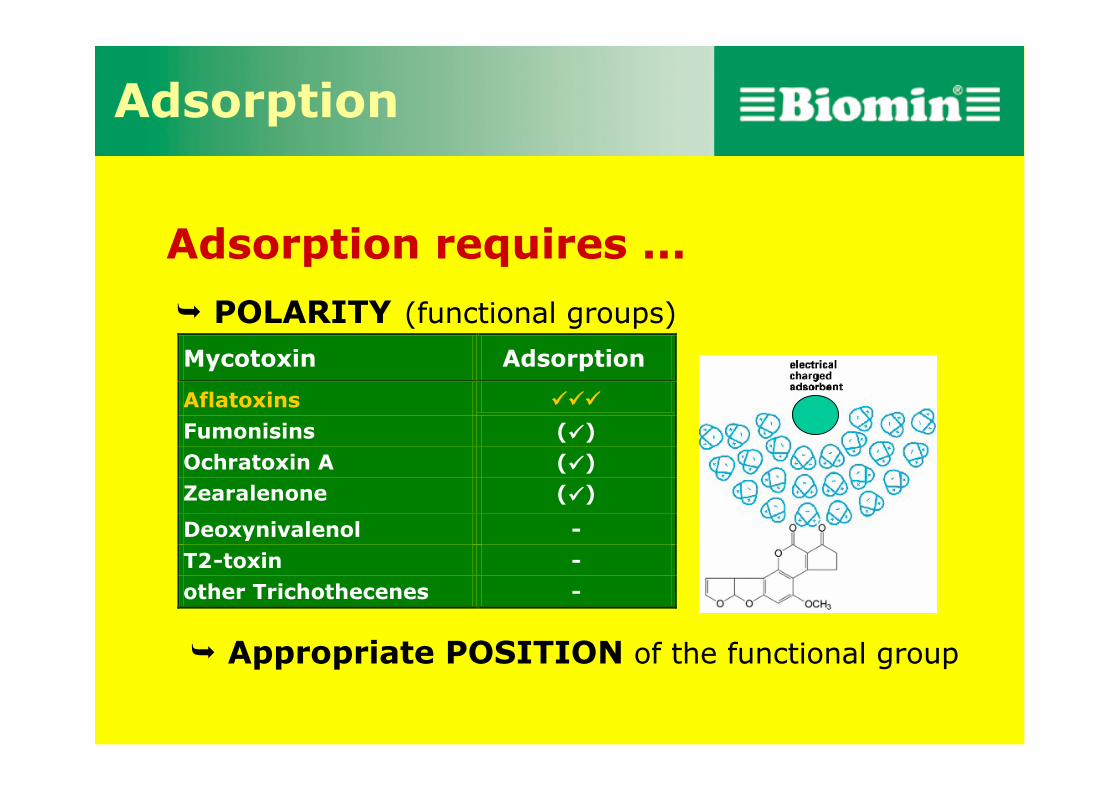
Adsorption requires ...
POLARITY (functional groups)
Appropriate POSITION of the functional group
Adsorption
Mycotoxin Adsorption
AflatoxinsFumonisins ( )Ochratoxin A ( )Zearalenone ( )
Deoxynivalenol -T2-toxin -other Trichothecenes -
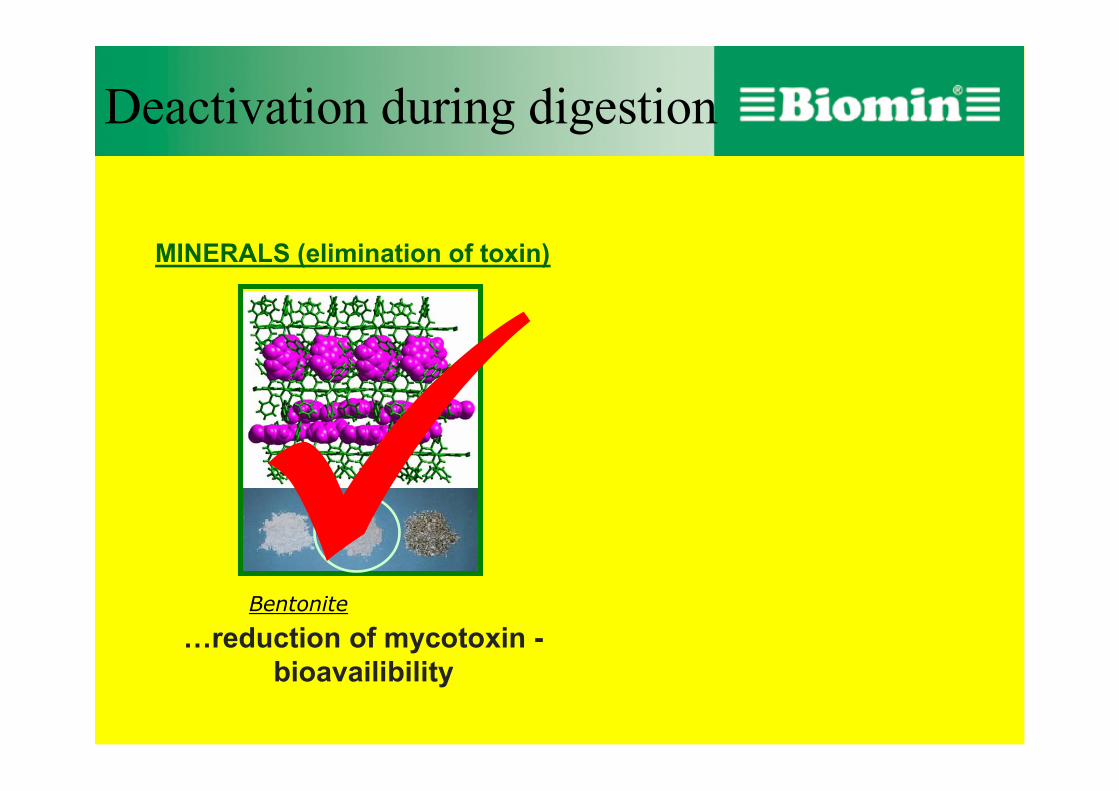
…reduction of mycotoxin -bioavailibility
MINERALS (elimination of toxin)
Bentonite
Deactivation during digestion

…reduction of mycotoxin -bioavailibility
MINERALS (elimination of toxin)
…mycotoxin detoxification prior to resorption
ENZYMES (elimination of toxicity
Bentonite Enzymes
Deactivation during digestion

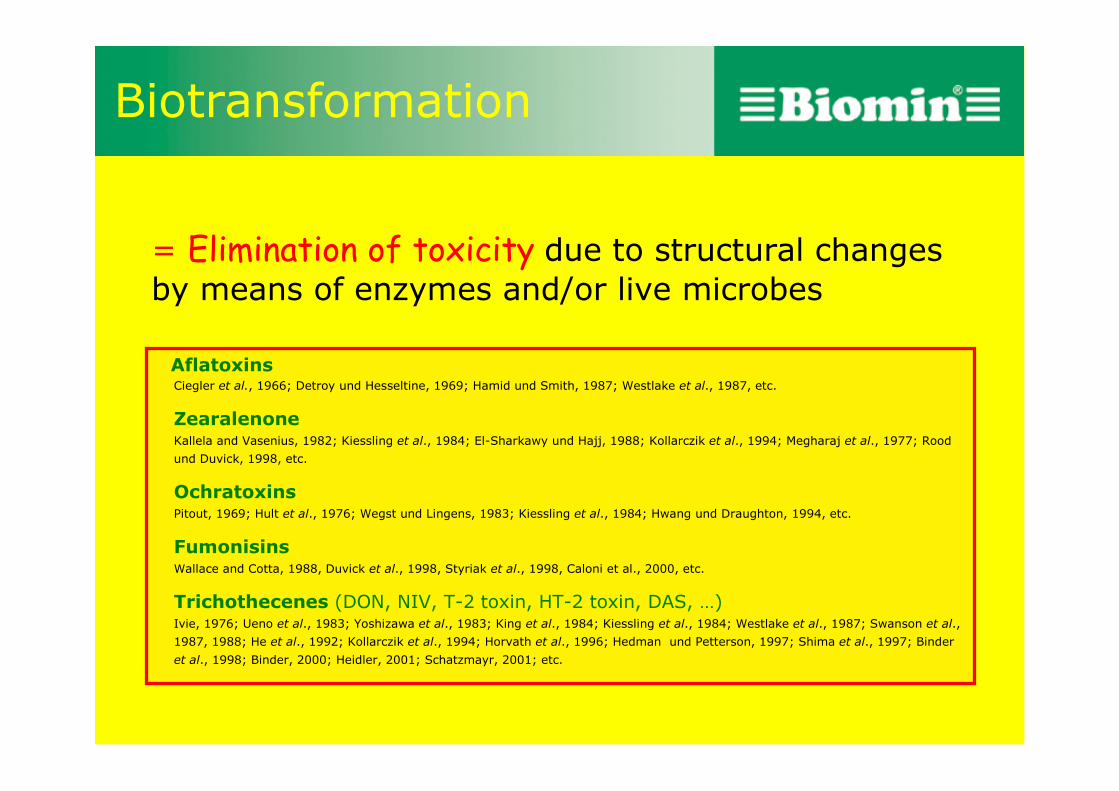
= Elimination of toxicity due to structural changes by means of enzymes and/or live microbes
Mycotoxin Non-toxic metabolite
bacteriayeasts
moulds
bacteriayeasts
moulds
Microbes
Enzymes
Biotransformation

Biotransformation
• specific
• irreversible
• no toxic by-products/residues
• efficacy not confined to adsorbable mycotoxins!
= Elimination of toxicity due to structural changes by means of enzymes and/or live microbes
Biotransformation
AflatoxinsCiegler et al., 1966; Detroy und Hesseltine, 1969; Hamid und Smith, 1987; Westlake et al., 1987, etc.
ZearalenoneKallela and Vasenius, 1982; Kiessling et al., 1984; El-Sharkawy und Hajj, 1988; Kollarczik et al., 1994; Megharaj et al., 1977; Rood
und Duvick, 1998, etc.
OchratoxinsPitout, 1969; Hult et al., 1976; Wegst und Lingens, 1983; Kiessling et al., 1984; Hwang und Draughton, 1994, etc.
FumonisinsWallace and Cotta, 1988, Duvick et al., 1998, Styriak et al., 1998, Caloni et al., 2000, etc.
Trichothecenes (DON, NIV, T-2 toxin, HT-2 toxin, DAS, …)Ivie, 1976; Ueno et al., 1983; Yoshizawa et al., 1983; King et al., 1984; Kiessling et al., 1984; Westlake et al., 1987; Swanson et al.,
1987, 1988; He et al., 1992; Kollarczik et al., 1994; Horvath et al., 1996; Hedman und Petterson, 1997; Shima et al., 1997; Binder
et al., 1998; Binder, 2000; Heidler, 2001; Schatzmayr, 2001; etc.
= Elimination of toxicity due to structural changes by means of enzymes and/or live microbes
Trichothecenes
Biotransformation

Trichothecenes
Biotransformation
BBSH 797
Active under intestinal conditions
Elimination of toxicity
0
10
20
30
40
50
60
70
80
90
100D
eto
xifi
cati
on
of
DO
N [
%]
Ileum
+ B
BSH 797
Ileum
Duodenum
+ B
BSH 797
Duodenum

Zearalenone
Biotransformation
0
10
20
30
40
50
60
70
80
90
ZO
N-d
eact
ivat
ion
[%
]
enzymesA B C
mineralsMPL: 0.2 % toxin concentration: 1 mg/lpH 6.5 (gastrointestinal juice)
Biological constituent
Elimination of TOXICITY
Mycofix Plus 3.0

min2 4 6 8 10 12 14
%F
2
4
FLD1 A, Ex=235, Em=460 (F:\DATA\JÄNNER02\210102\009-1701.D)
min2 4 6 8 10 12 14
%F
2
4
FLD1 A, Ex=235, Em=460 (F:\DATA\JÄNNER02\210102\008-1501.D)
min2 4 6 8 10 12 14
%F
234
FLD1 A, Ex=235, Em=460 (F:\DATA\JÄNNER02\210102\006-1101.D)
min2 4 6 8 10 12 14
%F
2
4
FLD1 A, Ex=235, Em=460 (F:\DATA\JÄNNER02\210102\005-0901.D)
min2 4 6 8 10 12 14
%F
2.55
7.5
FLD1 A, Ex=235, Em=460 (F:\DATA\JÄNNER02\210102\004-0701.D)
Detoxification of zearalenone to non- toxic metabolites,no toxic metabolites (e.g. alpha-zearalenol) could be detected!!!!
Biotransformation
Incubation

Trichosporon mycotoxinivorans
Non-pathogenic yeast developed by Biomin®: During its metabolic activity MTV produces specific enzymes which
detoxify specifically ZON and OTA in
the intestinal tract of the animals.
Biotransformation

ONH
COOH O OH
Cl
O
H
H
CH3OH
Degradation of Ochratoxin A
• OTα = non-toxic
Biotransformation
Degradation of OTA bylyophilized MTV
0
20
40
60
80
100
0h 0.5h 1.0h 2.5h 6.0h
incubation time
OTA
-deto
xif
icati
on
[%
]
2.5 ppm OTA 0.5 ppm OTA
IFA Tulln, Austria
100% deactivation after 1h!!!

Mycotoxin Contamination of Feedstuffs in Australia and New
ZealandBiomin Australia/Romer Laboratories
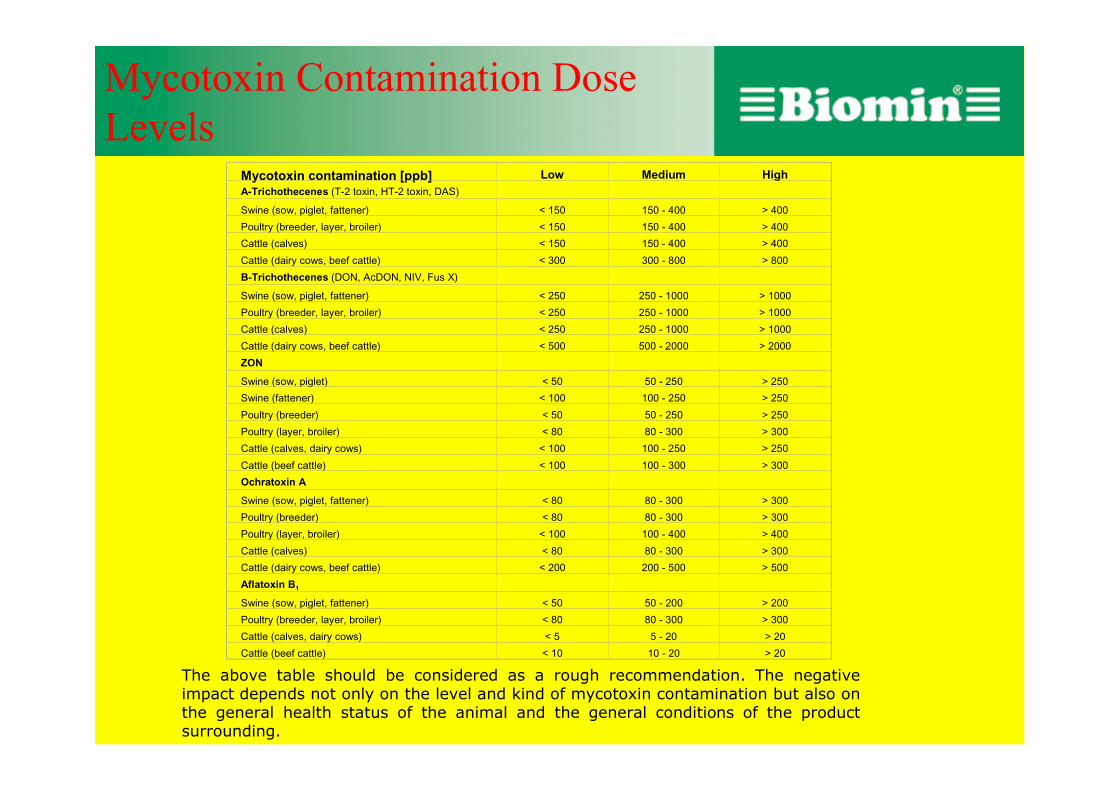
Mycotoxin Contamination Dose Levels
The above table should be considered as a rough recommendation. The negative impact depends not only on the level and kind of mycotoxin contamination but also on the general health status of the animal and the general conditions of the product surrounding.
Mycotoxin contamination [ppb] Low Medium HighA-Trichothecenes (T-2 toxin, HT-2 toxin, DAS)
Swine (sow, piglet, fattener) < 150 150 - 400 > 400
Poultry (breeder, layer, broiler) < 150 150 - 400 > 400
Cattle (calves) < 150 150 - 400 > 400
Cattle (dairy cows, beef cattle) < 300 300 - 800 > 800
B-Trichothecenes (DON, AcDON, NIV, Fus X)
Swine (sow, piglet, fattener) < 250 250 - 1000 > 1000
Poultry (breeder, layer, broiler) < 250 250 - 1000 > 1000
Cattle (calves) < 250 250 - 1000 > 1000
Cattle (dairy cows, beef cattle) < 500 500 - 2000 > 2000
ZON
Swine (sow, piglet) < 50 50 - 250 > 250
Swine (fattener) < 100 100 - 250 > 250
Poultry (breeder) < 50 50 - 250 > 250
Poultry (layer, broiler) < 80 80 - 300 > 300
Cattle (calves, dairy cows) < 100 100 - 250 > 250
Cattle (beef cattle) < 100 100 - 300 > 300
Ochratoxin A
Swine (sow, piglet, fattener) < 80 80 - 300 > 300
Poultry (breeder) < 80 80 - 300 > 300
Poultry (layer, broiler) < 100 100 - 400 > 400
Cattle (calves) < 80 80 - 300 > 300
Cattle (dairy cows, beef cattle) < 200 200 - 500 > 500
Aflatoxin B1
Swine (sow, piglet, fattener) < 50 50 - 200 > 200
Poultry (breeder, layer, broiler) < 80 80 - 300 > 300
Cattle (calves, dairy cows) < 5 5 - 20 > 20
Cattle (beef cattle) < 10 10 - 20 > 20

Occurrence of mycotoxins in straw in Australia
Sample Number Location Visual Condition
683 Straw - Clare SA Dark in colour, recently moved to an eco shelter684 Straw - Clare SA Not discolored, sample taken from the top of the bale685 Straw - Burra SA Slightly discolored686 Straw - Burra SA Slightly discoloured
ST01 Straw - Mullaby NW NSW Not discolored - stored outside 8 monthsST02 Straw - Dubbo NSW Not discolored - stored inside 8 monthsST03 Straw Cetral Vic Slightly discoloured Stored 8 months under canvass coverST04 Straw - Mid North SA Slightly discoloured Stored outsideST05 Straw - North York Penisula Slightly discoloured Stored outsideST06 Wheat SW Vic Slightly discoloured Stored inside 20 monthsST07 Wheat SW Vic Discoloured Stored outside 20 monthsPP08 Wheat Straw SW Vic Discoloured and moist stored inside 7 monthsPP09 Triticale Straw SW Vic Not discoloured stored 8 months insidePP10 Wheat Straw NW Vic Slightly discoloured stored outside 8 monthsSP11 Barley Straw Central Vic Discoloured stored insideSP12 Barley Straw Central Vic Not discoloured stored outside 2 monthsSP13 Lucerne Straw Central Vic Not discolouredSP14 Barley Straw off floor Not discoloured off floor of shedSP15 Barley Straw off floor Not discoloured off floor of shedSP16 Barley Straw Central Vic Slightly discoloured stored outside 30 monthsAL17 Wheat Straw WA Not discoloured stored outside ST18 Wheat Straw WA Not discoloured stored outside

Mycotoxin Contamination of Straw in AustraliaType Location AfB1 AfB2 AfG1 AfG2 OTA ZON DON Fum B1 Fum B2 NIV
[ug/kg] [ug/kg] [ug/kg] [ug/kg] [ug/kg] [ug/kg] [ug/kg] [ug/kg] [ug/kg] [ug/kg]Barley Straw Clare SA <5 <3 <3 <3 2 <32 <50 < 100 < 100 -Barley Straw Clare SA <5 <3 <3 <3 4 208 <50 < 100 < 100 -Barley Straw Burra SA <5 17 <3 <3 <2 328 1860 < 100 < 100 -Barley Straw Burra SA <5 15 <3 <3 2 592 72 < 100 < 100 -Barley Straw Mulaby NSW <5 <3 <5 <5 <2 1131 350 < 100 < 100 -Barley Straw Dubbo NSW <5 <3 <3 <5 <2 3551 <50 < 100 < 100 -Barley Straw Central Vic <5 <3 <3 <5 <2 205 <50 < 100 < 100 -Barley Straw Mid North SA <5 <3 <3 <5 <2 1146 733 < 100 < 100 -Barley Straw North York Peninsula <5 <3 <3 <5 <2 679 <50 < 100 < 100 -Wheat Straw SW Vic 10 <3 <3 <3 <2 <32 366 < 100 < 100 -Wheat Straw SW Vic 7 <3 <3 <3 <2 1272 115 < 100 < 100 197Wheat Straw SW Vic <5 <3 <3 <3 <2 1263 212 < 100 < 100 <50Triticale srraw SW Vic 5 <3 <3 <3 <2 97 <50 < 100 < 100 <50Wheat Straw NW Vic 9 <3 <3 <3 <2 204 187 < 100 < 100 <50Barley Straw Central Vic 11 <3 <3 <3 <2 94 822 < 100 < 100 -Barley Straw Central Vic 9 <3 <3 <3 <2 79 792 < 100 < 100 -Lucerne straw Central Vic <5 <3 <3 <3 <2 2350 <50 < 100 < 100 -Barley Straw Central Vic 10 <3 <3 <3 <2 <32 670 < 100 < 100 <50Barley Straw Central Vic 8 <3 <3 <3 <2 <32 310 < 100 < 100 <50Barley Straw Central Vic 11 <3 <3 <3 <2 125 713 < 100 < 100 295Barley Straw Central NSW <5 <3 <3 <3 <2 <32 <50 < 100 < 100 -Barley Straw Central NSW <5 <3 <3 <3 <2 <32 <50 < 100 < 100 -Barley Straw Central NSW <5 <3 <3 <3 <2 <32 <50 < 100 < 100 -Wheat Straw WA <5 <3 <3 <3 <2 140 347 < 100 < 100 -Wheat Straw WA <5 <3 <3 <3 <2 102 <50 < 100 < 100 -Wheat Straw WA <5 <3 <3 <3 <2 <32 428 < 100 < 100 -Wheat Straw WA <5 <3 <3 <3 <2 <32 216 < 100 < 100 -Wheat Straw WA <5 <3 <3 <3 <2 <32 <50 < 100 < 100 -Wheat Straw WA <5 <3 <3 <3 <2 <32 <50 < 100 < 100 -Wheat Straw WA <5 <3 <3 <3 <2 <32 340 < 100 < 100 -Wheat Straw WA <5 <3 <3 <3 <2 35 <50 < 100 < 100 -Wheat Straw WA <5 <3 <3 <3 <2 102 <50 < 100 < 100 -

Mycotoxin Contamination of Straw in AustraliaType Location AfB1 AfB2 AfG1 AfG2 OTA ZON DON Fum B1 Fum B2 NIV
[ug/kg] [ug/kg] [ug/kg] [ug/kg] [ug/kg] [ug/kg] [ug/kg] [ug/kg] [ug/kg] [ug/kg]Barley Straw & Rice Hulls NSW <5 <3 <3 <3 <2 66 <50 < 100 < 100 -Barley Straw & Rice Hulls NSW <5 <3 <3 <3 <2 72 <50 < 100 < 100 -Barley Straw & Rice Hulls NSW <5 <3 <3 <3 <2 55 <50 < 100 < 100 -Barley Straw Western NSW <5 <3 <3 <3 <2 <32 <50 < 100 < 100 -Barley Straw Western NSW 8 <3 <3 <3 <2 <32 <50 < 100 < 100 -Barley Straw Southern NSW <5 <3 <3 <3 <2 66 <50 < 100 < 100 -Barley Straw Southern NSW <5 <3 <3 <3 <2 72 <50 < 100 < 100 -Barley Straw South Island NZ 9 <3 <3 <3 <2 248 177 < 100 < 100 -Barley Straw South Island NZ 9 <3 <3 <3 <2 188 98 < 100 < 100 -Barley Straw NW Vic 8 <3 <3 <3 <2 439 <50 < 100 < 100 -Wheat Straw SA <5 <3 <3 <3 <2 <32 172 212 < 100 -Wheat Straw SA <5 <3 <3 <3 <2 <32 171 < 100 < 100 -Wheat Straw SA <5 <3 <3 <3 <2 1216 613 < 100 < 100 -Barley Straw Vic <5 <3 <3 <3 <2 <32 <50 < 100 < 100 -Barley Straw Vic <5 <3 <3 <3 <2 <32 892 < 100 < 100 -Barley Straw Vic <5 <3 <3 <3 <2 <32 652 < 100 < 100 -Barley Straw WA <5 <3 <3 <3 <2 <32 102 < 100 < 100 -Wheat Straw WA <5 <3 <3 <3 <2 <32 <50 < 100 < 100 -Barley Straw WA <5 <3 <3 <3 <2 <32 <50 < 100 < 100 -Barley Straw WA <5 <3 <3 <3 <2 <32 <50 < 100 < 100 -Barley Straw WA <5 <3 <3 <3 <2 <32 250 < 100 < 100 -TOTAL NUMER OF SAMPLES 53 53 53 53 53 53 53 53 53 7
Number Positive 13 2 0 0 3 29 25 1 0 2% Positive 24.53 3.77 0.00 0.00 5.66 54.72 47.17 1.89 0.00 28.6Average Contamination 8.80 16 - - 2.89 547.9 444 212 - 246
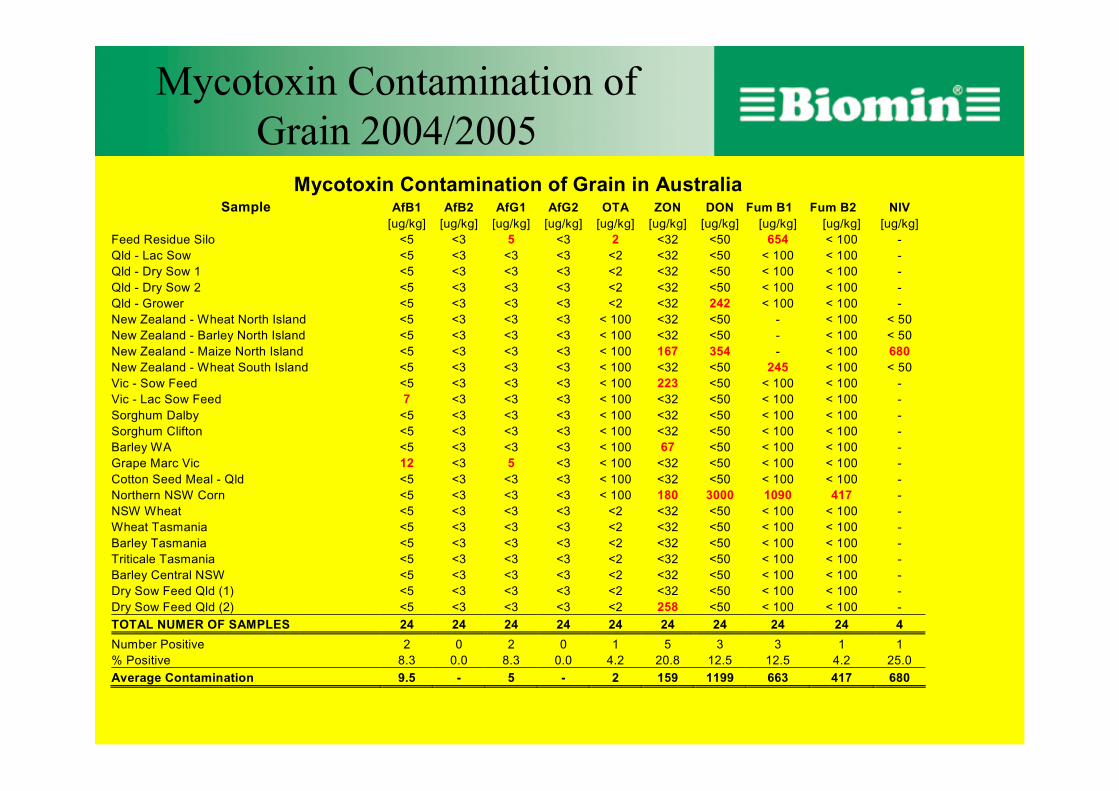
Mycotoxin Contamination of Grain 2004/2005
Mycotoxin Contamination of Grain in AustraliaSample AfB1 AfB2 AfG1 AfG2 OTA ZON DON Fum B1 Fum B2 NIV
[ug/kg] [ug/kg] [ug/kg] [ug/kg] [ug/kg] [ug/kg] [ug/kg] [ug/kg] [ug/kg] [ug/kg]Feed Residue Silo <5 <3 5 <3 2 <32 <50 654 < 100 -Qld - Lac Sow <5 <3 <3 <3 <2 <32 <50 < 100 < 100 -Qld - Dry Sow 1 <5 <3 <3 <3 <2 <32 <50 < 100 < 100 -Qld - Dry Sow 2 <5 <3 <3 <3 <2 <32 <50 < 100 < 100 -Qld - Grower <5 <3 <3 <3 <2 <32 242 < 100 < 100 -New Zealand - Wheat North Island <5 <3 <3 <3 < 100 <32 <50 - < 100 < 50New Zealand - Barley North Island <5 <3 <3 <3 < 100 <32 <50 - < 100 < 50New Zealand - Maize North Island <5 <3 <3 <3 < 100 167 354 - < 100 680New Zealand - Wheat South Island <5 <3 <3 <3 < 100 <32 <50 245 < 100 < 50Vic - Sow Feed <5 <3 <3 <3 < 100 223 <50 < 100 < 100 -Vic - Lac Sow Feed 7 <3 <3 <3 < 100 <32 <50 < 100 < 100 -Sorghum Dalby <5 <3 <3 <3 < 100 <32 <50 < 100 < 100 -Sorghum Clifton <5 <3 <3 <3 < 100 <32 <50 < 100 < 100 -Barley WA <5 <3 <3 <3 < 100 67 <50 < 100 < 100 -Grape Marc Vic 12 <3 5 <3 < 100 <32 <50 < 100 < 100 -Cotton Seed Meal - Qld <5 <3 <3 <3 < 100 <32 <50 < 100 < 100 -Northern NSW Corn <5 <3 <3 <3 < 100 180 3000 1090 417 -NSW Wheat <5 <3 <3 <3 <2 <32 <50 < 100 < 100 -Wheat Tasmania <5 <3 <3 <3 <2 <32 <50 < 100 < 100 -Barley Tasmania <5 <3 <3 <3 <2 <32 <50 < 100 < 100 -Triticale Tasmania <5 <3 <3 <3 <2 <32 <50 < 100 < 100 -Barley Central NSW <5 <3 <3 <3 <2 <32 <50 < 100 < 100 -Dry Sow Feed Qld (1) <5 <3 <3 <3 <2 <32 <50 < 100 < 100 -Dry Sow Feed Qld (2) <5 <3 <3 <3 <2 258 <50 < 100 < 100 -TOTAL NUMER OF SAMPLES 24 24 24 24 24 24 24 24 24 4
Number Positive 2 0 2 0 1 5 3 3 1 1% Positive 8.3 0.0 8.3 0.0 4.2 20.8 12.5 12.5 4.2 25.0Average Contamination 9.5 - 5 - 2 159 1199 663 417 680

Mycotoxin Contamination of Feedstuffs 2005/2006 Romer Labs
Mycotoxin Contamination of Feedstuffs in AustraliaAfB1 AfB2 AfG1 AfG2 OTA ZON DON Fum B1 Fum B2 NIV Lolitrom-B Ergovaline
[ug/kg] [ug/kg] [ug/kg] [ug/kg] [ug/kg] [ug/kg] [ug/kg] [ug/kg] [ug/kg] [ug/kg] [ppm] [ppm]Grape Marc Vic (Summer) 12 <3 5 <3 2 <32 <50 < 100 < 100 -Grape Marc Vic (Winter) <3 <3 <3 <3 - <32 <50 < 100 < 100 -Dairy Meal Gippsland <3 <3 <3 <3 - <32 <50 < 100 < 100 -Dairy Meal Sheparton <3 <3 <3 <3 - <32 <50 < 100 < 100 -Paspalum Pasture 16 <3 <3 <3 - 493 199 < 100 < 100 -Rye Grass Silage (poor quality) 13 <3 <3 <3 - 4738 184 < 100 < 100 -Lucerne Silage <3 <3 <3 <3 - 1548 368 < 100 < 100 -Fruit Waste - tomato 8 <3 <3 <3 - 1460 <50 < 100 < 100 -Barley Straw <3 <3 <3 <3 - <32 1607 < 100 < 100 -Bread - Melbourne <3 <3 <3 <3 - <32 <50 < 100 < 100 -Lucerne Hay 6 <3 <3 <3 - 1203 160 < 100 < 100 -Fruit Waste - citrus <3 <3 <3 <3 - <32 <50 < 100 < 100 -Annuall Rye Grass - irrigated <3 <3 <3 <3 - 3056 <50 707 < 100 -Rye Grass Silage - irrigated <3 <3 <3 <3 - 2748 766 < 100 < 100 -Corn Draff <3 <3 <3 <3 - 133 <50 < 100 < 100 -Pasja & Millet <3 <3 <3 <3 - <32 <50 < 100 < 100 -Perenial Rye Grass <3 <3 <3 <3 - 65 129 < 100 < 100 - 2.4 0.6Oat & Pea Silage (round bale) 7 <3 <3 <3 - <32 781 < 100 < 100 -Barley Straw 8 <3 <3 <3 - 439 <50 < 100 < 100 -Mixed Pasture Hay - Gippsland 13 <3 <3 <3 - 5811 <50 < 100 < 100 - 0.9 0.8Annuall Rye Grass Silage - (round bale) 10 <3 <3 <3 - <32 640 < 100 < 100 -Perenial Rye Grass Silage (round bale) 9 <3 <3 <3 - <32 1758 < 100 < 100 - 0.2 <0.1Rices Hulls 11 <3 <3 <3 - 69 <50 < 100 < 100 -Rices Hulls 11 <3 <3 <3 - 42 <50 < 100 < 100 -Rices Hulls <3 <3 <3 <3 - <32 <50 < 100 < 100 -Rices Hulls <3 <3 <3 <3 - 55 <50 < 100 < 100 -TOTAL NUMER OF SAMPLES 26 26 26 26 26 26 26 26 26 0 3 3
Number Positive 10 0 0 0 1 11 10 0 0 0 0 2% Positive 38.5 0 0 0 3.8 42.3 38.5 0 0Average Contamination 10.5 - - - 2 1622 539 - - - 1.17 0.7

Mycotoxin Contamination of Feedstuffs in AustraliaAfB1 AfB2 AfG1 AfG2 OTA ZON DON Fum B1 Fum B2 NIV
[ug/kg] [ug/kg] [ug/kg] [ug/kg] [ug/kg] [ug/kg] [ug/kg] [ug/kg] [ug/kg] [ug/kg]Pig Creep <1 <1 <1 <1 <2 <32 <50 < 100 < 100 -Pig Starter <1 <1 <1 <1 <2 <32 <50 < 100 < 100 -Pig Weaner <1 <1 <1 <1 <2 <32 <50 < 100 < 100 -Grower <1 <1 <1 <1 <2 <32 <50 < 100 < 100 -Finisher <1 <1 <1 <1 <2 <32 <50 < 100 < 100 -Gilt Developer <1 <1 <1 <1 <2 <32 <50 113 < 100 -Grain Dust <1 <1 <1 <1 <2 <32 249 < 100 < 100 -Lac Sow 3 <1 <1 <1 <2 68 <50 < 100 < 100 -Weaner Feed <1 <1 <1 <1 <2 61 <50 247 < 100 -Lac Sow <1 <1 <1 <1 <2 258 <50 < 100 < 100 -Lac Sow 3 <1 <1 <1 <2 <32 <50 < 100 < 100 -Peanut 4 <1 3 <1 - - - - - -Corn 10 <1 8 <1 - - - - - -Corn 17 <1 3 <1 - - - - - -Peanut 1876 112 915 83 - - - - - -Mung Beans <1 <1 <1 <1 - - - - - -Peanut Husk 57 17 34 7 - - - - - -Peanut Meal 1062 169 673 99 - - - - - -Sorghum - - - - - - - - - -Paspalum Pasture <1 <1 <1 <1 <2 <32 320 < 100 < 100 -Bread 73 - 11 - - - - - - -Bread 45 2 4 - - - - - - -Peanut Husk 16 8 2 3 - - - - - -

New Zealand
• ZEN is often present at 0.5 – 5.0 mg/kg in autumn pasture, especially where there is an accumulation of dry feed
• ZEN = causes low fertility in ewes at pasture
(Towers & Sprosen 1993)

SW Victorian Pastures
Range (mg/kg) Mean Median
1999: 0 – 21.0 1.67 0.74
2000: 0 – 14.1 1.08 0.39
80% of pastures +veFor 31%, level exceeded 1 mg ZEN/kg DM

SE Australian Silages
• 24 samples of 2005 silage tested
• ZEN found in 15 (63%)
• Level up to 70 mg ZEN/kg DM
• Level exceeded 1 mg/kg in 50% of samples
• Levels noticeably high in most legume silages

Advice re ZEA in cattle rations
Diets should contain
<0.2 mg/kg DM
Many US Universities,
e.g. Brooks 1997
Radostits et al (2000) advise
< 10 ppb

National Residues Survey - cattle slaughtered 1998-2001
Australia: n = 884, 50% +ve for ZEN or its derivatives
(Coulson 2001)
in the high rainfall zone, frequency was high: - eg SW Victoria: 90% +ve
(P. Miller, AFFA, pers. comm.)