Embed Size (px)
Citation preview

MANAGING THE CYCLE
2015 ANNUAL REPORT AND ACCOUNTS
Hunting PLC
2015 A
nnual Report and Accounts
ABOUT THIS REPORT
HUNTING GENERATES VALUE THROUGH THE MANUFACTURE OF
PRODUCTS, SUPPLY OF RENTAL EQUIPMENT AND PROVISION OF
RELATED SERVICES TO THE UPSTREAM ENERGY SECTOR ENABLING THE EXTRACTION OF OIL AND GAS.
THE FOLLOWING REPORT PROVIDES AN OVERVIEW OF
OUR BUSINESS STRATEGY AND MODEL WITHIN THE ENERGY SECTOR AND DETAILS OUR
ACTIVITIES AND PERFORMANCE DURING 2015.

CONTENTS
STRATEGIC REPORT
02 Operational and financial summary04 Chairman’s statement06 Chief Executive’s review and outlook09 Our business model 20 Our business strategy 22 Risk management 31 Market review34 Key performance indicators 36 Group performance and development 42 Group funding and position at year end44 Corporate and social responsibility
CORPORATE GOVERNANCE
48 Board of Directors50 Corporate governance report54 Directors’ report55 Audit committee report59 Remuneration committee report61 Directors’ remuneration policy summary65 Annual report on remuneration
FINANCIAL STATEMENTS
74 Independent auditors’ report81 Consolidated income statement82 Consolidated statement of comprehensive income83 Consolidated balance sheet84 Consolidated statement of changes in equity85 Consolidated statement of cash flows86 Notes to the consolidated financial statements124 Company balance sheet125 Company statement of changes in equity126 Company statement of cash flows127 Notes to the Company financial statements
OTHER INFORMATION
133 Non-GAAP measures 138 Financial record 139 Shareholder and statutory information142 Glossary144 Professional advisers
INFORMATION ON OUR BUSINESS MODEL AND STR ATEGY CAN BE FOUND ON PAGES 9 TO 21
INFORMATION ON OUR GROUP PERFORMANCE AND DEVELOPMENT CAN BE FOUND ON PAGES 36 TO 41
INFORMATION ON OUR RISK MANAGEMENT PROCEDURES CAN BE FOUND ON PAGES 22 TO 30

2015
2014
2013
48.01
92.91
97.61
AVERAGE WTI CRUDE OIL PRICE ($ per bar re l )
2015
2014
2013
3.2
2.8
2.8
GLOBAL FACILITY FOOTPRINT (m sq f t )
2015
2014
2013
267
391
370
GLOBAL DRILLING AND PRODUCTION EXPENDITURE ($bn)
2015
2014
2013
15
12
11
NUMBER OF COUNTRIES OF OPERATION
Hunting PLC2015 Annual Report and Accounts
02
OPERATIONAL AND FINANCIAL SUMMARY
OPERATIONAL
Continued development of global operating footprint • commissioning commenced of high throughput premium
connections facility at Ameriport, US, in Q4 2015 to serve North American energy markets;
• Cape Town, South Africa, facility commissioned providing threading, storage and service for sub-Sahara African markets;
• completion of facility expansion at Houma, US; • expansion of Hunting Dearborn facility to reduce customer
lead times; • AMG manufacturing capability established in Singapore; • new Hunting Titan/Drilling Tools shared distribution and
service centre opened in Odessa, US.
New product innovations developed and commercialised • new H-1 perforating system trialled by customers in the year,
and commercialised during Q1 2016 by Hunting Titan; • WEDGE-LOCK™ and SEAL-LOCK XD™ premium connections
sales increased following first roll out in early 2015; • new high temperature/high pressure hydraulic couplings
developed and launched by Hunting Subsea; • new directional drilling tools jointly developed by Drilling Tools,
Hunting Specialty and Hunting Titan businesses.
Cost reduction programme completed during the year • 30% reduction in headcount in the year; • four operating sites closed; • three distribution centres being prepared for closure.
MARKET DATA

ST
RA
TE
GIC
RE
PO
RT
CO
RP
OR
AT
E G
OV
ERN
AN
CE
FIN
AN
CIA
L S
TA
TE
MEN
TS
OT
HER
INF
OR
MA
TIO
N
Hunting PLC2015 Annual Report and Accounts
03
NET DEBT*
$110.5m2014 – $131.0m
DIVIDENDS DECLARED
8.0 cents2014 – 31.0 cents
REVENUE
$810.5m2014 – $1,386.5m
UNDERLYING PROFIT FROM OPER ATIONS*
$16.4m2014 – $217.8m
FINANCIAL
Cost reductions and tight cash management achieved in the year • cost saving measures implemented across the Group; • capital expenditure reduced to $81.1m as major projects
were completed.
Positive free cash flows* generated allowing pay down of net debt* • $118.0m of free cash generated to give closing net debt
of $110.5m; • gearing of 9% reported, even with continued capital
investment.
Revenue of $810.5m recorded in the year, with management actions limiting the impact on gross margins • revenue decline in line with reductions in US drilling and
production expenditure; • 24% underlying gross margin achieved in the year.
Impairment and restructuring charges reflecting current market conditions • charges for restructuring costs and impairment to property,
plant and equipment, goodwill and other intangible assets totalling $259.7m.
Underlying profit from operations* of $16.4m • Reported loss from operations of $282.2m.
Final dividend of 4.0 cents per share proposed, subject to shareholder approval • subject to approval, the dividend will be paid on 6 July 2016,
with a cash cost of $5.9m; • total dividends for the year 8.0 cents per share, with a total
cash cost of $11.8m.
Underlying – results for the year as reported under IFRS adjusted for the amortisation of acquired intangibles and exceptional items.
Reported – results for the year under IFRS.
* Non-GAAP measure (“NGM”) (see pages 133 to 137).
Hunting PLC2015 Annual Report and Accounts
04
CHAIRMAN’S STATEMENT
R I C H A R D H U N T I N G , C . B . E .CHAIRMAN
“THE CURRENT OIL PRICE WEAKNESS HAS REDUCED REVENUE
AND PROFITS IN THE YEAR BUT OUR STRATEGY TO RETAIN OPERATING CAPACITY, IN ANTICIPATION OF
A RECOVERY, REMAINS IN PLACE.”

ST
RA
TE
GIC
RE
PO
RT
CO
RP
OR
AT
E G
OV
ERN
AN
CE
FIN
AN
CIA
L S
TA
TE
MEN
TS
OT
HER
INF
OR
MA
TIO
N
Hunting PLC2015 Annual Report and Accounts
05
IntroductionHunting had a challenging year in 2015, with the downturn in oil prices proving deeper and more prolonged than almost anyone was predicting. Despite that, and the resulting need to rein in both replacement and growth capital investment, the Company has retained its manufacturing and production capabilities.
The Group has expanded into new regions, including Saudi Arabia and sub-Sahara Africa, while aligning its existing operations in North America with the current market conditions.
Capital investment during the year totalled $81.1m (2014 – $123.5m) which allowed us to finish or continue projects already underway in Texas, Louisiana, Maine and South Africa. Inevitably, in this environment some projects have been deferred or held at the initial operating capability stage. Nevertheless, our strategy of retaining our core facilities and skills in readiness for the eventual recovery in our markets remains unchanged.
PerformanceThe year was one of two very different halves. In the first six months, we were able to take advantage of the market momentum and of orders received in 2014; but the decline in business from customers, who were themselves under extreme pressure, meant that the second half was very difficult.
Underlying profit before tax from continuing operations was $9.4m (2014 – $212.4m), reflecting the overall difficult operating environment in the year as a whole.
As with many of our peers, Hunting has undertaken a review of the carrying values of property, plant and equipment, goodwill and other intangible assets, leading to a total impairment of $252.6m being charged to the Group’s income statement (2014 – $60.9m). Amortisation of acquired intangible assets and other exceptional items charged to the income statement in the year totalled $46.0m (2014 – $43.0m). This has led to a reported loss before tax from continuing operations of $289.2m (2014 – $108.5m profit).
DividendThe Board is recommending a final dividend of 4.0 cents per share (2014 – 22.9 cents per share), representing a fine balance between loyalty to our shareholders and our wish to maintain a strong balance sheet. Total dividends declared for the year were therefore 8.0 cents per share (2014 – 31.0 cents per share).
HUNTING HAS OPENED A NEW FACILITY IN SOUTH AFRICA IN EARLY 2015
GovernanceIn February 2015 we welcomed two new independent non-executive Directors to the Board, Annell Bay and Jay Glick. Annell has extensive experience in the upstream exploration segment of our industry, having worked previously with integrated majors and large independent exploration companies. Jay has also brought a wealth of energy-related manufacturing experience to the Board, having led one of our US peers for many years, prior to his retirement from executive duties. As both these segments of the industry are Hunting’s partners, competitors and customers, their combined insight has been valuable during this volatile year.
The Board remains compact, capable and dedicated and I thank all my fellow Directors for their wisdom during these challenging times.
I am also pleased to note our enhanced Strategic Report which describes how our current strategy creates long-term value, combined with our approach to risk management. While the energy industry is distressed at present, Hunting’s position in the industry will be strong when the recovery occurs.
Further, I wish to record my gratitude to all of our people. For those who have had to go, I express my deep regret. For those remaining, I am extremely grateful. We do not know when the return to normality in our markets will come, but come it certainly will.
R I C H A R D H . H U N T I N G , C . B . E . CHAIRMAN
3 March 2016
UNDERLYING PROFIT BEFORE TAX*
$9.4m2014 – $212.4m
DIVIDEND PER SHARE FOR THE YEAR
8.0 cents2014 – 31.0 cent s
CAPITAL INVESTMENT
$81.1m2014 – $123.5m
* Non-GAAP measure (“NGM”) (see pages 133 to 137).
Hunting PLC2015 Annual Report and Accounts
06
CHIEF EXECUTIVE’S REVIEW
“THE SEVERITY AND SPEED OF THE REDUCTION IN ACTIVITY,
PARTICULARLY ACROSS NORTH AMERICA, HAS CREATED CHALLENGES FOR ALL MARKET
PARTICIPANTS. THE GROUP HAS ADAPTED QUICKLY TO THE
CHANGING MARKET ENVIRONMENT, READY TO RESPOND WHEN INDUSTRY
INVESTMENT RECOVERS.”
D E N N I S P R O C T O RCHIEF EXECUTIVE

ST
RA
TE
GIC
RE
PO
RT
CO
RP
OR
AT
E G
OV
ERN
AN
CE
FIN
AN
CIA
L S
TA
TE
MEN
TS
OT
HER
INF
OR
MA
TIO
N
Hunting PLC2015 Annual Report and Accounts
07
Introduction2015 will be remembered in the global energy industry as a generational decline in investment and activity levels. The severity and speed of the reduction in activity, particularly across North America, has created challenges for all market participants. The Group has adapted quickly to the changing market environment, and at the same time prepared for a return to growth, with its manufacturing and service capabilities intact – ready to respond when industry investment recovers.
Hunting’s efforts in 2015 have focused on six strategic goals:
1. reducing its cost base to align with the short-term outlook for the industry;
2. maintaining its global manufacturing capability; 3. investing in new facilities where strong future growth is
forecast; 4. demonstrating technological excellence with new products
launched to assist customers with the delivery of projects in a more efficient and productive way;
5. maintaining margins where Hunting has product leadership; and
6. reducing inventories to generate cash and manage net debt.
While the early part of 2016 continues to indicate a difficult market environment, Hunting remains well placed to deliver quality products and industry leading service to its customer base, which will position the Group well for the eventual recovery.
Market BackdropThe performance of all the businesses within the Group has been impacted by the macro-economic drivers of the industry during the year. WTI crude oil prices declined 30% in absolute terms during 2015 to $37 per barrel; global rig counts have reduced 26% and global drilling and production expenditure has been cut by 32% to c.$267bn during the year, leading to a decrease in demand for Hunting’s products and services.
This environment has led to common themes being reported by many businesses within the Hunting group, with industry participants cancelling or deferring orders, demanding aggressive price reductions across all product groups, and in-housing production to increase pricing pressure on global vendors.
Our ResponseHunting’s response to the current market environment has been clear. The Group has undertaken a major reduction in workforce across all of its operations to align its businesses with these lower activity levels. Headcount has reduced by 30% to 2,784 at the year end (2014 – 4,003).
Management reviewed the Group’s manufacturing operations and in the year closed four facilities, including its Canada Drilling Tools operation in Nisku, Canada, the US Manufacturing facility at Woodlawn, Louisiana, and rationalised the US Drilling Tools business. The Group has also initiated plans to close three distribution centres. The Group will also continue to monitor its global operational footprint to maximise its operating efficiency, as new facilities are commissioned.
The Group has been firmly focused on cash generation to allow it to continue to invest for the future, while at the same time managing net debt levels appropriately. In 2015, Hunting generated $118.0m of free cash flow resulting in year end net debt of $110.5m to give gearing of 9% (2014 – 9%), even though capital investments absorbed $81.1m (2014 – $123.5m) in the year.
In order to capture new business opportunities Hunting completed and commissioned a new facility in Cape Town, South Africa, which will enable the Group to access and serve operators throughout sub-Sahara Africa with manufacturing, service, repair and storage capabilities. A satellite repair facility has been commissioned in Mombasa, Kenya, which will further serve operators on the east coast of Africa, where significant offshore gas discoveries will drive further exploration and development activity in the coming years.
In Q1 2016, the Group also completed its new premium connection manufacturing facility in Ameriport, US. The facility has been designed as a high throughput plant, allowing for the manufacture of premium connections with a wide range of diameters, serving the North American and international markets.
Hunting has also built and commissioned a world-class premium connection test facility to accelerate the in-house development of new connections and thread forms. The facility can test high pressure/high temperature connections, simulating deep water drilling environments, which assists Hunting’s technology development that include the recently developed SEAL-LOCK XD™ and WEDGE-LOCK™ premium connection product lines.
The Group’s facility at Fryeburg, US, has been expanded to increase its high precision manufacturing capabilities, including MWD/LWD tools and critical aerospace parts. Final commissioning of the facility will occur in Q1 2016.
During 2015, Hunting’s Advanced Manufacturing Group (“AMG”) commenced operations in Singapore, giving customers in the region access to Hunting’s electronics product lines, including MWD/LWD printed circuit boards.
Hunting Titan has commercialised and launched the H-1 perforating system for use in well completions. The system draws on Hunting’s expertise in electronics, pressure control, perforating and premium connections and delivers a safe, reliable and efficient total perforating solution to Hunting’s global customers.
While most businesses reported a decline in activity, Hunting Subsea reported a good performance in the year, due to strong momentum in the deep water drilling segment of the industry.
Our threading facility at Marrero, Louisiana, has also seen very strong demand for large diameter threaded pipe for use in deep water projects and had a busy order book in the year, which continued in to the early months of 2016.
While the Group’s revenue has reduced in the year, as detailed below, management have defended pricing and margins wherever possible principally through reducing the cost base.
Financial SummaryHunting’s performance in the year has seen revenue decline 42% from $1,386.5m in 2014 to $810.5m. This is broadly in line with the reduction in industry expenditures reported by leading sector commentators and data sources.
While employee-related costs were reduced during the year, total cost of sales and net other operating expenses were $794.1m (2014 – $1,168.7m) leading to a decline in underlying profit from continuing operations to $16.4m (2014 – $217.8m), with underlying diluted earnings per share reducing from 100.0 cents in 2014 to 3.1 cents.

Hunting PLC2015 Annual Report and Accounts
08
CHIEF EXECUTIVE’S REVIEWCONTINUED
Underlying Reported
2015$m
2014$m
2015$m
2014$m
Revenue 810.5 1,386.5 810.5 1,386.5EBITDA 61.9 269.8 54.8 269.6Profit (loss) from operations 16.4 217.8 (282.2) 113.9Profit (loss) before tax 9.4 212.4 (289.2) 108.5Profit (loss) for the year 4.0 155.2 (231.4) 71.8Discontinued operations:Profit for the year – 0.3 4.2 1.4Total profit (loss) for the year 4.0 155.5 (227.2) 73.2Diluted EPS – continuing operations (cents) 3.1 100.0 (156.1) 44.8
Given the market backdrop and future market projections, management has undertaken an asset impairment review. As a result, the Board is reporting a number of non-cash impairments: a goodwill impairment charge of $208.2m for the year in respect of a number of Group businesses, an other intangible asset impairment charge of $11.2m against customer relationships relating to the Electronics and Doffing acquisitions, an impairment charge to property, plant and equipment of $26.8m within the Drilling Tools business and a $6.4m impairment charge against the Group’s oil and gas related assets. Total exceptional charges, comprising these impairments, together with amortisation of acquired intangible assets of $38.9m and $7.1m restructuring costs incurred during the year, were $298.6m (2014 – $103.9m).
The reported loss from continuing operations, before interest and tax, in 2015 was therefore $282.2m (2014 – $113.9m profit) leading to a reported diluted loss per share of 156.1 cents (2014 – earnings per share 44.8 cents) being recorded.
OutlookSimply put: not good, certainly for the next few months. The degree and speed of the oil and gas industry contraction, coupled with project delays/cancellations, E&P bankruptcies, currency volatility, full out oil production and geopolitical influences, will strain the confidence of industry leaders, thus freezing any positive decisions. We are in a wilderness without a single path to guide us.
Certainly, $145 oil created enough new supply to drive prices to the current $30 level. With equal certainty, $30 oil will strangle production enough to drive the price back up. With such an inelastic commodity, the outlook is always the same – a sudden snapback comes when least expected.
Oversupply is driving this painful contraction and this oversupply is driven by oil producing countries seemingly blind to their own destructive actions globally and especially within their own countries. Damage to future supplies requiring long lead times is approaching permanence and any future demand growth will require massive capital and oilfield service capacity.
During this bleak period, we will continue to protect gross margins, emphasise quality and remain focused on health and safety. Absent large volume intake, each of our facilities is measured by free cash generation. Costs will be reduced to maintain free cash until no option exists but to close or, if possible, consolidate the product lines into another facility.
The Group maintains an excellent balance sheet, best-of-class global manufacturing facilities, producing complex, proprietary components led by an experienced management team. An industry recovery is assured, followed by strong momentum, but timing is elusive. The Group has and will continue to act decisively to safeguard an exciting and profitable future.

ST
RA
TE
GIC
RE
PO
RT
CO
RP
OR
AT
E G
OV
ERN
AN
CE
FIN
AN
CIA
L S
TA
TE
MEN
TS
OT
HER
INF
OR
MA
TIO
N
Hunting PLC2015 Annual Report and Accounts
09
AN OVERVIEWHOW WE CREATE, CAPTURE
AND DISTRIBUTE VALUE.
OIL AND GAS EXTRACTIONFOCUS ON THE WELLBORE
OUR RESOURCESKNOW-HOW/PATENTS
TR ADING
OPERATING PROCESSES
SUSTAINABLE VALUE CREATIONWe create value for:
GO TO PAGE 14
Our highly skilled people apply their sector know-how and market knowledge across our globally distributed operating facilities.
GO TO PAGE 16
OUTPUTSOur diverse range of products and services.
GO TO PAGE 10
Categorised into six major product groups with distinct business characteristics.GO TO PAGE 12
CUSTOMERSA broad customer base spread across the oil and gas value chain.
GO TO PAGE 15
Our management approach is decentralised and empowers our local businesses to react to local market conditions.
GO TO PAGE 18
SUPPLIERSR AW MATERIALS
OUR PEOPLE
MANUFACTURING
OUR SHAREHOLDERS OUR CUSTOMERS AND SUPPLIERS
OUR EMPLOYEES THE COMMUNITIES AND COUNTRIES IN WHICH
WE OPER ATE
CAPITAL EQUIPMENT
OPER ATING FACILITIES
EQUIPMENT RENTAL
OUR BUSINESS MODEL

OUR BUSINESS MODELCONTINUED
Hunting PLC2015 Annual Report and Accounts
10
OUR DIVERSE RANGE OF PRODUCTS AND SERVICES
CASINGAPI and premium threaded casing and Oil Country Tubular Goods.
CONNECTION TECHNOLOGYProprietary range of SEAL-LOCKTM premium connections for threaded pipe and couplings.
ELECTRONICSMWD/LWD components and down hole power supply units, PCB and manufacturing services.
APRSProprietary Annular Pressure Relief System.
WEDGE-LOCK™ New proprietary premium threading products, research, development and testing.
DRILLING TOOLS Mud motors, vibration dampeners, stabilisers and reamers.
DOWNHOLE SUPPLY Screens, MWD electrical and running gear components, float valve assemblies and handling equipment.
MANUFACTURINGCompletion accessories, premium threading services, OEM manufacturing.

ST
RA
TE
GIC
RE
PO
RT
CO
RP
OR
AT
E G
OV
ERN
AN
CE
FIN
AN
CIA
L S
TA
TE
MEN
TS
OT
HER
INF
OR
MA
TIO
N
Hunting PLC2015 Annual Report and Accounts
11
HUNTING IS A MANUFACTURER AND DISTRIBUTOR OF INNOVATIVE OEM AND
PROPRIETARY PRODUCTS TO THE UPSTREAM OIL AND GAS INDUSTRY
SUBSEAHydraulic valves, couplings and chemical injection systems.
PRECISION MACHININGDeep bore machining for directional drilling and geo-steering tools, inserts and collars for MWD/LWD tools.
PERFORATING SYSTEMSPerforating guns and setting tools, energetics, wireline and TCP, hardware and accessories.
LOGGING SYSTEMSProduction logging tools and instruments.
SWITCH GEARWireline selective firing systems, EBFire™ switches, RF safe ControlFire™ and shooting power software.
WELL INTERVENTIONPressure control equipment, Bottom Hole Assembly services, slickline and wireline tools.
THRU-TUBINGAdvanced, tailored solutions for a wide range of work-over and coiled tubing interventions.
VARIBALLProprietary rolling system for the delivery of tools in highly deviated wellbores.

OUR BUSINESS MODELCONTINUED
OUR OPERATING ACTIVITIES AND PRODUCT GROUPS
Hunting PLC2015 Annual Report and Accounts
12
HUNTING’S SIX MAJOR PRODUCT GROUPS
OIL COUNTRY TUBULAR GOODS (“OCTG”)
PERFORATING SYSTEMS ADVANCED MANUFACTURING GROUP (“AMG”)
DRILLING TOOLS INTERVENTION TOOLS SUBSEA
HUNTING’S THREE MAIN OPERATING ACTIVITIES
Manufacturing, Trading Manufacturing Manufacturing Equipment Rental, Trading Manufacturing, Equipment Rental and Trading
Manufacturing
OVERVIEW OCTG are steel alloy products and comprise casing and tubing used in the construction and completion of the wellbore. Hunting machines threads to connect OCTG using flush or semi-flush joints and can manufacture premium connections and accessories using our own technologies such as SEAL-LOCKTM and WEDGE-LOCKTM. We are licensed to apply a variety of competitor thread forms and generic API threads. We source OCTG products from a significant number of the major global steel producers and have strong, long-term relationships in the US, Europe and Asia. Hunting trades pipe, which is a lower margin activity, to help support customer relationships.
Hunting Titan manufactures perforating guns, energetics, firing systems and logging tools. Products are mainly used in the completion phase of a well. The production, storage and distribution of energetics is highly regulated and there are significant barriers for new entrants to the market. Hunting Titan mainly “manufactures to stock” and hence uses a wide distribution network. Some manufacturing is done to order, including international telesales.
This division includes the Hunting Dearborn business unit which carries out deep hole drilling and precision machining of complex MWD, LWD and formation evaluation tool components, and the Hunting Electronics division which produces printed circuit boards capable of operating in extreme conditions. The division works collaboratively with customers implementing their designs to their specification.
Rental of a large portfolio of downhole tools including mud motors, non-magnetic drill collars, vibration dampners, reamers and hole openers. Tools are configured to the customers’ specifications. This business is capital intensive and results are dependent on fleet utilisation and rental rates. In limited instances rental equipment is sold outright.
A range of downhole intervention tools including slickline tools, e-line tools, mechanical plant, coiled tubing and pressure control equipment. This business is capital intensive and results are dependent on asset utilisation and rental rates.
Produces high quality products and solutions for the global subsea industry covering hydraulic couplings, chemical injection systems, specialty valves and weldment services.
DIFFERENTIATORS Hunting is one of the largest independent providers of OCTG connection technology, including premium connections.
Market leading position in the US. Strong portfolio of patented and unpatented technology.
Hunting Dearborn is a world leader in the deep drilling of high grade, non-magnetic components. As a Group, Hunting has the ability to produce fully integrated advanced downhole tools and equipment, manufactured, assembled and tested to the customer’s specifications using its proprietary know-how.
Leaders in progressive cavity, positive displacement mud motors.
Hunting offers a comprehensive range of tools, including innovative and proprietary technologies.
For more than 30 years a provider of high quality metal-to-metal sealing hydraulic coupling solutions to operate in the harshest environments with a strong, long-term patent base.
GLOBAL OPERATING PRESENCE
OUR OPER ATIONS AND MARKETSPAGES 16 AND 17
Hunting has extensive machining capacity in the US, Canada, Europe, Asia and Africa.
Manufacturing centres in the US, Canada, Mexico and China. Distribution centres in the US, Canada, UK and Asia.
US, Asia. US. US, Canada, Europe, Asia, Middle East.
US.
RELATED STRATEGIC FOCUS AREAS
OUR STR ATEGYPAGES 20 AND 21
New products – develop the full WEDGE-LOCK™ range, complete the production and test facility at Ameriport, US.
Enhance existing capacity, lean manufacturing – new threading facility at Ameriport, US.
Develop global presence – establishing presence in Africa.
Sales synergies – enhancing European distribution network.
Develop global presence – developing sales organisation in Australia.
New products – H-1 perforating system.
Develop global presence – AMG facility established in Singapore.
Enhance existing capacity – Dearborn campus expansion.
Cost control – closure of Canadian operations in 2015.
Develop global presence – developing operating presence in Africa, enhancing presence in Asia.
New products – lightweight pressure control equipment system.
New products – extreme high pressure/high temperature subsea tree hydraulic coupling.
RELATED PRINCIPAL RISKS
MORE INFORMATION ON RISK PAGES 26 TO 29
Commodity prices, Shale drilling, Competition, Product quality.
Commodity prices, Shale drilling.
Commodity prices, Competition, Product quality.
Commodity prices, Shale drilling.
Commodity prices. Commodity prices, Product quality.

Hunting PLC2015 Annual Report and Accounts
13
ST
RA
TE
GIC
RE
PO
RT
CO
RP
OR
AT
E G
OV
ERN
AN
CE
FIN
AN
CIA
L S
TA
TE
MEN
TS
OT
HER
INF
OR
MA
TIO
N
HUNTING’S SIX MAJOR PRODUCT GROUPS
OIL COUNTRY TUBULAR GOODS (“OCTG”)
PERFORATING SYSTEMS ADVANCED MANUFACTURING GROUP (“AMG”)
DRILLING TOOLS INTERVENTION TOOLS SUBSEA
HUNTING’S THREE MAIN OPERATING ACTIVITIES
Manufacturing, Trading Manufacturing Manufacturing Equipment Rental, Trading Manufacturing, Equipment Rental and Trading
Manufacturing
OVERVIEW OCTG are steel alloy products and comprise casing and tubing used in the construction and completion of the wellbore. Hunting machines threads to connect OCTG using flush or semi-flush joints and can manufacture premium connections and accessories using our own technologies such as SEAL-LOCKTM and WEDGE-LOCKTM. We are licensed to apply a variety of competitor thread forms and generic API threads. We source OCTG products from a significant number of the major global steel producers and have strong, long-term relationships in the US, Europe and Asia. Hunting trades pipe, which is a lower margin activity, to help support customer relationships.
Hunting Titan manufactures perforating guns, energetics, firing systems and logging tools. Products are mainly used in the completion phase of a well. The production, storage and distribution of energetics is highly regulated and there are significant barriers for new entrants to the market. Hunting Titan mainly “manufactures to stock” and hence uses a wide distribution network. Some manufacturing is done to order, including international telesales.
This division includes the Hunting Dearborn business unit which carries out deep hole drilling and precision machining of complex MWD, LWD and formation evaluation tool components, and the Hunting Electronics division which produces printed circuit boards capable of operating in extreme conditions. The division works collaboratively with customers implementing their designs to their specification.
Rental of a large portfolio of downhole tools including mud motors, non-magnetic drill collars, vibration dampners, reamers and hole openers. Tools are configured to the customers’ specifications. This business is capital intensive and results are dependent on fleet utilisation and rental rates. In limited instances rental equipment is sold outright.
A range of downhole intervention tools including slickline tools, e-line tools, mechanical plant, coiled tubing and pressure control equipment. This business is capital intensive and results are dependent on asset utilisation and rental rates.
Produces high quality products and solutions for the global subsea industry covering hydraulic couplings, chemical injection systems, specialty valves and weldment services.
DIFFERENTIATORS Hunting is one of the largest independent providers of OCTG connection technology, including premium connections.
Market leading position in the US. Strong portfolio of patented and unpatented technology.
Hunting Dearborn is a world leader in the deep drilling of high grade, non-magnetic components. As a Group, Hunting has the ability to produce fully integrated advanced downhole tools and equipment, manufactured, assembled and tested to the customer’s specifications using its proprietary know-how.
Leaders in progressive cavity, positive displacement mud motors.
Hunting offers a comprehensive range of tools, including innovative and proprietary technologies.
For more than 30 years a provider of high quality metal-to-metal sealing hydraulic coupling solutions to operate in the harshest environments with a strong, long-term patent base.
GLOBAL OPERATING PRESENCE
OUR OPER ATIONS AND MARKETSPAGES 16 AND 17
Hunting has extensive machining capacity in the US, Canada, Europe, Asia and Africa.
Manufacturing centres in the US, Canada, Mexico and China. Distribution centres in the US, Canada, UK and Asia.
US, Asia. US. US, Canada, Europe, Asia, Middle East.
US.
RELATED STRATEGIC FOCUS AREAS
OUR STR ATEGYPAGES 20 AND 21
New products – develop the full WEDGE-LOCK™ range, complete the production and test facility at Ameriport, US.
Enhance existing capacity, lean manufacturing – new threading facility at Ameriport, US.
Develop global presence – establishing presence in Africa.
Sales synergies – enhancing European distribution network.
Develop global presence – developing sales organisation in Australia.
New products – H-1 perforating system.
Develop global presence – AMG facility established in Singapore.
Enhance existing capacity – Dearborn campus expansion.
Cost control – closure of Canadian operations in 2015.
Develop global presence – developing operating presence in Africa, enhancing presence in Asia.
New products – lightweight pressure control equipment system.
New products – extreme high pressure/high temperature subsea tree hydraulic coupling.
RELATED PRINCIPAL RISKS
MORE INFORMATION ON RISK PAGES 26 TO 29
Commodity prices, Shale drilling, Competition, Product quality.
Commodity prices, Shale drilling.
Commodity prices, Competition, Product quality.
Commodity prices, Shale drilling.
Commodity prices. Commodity prices, Product quality.

REVENUE
1
2
31
2
3
UNDERLYING PROFIT FROM OPERATIONS
1
2
3
AVERAGE NUMBER OF EMPLOYEES
Hunting PLC2015 Annual Report and Accounts
14
WELL INTERVENTIONWell intervention occurs while a well is in production to enable the flow to be maintained and to operate
efficiently. In this segment Hunting supplies intervention tools to be
used downhole and provides hydraulic subsea equipment.
WELL CONSTRUCTIONThe well construction phase
includes all activities related to setting up the infrastructure of the wellbore. Hunting supplies OCTG,
AMG and Drilling Tool products from this segment.
WELL COMPLETIONWell completion is the process
of initiating the flow of hydrocarbons to the surface. Hunting supplies OCTG and Titan products from
this segment.
1. WELL CONSTRUCTION
$211.4m2014 – $378.3m
1. WELL CONSTRUCTION
$1.9m2014 – $53.0m
1. WELL CONSTRUCTION
8662014 – 1,081
2. WELL COMPLETION
$488.6m2014 – $862.6m
2. WELL COMPLETION
$14.2m2014 – $140.8m
2. WELL COMPLETION
1,8772014 – 2 ,237
3. WELL INTERVENTION
$106.3m2014 – $135.5m
3. WELL INTERVENTION
$4.6m2014 – $23.8m
3. WELL INTERVENTION
4992014 – 483
OIL AND GAS EXTRACTIONFOCUS ON THE WELLBORE.
OUR BUSINESS MODELCONTINUED
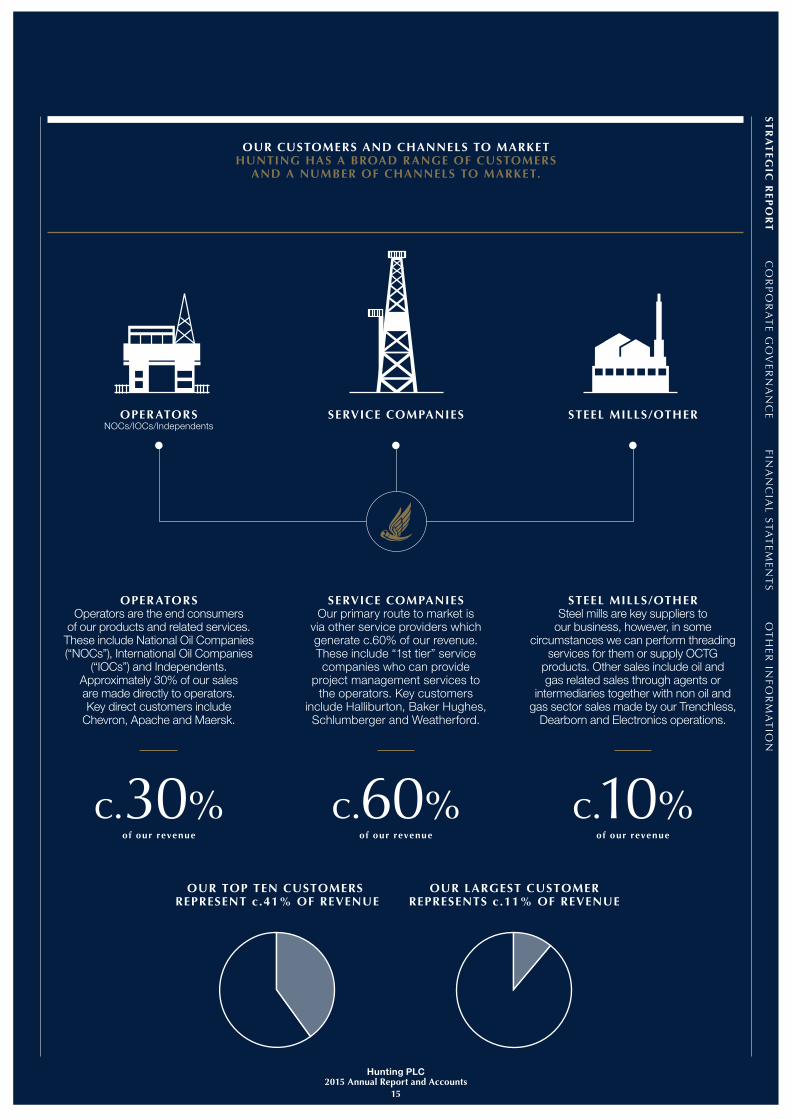
OUR TOP TEN CUSTOMERS REPRESENT c.41% OF REVENUE
OUR LARGEST CUSTOMERREPRESENTS c.11% OF REVENUE
ST
RA
TE
GIC
RE
PO
RT
CO
RP
OR
AT
E G
OV
ERN
AN
CE
FIN
AN
CIA
L S
TA
TE
MEN
TS
OT
HER
INF
OR
MA
TIO
N
Hunting PLC2015 Annual Report and Accounts
15
OPERATORSOperators are the end consumers
of our products and related services. These include National Oil Companies (“NOCs”), International Oil Companies
(“IOCs”) and Independents. Approximately 30% of our sales are made directly to operators. Key direct customers include
Chevron, Apache and Maersk.
SERVICE COMPANIESOur primary route to market is
via other service providers which generate c.60% of our revenue. These include “1st tier” service companies who can provide
project management services to the operators. Key customers
include Halliburton, Baker Hughes, Schlumberger and Weatherford.
STEEL MILLS/OTHERSteel mills are key suppliers to
our business, however, in some circumstances we can perform threading
services for them or supply OCTG products. Other sales include oil and gas related sales through agents or
intermediaries together with non oil and gas sector sales made by our Trenchless,
Dearborn and Electronics operations.
OPERATORSNOCs/IOCs/Independents
SERVICE COMPANIES STEEL MILLS/OTHER
c.30%of our revenue
c.60%of our revenue
c.10%of our revenue
OUR CUSTOMERS AND CHANNELS TO MARKETHUNTING HAS A BROAD RANGE OF CUSTOMERS
AND A NUMBER OF CHANNELS TO MARKET.

1
2
34
5
1. US2. Canada3. Europe4. Middle East, Africa and Other5. Asia Paci�c
Hunting PLC2015 Annual Report and Accounts
16
OUR BUSINESS MODELCONTINUED
OUR OPERATIONS AND MARKETSOUR BUSINESSES NEED TO BE CLOSE TO OUR CUSTOMERS AND ARE THEREFORE BASED
IN OR NEAR THE MAIN OIL AND GAS PRODUCING REGIONS.
$810.5m
US
$511.2mREVENUE
2,032AVERAGE EMPLOYEES
21OPERATING SITES
1,707kSQUARE FEET
22DISTRIBUTION CENTRES
302kSQUARE FEET
The US is our primary market and has the broadest product portfolio. Our products are used both onshore and in the Gulf of Mexico. The US has the highest profitability due to benefits of scale, the impact of the Hunting Titan product lines and a higher use of proprietary technologies. Through the Hunting Titan acquisition in 2011 a broad distribution network is available and synergies are now being found with other product lines.
GLOBAL REVENUE CANADA
$56.1mREVENUE
180AVERAGE EMPLOYEES
1OPERATING SITE
96kSQUARE FEET
9DISTRIBUTION CENTRES
66kSQUARE FEET
The Canadian market is highly seasonal and can be impacted by prevailing weather conditions. Many oil and gas projects in the region are based on tar sands/heavy oil and have high break-even costs, therefore making the market sensitive to changes in global commodity prices.
Unconventional oil and gas basin
Key Operating Locations
Conventional oil and gas basin
ST
RA
TE
GIC
RE
PO
RT
CO
RP
OR
AT
E G
OV
ERN
AN
CE
FIN
AN
CIA
L S
TA
TE
MEN
TS
OT
HER
INF
OR
MA
TIO
N
Hunting PLC2015 Annual Report and Accounts
17
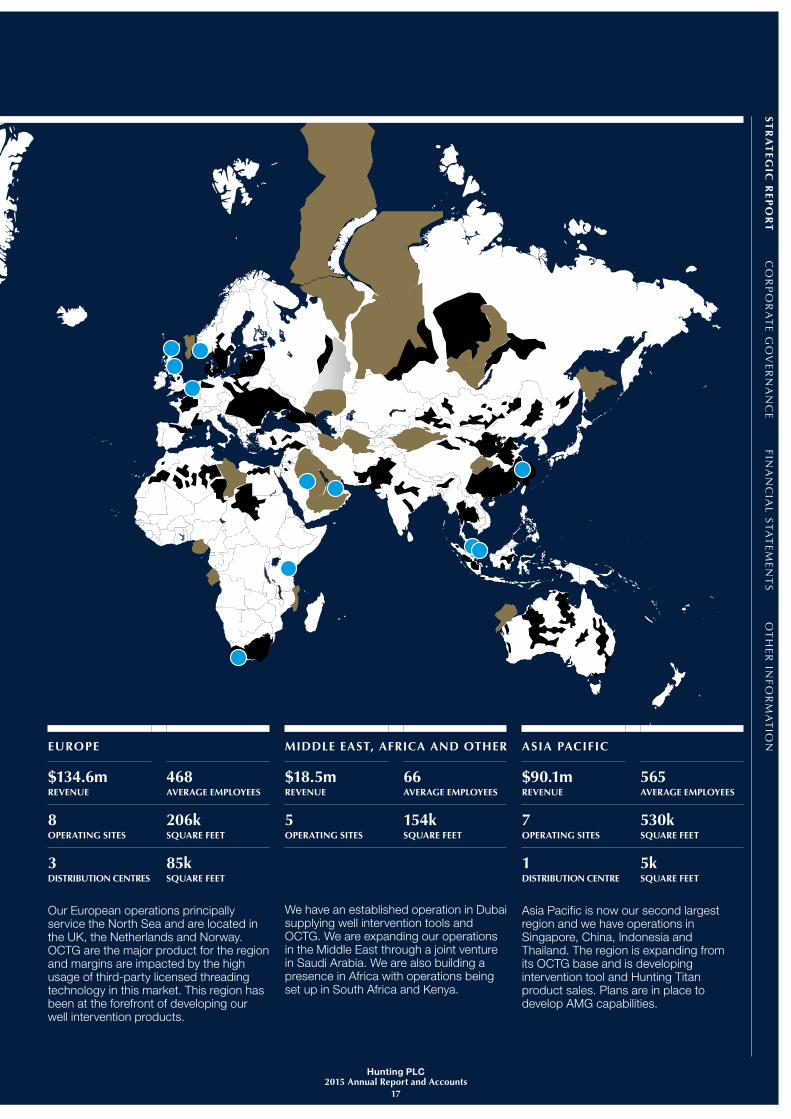
EUROPE
$134.6mREVENUE
468AVERAGE EMPLOYEES
8OPERATING SITES
206kSQUARE FEET
3DISTRIBUTION CENTRES
85kSQUARE FEET
Our European operations principally service the North Sea and are located in the UK, the Netherlands and Norway. OCTG are the major product for the region and margins are impacted by the high usage of third-party licensed threading technology in this market. This region has been at the forefront of developing our well intervention products.
ASIA PACIFIC
$90.1mREVENUE
565AVERAGE EMPLOYEES
7OPERATING SITES
530kSQUARE FEET
1DISTRIBUTION CENTRE
5kSQUARE FEET
Asia Pacific is now our second largest region and we have operations in Singapore, China, Indonesia and Thailand. The region is expanding from its OCTG base and is developing intervention tool and Hunting Titan product sales. Plans are in place to develop AMG capabilities.
MIDDLE EAST, AFRICA AND OTHER
$18.5mREVENUE
66AVERAGE EMPLOYEES
5OPERATING SITES
154kSQUARE FEET
We have an established operation in Dubai supplying well intervention tools and OCTG. We are expanding our operations in the Middle East through a joint venture in Saudi Arabia. We are also building a presence in Africa with operations being set up in South Africa and Kenya.
Hunting PLC2015 Annual Report and Accounts
18
Hunting PLC2015 Annual Report and Accounts
19
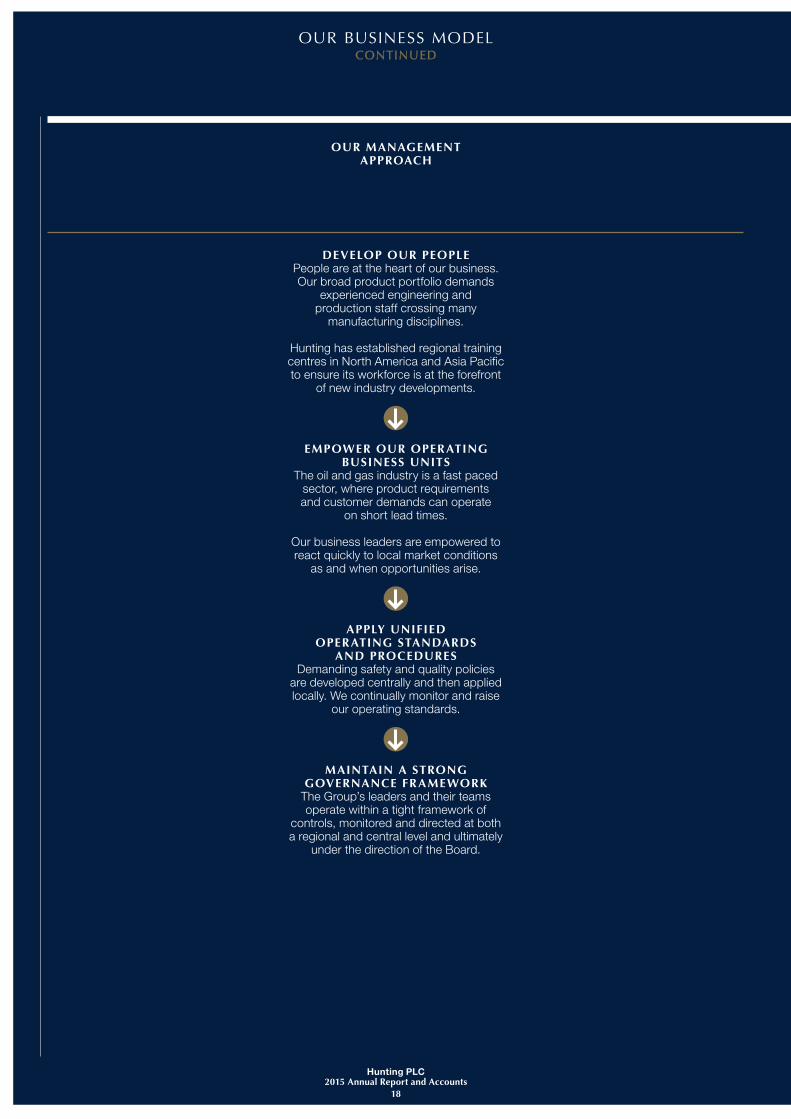
OUR MANAGEMENT APPROACH
OUR BUSINESS MODELCONTINUED
DEVELOP OUR PEOPLE People are at the heart of our business. Our broad product portfolio demands
experienced engineering and production staff crossing many
manufacturing disciplines.
Hunting has established regional training centres in North America and Asia Pacific to ensure its workforce is at the forefront
of new industry developments.
EMPOWER OUR OPERATING BUSINESS UNITS
The oil and gas industry is a fast paced sector, where product requirements and customer demands can operate
on short lead times.
Our business leaders are empowered to react quickly to local market conditions
as and when opportunities arise.
APPLY UNIFIED OPERATING STANDARDS
AND PROCEDURESDemanding safety and quality policies
are developed centrally and then applied locally. We continually monitor and raise
our operating standards.
MAINTAIN A STRONG GOVERNANCE FRAMEWORK
The Group’s leaders and their teams operate within a tight framework of
controls, monitored and directed at both a regional and central level and ultimately
under the direction of the Board.
Hunting PLC2015 Annual Report and Accounts
19
CO
RP
OR
AT
E G
OV
ERN
AN
CE
FIN
AN
CIA
L S
TA
TE
MEN
TS
OT
HER
INF
OR
MA
TIO
NS
TR
AT
EG
IC R
EP
OR
T
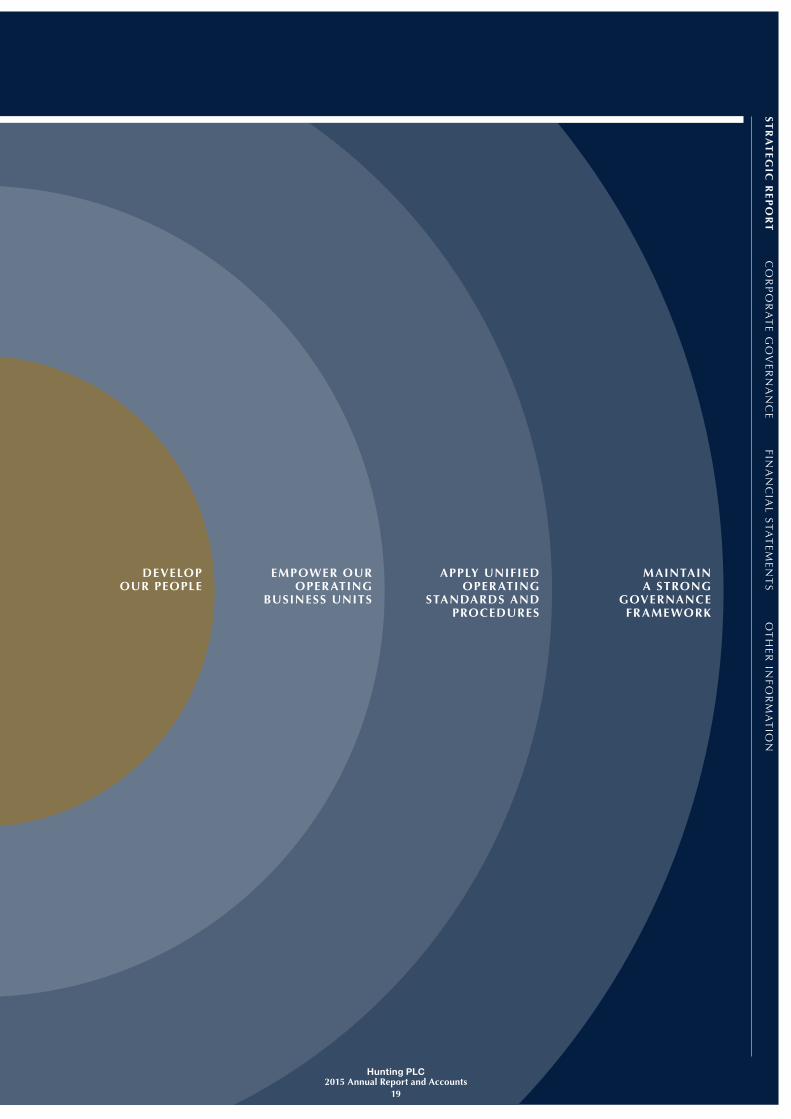
DEVELOP OUR PEOPLE
APPLY UNIFIED OPERATING
STANDARDS AND PROCEDURES
EMPOWER OUR OPERATING
BUSINESS UNITS
MAINTAIN A STRONG
GOVERNANCE FRAMEWORK

Hunting PLC2015 Annual Report and Accounts
20
OUR BUSINESS STRATEGY
HUNTING’S STRATEGIC PRIORITIES ARE BASED ON A BUSINESS MODEL DESIGNED TO DELIVER SUSTAINABLE
LONG-TERM SHAREHOLDER VALUE WHILE RECOGNISING OUR CORPORATE RESPONSIBILITIES.
STRATEGIC PRIORITY STRATEGIC FOCUS AREAS 2015 PROGRESS RELATED KPI s RELATED RISKS
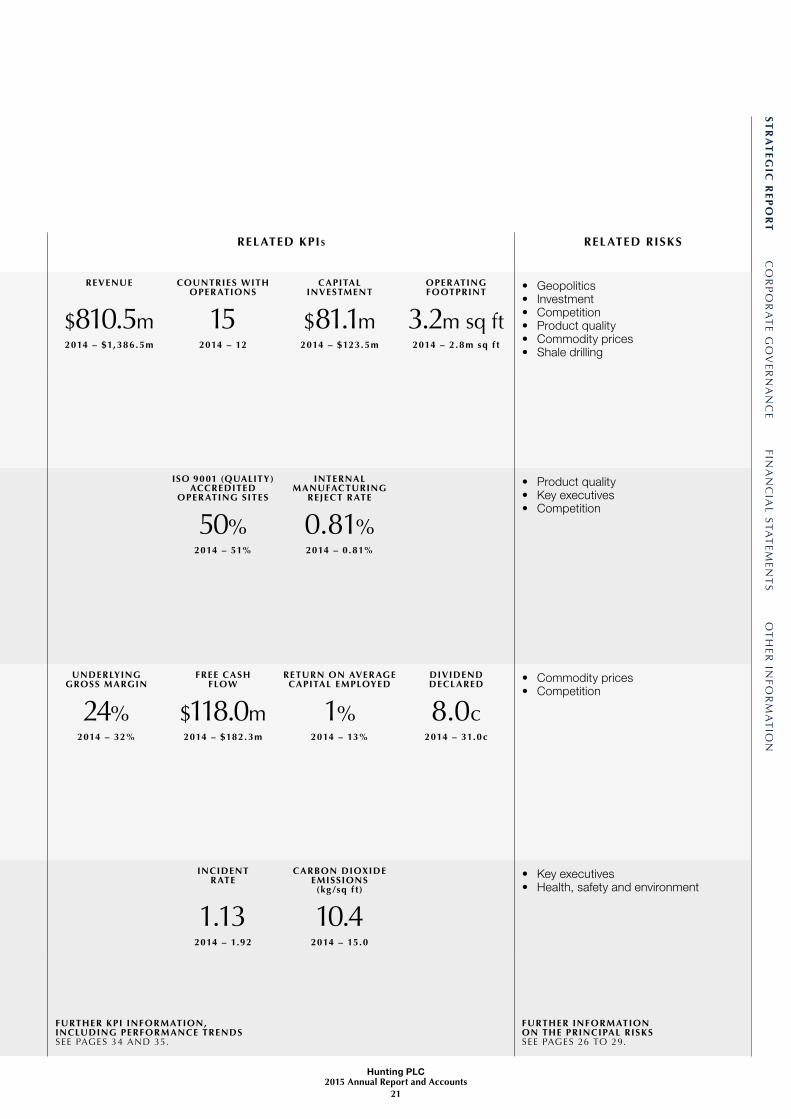
GROWTHOur aim is to continue to develop our global presence and supply a comprehensive range of products for use in the wellbore. We will grow through capital investment in existing businesses and through acquisitions.
• Extend global presence. • Acquire complementary businesses. • Enhance existing capacity. • Develop new products.
• New facility in Cape Town, South Africa, became operational.
• Joint venture in Saudi Arabia established and trading commenced.
• Expansion at Houma, US, completed, to serve the Gulf of Mexico.
• Final commissioning of premium connection and test facility commenced at Ameriport, US, in December.
• AMG operation established in Singapore.
REVENUE
$810.5m2014 – $1,386.5m
COUNTRIES WITH OPER ATIONS
152014 – 12
CAPITAL INVESTMENT
$81.1m2014 – $123.5m
OPER ATING FOOTPRINT
3.2m sq ft2014 – 2 .8m sq f t
• Geopolitics • Investment • Competition • Product quality • Commodity prices • Shale drilling
OPERATIONAL EXCELLENCEWe operate in a highly competitive and cyclical sector which is high profile and strongly regulated. To be successful we must deliver high quality and reliable products and services cost effectively.
• Leverage strong brand. • Enhance quality control. • Maintain operational flexibility. • Leverage lean manufacturing. • Increase strong relationships with
customers and suppliers.
• Global supply arrangements being negotiated with key customers.
• Development of Hunting Titan H-1 perforating system which will increase safety and reduce on site assembly times.
• WEDGE-LOCK™ premium connections being sold in commercial volumes, additional sizes being developed.
• Product catalogues rationalised and consistent Hunting branding applied.
ISO 9001 (QUALITY) ACCREDITED
OPER ATING SITES
50%2014 – 51%
INTERNALMANUFACTURING
REJECT R ATE
0.81%2014 – 0.81%
• Product quality • Key executives • Competition
STRONG RETURNSIn normal phases of the oil and gas cycle our business has the capability to produce high levels of profitability, strong cash generation, growing dividends for shareholders and good returns on capital.
• Introduce new and proprietary products.
• Develop sales synergies. • Increase market share. • Maintain close cost control.
• Returns in 2015 were adversely impacted by the significant downturn in activity levels.
• Cost reduction programmes have been implemented with staffing levels reduced by 30% resulting in annualised savings.
• Four operating sites have been closed as part of the rationalisation as new sites have become active.
• Three distribution centres are shortly to be closed within Hunting Titan as a result of the downturn.
UNDERLYING GROSS MARGIN
24%2014 – 32%
FREE CASH FLOW
$118.0m2014 – $182.3m
RETURN ON AVER AGE CAPITAL EMPLOYED
1%2014 – 13%
DIVIDEND DECLARED
8.0c2014 – 31.0c
• Commodity prices • Competition
CORPORATE RESPONSIBILITYWe are committed to act with high standards of integrity and to create positive, long-lasting relationships with our customers, suppliers, employees and the wider communities in which we operate.
• Retain experienced senior management team.
• Skilled workforce. • Safe operations. • Protect the environment. • Compliance.
• Awards granted under Hunting PSP. • Implementing new legislative
requirements. • Environmental initiatives implemented
at new facilities.
INCIDENT R ATE
1.132014 – 1.92
CARBON DIOXIDE EMISSIONS
(kg /sq f t )
10.42014 – 15.0
• Key executives • Health, safety and environment
FURTHER KPI INFORMATION, INCLUDING PERFORMANCE TRENDS SEE PAGES 34 AND 35.
FURTHER INFORMATION ON THE PRINCIPAL RISKS SEE PAGES 26 TO 29.
ST
RA
TE
GIC
RE
PO
RT
CO
RP
OR
AT
E G
OV
ERN
AN
CE
FIN
AN
CIA
L S
TA
TE
MEN
TS
OT
HER
INF
OR
MA
TIO
N
Hunting PLC2015 Annual Report and Accounts
21
STRATEGIC PRIORITY STRATEGIC FOCUS AREAS 2015 PROGRESS RELATED KPI s RELATED RISKS
GROWTHOur aim is to continue to develop our global presence and supply a comprehensive range of products for use in the wellbore. We will grow through capital investment in existing businesses and through acquisitions.
• Extend global presence. • Acquire complementary businesses. • Enhance existing capacity. • Develop new products.
• New facility in Cape Town, South Africa, became operational.
• Joint venture in Saudi Arabia established and trading commenced.
• Expansion at Houma, US, completed, to serve the Gulf of Mexico.
• Final commissioning of premium connection and test facility commenced at Ameriport, US, in December.
• AMG operation established in Singapore.
REVENUE
$810.5m2014 – $1,386.5m
COUNTRIES WITH OPER ATIONS
152014 – 12
CAPITAL INVESTMENT
$81.1m2014 – $123.5m
OPER ATING FOOTPRINT
3.2m sq ft2014 – 2 .8m sq f t
• Geopolitics • Investment • Competition • Product quality • Commodity prices • Shale drilling
OPERATIONAL EXCELLENCEWe operate in a highly competitive and cyclical sector which is high profile and strongly regulated. To be successful we must deliver high quality and reliable products and services cost effectively.
• Leverage strong brand. • Enhance quality control. • Maintain operational flexibility. • Leverage lean manufacturing. • Increase strong relationships with
customers and suppliers.
• Global supply arrangements being negotiated with key customers.
• Development of Hunting Titan H-1 perforating system which will increase safety and reduce on site assembly times.
• WEDGE-LOCK™ premium connections being sold in commercial volumes, additional sizes being developed.
• Product catalogues rationalised and consistent Hunting branding applied.
ISO 9001 (QUALITY) ACCREDITED
OPER ATING SITES
50%2014 – 51%
INTERNALMANUFACTURING
REJECT R ATE
0.81%2014 – 0.81%
• Product quality • Key executives • Competition
STRONG RETURNSIn normal phases of the oil and gas cycle our business has the capability to produce high levels of profitability, strong cash generation, growing dividends for shareholders and good returns on capital.
• Introduce new and proprietary products.
• Develop sales synergies. • Increase market share. • Maintain close cost control.
• Returns in 2015 were adversely impacted by the significant downturn in activity levels.
• Cost reduction programmes have been implemented with staffing levels reduced by 30% resulting in annualised savings.
• Four operating sites have been closed as part of the rationalisation as new sites have become active.
• Three distribution centres are shortly to be closed within Hunting Titan as a result of the downturn.
UNDERLYING GROSS MARGIN
24%2014 – 32%
FREE CASH FLOW
$118.0m2014 – $182.3m
RETURN ON AVER AGE CAPITAL EMPLOYED
1%2014 – 13%
DIVIDEND DECLARED
8.0c2014 – 31.0c
• Commodity prices • Competition
CORPORATE RESPONSIBILITYWe are committed to act with high standards of integrity and to create positive, long-lasting relationships with our customers, suppliers, employees and the wider communities in which we operate.
• Retain experienced senior management team.
• Skilled workforce. • Safe operations. • Protect the environment. • Compliance.
• Awards granted under Hunting PSP. • Implementing new legislative
requirements. • Environmental initiatives implemented
at new facilities.
INCIDENT R ATE
1.132014 – 1.92
CARBON DIOXIDE EMISSIONS
(kg /sq f t )
10.42014 – 15.0
• Key executives • Health, safety and environment
FURTHER KPI INFORMATION, INCLUDING PERFORMANCE TRENDS SEE PAGES 34 AND 35.
FURTHER INFORMATION ON THE PRINCIPAL RISKS SEE PAGES 26 TO 29.

Hunting PLC2015 Annual Report and Accounts
22
RISK MANAGEMENT
RISK MANAGEMENT ROLES & RESPONSIBILITIES
THE BOARD HAS DEFINED RISK MANAGEMENT ROLES AND RESPONSIBILITIES AS ILLUSTRATED BELOW.
ASSURANCE – INTERNAL AUDIT DEPARTMENT AND
EXTERNAL AUDITORSReviews internal controls and
risk management processes for their existence, relevance and
effectiveness. Actions are recommended and graded in
terms of importance and timeliness for change.
LOCAL MANAGEMENT • Ensures Group policies and procedures are applied • Manages locally controlled risks
BOARD • Determines the Group’s risk appetite and culture • Sets the risk management framework • Ensures the risk management processes and internal
controls are effective
AUDIT COMMITTEE • Controls the Group’s risk management processes • Reviews business risks • Gains assurance that the risk management processes
and controls are effective
CENTRAL & REGIONAL MANAGEMENT • Establishes detailed Group policies and procedures • Manages centrally controlled risks • Reviews local business risks

ST
RA
TE
GIC
RE
PO
RT
CO
RP
OR
AT
E G
OV
ERN
AN
CE
FIN
AN
CIA
L S
TA
TE
MEN
TS
OT
HER
INF
OR
MA
TIO
N
Hunting PLC2015 Annual Report and Accounts
23
The oil and gas industry is tightly regulated and demands high specification products, which meet stringent quality criteria, given the challenging environments in which these products are used. Hunting’s risk management and internal control processes are therefore designed to appropriately mitigate the risks inherent by operating in this sector while allowing the Group to achieve its strategic objectives and deliver value to shareholders.
The BoardThe Board of Hunting has responsibility for developing and maintaining a robust risk management framework and for monitoring the Group’s system of internal control to ensure it is effective. The Board is also responsible for developing the Group’s strategic objectives. The balance between the Board’s desire to meet these strategic objectives and its appetite for risk creates the risk culture within the Group.
The Board’s appetite for risk is key to establishing an effective system of internal control and risk management processes. By appreciating the contributory factors that generate a particular risk and the benefits earned from the exposure to that risk, the Board establishes, through debate and delegation, the extent to which the risk should be mitigated and at what cost to the Group. The Board for example has little appetite for high levels of exposure to geopolitical risk and consequently the Group’s expansion strategy has avoided countries that are considered to be significantly unstable or too high risk to maintain a physical presence notwithstanding the potential benefits that may be generated.
Advice on risk management is sought by the Board from both internal and external sources. The risk management processes are further supported by:
• understanding the current and evolving market environment; • challenging executive management on new growth
opportunities; • reviewing proposed new product developments and capital
investment projects.
Audit CommitteeOn behalf of the Board, the Audit Committee establishes and carries out risk management processes within the framework set out by the Board. As part of this, the Audit Committee conducts a formal review of the Group’s business risk reporting three times a year. In addition, once a year, the Audit Committee seeks assurance with regard to the effectiveness of the internal financial controls based on a self-assessment exercise carried out by local management.
The Internal Audit department reports directly to the Audit Committee, further details of which are contained within the Audit Committee Report. The relationship with external audit is also controlled by the Audit Committee, including the annual review of effectiveness.
Central and Regional ManagementHunting requires that all Group business units operate in accordance with the Hunting Group Manual which sets out Group policies and procedures, together with related authority levels, and identifies matters requiring approval or notification to Hunting or the Board. Included within the Group Manual are policies covering a range of areas including general finance requirements, taxation responsibilities, information on Hunting’s internal control and risk management framework and governance. Compliance is also monitored and subject to scrutiny by the internal audit function.
Central and regional management are responsible for ensuring the risk management processes established by the Audit Committee are implemented across the Group. Central management is also responsible for managing group-wide treasury related risks such as currency and interest rate exposures and managing the global insurance programme.
Local ManagementThe management of each business unit has the responsibility of establishing an effective system of controls and processes for their business which, at a minimum, meets the requirements set out in the Group Manual and complies with any additional local requirements. Local management is empowered under Hunting’s de-centralised philosophy to manage the risks in their market.
AssuranceThe Board use a number of functions and reporting procedures to provide assurance that the risks identified by management are appropriate and proportionate for the Group as a whole.
Hunting’s internal audit function covers the Group’s businesses addressing the following operational areas, raising control improvement recommendations where necessary:
• inventory management; • purchasing supply chain; • large project risk; • IT controls; • customer credit risk; • ethics compliance, including bribery and corruption.
The Group’s risk management processes are further supported by an internal Quality Assurance department that is headed by a HS&E and Quality Assurance Director who reports directly to the Chief Executive. This department also undertakes periodic audits that monitor quality control within the Group’s product lines.
Hunting also receives guidance from a number of external advisers. In particular, guidance from the Group’s principal insurance broker has been implemented throughout the business units that further strengthen the Group’s credit management processes.
Hunting’s external auditors provide assurance to the Board of the accuracy and probity of Hunting’s financial statements. The auditor also reviews all of Hunting’s non-financial statements, including governance disclosures and provides recommendations on the financial controls in operation across the Group.
Hunting’s legal advisers assist in ensuring that Hunting is compliant with the UKLA’s Listing Rules, Disclosure and Transparency Rules, UK Company Law and that there is an understanding across the Group of the obligations under sanctions legislation. Additionally Hunting relies on market and investor advice from its corporate brokers and financial advisers.
The Board is satisfied that the above sources of assurance have sufficient authority, independence and expertise to enable them to provide objective advice and information to the Board.

Hunting PLC2015 Annual Report and Accounts
24
RISK MANAGEMENTCONTINUED
RISK MANAGEMENT PROCEDURESTHE BOARD HAS REVIEWED ITS RISK MANAGEMENT
AND INTERNAL CONTROL PROCEDURES AND CONFIRMS THAT THE PROCEDURES IN PLACE ARE
ROBUST AND PROPORTIONATE TO HUNTING’S GLOBAL OPERATIONS AND POSITION IN ITS CHOSEN MARKET.
Hunting’s internal control system, which has been in place throughout 2015 and up to the date of approval of these accounts, is an ongoing evolutionary process designed to identify, evaluate and manage the significant risks to which the Group is exposed.
This system of internal control is designed to manage rather than eliminate risks, therefore it can only provide reasonable, but not absolute, assurance against material misstatement or loss in the financial statements and of meeting internal control objectives.
The Directors have reviewed the effectiveness of the Group’s system of internal control and have taken into account feedback from the Audit Committee for the period covered by the financial statements.
The key elements of Hunting’s internal control system are as follows:
Business Risk ReportingThree times a year, local management formally reviews the specific risks faced by their businesses, based on current trading, future prospects and the local market environment. The review is a qualitative assessment of the likelihood of a risk materialising and the probable financial impact if such an event were to arise. All assessments are performed on a pre- and post-controls basis, which allows management to continually assess the effectiveness of its internal controls with separate regard to mitigating the likelihood of occurrence and the probable financial impact. The risks are reported to central management. The local risks that have the greatest potential impact on the Group are identified from these assessments and incorporated into the Group Risk Register, which is also reviewed by the Audit Committee three times a year. An appropriate Director, together with local management, is allotted responsibility to manage each separate risk identified in the Group Risk Register.
Financial Controls Self-assessmentLocal management completes an annual self-assessment of the financial controls in place at their business units. The assessment is qualitative and is undertaken in context with the recommended controls identified within the Group Manual. Gaps between the recommended controls and those in place are assessed and improvements are actioned within a targeted time frame when these are identified as a necessary requirement. Results of the assessments are summarised and presented to the Audit Committee.
Reporting and ConsolidationAll subsidiaries submit detailed financial information in accordance with a pre-set reporting timetable. This includes weekly, bi-monthly and quarterly treasury reports, monthly management accounts, annual budgets covering a two-year time frame, together with half-year and annual statutory reporting. The Group’s consolidation process is maintained and updated with regular communication, including distribution of a Group Manual to all reporting units. All data is subject to review and assessment by management through the monitoring of key performance ratios and comparison to targets and budgets. The Group monitors and reviews new UK Listing Rules, Disclosure and Transparency Rules, accounting standards, interpretations and amendments and legislation and other statutory requirements.
Strategic Planning and BudgetingStrategic plans, annual budgets and long-term viability financial projections are formally presented to the Board for adoption and approval and form the basis for monitoring performance. These are supported by regularly updated forecasts that project for a 12-month period beyond the date of preparation.
Quality Assurance Most of the business sectors within which the Group operates are highly regulated and subsidiaries are invariably required to be accredited, by the customer or an industry regulator, to national or international quality organisations. These organisations undertake regular audits and checks on subsidiary procedures and practices ensuring compliance with regulatory requirements.
Health, Safety and Environment (“HS&E”) All facilities have designated HS&E personnel appointed to ensure the Group’s policies and procedures are adopted and adhered to. All local HS&E personnel report to the Group’s HS&E and Quality Assurance Director who in turn reports to the Chief Executive. All facilities arrange regular training and review sessions to ensure day to day risks are managed and eliminated and shared with the wider work force.
Capital Investment and Divestment All significant capital investment (business acquisitions and asset purchases) and capital divestment are approved by the Chief Executive. Major capital expenditures or divestments require approval by the Board. Detailed compliance and assurance procedures are completed during a capital investment programme and project reviews and appraisals are completed to ensure each capital investment has delivered the forecast value for the Group.
During the year, the Group’s policies and procedures for financial reporting, governance, ethics protocols and other policies, were updated following publication of the revised UK Corporate Governance Code. Updates to the Group’s policies and procedures are communicated to the relevant personnel by way of revisions to the Group Manual issued to all business units.
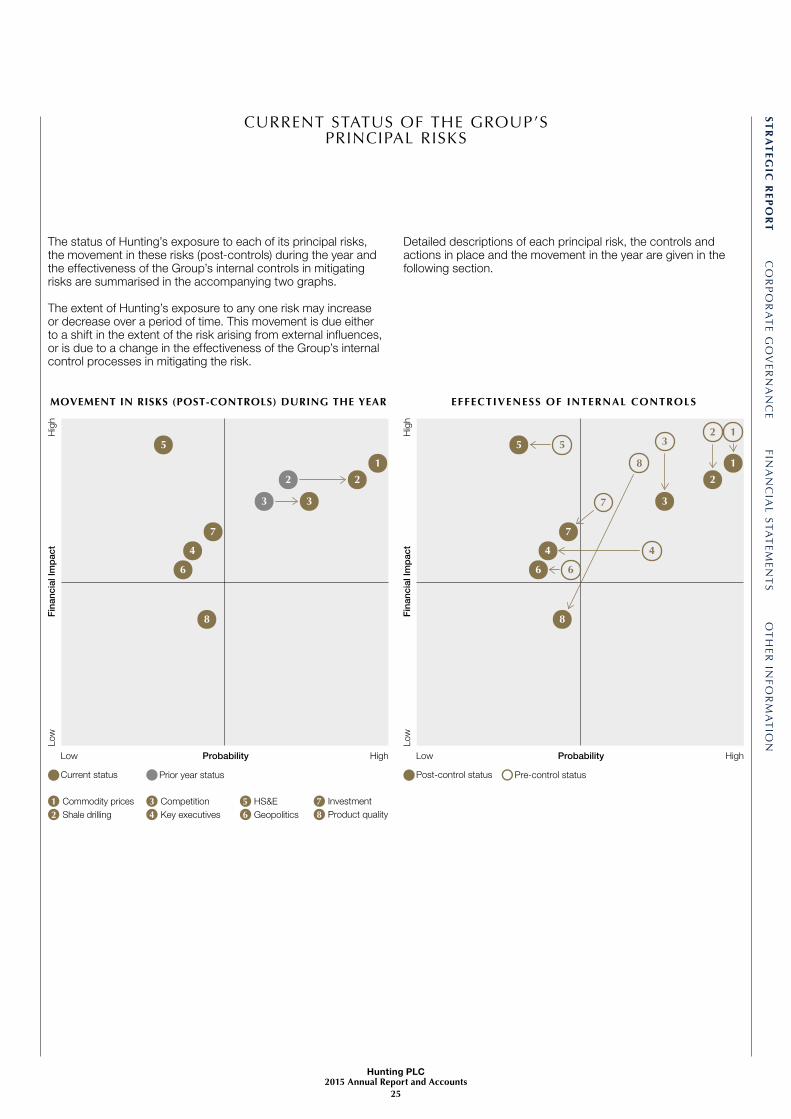
MOVEMENT IN RISKS (POST-CONTROLS) DURING THE YEAR
Hig
hLo
wF
inan
cial
Imp
act
HighLow Probability
5
6
8
33
22
1
4
7
1 Commodity prices2 Shale drilling
3 Competition4 Key executives
5 HS&E6 Geopolitics
7 Investment8 Product quality
Current status Prior year status
EFFECTIVENESS OF INTERNAL CONTROLSH
igh
Low
Fin
anci
al Im
pac
t
HighLow Probability
5 5
6 6
8
8
3
3
2
2
1
1
4 4
7
7
Post-control status Pre-control status
ST
RA
TE
GIC
RE
PO
RT
CO
RP
OR
AT
E G
OV
ERN
AN
CE
FIN
AN
CIA
L S
TA
TE
MEN
TS
OT
HER
INF
OR
MA
TIO
N
Hunting PLC2015 Annual Report and Accounts
25
CURRENT STATUS OF THE GROUP’S PRINCIPAL RISKS
The status of Hunting’s exposure to each of its principal risks, the movement in these risks (post-controls) during the year and the effectiveness of the Group’s internal controls in mitigating risks are summarised in the accompanying two graphs.
The extent of Hunting’s exposure to any one risk may increase or decrease over a period of time. This movement is due either to a shift in the extent of the risk arising from external influences, or is due to a change in the effectiveness of the Group’s internal control processes in mitigating the risk.
Detailed descriptions of each principal risk, the controls and actions in place and the movement in the year are given in the following section.

Hunting PLC2015 Annual Report and Accounts
26
RISK MANAGEMENTCONTINUED
PRINCIPAL RISKSTHE GROUP’S PRINCIPAL RISKS ARE IDENTIFIED BELOW. WHILE WE HAVE PRESENTED THESE AS
SEPARATELY IDENTIFIED RISKS, DISCRETE EVENTS WILL OFTEN AFFECT MULTIPLE RISKS AND THIS IS
CONSIDERED BY THE BOARD WHEN ASSESSING THE IMPACT ON THE GROUP.
1. COMMODITY PRICES 2. SHALE DRILLING 3. COMPETITION 4. KEY EXECUTIVES
MOVEMENT IN THE YEAR Hunting’s exposure to this risk remains as high as last year due to the low activity levels as a result of low commodity prices.
MOVEMENT IN THE YEAR Shale drilling activity has experienced a significant slowdown during 2015 due to the protracted decline in oil and gas prices. Consequently the Group’s risk exposure increased during the year.
MOVEMENT IN THE YEAR During the year, the Group’s competitors did not introduce new products or processes or open new sites that would threaten Hunting’s local operations. However, due to the tough trading conditions, competitors have submitted to customer pressure and have reduced prices, often substantially. This has increased pressure from Hunting’s own customer base and pricing has been amended in local markets. Consequently this risk has heightened during the year.
MOVEMENT IN THE YEAR Changes have arisen during 2015 at the senior management level with all vacated positions being filled by competent individuals who are anticipated to proactively contribute to the success of the Group.
Due to the small turnover of key personnel, the Board has assessed the risk of losing key executives as unchanged from last year.
Nature of the RiskHunting is exposed to the influence of oil and gas prices as the supply and demand for energy is a key driver of demand for Hunting’s products.
Oil and gas exploration companies may reduce or curtail operations if prices become, or are expected to become, uneconomical and therefore continuation of prices above these levels is critical to the industry and the financial viability of the Hunting Group.
Adverse movements in commodity prices may also heighten the Group’s exposure to the risks associated with shale drilling (see the risks associated with shale drilling).
Nature of the RiskThe Group provides products to the oil and gas shale drilling industry. Although it is now an established industry in the US, significant sections of the public continue to view this activity as high risk and any consequent moratorium or new laws may unfavourably impact the industry.
In addition, oil and gas produced from shale is a relatively expensive source of hydrocarbons. Consequently, shale drilling is more sensitive to a decline in commodity prices compared with conventional sources and is more likely to be curtailed (see the risks associated with commodity prices).
Nature of the RiskThe provision of goods and services to the oil and gas drilling companies is highly competitive. In current market conditions there are considerable pressures to reduce prices. Competitors may also be customers and/or suppliers which can increase the risk of any potential impact.
Technological advancements in the oil and gas industry continue at pace and failure to keep ahead will result in lost revenues and market share.
Nature of the RiskThe Group is highly reliant on the continued service of its key executives and senior management, who possess commercial, engineering, technical and financial skills that are critical to the success of the Group.
Controls and Actions Working capital, and in particular inventory levels, are closely managed to ensure the Group remains sufficiently adaptable to meet changes in demand.
The Group maintains three operating platforms: the Well Construction and Well Completion segments expect to benefit when exploration companies are active in their drilling operations, and the Well Intervention segment benefits when wells are subject to maintenance or require testing or repair work.
The decline in oil and gas prices over the last 18 months has impacted the industry worldwide. Management has sought to mitigate the impact by introducing a number of cost reduction programmes throughout the Group and continues to adapt the business to meet new challenges generated by the current trading environment.
Controls and Actions The Board monitors public and political opinion and maintains an awareness of the potential for changes to legislation especially with regard to the US where the Group is mainly exposed.
The Group maintains a diverse portfolio of products that extends beyond supplying the shale drilling industry, including products for conventional drilling and the manufacture of high precision and advanced technology components for both the onshore and offshore markets.
Many of the Group’s facilities have the flexibility to re-configure their manufacturing processes to meet a change in the pattern of demand.
Controls and Actions Hunting has a number of high specification proprietary products that offer operational advantages to its customers. The Group continually invests in research and development that enables it to provide a strong product offering and technological advancement.
Hunting’s operations are established close to their markets which enables the Group to offer reduced lead times and a focused product range appropriate to each region.
Local management maintains an awareness of competitor pricing and product offering. In addition, senior management maintains close relationships with key customers and seeks to maintain the highest level of service to preserve Hunting’s reputation for quality.
The Group has a wide customer base that includes many of the major oil and gas service providers and no one customer represents an overly significant portion of Group revenue.
Controls and Actions Remuneration packages are regularly reviewed to ensure that key executives are remunerated in line with market rates. External consultants are regularly engaged to provide guidance on best practice.
Senior management regularly reviews the availability of the necessary skills within the Group and seek to engage suitable staff where they feel there is vulnerability.
FURTHER INFORMATION ON THE MOVEMENT IN COMMODITY PRICES DURING THE YEAR IS DETAILED ON PAGE 31.
THE GROUP ’S OPER ATING ACTIVITIES ARE DESCRIBED IN DETAIL ON PAGES 9 TO 19.
THE GROUP ’S OPER ATING ACTIVITIES ARE DESCRIBED IN DETAIL ON PAGES 9 TO 19.
DETAILS ON THE KEY EXECUTIVES’ REMUNERATION ARE PROVIDED IN THE REMUNERATION COMMITTEE REPORT ON PAGE 66.

ST
RA
TE
GIC
RE
PO
RT
CO
RP
OR
AT
E G
OV
ERN
AN
CE
FIN
AN
CIA
L S
TA
TE
MEN
TS
OT
HER
INF
OR
MA
TIO
N
Hunting PLC2015 Annual Report and Accounts
27
1. COMMODITY PRICES 2. SHALE DRILLING 3. COMPETITION 4. KEY EXECUTIVES
MOVEMENT IN THE YEAR Hunting’s exposure to this risk remains as high as last year due to the low activity levels as a result of low commodity prices.
MOVEMENT IN THE YEAR Shale drilling activity has experienced a significant slowdown during 2015 due to the protracted decline in oil and gas prices. Consequently the Group’s risk exposure increased during the year.
MOVEMENT IN THE YEAR During the year, the Group’s competitors did not introduce new products or processes or open new sites that would threaten Hunting’s local operations. However, due to the tough trading conditions, competitors have submitted to customer pressure and have reduced prices, often substantially. This has increased pressure from Hunting’s own customer base and pricing has been amended in local markets. Consequently this risk has heightened during the year.
MOVEMENT IN THE YEAR Changes have arisen during 2015 at the senior management level with all vacated positions being filled by competent individuals who are anticipated to proactively contribute to the success of the Group.
Due to the small turnover of key personnel, the Board has assessed the risk of losing key executives as unchanged from last year.
Nature of the RiskHunting is exposed to the influence of oil and gas prices as the supply and demand for energy is a key driver of demand for Hunting’s products.
Oil and gas exploration companies may reduce or curtail operations if prices become, or are expected to become, uneconomical and therefore continuation of prices above these levels is critical to the industry and the financial viability of the Hunting Group.
Adverse movements in commodity prices may also heighten the Group’s exposure to the risks associated with shale drilling (see the risks associated with shale drilling).
Nature of the RiskThe Group provides products to the oil and gas shale drilling industry. Although it is now an established industry in the US, significant sections of the public continue to view this activity as high risk and any consequent moratorium or new laws may unfavourably impact the industry.
In addition, oil and gas produced from shale is a relatively expensive source of hydrocarbons. Consequently, shale drilling is more sensitive to a decline in commodity prices compared with conventional sources and is more likely to be curtailed (see the risks associated with commodity prices).
Nature of the RiskThe provision of goods and services to the oil and gas drilling companies is highly competitive. In current market conditions there are considerable pressures to reduce prices. Competitors may also be customers and/or suppliers which can increase the risk of any potential impact.
Technological advancements in the oil and gas industry continue at pace and failure to keep ahead will result in lost revenues and market share.
Nature of the RiskThe Group is highly reliant on the continued service of its key executives and senior management, who possess commercial, engineering, technical and financial skills that are critical to the success of the Group.
Controls and Actions Working capital, and in particular inventory levels, are closely managed to ensure the Group remains sufficiently adaptable to meet changes in demand.
The Group maintains three operating platforms: the Well Construction and Well Completion segments expect to benefit when exploration companies are active in their drilling operations, and the Well Intervention segment benefits when wells are subject to maintenance or require testing or repair work.
The decline in oil and gas prices over the last 18 months has impacted the industry worldwide. Management has sought to mitigate the impact by introducing a number of cost reduction programmes throughout the Group and continues to adapt the business to meet new challenges generated by the current trading environment.
Controls and Actions The Board monitors public and political opinion and maintains an awareness of the potential for changes to legislation especially with regard to the US where the Group is mainly exposed.
The Group maintains a diverse portfolio of products that extends beyond supplying the shale drilling industry, including products for conventional drilling and the manufacture of high precision and advanced technology components for both the onshore and offshore markets.
Many of the Group’s facilities have the flexibility to re-configure their manufacturing processes to meet a change in the pattern of demand.
Controls and Actions Hunting has a number of high specification proprietary products that offer operational advantages to its customers. The Group continually invests in research and development that enables it to provide a strong product offering and technological advancement.
Hunting’s operations are established close to their markets which enables the Group to offer reduced lead times and a focused product range appropriate to each region.
Local management maintains an awareness of competitor pricing and product offering. In addition, senior management maintains close relationships with key customers and seeks to maintain the highest level of service to preserve Hunting’s reputation for quality.
The Group has a wide customer base that includes many of the major oil and gas service providers and no one customer represents an overly significant portion of Group revenue.
Controls and Actions Remuneration packages are regularly reviewed to ensure that key executives are remunerated in line with market rates. External consultants are regularly engaged to provide guidance on best practice.
Senior management regularly reviews the availability of the necessary skills within the Group and seek to engage suitable staff where they feel there is vulnerability.
FURTHER INFORMATION ON THE MOVEMENT IN COMMODITY PRICES DURING THE YEAR IS DETAILED ON PAGE 31.
THE GROUP ’S OPER ATING ACTIVITIES ARE DESCRIBED IN DETAIL ON PAGES 9 TO 19.
THE GROUP ’S OPER ATING ACTIVITIES ARE DESCRIBED IN DETAIL ON PAGES 9 TO 19.
DETAILS ON THE KEY EXECUTIVES’ REMUNERATION ARE PROVIDED IN THE REMUNERATION COMMITTEE REPORT ON PAGE 66.
No movement in risk
Increase in risk
Decrease in risk

Hunting PLC2015 Annual Report and Accounts
28
RISK MANAGEMENTCONTINUED
PRINCIPAL RISKSCONTINUED
5. HEALTH, SAFETY AND THE ENVIRONMENT (“HS&E”)
6. GEOPOLITICS 7. INVESTMENT 8. PRODUCT QUALITY
MOVEMENT IN THE YEAR The Group experienced a small number of minor HS&E incidents in the year, which is significantly below the industry average and is similar to the Group’s record in prior years. The risks associated with HS&E have therefore not materially changed.
MOVEMENT IN THE YEAR Due to the Group’s already strong presence worldwide, the start up programme in Africa has not had a noticeable impact on the Group’s exposure to geopolitical risk.
MOVEMENT IN THE YEAR During 2015 the Board remained focused on organic expansion and a number of major programmes were completed through the year. No acquisitions were made. The Board continues to assess opportunities for growth and consequently this risk has not changed during the year.
MOVEMENT IN THE YEAR The risk of poor product quality or reliability has remained unchanged during the year with no significant issues raised by the Group’s customers or during the Board’s internal monitoring process.
Nature of the RiskDue to the wide nature of the Group’s activities, it is subject to a relatively high number of HS&E risks and the laws and regulations issued by each of the jurisdictions in which the Group operates.
The Group’s exposure to risk therefore includes the potential for the occurrence of a reportable incident, the financial risk of a breach of HS&E regulations, and the risk of unexpected compliance expenditure whenever a law or regulation is renewed or enhanced.
Nature of the RiskThe locations of the Group’s markets are determined by the location of Hunting’s customers’ drill sites – Hunting’s products must go where the drilling companies choose to operate. To compete effectively, Hunting often establishes a local operation in those regions, however, significantly volatile environments are avoided.
The Board has a strategy to develop its global presence and diversify geographically.
Operations have been established in Asia Pacific, the Middle East and Africa, recognising the high growth potential these regions offer. The Group carefully selects which countries in these regions to operate from, however, these operations will face a higher economic and geopolitical risk than the established businesses in North America and Europe.
Nature of the RiskInvestment through acquisitions and organic capital spend forms the basis of the Group’s strategy of expansion and development.
If investments are not properly considered then lower returns than anticipated may be made.
In addition, such activity incurs the potential for business disruption, management distraction and interruption to IT systems if these issues are not controlled properly.
Nature of the RiskThe Group has an established reputation for producing high quality products capable of withstanding high pressure, high temperature environments.
A failure of any one of these products could adversely impact the Group’s reputation and demand for the Group’s entire range of products and services.
Controls and Actions The Board targets to achieve a record of nil incidents and maintains a policy of full compliance with the laws and regulations in each jurisdiction in which the Group operates.
Every Group facility is overseen by a health and safety officer with the responsibility for ensuring current and newly issued HS&E standards are complied with.
The Board receives a Group HS&E compliance report at every Board meeting.
Controls and Actions Areas exposed to high political risk are noted by the Board and are strategically avoided. Management and the Board closely monitor projected economic trends in order to match capacity to regional demand.
In order to mitigate geopolitical risk arising from the Group’s current expansion programme in Africa, the new facility in Mombasa, Kenya, is to be jointly operated in partnership with a locally established business.
Controls and Actions The Board reviews and challenges each potential investment, either organic or through an acquisition, prior to approval and frequently engages consultants to provide expert analysis of the key issues.
The Board and senior management follow a rigorous process of approving, managing and monitoring capital investments along with planning for contingencies.
The success of each investment decision is assessed through a formal post-investment review process that provides a learning platform for future expansion projects.
Controls and Actions Quality assurance standards are monitored, measured and regulated within the Group under the authority of a Quality Assurance Director, who reports directly to the Chief Executive.
THE GROUP ’S HS&E PERFORMANCE IS DETAILED ON PAGE 35. FURTHER COMMENT ON HS&E IS PROVIDED ON PAGE 46 .
THE DIVERSITY OF THE GROUP ’S EXPOSURE TO DIFFERENT GEOGR APHIC REGIONS IS DESCRIBED ON PAGES 16 AND 17.
DETAILS ON THE GROUP ’S STR ATEGY FOR GROWTH ARE GIVEN ON PAGES 20 AND 21.
FURTHER COMMENT ON THE GROUP ’S COMMITMENT TO PRODUCT QUALITY IS PROVIDED ON PAGE 46 .

ST
RA
TE
GIC
RE
PO
RT
CO
RP
OR
AT
E G
OV
ERN
AN
CE
FIN
AN
CIA
L S
TA
TE
MEN
TS
OT
HER
INF
OR
MA
TIO
N
Hunting PLC2015 Annual Report and Accounts
29
5. HEALTH, SAFETY AND THE ENVIRONMENT (“HS&E”)
6. GEOPOLITICS 7. INVESTMENT 8. PRODUCT QUALITY
MOVEMENT IN THE YEAR The Group experienced a small number of minor HS&E incidents in the year, which is significantly below the industry average and is similar to the Group’s record in prior years. The risks associated with HS&E have therefore not materially changed.
MOVEMENT IN THE YEAR Due to the Group’s already strong presence worldwide, the start up programme in Africa has not had a noticeable impact on the Group’s exposure to geopolitical risk.
MOVEMENT IN THE YEAR During 2015 the Board remained focused on organic expansion and a number of major programmes were completed through the year. No acquisitions were made. The Board continues to assess opportunities for growth and consequently this risk has not changed during the year.
MOVEMENT IN THE YEAR The risk of poor product quality or reliability has remained unchanged during the year with no significant issues raised by the Group’s customers or during the Board’s internal monitoring process.
Nature of the RiskDue to the wide nature of the Group’s activities, it is subject to a relatively high number of HS&E risks and the laws and regulations issued by each of the jurisdictions in which the Group operates.
The Group’s exposure to risk therefore includes the potential for the occurrence of a reportable incident, the financial risk of a breach of HS&E regulations, and the risk of unexpected compliance expenditure whenever a law or regulation is renewed or enhanced.
Nature of the RiskThe locations of the Group’s markets are determined by the location of Hunting’s customers’ drill sites – Hunting’s products must go where the drilling companies choose to operate. To compete effectively, Hunting often establishes a local operation in those regions, however, significantly volatile environments are avoided.
The Board has a strategy to develop its global presence and diversify geographically.
Operations have been established in Asia Pacific, the Middle East and Africa, recognising the high growth potential these regions offer. The Group carefully selects which countries in these regions to operate from, however, these operations will face a higher economic and geopolitical risk than the established businesses in North America and Europe.
Nature of the RiskInvestment through acquisitions and organic capital spend forms the basis of the Group’s strategy of expansion and development.
If investments are not properly considered then lower returns than anticipated may be made.
In addition, such activity incurs the potential for business disruption, management distraction and interruption to IT systems if these issues are not controlled properly.
Nature of the RiskThe Group has an established reputation for producing high quality products capable of withstanding high pressure, high temperature environments.
A failure of any one of these products could adversely impact the Group’s reputation and demand for the Group’s entire range of products and services.
Controls and Actions The Board targets to achieve a record of nil incidents and maintains a policy of full compliance with the laws and regulations in each jurisdiction in which the Group operates.
Every Group facility is overseen by a health and safety officer with the responsibility for ensuring current and newly issued HS&E standards are complied with.
The Board receives a Group HS&E compliance report at every Board meeting.
Controls and Actions Areas exposed to high political risk are noted by the Board and are strategically avoided. Management and the Board closely monitor projected economic trends in order to match capacity to regional demand.
In order to mitigate geopolitical risk arising from the Group’s current expansion programme in Africa, the new facility in Mombasa, Kenya, is to be jointly operated in partnership with a locally established business.
Controls and Actions The Board reviews and challenges each potential investment, either organic or through an acquisition, prior to approval and frequently engages consultants to provide expert analysis of the key issues.
The Board and senior management follow a rigorous process of approving, managing and monitoring capital investments along with planning for contingencies.
The success of each investment decision is assessed through a formal post-investment review process that provides a learning platform for future expansion projects.
Controls and Actions Quality assurance standards are monitored, measured and regulated within the Group under the authority of a Quality Assurance Director, who reports directly to the Chief Executive.
THE GROUP ’S HS&E PERFORMANCE IS DETAILED ON PAGE 35. FURTHER COMMENT ON HS&E IS PROVIDED ON PAGE 46 .
THE DIVERSITY OF THE GROUP ’S EXPOSURE TO DIFFERENT GEOGR APHIC REGIONS IS DESCRIBED ON PAGES 16 AND 17.
DETAILS ON THE GROUP ’S STR ATEGY FOR GROWTH ARE GIVEN ON PAGES 20 AND 21.
FURTHER COMMENT ON THE GROUP ’S COMMITMENT TO PRODUCT QUALITY IS PROVIDED ON PAGE 46 .
No movement in risk
Increase in risk
Decrease in risk

Hunting PLC2015 Annual Report and Accounts
30
RISK MANAGEMENTCONTINUED
VIABILITY ASSESSMENT AND GOING CONCERN BASIS
Viability AssessmentIntroductionHunting has a wide global customer base underpinned by strong, long-term relationships. The Group provides a large range of products and services through its manufacturing and distribution facilities which are located in a number of countries across the globe.
In considering the Group’s long-term viability, the Board regularly assesses the risks to its business model, strategy, future performance, solvency and liquidity. These assessments are supported by the risk management processes described on page 24 and include a review of the Group’s exposure to the oil and gas industry, competitor action, customer plans and the robustness of the supply chain.
Assessment PeriodThe Group’s customers are principally involved in the exploration for and production of oil and gas. Given the nature of the industry and the planning cycles involved, these activities can cover periods of no more than several weeks up to several years from start to end. Hunting’s management works closely with its customers over this period, discussing their operational plans and reviewing their longer-term capital expenditure programmes.
The outlook for the Group beyond this period is generated from management’s assessment of industrial data and projections published by industry commentators and analysts, including statistics on footage drilled and rig activity. The Board believes that a three-year forward looking period is the appropriate length of time to reasonably assess the Group’s viability. The Group’s annual budget process and mid-term projections cover this period and help to support the Board’s assessment.
Consideration of Principal RisksThe nature of the Group’s operations exposes the business to a variety of risks which are noted on pages 26 to 29. The Board regularly reviews the principal risks and assesses the appropriate controls and further actions as described on pages 24 and 25. The Board has further considered their potential impact within the context of the Group’s viability.
AssumptionsIn assessing the long-term viability of the Group, the Board made the following assumptions:
• The raw material pricing environment within the energy industry remains weak in the short term and becomes positive in the medium to long term, given the global outlook for oil and gas demand, which is driven by growth within emerging markets and sustained demand from developed markets. These are the fundamental drivers of Hunting’s core business of manufacturing, supplying and distributing products and services which enable the extraction of oil and gas.
• Actions taken in 2015 to reduce the Group’s cost base enable the business to endure the period of weak commodity prices and reduced shale drilling activity.
• The development of the global shale drilling industry remains focused in the US where government support remains positive.
• The Group will continue to have a medium to low exposure to higher risk countries given the proportion of its current revenues and profits derived from politically stable regions such as North America, Europe and South East Asia.
In addition, the three-year financial projections were stress tested to simulate a further deterioration in market conditions.
ConclusionDespite the current downturn within the oil and gas industry, the Board believes that the Group’s strategy for growth, its diverse customer and product base, and the positive outlook for the oil and gas industry in the medium term provide Hunting with a strong platform on which to continue its business. The Directors therefore have a reasonable expectation that Hunting will be able to continue in operation and meet its liabilities as they fall due over the three-year period of their assessment.
Going Concern BasisIntroductionThe Group’s principal cash outflows include capital expenditure, labour costs, inventory purchases and dividends. The timing and extent of these cash flows are controlled by local management and the Board. The Group’s principal cash inflows are generated from the sale of its products and services, the level of which is dependent on the variety of its products and ability to retain strong customer relationships. Cash inflows are further supported by the Group’s credit insurance cover against customer default that at 31 December 2015 covered the majority of its trade receivables, subject to certain limits.
Current and forecast cash/debt balances are reported on a weekly basis by each of the business units to a centralised treasury function that uses the information to manage the Group’s day-to-day liquidity and longer-term funding needs through effective cash management programmes.
The Group has access to sufficient financial resources including a $350m committed bank facility of which $233.9m was undrawn at 31 December 2015. The two main financial covenants (page 42) attached to this facility are: EBITDA (as defined in the bank facility agreement) should not be less than four times net finance charges, and net debt should be no more than three times adjusted EBITDA. At 31 December 2015, the Group had sufficient headroom over both covenants.
ReviewIn conducting its review of the Group’s ability to remain as a going concern, the Board assessed the Group’s recent trading performance and its latest forecasts, and took account of reasonably predictable changes in future trading performance. The Board also considered the potential financial impact of the estimates, judgements and assumptions that were used to prepare these financial statements. The Board is satisfied that all material uncertainties have been identified and they are not considered to be sufficiently material to adversely impact the Group.
ConclusionThe Board is satisfied that it has conducted a robust review of the Group’s going concern and has a high level of confidence that the Group has the necessary liquid resources to meet its liabilities as they fall due. Consequently the Board considered it appropriate to adopt the going concern basis of accounting in preparing these consolidated financial statements.
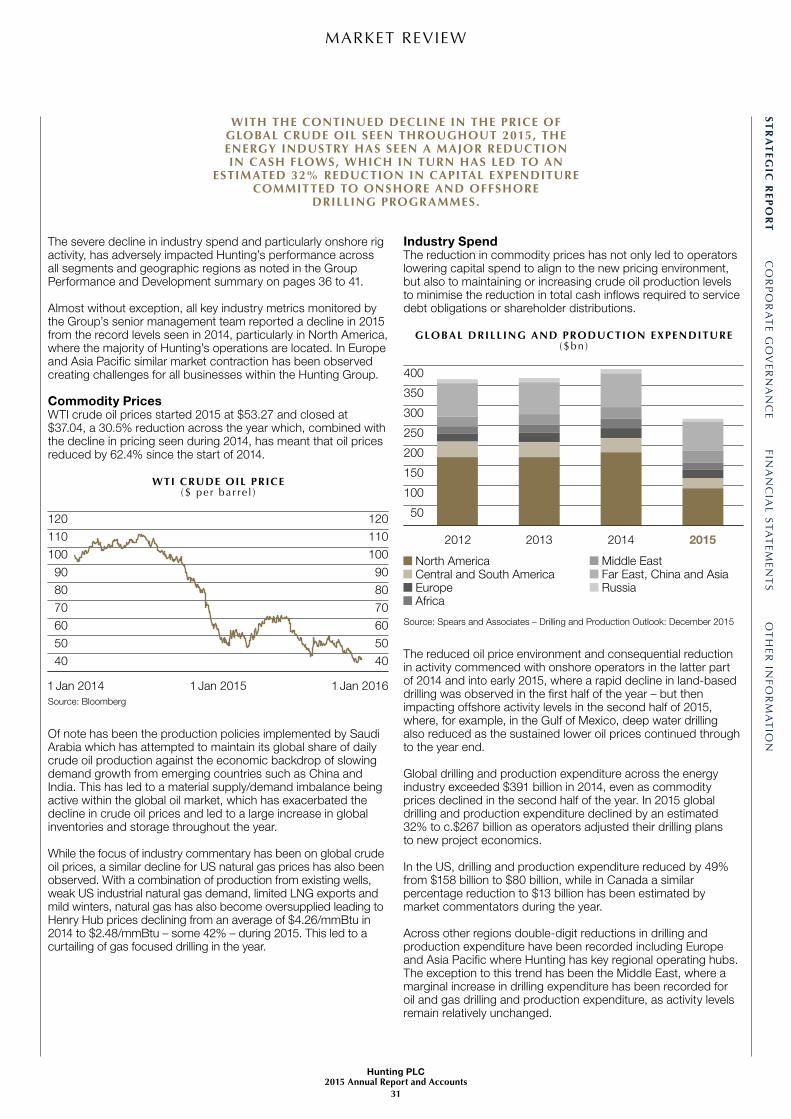
ST
RA
TE
GIC
RE
PO
RT
CO
RP
OR
AT
E G
OV
ERN
AN
CE
FIN
AN
CIA
L S
TA
TE
MEN
TS
OT
HER
INF
OR
MA
TIO
N
Hunting PLC2015 Annual Report and Accounts
31
MARKET REVIEW
The severe decline in industry spend and particularly onshore rig activity, has adversely impacted Hunting’s performance across all segments and geographic regions as noted in the Group Performance and Development summary on pages 36 to 41.
Almost without exception, all key industry metrics monitored by the Group’s senior management team reported a decline in 2015 from the record levels seen in 2014, particularly in North America, where the majority of Hunting’s operations are located. In Europe and Asia Pacific similar market contraction has been observed creating challenges for all businesses within the Hunting Group.
Commodity PricesWTI crude oil prices started 2015 at $53.27 and closed at $37.04, a 30.5% reduction across the year which, combined with the decline in pricing seen during 2014, has meant that oil prices reduced by 62.4% since the start of 2014.
Of note has been the production policies implemented by Saudi Arabia which has attempted to maintain its global share of daily crude oil production against the economic backdrop of slowing demand growth from emerging countries such as China and India. This has led to a material supply/demand imbalance being active within the global oil market, which has exacerbated the decline in crude oil prices and led to a large increase in global inventories and storage throughout the year.
While the focus of industry commentary has been on global crude oil prices, a similar decline for US natural gas prices has also been observed. With a combination of production from existing wells, weak US industrial natural gas demand, limited LNG exports and mild winters, natural gas has also become oversupplied leading to Henry Hub prices declining from an average of $4.26/mmBtu in 2014 to $2.48/mmBtu – some 42% – during 2015. This led to a curtailing of gas focused drilling in the year.
Source: Bloomberg
120
110
100
90
80
70
60
50
40
120
110
100
90
80
70
60
50
40
1 Jan 2014 1 Jan 2015 1 Jan 2016
WTI CRUDE OIL PRICE($ per bar re l )
Industry SpendThe reduction in commodity prices has not only led to operators lowering capital spend to align to the new pricing environment, but also to maintaining or increasing crude oil production levels to minimise the reduction in total cash inflows required to service debt obligations or shareholder distributions.
The reduced oil price environment and consequential reduction in activity commenced with onshore operators in the latter part of 2014 and into early 2015, where a rapid decline in land-based drilling was observed in the first half of the year – but then impacting offshore activity levels in the second half of 2015, where, for example, in the Gulf of Mexico, deep water drilling also reduced as the sustained lower oil prices continued through to the year end.
Global drilling and production expenditure across the energy industry exceeded $391 billion in 2014, even as commodity prices declined in the second half of the year. In 2015 global drilling and production expenditure declined by an estimated 32% to c.$267 billion as operators adjusted their drilling plans to new project economics. In the US, drilling and production expenditure reduced by 49% from $158 billion to $80 billion, while in Canada a similar percentage reduction to $13 billion has been estimated by market commentators during the year.
Across other regions double-digit reductions in drilling and production expenditure have been recorded including Europe and Asia Pacific where Hunting has key regional operating hubs. The exception to this trend has been the Middle East, where a marginal increase in drilling expenditure has been recorded for oil and gas drilling and production expenditure, as activity levels remain relatively unchanged.
2012
Russia
2013 2014 2015
400
350
300
250
200
150
100
50
Far East, China and AsiaMiddle East
AfricaEuropeCentral and South AmericaNorth America
Source: Spears and Associates – Drilling and Production Outlook: December 2015
GLOBAL DRILLING AND PRODUCTION EXPENDITURE($bn)
WITH THE CONTINUED DECLINE IN THE PRICE OF GLOBAL CRUDE OIL SEEN THROUGHOUT 2015, THE ENERGY INDUSTRY HAS SEEN A MAJOR REDUCTION IN CASH FLOWS, WHICH IN TURN HAS LED TO AN
ESTIMATED 32% REDUCTION IN CAPITAL EXPENDITURE COMMITTED TO ONSHORE AND OFFSHORE
DRILLING PROGRAMMES.

Hunting PLC2015 Annual Report and Accounts
32
MARKET REVIEWCONTINUED
Rig CountsGlobal rig counts remain a key benchmark for industry participants to monitor and as a consequence of the decline in commodity pricing, rig counts steadily reduced throughout 2015. The following table notes the reduction in global rig numbers.
Global Rig Count (at year end)
2015 2014 Change
Onshore 3,774 5,165 -27%Offshore 349 415 -16%Total 4,123 5,580 -26%
Source: Spears and Associates – Drilling and Production Outlook: December 2015
In the US the decline in rig counts was more acute given the prolific onshore shale oil and gas industry. Land rig counts declined an estimated 47% as operators curtailed drilling operations while offshore rigs, predominantly focused on activity in the Gulf of Mexico, reduced by 37% giving a total year-on-year decline of 47% for the country.
In Canada, the market contracted at a similar rate to the US, as higher cost heavy oil and tar sands projects were reduced, leading to a 49% reduction in the number of active rigs to close the year at 195 active units. Across Europe, where drilling activity is more evenly split between onshore and offshore activity, the total number of rigs reduced by 17% to 86.
In Asia Pacific, the declines in rig count were less than the more developed North American and European markets – with estimated rig counts declining 6% in the year to average 1,300 active units.
While all of Hunting’s major regions of activity have seen material declines in rig counts, the Middle East reported only a marginal reduction in active rig units to close the year at 370 active units. Saudi Arabia, which accounts for approximately one-third of all rig units in the region, has increased its activity levels in the year, offset by other countries impacted by deteriorating security and in-country conflicts.
Global Footage DrilledWith the evolution of drilling technology over the past decade and the move from drilling vertical to more horizontal/deviated well configurations, footage drilled by the energy industry has become an increasingly important metric for Hunting to monitor. The increase in the number of well sections and the need to drill through complex geological formations has increased the concentration of equipment required for drilling and the associated tools demanded for each well.
In 2014, the global total length of wells drilled was approximately 839 million feet, an increase of c.45% since 2005. This comparison provides a frame to the level of expansion of global drilling as commodity prices increased over the past decade.
In 2015, 592 million feet of wells were drilled globally, a decline of 29% compared to 2014, particularly in the US and Canada, where many exploration wells remain uncompleted, as a result of low commodity prices.
Looking AheadThe oil and gas industry has seen an overwhelming contraction in activity levels during 2015 as commodity price declines led to capital expenditure cuts, which in turn has led to a reduction in drilling programmes and associated equipment purchasing.
The sentiment of the industry in the early months of 2016 remains the same, with commentators forecasting continued market contraction for the year ahead albeit with the pace of decline slowing.
In contrast to the short-term outlook, the medium-term outlook remains resilient, with the International Energy Agency still forecasting an increase in global daily crude oil demand to 98 – 100 million barrels by 2020, compared to a level of 92 million barrels in 2015. The ability of the energy industry to deliver this increased demand, on a sustained basis, cannot be underestimated by governments, policy makers and industry participants alike. While a global crude oil supply glut is making newspaper headlines today, when the rate of depletion of currently producing fields across the industry is factored in a rebalancing of crude oil supply/demand has to be achieved in the short to medium term, with the industry returning to growth shortly thereafter.
Hunting is addressing the short-term market environment – but also preparing for the future by maintaining its strategic positioning with new products and state of the art global manufacturing facilities, to enable its key position in the energy supply chain to be maintained, and to deliver value to all stakeholders.
Source: Spears and Associates – Drilling and Production Outlook: December 2015
2015
2014
2013
2012
592.5
839.7
811.7
817.7
GLOBAL FOOTAGE DRILLED(m f t )

Hunting PLC2015 Annual Report and Accounts
33
OT
HER
INF
OR
MA
TIO
NF
INA
NC
IAL
ST
AT
EM
ENT
SC
OR
PO
RA
TE
GO
VER
NA
NC
ES
TR
AT
EG
IC R
EP
OR
T
ADVANCED AND FLEXIBLE MANUFACTURING CAPABILITY AT OUR SINGAPORE HUB

REVENUE ($m)
2015
2014
2013
810.5
1,386.5
1,293.6
UNDERLYING EBITDA * ($m)
2015
2014
2013
61.9
269.8
244.0
UNDERLYING PROFIT FROM OPERATIONS * ($m)
2015
2014
2013
16.4
217.8
200.0
UNDERLYING DILUTED EARNINGS PER SHARE * (cents )
2015
2014
2013
3.1
100.0
94.5
DIVIDEND PER SHARE DECLARED (cents )
2015
2014
2013
8.0
31.0
29.5
UNDERLYING OPERATING MARGIN * (%)
2015
2014
2013
2
16
15
Hunting PLC2015 Annual Report and Accounts
34
KEY PERFORMANCE INDICATORS
A NUMBER OF METRICS ARE USED TO COMPARE THE DEVELOPMENT, BUSINESS PERFORMANCE AND
POSITION OF THE GROUP. KPI s ARE REGULARLY REVIEWED TO ENSURE THEY REMAIN APPROPRIATE MEASURES OF THE GROUP’S PERFORMANCE. FOR
DETAILS ON THE MOVEMENTS OF THESE KPI s ,PLEASE REFER TO THE GROUP PERFORMANCE AND DEVELOPMENT SECTION OF THE ANNUAL REPORT.
Revenue is earned from products and services sold to customers from the Group’s principal activities in continuing operations (see notes 3 and 4).
Underlying profit from operations as a percentage of revenue.
Underlying earnings before share of associates’ post-tax results, interest, tax, depreciation, impairment and amortisation for continuing operations (see NGM A).
Underlying earnings attributable to ordinary shareholders, divided by the weighted average number of ordinary shares in issue during the year adjusted for all potentially dilutive ordinary shares (see note 13).
Underlying profit from operations before net finance costs and tax (see consolidated income statement and note 7).
Dividends per share declared in respect of the financial year including the interim dividend, paid during the year, and the final dividend, neither paid nor accrued at year end (see NGM N).
OPERATIONAL
FINANCIAL
COUNTRIES WITH ACTIVE OPER ATIONS
152014 – 12
Countries in which Hunting has an active operating site or distribution
centre. This does not include countries that only have a sales presence.
YEAR END EMPLOYEES
2,7842014 – 4,003
The December headcount for Hunting employees, including part-time staff
(see note 9).
ISO 9001 (QUALITY ) ACCREDITED OPER ATING SITES
50%2014 – 51%
Percentage of operating sites with ISO 9001 accreditation.
OPER ATING FOOTPRINT (mi l l ion sq f t )
3.22014 – 2 .8
Operation and distribution site square footage at year end. This closely
corresponds to “roofline” and includes administrative space within
operating units.
* Non-GAAP measure (“NGM”) (see pages 133 to 137).
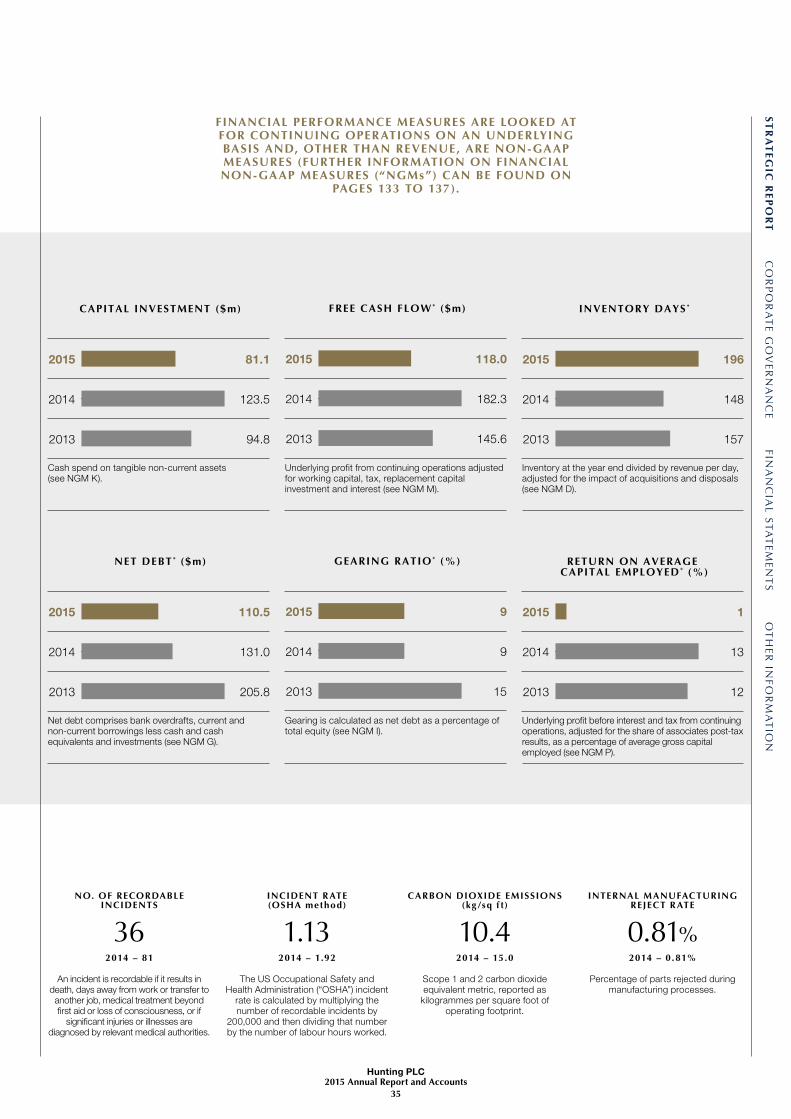
CAPITAL INVESTMENT ($m)
2015
2014
2013
81.1
123.5
94.8
FREE CASH FLOW * ($m)
2015
2014
2013
118.0
182.3
145.6
INVENTORY DAYS *
2015
2014
2013
196
148
157
NET DEBT * ($m)
2015
2014
2013
110.5
131.0
205.8
GEARING RATIO * (%)
2015
2014
2013
9
9
15
RETURN ON AVERAGE CAPITAL EMPLOYED * (%)
2015
2014
2013
1
13
12
ST
RA
TE
GIC
RE
PO
RT
CO
RP
OR
AT
E G
OV
ERN
AN
CE
FIN
AN
CIA
L S
TA
TE
MEN
TS
OT
HER
INF
OR
MA
TIO
N
Hunting PLC2015 Annual Report and Accounts
35
FINANCIAL PERFORMANCE MEASURES ARE LOOKED AT FOR CONTINUING OPERATIONS ON AN UNDERLYING BASIS AND, OTHER THAN REVENUE, ARE NON-GAAP MEASURES (FURTHER INFORMATION ON FINANCIAL NON-GAAP MEASURES (“NGMs”) CAN BE FOUND ON
PAGES 133 TO 137).
Cash spend on tangible non-current assets (see NGM K).
Net debt comprises bank overdrafts, current and non-current borrowings less cash and cash equivalents and investments (see NGM G).
Underlying profit from continuing operations adjusted for working capital, tax, replacement capital investment and interest (see NGM M).
Gearing is calculated as net debt as a percentage of total equity (see NGM I).
Inventory at the year end divided by revenue per day, adjusted for the impact of acquisitions and disposals (see NGM D).
Underlying profit before interest and tax from continuing operations, adjusted for the share of associates post-tax results, as a percentage of average gross capital employed (see NGM P).
NO. OF RECORDABLE INCIDENTS
362014 – 81
An incident is recordable if it results in death, days away from work or transfer to another job, medical treatment beyond first aid or loss of consciousness, or if
significant injuries or illnesses are diagnosed by relevant medical authorities.
CARBON DIOXIDE EMISSIONS (kg /sq f t )
10.42014 – 15.0
Scope 1 and 2 carbon dioxideequivalent metric, reported as
kilogrammes per square foot of operating footprint.
INCIDENT R ATE (OSHA method)
1.132014 – 1.92
The US Occupational Safety and Health Administration (“OSHA”) incident
rate is calculated by multiplying the number of recordable incidents by
200,000 and then dividing that number by the number of labour hours worked.
INTERNAL MANUFACTURING REJECT R ATE
0.81%2014 – 0.81%
Percentage of parts rejected during manufacturing processes.

Hunting PLC2015 Annual Report and Accounts
36
GROUP PERFORMANCE AND DEVELOPMENT
“IN THIS MARKET ENVIRONMENT A PRIMARY
FOCUS FOR THE MANAGEMENT TEAM IS MAINTAINING THE FINANCIAL HEALTH OF THE BALANCE SHEET THROUGH
STRONG WORKING CAPITAL CONTROLS AND CASH FLOW DISCIPLINES.”
P E T E R R O S EFINANCE DIRECTOR
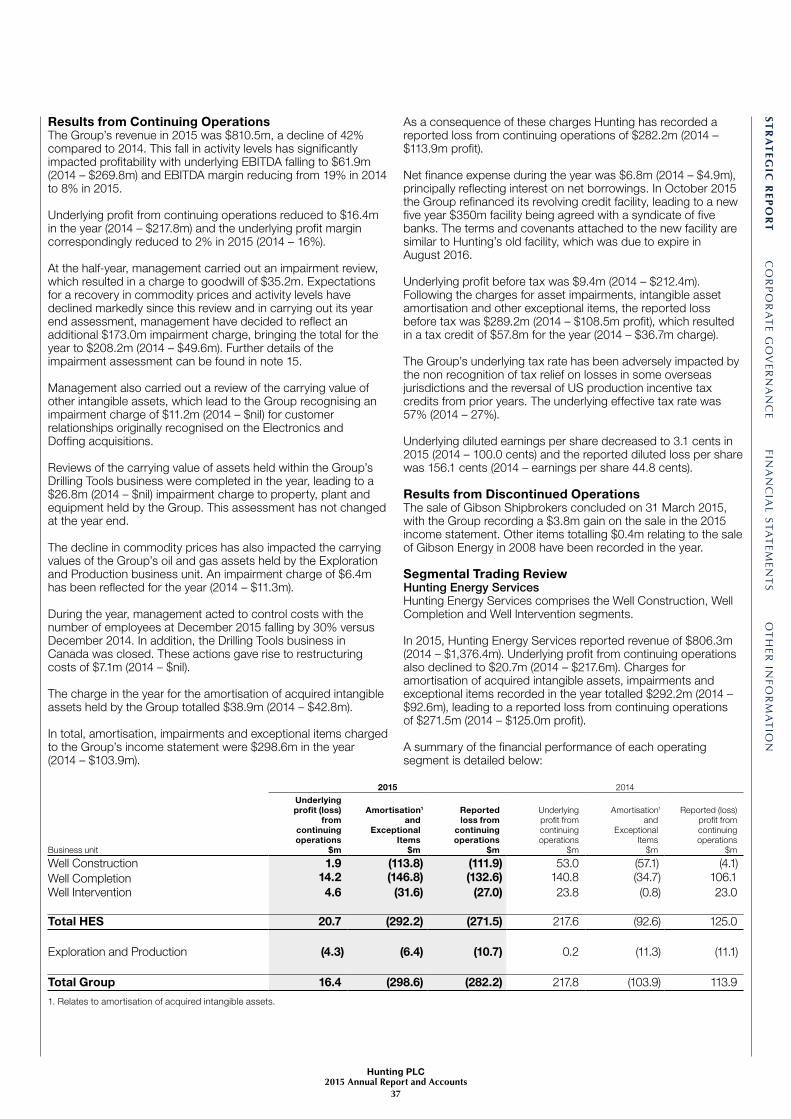
ST
RA
TE
GIC
RE
PO
RT
CO
RP
OR
AT
E G
OV
ERN
AN
CE
FIN
AN
CIA
L S
TA
TE
MEN
TS
OT
HER
INF
OR
MA
TIO
N
Hunting PLC2015 Annual Report and Accounts
37
As a consequence of these charges Hunting has recorded a reported loss from continuing operations of $282.2m (2014 – $113.9m profit).
Net finance expense during the year was $6.8m (2014 – $4.9m), principally reflecting interest on net borrowings. In October 2015 the Group refinanced its revolving credit facility, leading to a new five year $350m facility being agreed with a syndicate of five banks. The terms and covenants attached to the new facility are similar to Hunting’s old facility, which was due to expire in August 2016.
Underlying profit before tax was $9.4m (2014 – $212.4m). Following the charges for asset impairments, intangible asset amortisation and other exceptional items, the reported loss before tax was $289.2m (2014 – $108.5m profit), which resulted in a tax credit of $57.8m for the year (2014 – $36.7m charge).
The Group’s underlying tax rate has been adversely impacted by the non recognition of tax relief on losses in some overseas jurisdictions and the reversal of US production incentive tax credits from prior years. The underlying effective tax rate was 57% (2014 – 27%).
Underlying diluted earnings per share decreased to 3.1 cents in 2015 (2014 – 100.0 cents) and the reported diluted loss per share was 156.1 cents (2014 – earnings per share 44.8 cents).
Results from Discontinued OperationsThe sale of Gibson Shipbrokers concluded on 31 March 2015, with the Group recording a $3.8m gain on the sale in the 2015 income statement. Other items totalling $0.4m relating to the sale of Gibson Energy in 2008 have been recorded in the year.
Segmental Trading ReviewHunting Energy ServicesHunting Energy Services comprises the Well Construction, Well Completion and Well Intervention segments.
In 2015, Hunting Energy Services reported revenue of $806.3m (2014 – $1,376.4m). Underlying profit from continuing operations also declined to $20.7m (2014 – $217.6m). Charges for amortisation of acquired intangible assets, impairments and exceptional items recorded in the year totalled $292.2m (2014 – $92.6m), leading to a reported loss from continuing operations of $271.5m (2014 – $125.0m profit).
A summary of the financial performance of each operating segment is detailed below:
Results from Continuing OperationsThe Group’s revenue in 2015 was $810.5m, a decline of 42% compared to 2014. This fall in activity levels has significantly impacted profitability with underlying EBITDA falling to $61.9m (2014 – $269.8m) and EBITDA margin reducing from 19% in 2014 to 8% in 2015.
Underlying profit from continuing operations reduced to $16.4m in the year (2014 – $217.8m) and the underlying profit margin correspondingly reduced to 2% in 2015 (2014 – 16%).
At the half-year, management carried out an impairment review, which resulted in a charge to goodwill of $35.2m. Expectations for a recovery in commodity prices and activity levels have declined markedly since this review and in carrying out its year end assessment, management have decided to reflect an additional $173.0m impairment charge, bringing the total for the year to $208.2m (2014 – $49.6m). Further details of the impairment assessment can be found in note 15.
Management also carried out a review of the carrying value of other intangible assets, which lead to the Group recognising an impairment charge of $11.2m (2014 – $nil) for customer relationships originally recognised on the Electronics and Doffing acquisitions.
Reviews of the carrying value of assets held within the Group’s Drilling Tools business were completed in the year, leading to a $26.8m (2014 – $nil) impairment charge to property, plant and equipment held by the Group. This assessment has not changed at the year end.
The decline in commodity prices has also impacted the carrying values of the Group’s oil and gas assets held by the Exploration and Production business unit. An impairment charge of $6.4m has been reflected for the year (2014 – $11.3m).
During the year, management acted to control costs with the number of employees at December 2015 falling by 30% versus December 2014. In addition, the Drilling Tools business in Canada was closed. These actions gave rise to restructuring costs of $7.1m (2014 – $nil).
The charge in the year for the amortisation of acquired intangible assets held by the Group totalled $38.9m (2014 – $42.8m).
In total, amortisation, impairments and exceptional items charged to the Group’s income statement were $298.6m in the year (2014 – $103.9m).
2015 2014
Business unit
Underlying profit (loss)
from continuing operations
$m
Amortisation1
and Exceptional
Items$m
Reported loss from
continuing operations
$m
Underlying profit from continuing operations
$m
Amortisation1
and Exceptional
Items$m
Reported (loss) profit from continuing operations
$m
Well Construction 1.9 (113.8) (111.9) 53.0 (57.1) (4.1)Well Completion 14.2 (146.8) (132.6) 140.8 (34.7) 106.1Well Intervention 4.6 (31.6) (27.0) 23.8 (0.8) 23.0
Total HES 20.7 (292.2) (271.5) 217.6 (92.6) 125.0
Exploration and Production (4.3) (6.4) (10.7) 0.2 (11.3) (11.1)
Total Group 16.4 (298.6) (282.2) 217.8 (103.9) 113.9
1. Relates to amortisation of acquired intangible assets.
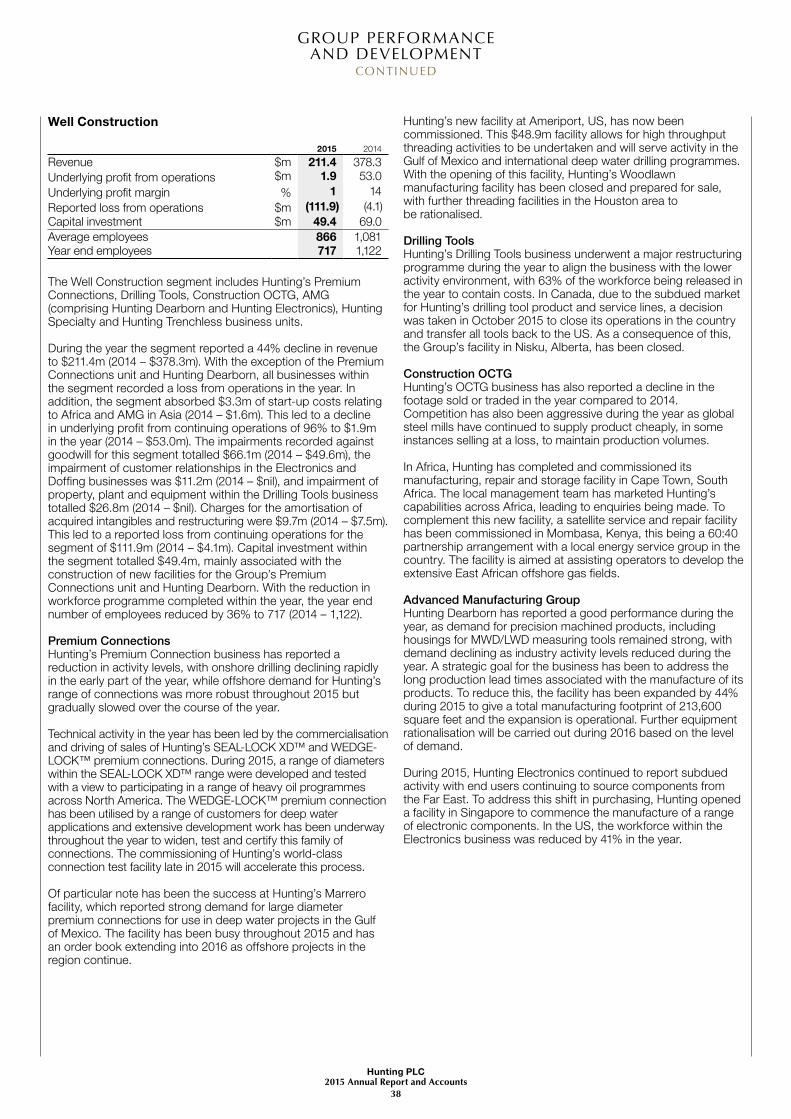
Hunting PLC2015 Annual Report and Accounts
38
GROUP PERFORMANCE AND DEVELOPMENT
CONTINUED
Well Construction
2015 2014
Revenue $m 211.4 378.3Underlying profit from operations $m 1.9 53.0Underlying profit margin % 1 14Reported loss from operations $m (111.9) (4.1)Capital investment $m 49.4 69.0Average employees 866 1,081Year end employees 717 1,122
The Well Construction segment includes Hunting’s Premium Connections, Drilling Tools, Construction OCTG, AMG (comprising Hunting Dearborn and Hunting Electronics), Hunting Specialty and Hunting Trenchless business units.
During the year the segment reported a 44% decline in revenue to $211.4m (2014 – $378.3m). With the exception of the Premium Connections unit and Hunting Dearborn, all businesses within the segment recorded a loss from operations in the year. In addition, the segment absorbed $3.3m of start-up costs relating to Africa and AMG in Asia (2014 – $1.6m). This led to a decline in underlying profit from continuing operations of 96% to $1.9m in the year (2014 – $53.0m). The impairments recorded against goodwill for this segment totalled $66.1m (2014 – $49.6m), the impairment of customer relationships in the Electronics and Doffing businesses was $11.2m (2014 – $nil), and impairment of property, plant and equipment within the Drilling Tools business totalled $26.8m (2014 – $nil). Charges for the amortisation of acquired intangibles and restructuring were $9.7m (2014 – $7.5m). This led to a reported loss from continuing operations for the segment of $111.9m (2014 – $4.1m). Capital investment within the segment totalled $49.4m, mainly associated with the construction of new facilities for the Group’s Premium Connections unit and Hunting Dearborn. With the reduction in workforce programme completed within the year, the year end number of employees reduced by 36% to 717 (2014 – 1,122).
Premium ConnectionsHunting’s Premium Connection business has reported a reduction in activity levels, with onshore drilling declining rapidly in the early part of the year, while offshore demand for Hunting’s range of connections was more robust throughout 2015 but gradually slowed over the course of the year.
Technical activity in the year has been led by the commercialisation and driving of sales of Hunting’s SEAL-LOCK XD™ and WEDGE-LOCK™ premium connections. During 2015, a range of diameters within the SEAL-LOCK XD™ range were developed and tested with a view to participating in a range of heavy oil programmes across North America. The WEDGE-LOCK™ premium connection has been utilised by a range of customers for deep water applications and extensive development work has been underway throughout the year to widen, test and certify this family of connections. The commissioning of Hunting’s world-class connection test facility late in 2015 will accelerate this process.
Of particular note has been the success at Hunting’s Marrero facility, which reported strong demand for large diameter premium connections for use in deep water projects in the Gulf of Mexico. The facility has been busy throughout 2015 and has an order book extending into 2016 as offshore projects in the region continue.
Hunting’s new facility at Ameriport, US, has now been commissioned. This $48.9m facility allows for high throughput threading activities to be undertaken and will serve activity in the Gulf of Mexico and international deep water drilling programmes. With the opening of this facility, Hunting’s Woodlawn manufacturing facility has been closed and prepared for sale, with further threading facilities in the Houston area to be rationalised.
Drilling ToolsHunting’s Drilling Tools business underwent a major restructuring programme during the year to align the business with the lower activity environment, with 63% of the workforce being released in the year to contain costs. In Canada, due to the subdued market for Hunting’s drilling tool product and service lines, a decision was taken in October 2015 to close its operations in the country and transfer all tools back to the US. As a consequence of this, the Group’s facility in Nisku, Alberta, has been closed.
Construction OCTGHunting’s OCTG business has also reported a decline in the footage sold or traded in the year compared to 2014. Competition has also been aggressive during the year as global steel mills have continued to supply product cheaply, in some instances selling at a loss, to maintain production volumes.
In Africa, Hunting has completed and commissioned its manufacturing, repair and storage facility in Cape Town, South Africa. The local management team has marketed Hunting’s capabilities across Africa, leading to enquiries being made. To complement this new facility, a satellite service and repair facility has been commissioned in Mombasa, Kenya, this being a 60:40 partnership arrangement with a local energy service group in the country. The facility is aimed at assisting operators to develop the extensive East African offshore gas fields.
Advanced Manufacturing GroupHunting Dearborn has reported a good performance during the year, as demand for precision machined products, including housings for MWD/LWD measuring tools remained strong, with demand declining as industry activity levels reduced during the year. A strategic goal for the business has been to address the long production lead times associated with the manufacture of its products. To reduce this, the facility has been expanded by 44% during 2015 to give a total manufacturing footprint of 213,600 square feet and the expansion is operational. Further equipment rationalisation will be carried out during 2016 based on the level of demand.
During 2015, Hunting Electronics continued to report subdued activity with end users continuing to source components from the Far East. To address this shift in purchasing, Hunting opened a facility in Singapore to commence the manufacture of a range of electronic components. In the US, the workforce within the Electronics business was reduced by 41% in the year.
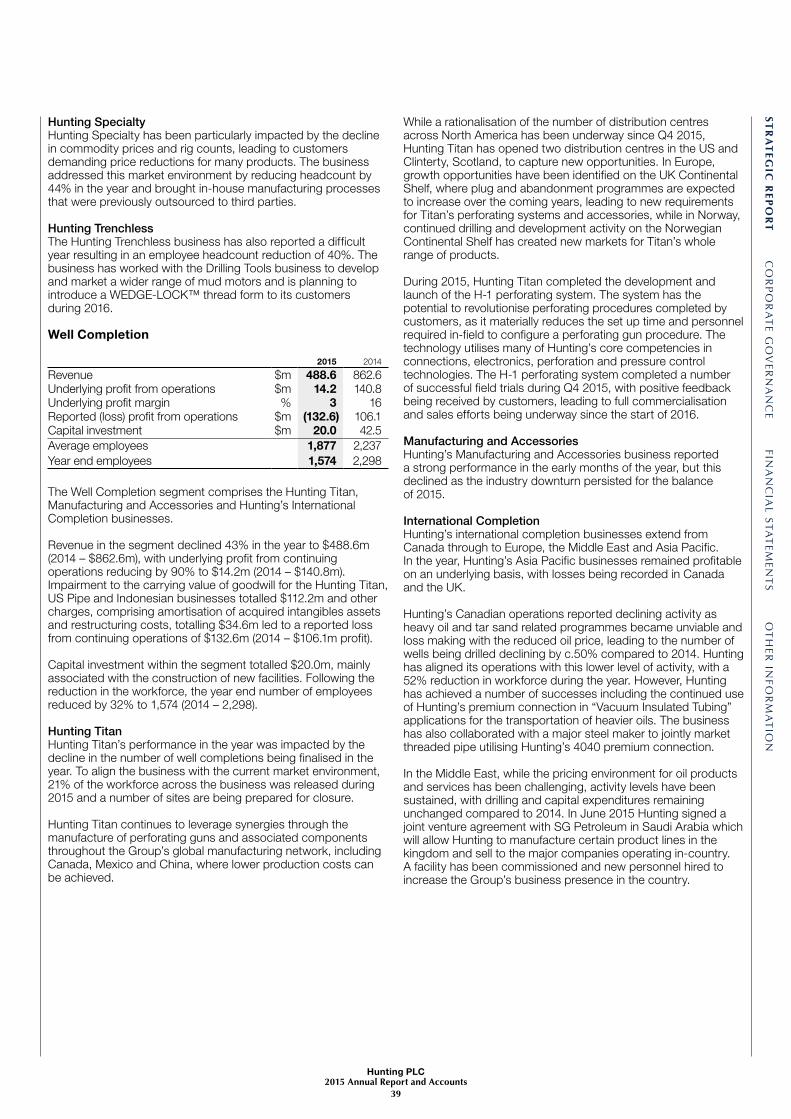
ST
RA
TE
GIC
RE
PO
RT
CO
RP
OR
AT
E G
OV
ERN
AN
CE
FIN
AN
CIA
L S
TA
TE
MEN
TS
OT
HER
INF
OR
MA
TIO
N
Hunting PLC2015 Annual Report and Accounts
39
Hunting SpecialtyHunting Specialty has been particularly impacted by the decline in commodity prices and rig counts, leading to customers demanding price reductions for many products. The business addressed this market environment by reducing headcount by 44% in the year and brought in-house manufacturing processes that were previously outsourced to third parties.
Hunting TrenchlessThe Hunting Trenchless business has also reported a difficult year resulting in an employee headcount reduction of 40%. The business has worked with the Drilling Tools business to develop and market a wider range of mud motors and is planning to introduce a WEDGE-LOCK™ thread form to its customers during 2016.
Well Completion
2015 2014
Revenue $m 488.6 862.6Underlying profit from operations $m 14.2 140.8Underlying profit margin % 3 16Reported (loss) profit from operations $m (132.6) 106.1Capital investment $m 20.0 42.5Average employees 1,877 2,237Year end employees 1,574 2,298
The Well Completion segment comprises the Hunting Titan, Manufacturing and Accessories and Hunting’s International Completion businesses.
Revenue in the segment declined 43% in the year to $488.6m (2014 – $862.6m), with underlying profit from continuing operations reducing by 90% to $14.2m (2014 – $140.8m). Impairment to the carrying value of goodwill for the Hunting Titan, US Pipe and Indonesian businesses totalled $112.2m and other charges, comprising amortisation of acquired intangibles assets and restructuring costs, totalling $34.6m led to a reported loss from continuing operations of $132.6m (2014 – $106.1m profit).
Capital investment within the segment totalled $20.0m, mainly associated with the construction of new facilities. Following the reduction in the workforce, the year end number of employees reduced by 32% to 1,574 (2014 – 2,298).
Hunting TitanHunting Titan’s performance in the year was impacted by the decline in the number of well completions being finalised in the year. To align the business with the current market environment, 21% of the workforce across the business was released during 2015 and a number of sites are being prepared for closure.
Hunting Titan continues to leverage synergies through the manufacture of perforating guns and associated components throughout the Group’s global manufacturing network, including Canada, Mexico and China, where lower production costs can be achieved.
While a rationalisation of the number of distribution centres across North America has been underway since Q4 2015, Hunting Titan has opened two distribution centres in the US and Clinterty, Scotland, to capture new opportunities. In Europe, growth opportunities have been identified on the UK Continental Shelf, where plug and abandonment programmes are expected to increase over the coming years, leading to new requirements for Titan’s perforating systems and accessories, while in Norway, continued drilling and development activity on the Norwegian Continental Shelf has created new markets for Titan’s whole range of products.
During 2015, Hunting Titan completed the development and launch of the H-1 perforating system. The system has the potential to revolutionise perforating procedures completed by customers, as it materially reduces the set up time and personnel required in-field to configure a perforating gun procedure. The technology utilises many of Hunting’s core competencies in connections, electronics, perforation and pressure control technologies. The H-1 perforating system completed a number of successful field trials during Q4 2015, with positive feedback being received by customers, leading to full commercialisation and sales efforts being underway since the start of 2016.
Manufacturing and AccessoriesHunting’s Manufacturing and Accessories business reported a strong performance in the early months of the year, but this declined as the industry downturn persisted for the balance of 2015.
International CompletionHunting’s international completion businesses extend from Canada through to Europe, the Middle East and Asia Pacific. In the year, Hunting’s Asia Pacific businesses remained profitable on an underlying basis, with losses being recorded in Canada and the UK.
Hunting’s Canadian operations reported declining activity as heavy oil and tar sand related programmes became unviable and loss making with the reduced oil price, leading to the number of wells being drilled declining by c.50% compared to 2014. Hunting has aligned its operations with this lower level of activity, with a 52% reduction in workforce during the year. However, Hunting has achieved a number of successes including the continued use of Hunting’s premium connection in “Vacuum Insulated Tubing” applications for the transportation of heavier oils. The business has also collaborated with a major steel maker to jointly market threaded pipe utilising Hunting’s 4040 premium connection.
In the Middle East, while the pricing environment for oil products and services has been challenging, activity levels have been sustained, with drilling and capital expenditures remaining unchanged compared to 2014. In June 2015 Hunting signed a joint venture agreement with SG Petroleum in Saudi Arabia which will allow Hunting to manufacture certain product lines in the kingdom and sell to the major companies operating in-country. A facility has been commissioned and new personnel hired to increase the Group’s business presence in the country.

Hunting PLC2015 Annual Report and Accounts
40
GROUP PERFORMANCE AND DEVELOPMENT
CONTINUED
In Europe, Hunting’s UK operations have been affected by a near decade low in new drilling activity but also the high taxation of operators. Hunting has restructured its operations, including a reduction in the workforce of 17% to align with the current operating environment. While operations in the UK have been depressed, new investment in the Group’s Netherlands facility and entry into Norway in the year are targeting ongoing drilling across the whole region, including the increasing number of plug and abandonment programmes planned as production ceases from older fields.
In Asia Pacific, Hunting maintains operations in Singapore, Indonesia, Thailand and China. During the year, activity levels declined with general market conditions. While the performance of the business reduced in the year, which led to a 34% reduction in employees across the region, Hunting has continued to develop its presence in the area, particularly in Singapore. In March 2015, the Hunting Board approved the investment in a major new facility in Singapore, which will consolidate four locations into one campus. The new campus will combine threading, manufacturing and service capabilities and also include the electronics and precision machining capabilities of Hunting’s AMG business group. While the phasing of this investment has been moved into late 2016 and 2017, due to the market environment, plans for the consolidation of Hunting’s operations continue, with planning applications being secured and early-stage investment made throughout the year.
Well Intervention
2015 2014
Revenue $m 106.3 135.5Underlying profit from operations $m 4.6 23.8Underlying profit margin % 4 18Reported (loss) profit from operations $m (27.0) 23.0Capital investment $m 8.6 4.5Average employees 499 483Year end employees 428 513
The Well Intervention segment comprises the Hunting Subsea and well intervention businesses.
Revenue in the segment declined 22% in the year to $106.3m (2014 – $135.5m), with underlying profit from continuing operations reducing by 81% to $4.6m (2014 – $23.8m). Impairment to the carrying value of goodwill totalled $29.9m and other charges, comprising amortisation of acquired intangibles and restructuring costs totalling $1.7m, led to a reported loss from continuing operations of $27.0m (2014 – $23.0m profit).
Capital investment within the segment totalled $8.6m, mainly associated with the construction of new facilities. With the programme to reduce the workforce completed within the year, the year end number of employees reduced by 17% to 428 (2014 – 513).
Hunting SubseaDuring the year, the Subsea business reported strong sales and profits as deep water drilling programmes, mainly in the Gulf of Mexico, continued. While business momentum remained strong for the majority of the year, as the business entered Q4 2015, a declining order book, due to the ongoing curtailment of drilling by global operators, led to a reduction in workforce of 19% in the year. The business continued to introduce new coupling products, valves and chemical injector solutions to the market throughout the year, which has contributed to the excellent results being delivered.
Well InterventionThe well intervention business group has also been impacted by the market sales of its pressure control system and Thru Tubing intervention tools have continued throughout the year, with new business being secured across the Middle East.
Hunting’s UK-based rental equipment business has been adversely impacted during the year, but plans are being drawn up to focus more on African drilling markets, where better market opportunities are anticipated.
Exploration and ProductionHunting’s exploration and production business has oil and natural gas well investments mainly in the Southern US and offshore shallow waters in the Gulf of Mexico, holding equity interests in 47 producing properties. On a Barrel of Oil Equivalent basis (“BOE”), production in the year was 118,000 BOE (2014 – 143,000 BOE), with reserves at 31 December 2015 being 0.6m BOE (2014 – 0.9m BOE).
In 2015, the business reported an underlying loss from operations of $4.3m (2014 – $0.2m profit). During 2015, the unit participated in drilling one successful onshore development well and a successful offshore recompletion.
Following a year end valuation of reserves, which requires individual oil and gas properties to be impaired when the estimated realisable value is less than the book value based on future production and commodity prices, the business has taken an impairment charge of $6.4m (2014 – $11.3m), which has been shown as an exceptional item, reflecting a reduction in the value of reserve estimates and higher retirement obligation cost estimates. Reported loss from operations for 2015 was $10.7m (2014 – $11.1m).

ST
RA
TE
GIC
RE
PO
RT
CO
RP
OR
AT
E G
OV
ERN
AN
CE
FIN
AN
CIA
L S
TA
TE
MEN
TS
OT
HER
INF
OR
MA
TIO
N
Hunting PLC2015 Annual Report and Accounts
41
Summary Group Cash Flow
2015$m
2014$m
EBITDA 61.9 269.8Working capital movements 96.0 3.8Net interest paid and bank fees (7.4) (5.6)Tax paid (10.5) (26.6)Restructuring costs (5.9) –Replacement capital investment (22.0) (69.0)Other operating cash and non-cash movements 5.9 9.9Free cash flow 118.0 182.3Expansion capital investment (59.1) (54.5)Dividends to PLC equity holders (39.8) (44.1)Other 1.4 (8.9)Reduction in net debt in the year 20.5 74.8
Cash FlowEBITDA was $61.9m (2014 – $269.8m), reflecting the weakness in the global energy markets, leading to lower revenues and profits for the Group.
Working capital movements generated $96.0m of cash inflows (2014 – $3.8m), impacted by the decline in business activity levels, but also reflecting the Group’s focus on working capital management.
Net interest paid and bank fees increased in the year to $7.4m from $5.6m in 2014, reflecting fees paid on the new five-year facility.
Tax paid in the period decreased by $16.1m, reflecting the lower levels of taxable income generated.
Restructuring costs gave rise to cash outflows of $5.9m (2014 – $nil) as a result of workforce reduction programmes.
Replacement capital investment decreased by 68% to $22.0m in 2015 (2014 – $69.0m), as the Group cut non-essential expenditures. Key components included $6.4m on the manufacturing facility at Houma, US, $6.1m on drilling tools and rental equipment and $6.3m on machinery and equipment. Exploration and production capital investment totalled $3.0m during the year.
As a result of the above, free cash flow was $118.0m in the year (2014 – $182.3m).
Expansion capital investment during 2015 was $59.1m (2014 – $54.5m) as the Group’s internal capital investment programme progressed. The Group incurred $20.2m on its new premium threading and test facility at Ameriport, US, $9.3m on the new regional facility in Cape Town, South Africa, $6.4m at Hunting Dearborn, $1.6m on the new AMG regional facility in Singapore, $2.9m on drilling tools and rental equipment and $11.5m on machinery and equipment. Other expansion capital investments totalled $7.2m.
Total dividends paid in the year to PLC equity shareholders were $39.8m. This comprises the payment of the final dividend for 2014 of 22.9 cents and the 2015 interim dividend of 4.0 cents. Dividends will continue to be declared in cents, with a Sterling equivalent paid, following a formal process of conversion. The final dividend for 2015 is proposed at 4.0 cents, and, if approved by shareholders, will result in an outflow of $5.9m.
Net debt has reduced by $20.5m to $110.5m (2014 – $131.0m) at the end of the year.

Hunting PLC2015 Annual Report and Accounts
42
GROUP FUNDING AND POSITION AT YEAR END
Financial Capital ManagementCapital employed is managed in order to ensure an appropriate level of financing is available for the Group’s activities. The balance of debt and equity is managed having due regard to the respective cost of funds and their availability.
The Group operates a centralised treasury function, with policies and procedures approved by the Board. These cover funding, banking relationships, foreign currency and interest rate exposures and cash management, together with the investment of surplus cash.
The Group operates in a number of geographic territories and results are generated in a number of different currencies. The US dollar is the most significant functional currency, however, where this is not the case, the Group is subject to the effects of foreign exchange rate fluctuations with respect to currency conversions. Currency exposure on the balance sheet is, where practical, reduced by financing assets with borrowings in the same currency. Spot and forward foreign exchange contracts are used to cover the net exposure of purchases and sales in non-domestic currencies.
2015 has been a year of decline for the Group, as activity levels materially decreased within its core markets leading to a reduction in revenues and profits for the Group. However, cash generation has remained strong and sufficient to continue to fund the Group’s capital investment programme and reduce net debt by $20.5m to $110.5m (2014 – $131.0m), with gearing being 9% at 31 December 2015 (2014 – 9%).
2015$m
2014$m
Total equity 1,168.1 1,438.3Net debt 110.5 131.0Capital employed 1,278.6 1,569.3Gearing 9% 9%
The Group’s financial position remains robust, with total credit facilities of $414.6m in place (2014 – $649.8m) of which $350.0m (2014 – $584.7m or £375.0m) is committed. A new five year $350m revolving committed facility (“RCF”) was agreed in October 2015 with a syndicate of five banks, comprising Lloyds, Barclays, HSBC, Wells Fargo and DBS. The new facility, which expires in October 2020, has similar terms and covenants to the old facility. Further details regarding the new facility can be found in note 26 of the 2015 Annual Report and Accounts.
The ratio of net debt to EBITDA permitted under the RCF must not exceed a multiple of three times. EBITDA must also cover relevant finance charges by a minimum of four times. For covenant testing purposes, the Group’s definition of EBITDA is adjusted to exclude exceptional items, include the share of associates’ post-tax results and exclude the fair value charge for share awards. Similarly, net debt and finance expenses are adjusted to accord with the definition within the facility agreement. EBITDA, for covenant test purposes, is based on the previous twelve month period, measured twice yearly at 30 June and 31 December. At 31 December 2015 both these covenants were met.
The Group’s net debt is monitored by the central treasury function on a daily basis and a variety of cash forecasts, looking at different time horizons, are prepared on a periodic basis.
Management’s judgement is that the level of headroom provided by the Group’s total credit facilities remains adequate to provide ongoing flexibility and to support the investment in key projects outlined in this Strategic Report. Return on average capital employed is a KPI management use to assess business unit performance. The Group’s underlying return on average capital employed has decreased to 1% in 2015, reflecting the decline in trading (2014 – 13%).
The Board considers each dividend proposed based on the information available to it at the time. Consideration is given to the financial projections of business performance and capital investment needs, together with feedback from shareholders and advisers.
Further detail on financial risks is provided within note 26 of the 2015 Annual Report and Accounts.
HUNTING SUBSEA’S PRODUCT TESTING STATION
CASH HAS BEEN TIGHTLY MANAGED DURING THE YEAR, TO ENABLE THE GROUP TO CONTINUE ITS
GLOBAL FACILITY INVESTMENT PROGRAMME BUT ALSO TO PAY DOWN NET DEBT AND MANAGE GEARING. OVER THE YEAR NET DEBT REDUCED BY $20.5M TO END THE YEAR AT $110.5M, REFLECTING GEARING
OF 9% AT 31 DECEMBER 2015 (2014 – 9%).

ST
RA
TE
GIC
RE
PO
RT
CO
RP
OR
AT
E G
OV
ERN
AN
CE
FIN
AN
CIA
L S
TA
TE
MEN
TS
OT
HER
INF
OR
MA
TIO
N
Hunting PLC2015 Annual Report and Accounts
43
Other intangible assets have reduced by $44.4m, the main movements being an amortisation charge for the year of $40.8m, an impairment charge of $11.2m, and foreign exchange of $0.4m, offset by the capitalisation of technology and software development costs of $8.0m.
Property, plant and equipment has decreased by $12.2m. Additions of $77.1m were offset by depreciation of $43.6m, impairment of assets held within the Group’s Drilling Tools business unit totalling $26.8m, impairment of oil and gas assets of $6.4m and $0.2m transferred to inventories. The net book value on disposals amounted to $5.9m and adverse foreign exchange adjustments totalled $6.4m.
Working capital has decreased by $104.8m. The reduction in activity levels, together with management’s focus on working capital led to cash inflows of $96.0m. Foreign exchange had $12.3m favourable impact on working capital, but this was offset by $3.5m of non-cash adjustments.
Tax balances show net assets of $10.7m at 31 December 2015 (2014 – $55.2m net liabilities). This reflects the move from taxable profits in 2014 to a recovery of tax paid in prior years utilising tax losses generated during 2015.
Provisions have reduced by $6.7m principally due to the settlement of vacant leasehold property obligations.
As a result of the above changes, capital employed in the Group has reduced by $290.7m to $1,278.6m.
Cash generation has been well managed during the year, resulting in an overall cash inflow in 2015, reducing net debt by $20.5m to $110.5m at 31 December 2015.
Net assets at 31 December 2015 were $1,168.1m, which, after non-controlling interests of $26.2m, result in equity shareholders’ funds of $1,141.9m (2014 – $1,408.1m). This is a decrease of $266.2m over 31 December 2014, which reflects the loss for the year attributable to equity shareholders of $226.6m and $39.8m of dividend payments, offset by other items of $0.2m
Balance Sheet
2015$m
2014$m
Goodwill 230.6 440.6Other intangible assets 180.4 224.8Property, plant and equipment 460.8 473.0Working capital 365.8 470.6Taxation (current and deferred) 10.7 (55.2)Provisions (18.0) (24.7)Other net assets 48.3 40.2Capital employed 1,278.6 1,569.3Net debt (110.5) (131.0)Net assets 1,168.1 1,438.3Non-controlling interests (26.2) (30.2)Equity attributable to owners of the parent 1,141.9 1,408.1
Given the severe downturn across the energy industry in 2015, management undertook an impairment review exercise ahead of the Group’s half and full-year results, as noted previously. Both exercises analysed the carrying value of goodwill for each relevant cash generating unit across the Group, based on future cash projections, while adopting appropriate discount rates. Impairment to goodwill recorded in the year totalled $208.2m. Further details of the impairment are detailed in note 15 of the 2015 Annual Report and Accounts. Other changes to goodwill relate to an adverse impact from foreign exchange of $1.8m. As a result, the Group’s goodwill has decreased by $210.0m compared to 2014.
HUNTING SUBSEA MAKES HIGH PERFORMANCE VALVES FOR USE IN DEEP WATER APPLICATIONS

Hunting PLC2015 Annual Report and Accounts
44
CORPORATE AND SOCIAL RESPONSIBILITY
The relationships developed with stakeholders are critical to the Group’s business success and in order to ensure its continued growth, Hunting constantly evaluates ways to strengthen links with investors, customers, suppliers, employees, governments and the communities in which its businesses operate.
The responsibility for building and maintaining our reputation with stakeholders extends from the Board, to our executive management and to those employees working at an operational level. Hunting continues to update and introduce policies on governance, ethics and business conduct.
Further details on the Group’s governance framework can be found within the Corporate Governance Report on pages 50 to 53.
The Board believes that the combined policies covering these areas continued to remain effective during the year. The Board also believes that the policies in place covering other key areas such as human rights, bribery and corruption, sanctions and compliance with all other relevant laws and regulations remained effective in the period.
Code of ConductThrough the Group’s Code of Conduct, Hunting has published the basis on which our employees interact with our customers and suppliers around the world. This commitment to do business in an ethical and transparent way enables Hunting to occupy a position of trust with our partners. As part of our established procedures, the Code of Conduct is sent to all major trading partners around the world.
Human RightsHunting is committed to upholding the Human Rights of all stakeholders and in 2014 published its global Human Rights Policy which is incorporated within the Group’s Code of Conduct. This policy extends to:
• providing a safe working environment for all employees and contractors;
• respecting the rights of the individual with a zero tolerance to any form of discrimination, harassment or bullying;
• providing training and development programmes to the global workforce;
• not employing child labour; • promoting good relationships with all communities in
which we operate; • operating in an environmentally responsible manner; and • compliance with legislation in all relevant territories.
Payments to GovernmentsThe Group has implemented procedures to comply with the UK’s Payments to Governments reporting requirements and will issue a public statement in relation to this area by 30 June 2016.
InvestorsCommunicating the position, performance and future strategy with the Group’s shareholders is of key importance to the Board of Directors. Communications include press releases issued to the London Stock Exchange, industry analyst and institutional investor presentations and webcasts and interacting with shareholders at general meetings of the Company.
Other communications include an in-house corporate publication, the Hunting Review, which is published twice a year.
The Company is quoted on the London Stock Exchange and has a premium listing status, indicating its commitment to the UK’s highest standards of regulation and corporate governance as published by the Financial Conduct Authority. The Company is also required to comply with the UK Corporate Governance Code, UK Company Law and the laws and regulations of the jurisdictions in which it operates.
Customers and SuppliersHunting’s customers and suppliers are an integral part of the success of the Group. Developing relationships with these partners is essential to our long-term growth. The Hunting way of doing business is summarised in its Code of Conduct, with openness and transparency being key components of its reputation with long-term business partners.
Hunting is a signatory to the UK government’s Prompt Payment Code and is committed to making timely payments to suppliers, providing transparency and certainty to business partners.
AS AN INTERNATIONAL PRODUCTS AND SERVICES PROVIDER, HUNTING RELIES ON ITS REPUTATION
WITHIN THE ENERGY INDUSTRY.
PATRIOT PAWS SERVICE DOGS – HUNTING’S CHOSEN CHARITY FOR 2015

GEOGRAPHICAL SPLIT OF EMPLOYEES(YEAR END ACTUALS)
UK
2015
2014
349
424
REST OF EUROPE
2015
2014
76
87
US
2015
2014
1,680
2,479
ASIA PACIFIC
2015
2014
457
694
CANADA
2015
2014
138
276
OTHER
2015
2014
84
43
ST
RA
TE
GIC
RE
PO
RT
CO
RP
OR
AT
E G
OV
ERN
AN
CE
FIN
AN
CIA
L S
TA
TE
MEN
TS
OT
HER
INF
OR
MA
TIO
N
Hunting PLC2015 Annual Report and Accounts
45
The Board has established “whistleblowing” procedures for any employee wishing to raise, in confidence, any concerns they may have about possible financial improprieties, or other matters, with the Chairman or Senior Independent Director. The Group also has in place an independent and anonymous whistleblowing reporting service operated by Safecall Limited with the contact details communicated to all employees.
DiversityHunting’s diversity policy is detailed within the Corporate Governance Report. The Group seeks to ensure equal opportunities are given to its global workforce across the whole spectrum of diversity areas, including gender.
The Group’s gender balance is presented in the table below:
Total number of Directors/officers/
employees Males % Females %
2015 2014 2015 2014 2015 2014
Board 7 6 86 100 14 0Senior Management 146 140 93 93 7 7Whole Workforce 2,784 4,003 80 82 20 18
Hunting’s senior management is defined as those employees who have influence in the daily running of the Group’s major operational businesses and activities, including the number of persons who are directors of subsidiary undertakings within the Group.
In order to promote its standing within the oil and gas sector, Group companies hold memberships with a variety of organisations including:
• American Petroleum Institute • Society of Petroleum Engineers • The International Coiled Tubing Association • American Society for Quality • Investors in People
EmployeesHunting recognises that its success and reputation depends upon the efforts, integrity and commitment of its global workforce. Responsibility for employees lies with local management, which allows local cultural issues to be appropriately managed and the necessary development programmes to be structured accordingly. The demographic of the Group’s employees reflects the global nature of the oil and gas industry and the geographic diversity of the Group’s activities.
At 31 December 2015, the Group had 2,784 employees (2014 – 4,003). During the year, and reflecting the downturn across Hunting’s core energy markets, a reduction in work force programme was implemented across the Group to reduce costs.
The Group seeks to adhere to all relevant local and jurisdictional laws covering employment and minimum wage legislation. As a responsible employer, full and fair consideration is given to applications for positions from disabled persons and to their training and career advancement. Every effort is made to retain in employment those who become disabled while employed by the Group.
It is important for the Group to retain key employees and to recruit high quality candidates. The Group therefore provides additional benefits to staff including participation in schemes that provide healthcare and post-retirement benefits and, in certain instances, participation in bonus arrangements when outperformance in terms of operational excellence has been achieved. Hunting has share award schemes in place as a longer-term incentive and to encourage employees to participate in the ownership of the Company.

Hunting PLC2015 Annual Report and Accounts
46
CORPORATE AND SOCIAL RESPONSIBILITY
CONTINUED
CommunityHunting’s responsibilities to the communities in which it operates extends on many fronts. The Group participates in a number of initiatives and events that raise money for charities and community projects around the world. In 2015, many Hunting employees participated in local charitable events with associated corporate support.
The Hunting Art Prize is an annual event hosted in Houston that supports local community organisations. In 2015, Hunting’s chosen charity was Patriot PAWS Service Dogs. Patriot is dedicated to training dogs to assist disabled service veterans and others with mobile disabilities. Patriot is also Hunting’s designated charity for 2016.
The Group also makes donations to various UK charities through the Chairman’s charitable trust committee, which comprises the Chairman and former Hunting employees. In 2015, assistance was granted to 18 charities. During 2015, the Group donated $0.3m (2014 – $0.4m) to charities.
Health and SafetyThe Group operates from 42 principal manufacturing facilities and 35 service and distribution points across the globe and all are committed to achieving and maintaining the highest standards of safety for its employees, customers, suppliers and the public.
Hunting has a proven culture of aiming for best practice and employs rigorous health and safety practices. Health and Safety policies include:
• Regular audit and maintenance reviews of facilities, equipment, practices and procedures to ensure compliance with prevailing standards and legislation and a safe environment for all those who work within and around our facilities;
• Seeking accreditation and aligning long-standing Company programmes and procedures to internationally recognised Quality Assurance standards;
• Monitoring, which is a management task, is documented and reported at Board level;
• Appropriate training and education of all staff; and • A Group policy on health, safety and environmental
matters, which can be found on the Company’s website www.huntingplc.com.
HUNTING’S SINGAPORE OPER ATIONS SUPPORT LOCAL COMMUNITIES INCLUDING OLD PEOPLE’S HOMES
Hunting’s Director of Health, Safety and Environment reports directly to the Chief Executive and a report is considered by the Board of Directors at each meeting.
The Group’s target is to achieve zero recordable incidents. Each local business is required to develop tailored policies to suit their environment. These incorporate the Group’s approach to putting safety first and, at a minimum, to comply with local regulatory requirements. Training is given to every employee throughout the Group.
During the year, there were no fatalities across the Group’s operations with 36 recordable incidents (2014 – 81). The incident rate, as calculated from guidance issued by the Occupational Safety and Health Administration in the US, was 1.13 compared to 1.92 in 2014. The industry average incident rate in 2015 was 4.3 (2014 – 5.3).
Quality and Manufacturing ExcellenceThe Group is committed to enhancing its production and operational quality with a number of facilities being certified ISO 9001 (quality), 14001 (health and safety) and 18001 (environmental) compliant, indicating that globally recognised standards and systems are in place. The table below presents the adoption of the ISO accreditations across the Group’s manufacturing facilities:
ISO Accreditation
Number offacilities
accredited
% ofmanufacturing
facilities
ISO 9001 21 50%ISO 14001 7 17%ISO 18001 2 5%
More facilities across the Group are working towards these accreditations, continuing the Group’s commitment to monitoring and reducing the environmental impact of its operations and increasing HS&E standards.
Operational and production excellence is a key feature of our relationship with customers, therefore quality assurance for each component manufactured is a key indication of our drive to be an industry leading provider of critical components and measurement tools.
In 2015, the Group continued its programme to introduce lean manufacturing processes into global operations. This resulted in efficiency gains in a number of key business units.

ST
RA
TE
GIC
RE
PO
RT
CO
RP
OR
AT
E G
OV
ERN
AN
CE
FIN
AN
CIA
L S
TA
TE
MEN
TS
OT
HER
INF
OR
MA
TIO
N
Hunting PLC2015 Annual Report and Accounts
47
Total emissions are converted to a carbon dioxide equivalent figure, using guidance and conversion factors detailed in the UK government’s Environmental Reporting Guidance as published by DEFRA (www.gov.uk/defra).
The following table details Hunting’s Scope 1 and 2 emissions:
Carbon Dioxide Equivalent Emissions (tonnes)
2015 2014%
Change
Scope 1 6,381 8,113 -21.3Scope 2 26,329 34,059 -22.7Total controlled emissions 32,710 42,172 -22.4
The Group also collects mains water usage data and in 2015 consumed 223k cubic metres (2014 – 290k cubic metres) of water.
The Group’s emissions are primarily a function of the production activity within its operating facilities, therefore the Group’s facilities square footage has been adopted as the basis of the intensity factor presented below:
Intensity Factor
2015 2014%
Change
Total controlled emissions (tonnes) 32,710 42,172 -22.4Facilities footprint (’000 square feet) 3,151 2,806 +12.3Intensity Factor 10.4 15.0 -30.9
For 2016, Hunting is planning to enhance its greenhouse gas reporting, in line with the European Union’s GHG Protocol, which includes collecting individual Scope 2 emissions factor data for each facility within the Group.
2015 has seen the Group continue to develop and enhance its relationships with all stakeholders with a commitment from all levels of the Group to deliver value for its partners in the long term.
D E N N I S P R O C T O R P E T E R R O S ECHIEF EXECUTIVE FINANCE DIRECTOR
3 March 2016
EnvironmentThe Group is committed to the protection of the environment and developing manufacturing processes and procedures, which ensure that any adverse effects on the environment are kept to a minimum.
The Group’s environmental policy is to look for opportunities and adopt practices that create a safer and cleaner environment. It is particularly sensitive to the challenges of the industry in which it operates. The Group has programmes in place to monitor the environmental impact from its operational activities and remains focused on ensuring environmental consideration is at the forefront of its business practices.
Key aspects of our environmental policies include:
• Raising awareness of the environment within the workplace through noticeboard communications;
• Encouraging the reduction of waste and emissions and promoting awareness of recycled materials and use of renewable resources;
• Each operating unit developing and implementing its own procedures while conducting regular reviews to ensure that they are maintained and refined;
• Encouraging employees to pay special regard to environmental issues and requirements in the communities in which the Group operates; and
• Incorporating health, safety and environment considerations into the design of new facilities.
The Group monitors and collects data relating to greenhouse gas emissions from across its operations and submits data to the UK’s Carbon Disclosure Project. Further, during the year Hunting has completed internal energy audits across its UK facilities to comply with the UK government’s Energy Savings Opportunity Scheme.
In compliance with UK environmental legislation, each business unit across the Group has reported Scope 1 and 2 emissions to provide a consolidated total of each source of greenhouse gas emissions for the year ended 31 December 2015. Scope 1 emissions result from direct sources such as fossil fuels consumed onsite. Scope 2 emissions are indirect emissions such as electricity consumed by a business. The reporting basis for emissions has been presented on an operational control basis, with data collected on the six greenhouse gases highlighted by the Kyoto Protocol.
FROM CONCEPTION TO COMMISSIONING, ENVIRONMENTAL CONSIDER ATIONS ARE AT THE FOREFRONT OF OUR BUSINESS PR ACTICES

Hunting PLC2015 Annual Report and Accounts
48
BOARD OF DIRECTORS
R I C H A R D H U N T I N G C . B . E .NON-EXECUTIVE CHAIRMAN
J O H N H O F M E I S T E RSENIOR INDEPENDENT DIRECTOR AND NON-EXECUTIVE DIRECTOR
D E N N I S P R O C T O RCHIEF EXECUTIVE
P E T E R R O S EFINANCE DIRECTOR
NationalityBritish
Length of service43 years; elected an executive Director and Deputy Chairman on the formation of Hunting PLC in 1989 and has been Chairman of the Board since 1991. In 2011, Richard moved from an executive to a non-executive role.
Skills and experiencePrior to his appointment as Chairman, Richard held a variety of management positions around the Hunting Group.
External appointmentsNone.
Committee membershipNomination Committee (Chairman) and by invitation.
NationalityAmerican
Length of service7 years; appointed to the Board as a non-executive Director in 2009.
Skills and experienceJohn is the former president of Shell Oil Company and a former group director of Royal Dutch Shell PLC in The Hague, Netherlands.
External appointmentsJohn is the founder and chief executive officer of the Washington D.C. registered not-for-profit Citizens for Affordable Energy, Inc. and a non-executive director of Erin Energy Corporation and Applus Services SA.
Committee membershipAudit Committee. Nomination Committee. Remuneration Committee (Chairman).
NationalityAmerican
Length of service23 years; appointed to the Board as a Director in 2000 and Chief Executive in 2001. Dennis was chief executive of Hunting Energy Services from March 2000 after joining the Group in 1993.
Skills and experienceDennis has held senior positions in the oil services industry in Europe, the Middle East and North America.
External appointmentsNone.
Committee membershipNomination Committee and by invitation.
NationalityBritish
Length of service19 years; appointed to the Board as Finance Director in 2008.
Skills and experiencePeter is a Chartered Accountant and prior to joining Hunting held senior financial positions with Babcock International.
External appointmentsNone.
Committee membershipBy invitation.

ST
RA
TEG
IC R
EPO
RT
CO
RP
OR
AT
E G
OV
ER
NA
NC
EF
INA
NC
IAL
ST
AT
EM
ENT
SO
TH
ER IN
FO
RM
AT
ION
Hunting PLC2015 Annual Report and Accounts
49
A N N E L L B AYNON-EXECUTIVE DIRECTOR
J O H N G L I C KNON-EXECUTIVE DIRECTOR
J O H N N I C H O L A SNON-EXECUTIVE DIRECTOR
NationalityAmerican
Length of service1 year; appointed to the Board as a non-executive Director in 2015.
Skills and experienceAnnell was formerly a vice-president of global exploration at Marathon Oil Corporation and prior to that vice-president of Americas Exploration at Shell Exploration and Production Company.
External appointmentsAnnell is currently a non-executive director of Apache Corporation, a global oil and gas exploration and production company.
Committee membershipAudit Committee. Nomination Committee. Remuneration Committee.
NationalityAmerican
Length of service1 year; appointed to the Board as a non-executive Director in 2015.
Skills and experienceJohn (“Jay”) was formerly the president and chief executive officer of Lufkin Industries Inc and prior to that held several senior management roles within Cameron International Corporation.
External appointmentsJay is currently a non-executive director of TETRA Technologies Inc, a geographically diversified oil and gas services company.
Committee membershipAudit Committee. Nomination Committee. Remuneration Committee.
NationalityBritish
Length of service7 years; appointed to the Board as a non-executive Director in 2009.
Skills and experienceJohn is a Fellow of the Association of Chartered Certified Accountants. He was formerly the group finance director of Tate & Lyle PLC and prior to that the group finance director of Kidde PLC.
External appointmentsJohn is currently the non-executive chairman of Diploma PLC and a non-executive director of Rotork PLC and Mondi plc.
Committee membershipAudit Committee (Chairman). Nomination Committee. Remuneration Committee.

Hunting PLC2015 Annual Report and Accounts
50
CORPORATE GOVERNANCE REPORT
ComplianceThe Board of Hunting PLC has adopted governance principles aligned to the 2014 UK Corporate Governance Code (the “Code”).
The Company is reporting its corporate governance compliance against the Code. During the year, Hunting was compliant with the provisions of the Code, with the exception of the following:
Provision A.3.1 requires the Chairman, on appointment, to be independent. For information regarding non-compliance with this provision see below. Provision C.3.7 requires the Company to put the external audit contract out to tender at least once every 10 years. For information regarding non-compliance with this provision refer to page 57 of the Audit Committee report.
Provisions C.3.1 and D.2.1 requires that the Audit and Remuneration Committees comprise a minimum number of independent directors. Up to the appointment of Jay Glick and Annell Bay on 2 February 2015, the Company was not compliant with these provisions.
Governance FrameworkSubject to the Company’s Articles of Association, UK legislation and any directions prescribed by resolution at a general meeting, the business of the Company is managed by the Hunting Board. The Board is responsible for the management and strategic direction of the Company, with three committees to which it delegates key governance and compliance procedures: the Nomination Committee, whose activities are incorporated into this report; the Audit Committee, whose report can be found on pages 55 to 58; and the Remuneration Committee, whose report can be found on pages 59 to 72.
Board CompositionThe Board comprises the Chairman, Chief Executive, Finance Director and four independent non-executive Directors, which includes the Senior Independent Director.
There is a clear division of responsibilities between the Chairman and Chief Executive. The Chairman is responsible for leading the Board, including setting its agendas and ensuring that materials are distributed in a timely manner. He also facilitates the discussion of key matters between all the Directors. The Chief Executive’s responsibilities include managing the day-to-day running of the Company and recommending the strategic direction of Hunting’s activities, whilst ensuring internal controls and operating and financial reporting procedures are implemented and remain appropriate. The independent non-executive Directors of Hunting are a key source of expertise and contribute to the delivery of the Company’s strategic goals. Non-executive Directors are chosen from the oil and gas industry and regulatory sectors in which Hunting operates. Three non-executive Directors have a strong track record within the US energy industry, where the majority of Hunting’s operations are based and where a high proportion of the Company’s results are derived.
All non-executive Directors of the Company are believed to be independent, with the exception of the Chairman, who was an executive Director of the Company from the formation of Hunting PLC in 1989 until 2011. As at 31 December 2015, and excluding the Chairman, the Board comprised of 67% independent non-executive Directors. All the non-executive Directors have access to professional advisers, at the Company’s expense, to fulfil their various Board and Committee duties.
“DURING 2015 HUNTING REVIEWED ITS GOVERNANCE AND RISK MANAGEMENT
REPORTING FRAMEWORK IN ORDER TO ENSURE THE HIGHEST STANDARDS OF CORPORATE
GOVERNANCE ARE MAINTAINED ACROSS THE GROUP. THE BOARD VIEW THIS AS ESSENTIAL TO SUPPORTING LONG-TERM SHAREHOLDER VALUE.
HUNTING’S ETHOS THROUGHOUT THE ORGANISATION IS TO ACT WITH HONESTY AND INTEGRITY WITH ALL OUR BUSINESS
PARTNERS – THIS WAY OF DOING BUSINESS PROMOTES OUR GOVERNANCE FRAMEWORK
AND VALUES TO EACH OF OUR STAKEHOLDERS.
WE HAVE ALSO REVISED AND ENHANCED OUR STRATEGIC REPORT WHICH IS AIMED
AT INCREASING SHAREHOLDER UNDERSTANDING OF HOW WE CREATE VALUE AND PLAN FOR
FUTURE GROWTH. AS PART OF THIS PROCESS, AND IN LINE WITH THE REVISED UK CORPORATE
GOVERNANCE CODE RECOMMENDATIONS, WE HAVE ENHANCED OUR RISK MANAGEMENT
REPORTING TO SUPPORT OUR GOING CONCERN AND VIABILITY STATEMENTS.”
R I C H A R D H U N T I N G C . B . E .CHAIRMAN

ST
RA
TEG
IC R
EPO
RT
CO
RP
OR
AT
E G
OV
ER
NA
NC
EF
INA
NC
IAL
ST
AT
EM
ENT
SO
TH
ER IN
FO
RM
AT
ION
Hunting PLC2015 Annual Report and Accounts
51
The Company Secretary is appointed by the Board and supports the Chairman in providing all board materials and information flows between the executive and non-executive Directors, specifically in matters of governance and regulatory compliance. The Company Secretary is also available to the Board and all its Committees for advice and ensures that all procedures are followed.
Directors’ and Officers’ Liability InsuranceHunting maintains insurance against certain liabilities, which could arise from a negligent act or a breach of duty by the Directors and Officers in the discharge of their duties. This is a qualifying third-party indemnity provision which was in force throughout the year.
Work Undertaken by the Board During 2015The Board met six times in 2015 and each Director attended all scheduled Board meetings. During 2015, the standing items and other items for Board meetings included the following business:
Mar Apr Jun Aug Oct Dec
Standing itemsChief Executive UpdateFinance Director ReportOperational ReportsQuality, HS&E ReportsShareholder ReportOther itemsAnnual Report and Final DividendBoard Evaluation ResultsRisk ReviewAGM PreparationTrading StatementStrategyFinancial Personnel SuccessionHalf Year Report and Interim DividendAnnual BudgetNon-executive Director RemunerationChairman/Senior Independent Director Investor FeedbackAnnual Board Evaluation
At each Board meeting the Chief Executive updates the Board on key operational developments, provides an overview of the market, reports on health and safety, and highlights important milestones reached towards the delivery of Hunting’s strategic objectives. The Finance Director provides an update on the Group’s financial performance, banking arrangements, legal issues, analyst discussions and statutory reporting developments relevant to Hunting. These topics lead to discussion, debate and challenge amongst the Directors.
The Directors, together with brief biographical details, are identified on pages 48 and 49. All independent non-executive Directors are appointed to all Board committees.
The attendance of the Directors at Board and Committee meetings during 2015 is detailed in the table below:
BoardNominationCommittee
AuditCommittee
RemunerationCommittee
Number of meetings held 6 2 4 5Number of meetings actual/possible:Richard Hunting 6/6 2/2 – –Dennis Proctor 6/6 2/2 – –Peter Rose 6/6 – – –Annell Bay 6/6 1/1 4/4 5/5Jay Glick 6/6 1/1 4/4 5/5John Hofmeister 6/6 2/2 4/4 5/5John Nicholas 6/6 2/2 4/4 5/5
Board Appointments and Nomination CommitteeHunting’s Nomination Committee comprises the Company’s non-executive Chairman (Committee Chairman), Chief Executive and the independent non-executive Directors. The terms of reference of the Nomination Committee can be found on the Company’s website at www.huntingplc.com. At 31 December 2015, excluding the Chairman, 67% of the Committee comprised of independent non-executive Directors.
During 2015, the Nomination Committee met twice, in January to approve and recommend the appointment of Annell Bay and Jay Glick and in June to consider and recommend the reappointments of John Hofmeister and John Nicholas.
All appointments to the Board are in accordance with the Company’s Articles of Association and the Code. In February 2015 Annell Bay and Jay Glick were appointed to the Board, following a search process. Ms Bay and Mr Glick are both US residents and have a strong track record within the energy industry, including the exploration and manufacturing segments of the sector in which Hunting operates. Ms Bay and Mr Glick were also reappointed by shareholders at the Company’s 2015 AGM. Boyden Associates were engaged by the Company to assist with the recruitment process. Boyden Associates does not have any connection to Hunting other than for this search mandate.
Ms Bay and Mr Glick have undertaken a formal induction process since appointment, which included site visits to facilities in the US and meeting with senior management across the Company. The Chairman has also met with the non-executive Directors throughout the year, to discuss, among other matters, training and development.
On appointment, each non-executive Director is provided with a letter of appointment, outlining the time commitments, responsibilities and fiduciary duties required under Company Law and, following Company policy, are appointed for a three-year term. All appointment letters are available for inspection at the Company’s AGM or at Hunting’s registered office.
In August 2015, John Hofmeister and John Nicholas were each reappointed for a final three-year term, following a formal appraisal and evaluation process, led by the Nomination Committee.
As prescribed by the Code, all the Directors submit themselves for annual re-election at the Company’s AGM and at the 2015 AGM all Directors were re-elected by shareholders.

Hunting PLC2015 Annual Report and Accounts
52
CORPORATE GOVERNANCE REPORTCONTINUED
Going Concern Assumption and Viability StatementThe Audit Committee and Board review the Going Concern Assumption twice a year and the Group’s Viability Statement annually, in parallel to supporting reports from the executive Directors and Hunting’s central finance function. On 1 March 2016 the Board approved the Going Concern Assumption and Viability Statement, which is detailed on page 30.
Risk Management ProceduresThe Board acknowledges its responsibility for monitoring the Group’s principal risks and system of internal control and for reviewing its effectiveness as required by the Code, with key authorities being delegated to the Audit Committee.
Hunting’s risk management framework, system of internal control and principal risks are detailed in the Strategic Report on pages 22 to 30.
Shareholders The Company uses a number of processes for communicating with shareholders, including Stock Exchange announcements, the annual and half-year reports, webcasts, trading statements and the AGM to which all shareholders are invited. In addition, the Chief Executive and Finance Director meet on a one-to-one basis with principal shareholders at least twice a year, following the Group’s annual and half-year results, or when requested to update them on Group performance and strategy. The Board is in turn briefed by the Chief Executive, when appropriate, on matters raised by shareholders.
During the year, the Chairman and Senior Independent Director also met with a number of shareholders to discuss strategy, governance and other matters. Their comments were passed on to the Board by the Chairman. The non-executive Directors are also available to meet shareholders.
During the latter part of 2015, the Remuneration Committee consulted with certain of the Company’s institutional shareholders to discuss amendments to the operation of the Group’s Hunting Performance Share Plan (“the Hunting PSP”).
In 2015 the Company also appointed a Head of Investor Relations to enhance engagement between Hunting and its shareholders and the investment community.
During the year, management succession was a regular discussion topic of the Board and Nomination Committee, with key positions and succession plans being considered. In 2012, the Company issued its gender diversity policy for new Director appointments. Hunting’s diversity policy commits the Group to:
• an embedded culture of equal opportunities for all employees, regardless of gender;
• require external recruitment consultants to submit their diversity policies to the Group prior to appointment;
• ensure that external consultants appointed by Hunting provide candidate shortlists comprising of an appropriate gender balance for consideration by the Nomination Committee;
• a target of at least one female Director of the Company when practicable; and
• a periodic review by the Nomination Committee of its progress in complying with the Davies Report’s recommendations.
The above policies and procedures were adopted and documented by the Nomination Committee for the appointment of Ms Bay and Mr Glick. Following the appointment of Annell Bay, Hunting has met its stated diversity target and is more aligned with the recommendations of the Davies Report.
Board EvaluationThe Directors undertake an annual evaluation of the Board and its Committees, which includes completion of a detailed questionnaire on the operation and governance responsibilities in relation to the Company’s governance framework. Both the executive and non-executive Directors are appraised collectively and individually, with the results of the process reported to the Board through the Chairman.
In 2015, the Company completed an externally facilitated evaluation which was managed by IDDAS. IDDAS has no other connection to the Company other than in facilitating this process. The process included a review of Board and Committee materials and individual interviews with each of the Directors and the Company Secretary. A report on the findings of the evaluation was presented at the December 2015 meeting of Directors. No significant issues were highlighted and the evaluation indicated that the Board is operating well and remains effective.
Further, the Chairman’s performance was evaluated in a separate exercise by the non-executive Directors in December 2015, led by John Hofmeister, the Company’s Senior Independent Director. The non-executive Directors concluded that Mr Hunting had been an effective and able Chairman of the Company throughout the year.
Board AccountabilityThe Board has procedures in place to review all shareholder communications, including the financial statements and Stock Exchange announcements issued by the Company. Hunting’s business model and strategy is detailed on pages 9 to 21. The Board has delegated the responsibility of assessing whether the financial statements are fair, balanced and understandable to the Audit Committee. Further details of the responsibilities of the Audit Committee, can be found within its report.

ST
RA
TEG
IC R
EPO
RT
CO
RP
OR
AT
E G
OV
ER
NA
NC
EF
INA
NC
IAL
ST
AT
EM
ENT
SO
TH
ER IN
FO
RM
AT
ION
Hunting PLC2015 Annual Report and Accounts
53
The Directors have been authorised to allot and issue Ordinary shares and to disapply statutory pre-emption rights. These powers are exercised under authority of resolutions of the Company passed at its AGM. During the financial year ended 31 December 2015, 372,831 Ordinary shares were issued pursuant to the Company’s various share plans. Further, the Company has authority, renewed annually, to purchase up to 14.99% of the issued share capital, equating to 22,255,455 shares. Any shares purchased will either be cancelled, and the number of Ordinary shares in issue reduced accordingly, or held in Treasury. During 2015, no Ordinary shares were purchased by the Company, under this authority.
These powers are effective for 15 months from the date of shareholder approval, or up to the next general meeting where new authorities are sought. The Directors will be seeking new authorities for these powers at the 2016 AGM.
Employee Share TrustThe Group operates an Employee Share Trust (the “Trust”) as a vehicle to satisfy shares options and awards granted to employees who participate in the Company’s share-based incentive schemes. At 31 December 2015, the Trust held 914,225 Ordinary shares in the Company (2014 – 980,996). The Trust has a policy to purchase shares in the market or subscribe for new shares to meet the future requirements of these incentive schemes. During the year, the Trust did not subscribe for any Ordinary shares.
In accordance with Listing Rule 9.8.4C the Trust has waived all dividends payable by the Company and voting rights in respect of the Ordinary shares held by it. Total dividends waived by the Trust in the financial year to 31 December 2015 were $253,046.
By Order of the Board
R I C H A R D H U N T I N G C . B . E . CHAIRMAN
3 March 2016
The Company’s major shareholders, as at 31 December 2015, are listed below:
Notes
Number ofOrdinary
shares
Percentageof issuedOrdinary
shares
AXA group of companies (6) 15,482,234 10.4Hunting Investments Limited (1/4/5) 11,073,487 7.4European Value Partners 7,340,305 4.9Franklin Templeton group of companies 6,095,439 4.1Slaley Investments Limited (5) 6,411,679 4.3J Trafford – as trustee (2/5) 6,025,864 4.0M Pickering – as trustee (2/5) 5,722,170 3.8David RL Hunting (5) 199,910 0.1– as trustee (2/5) 2,549,117 1.7– other beneficial (3/5) 2,484,583 1.7
Notes:1. Included in this holding are 9,437,743 Ordinary shares held by Huntridge
Limited, a wholly owned subsidiary of Hunting Investments Limited. Neither of these companies is owned by Hunting PLC either directly or indirectly.
2. After elimination of duplicate holdings, the total Hunting family trustee interests shown above amount to 6,025,864 Ordinary shares.
3. Arise because David RL Hunting and his children are or could become beneficiaries under the relevant family trusts of which David RL Hunting is a trustee.
4. Richard H Hunting (Chairman of Hunting PLC) and David RL Hunting are both directors of Hunting Investments Limited.
5. In 2014, Hunting Investments Limited, Slaley Investments Limited, certain Hunting family members, including Richard H Hunting and David RL Hunting and the Hunting family trusts, to which Martin Pickering and James Trafford are trustees (together known as “the Hunting Family Interests’) entered into a voting agreement. The voting agreement has the legal effect of transferring all voting rights of Hunting PLC Ordinary shares held by the Hunting Family Interests to a voting committee. The beneficial ownership of Hunting PLC Ordinary shares remains as per the table shown above. At 3 March 2016, the Hunting Family Interests party to the agreement totalled 25,510,438 Ordinary shares in the Company, representing 17.14% of the total voting rights.
6. On 17 February 2016, the Company was notified that AXA Investment Managers S.A. had increased its holding to 16,477,932 Ordinary shares, representing 11.07% of the issued share capital.
Annual General MeetingThe AGM of the Company will take place on Wednesday, 13 April 2016 at The Royal Automobile Club, 89 Pall Mall, London SW1Y 5HS, commencing at 10.30 a.m. to which all shareholders are invited. Shareholder voting procedures follow the provisions of the Articles of Association and the Code, including a separate resolution on each material item of business, the availability of voting via proxy and the offer of a “vote withheld”. At the 2016 AGM, all resolutions will be voted on by way of a poll.
Further details of the resolutions and voting procedures are set out in the Notice of AGM. Shareholders can vote by completing the form of proxy sent with the Notice of Meeting, or by submitting votes electronically via the Registrars’ website www.sharevote.co.uk or via their online portfolio service, Shareview, if registered as a member. Alternatively, shares held in CREST may be voted through the CREST Proxy Voting Service. To be valid, all votes must be received no later than 48 hours before the time set for the meeting.

Hunting PLC2015 Annual Report and Accounts
54
DIRECTORS’ REPORT
For the purpose of section 415 of the Companies Act 2006, the Directors present their report and the audited financial statements of Hunting PLC for the year ended 31 December 2015.
The Strategic Report, incorporating the Chairman’s and Chief Executive’s Statements, Business Model and Strategy, Key Performance Indicators, Risk Management, Group Performance and Development, Outlook and Corporate and Social Responsibility Report, is located on pages 2 to 47.
As permitted by legislation, the Board has chosen to set out, within the Strategic Report, some of the matters required to be disclosed in the Directors’ Report which it considers to be complementary to communicating Hunting’s performance and position, as follows:
• changes in the Group and its interests (pages 6 to 8 and 32); • future developments (page 8); • risk management, objectives and policies (pages 22 to 30); • inclusion and diversity (page 45); and • greenhouse gas emissions (page 47).
Up to the date of this report there were no disclosable post balance sheet events in respect of the 2015 financial year.
In addition, information relating to the Directors’ indemnity provisions, substantial shareholder interests and dividend waivers as required by legislation are disclosed within the Corporate Governance report on pages 50 to 53 and pages 139 to 141 respectively.
Investor-related information and further disclosures incorporated into the Directors’ Report, such as information relating to the AGM, dividends, Directors’ powers and interests, share capital, political donations, research and development and significant agreements, can be found within the Shareholders’ Information section located on pages 139 to 141.
Statement of Directors’ ResponsibilitiesThe Directors are responsible for preparing the Annual Report, the Audit and Remuneration Committee Reports, and the financial statements in accordance with applicable laws and regulations.
Company Law requires the Directors to prepare financial statements for each financial year. Under that law, the Directors have prepared the Group and parent Company financial statements in accordance with International Financial Reporting Standards (“IFRSs”) as adopted by the European Union (“EU”).
Under Company Law, the Directors must not approve the financial statements unless they are satisfied that they give a true and fair view of the state of affairs of the Group and the Company and of the profit or loss of the Group for the year.
In preparing these financial statements, the Directors are required to:
• select suitable accounting policies and apply them consistently;
• make judgements and accounting estimates that are reasonable and prudent;
• state whether applicable IFRSs as adopted by the EU have been followed, subject to any material departures disclosed and explained in the financial statements; and
• prepare the financial statements on going concern basis, unless it is inappropriate to presume that the Company will continue in business.
The Directors are responsible for keeping adequate accounting records that are sufficient to show and explain the Group’s and Company’s transactions and disclose with reasonable accuracy at any time the financial position of the Group and the Company and to enable them to ensure that the financial statements and the Remuneration Committee Report comply with the Companies Act 2006 and, as regards the Group financial statements, Article 4 of the IAS Regulation. The Directors are also responsible for safeguarding the assets of the Group and the Company and for taking reasonable steps for the prevention and detection of fraud and other irregularities.
The Directors are also responsible for the maintenance and integrity of the Group’s website, www.huntingplc.com. Legislation in the United Kingdom governing the preparation and dissemination of financial statements may differ from legislation in other jurisdictions.
Pursuant to the Financial Conduct Authority’s Listing Rules, Disclosure and Transparency Rules and the UK Corporate Governance Code, each of the Directors, whose names and responsibilities are listed on pages 48 and 49, confirm that, to the best of their knowledge and belief:
• the financial statements, prepared in accordance with IFRSs as adopted by the EU, give a true and fair view of the assets, liabilities, financial position and profit/loss of the Group and of the Company;
• the Strategic Report on pages 2 to 47 includes a fair review of the development and performance of the Group’s operations and the year end position of the Group and the Company, together with a description of the principal risks and uncertainties they face. The Strategic Report also details the Group’s policies on human rights, gender balance and its Scope 1 and 2 greenhouse gas emissions;
• the Annual Report, taken as a whole, is fair, balanced and understandable and provides the information necessary for shareholders to assess a Company’s performance, business model and strategy.
By Order of the Board
B E N W I L L E YCOMPANY SECRETARY
3 March 2016

“IN 2015, THE AUDIT COMMITTEE CONTINUED ITS REVIEW AND MONITORING WORK IN LINE WITH THE BEST PRACTICE RECOMMENDATIONS
PUBLISHED BY THE FINANCIAL REPORTING COUNCIL .
GIVEN THE CURRENT TRADING ENVIRONMENT, THE COMMITTEE HAS SPENT CONSIDERABLE TIME
ASSESSING THE IMPACT OF THE INDUSTRY DOWNTURN ON THE GROUP’S FINANCIALS AND MORE SPECIFICALLY IN ASSESSING THE IMPAIRMENTS BOOKED AGAINST GOODWILL
AND PROPERTY, PLANT AND EQUIPMENT IN THE YEAR.
THE COMMITTEE HAS REVIEWED THE ENHANCED CONTROLS AND REPORTING
MEASURES DEVELOPED BY HUNTING IN THE YEAR, TO COMPLY WITH THE REVISED UK CORPORATE
GOVERNANCE CODE. THE COMMITTEE HAS ALSO REVIEWED THE GROUP’S RISK MANAGEMENT AND
VIABILITY STATEMENT DISCLOSURES AND RECOMMENDED THESE TO THE BOARD
FOR APPROVAL.”
J O H N N I C H O L A SCHAIRMAN OF THE AUDIT COMMIT TEE
ST
RA
TEG
IC R
EPO
RT
CO
RP
OR
AT
E G
OV
ER
NA
NC
EF
INA
NC
IAL
ST
AT
EM
ENT
SO
TH
ER IN
FO
RM
AT
ION
Hunting PLC2015 Annual Report and Accounts
55
AUDIT COMMITTEE REPORTFOR THE YEAR ENDED 31 DECEMBER 2015
Composition and Frequency of MeetingsThe Committee currently comprises all of the independent non-executive Directors of the Company and is chaired by John Nicholas. Annell Bay and Jay Glick were appointed to the Committee on their appointment to the Board of Directors on 2 February 2015.
Mr Nicholas has a professional accounting qualification and is considered to have recent and relevant financial experience; further details can be found in his biographical summary set out on page 49.
The Committee met four times during the year and operates under written terms of reference approved by the Board, which are published on the Company’s website at www.huntingplc.com.
The Committee normally meets in March, April, August and December, and the attendance record of Committee members during the year is noted on page 51. The Chairman, Chief Executive, Finance Director, internal and external auditors are normally invited to attend meetings. During the year, the Committee reviewed its effectiveness and the Committee Chairman reported these findings to the Board.
ResponsibilitiesThe principal responsibilities of the Audit Committee are to:
• monitor and review reports from the executive Directors, including the Group’s financial statements and Stock Exchange announcements;
• provide to the Board a recommendation about the Annual Report and Accounts, including whether they are fair, balanced and understandable;
• review the Company’s Going Concern Assumption and Viability Statement;
• monitor and review the Group’s systems of internal control; • assess the effectiveness of the Group’s systems of risk
management and internal control; • review reports from the Group’s external auditors; • review reports from the Group’s internal auditors, including
details of the internal audit programme and its scope; • monitor corporate governance and accounting developments; • monitor the Group’s Bribery Act compliance procedures; • consider and recommend to the Board the reappointment
of the external auditors; • agree the scope and fees of the external audit; • monitor and approve engagements of the external auditors
to provide non-audit services to the Group; and • review the external auditors’ independence, effectiveness of
the audit process, and assess the level and quality of service in relation to fees paid.

Hunting PLC2015 Annual Report and Accounts
56
AUDIT COMMITTEE REPORTFOR THE YEAR ENDED 31 DECEMBER 2015
CONTINUED
GoodwillThe year end balance sheet includes goodwill of $230.6m (2014 – $440.6m). This represents approximately 20% of the Group’s net assets (2014 – 31%).
Given the decline in trading, particularly in the second half of 2015, impairment charges to goodwill were recorded at the half year of $35.2m, with a further impairment charge recorded in the second half of the year of $173.0m, to give a full year impairment charge of $208.2m.
The Committee considered the appropriateness of the assumptions and challenged the discount rates and the factors used in the review process. After discussion, it was satisfied that the assumptions and the disclosures in the year end accounts were appropriate. Further, the Committee also noted the enhanced disclosures relating to impairment to be included in the 2015 Annual Report and Accounts.
Intangible AssetsThe carrying value of the Group’s intangible assets were also reviewed and resulted in an impairment charge of $11.2m being recorded in the full year – this being in addition to the regular amortisation charge booked in the year. As with the goodwill impairment charge the Committee considered the appropriateness of the assumptions, discount rates and factors used in the review process. The Committee also considered the disclosures made in the year end accounts in respect of the impairments.
Property, Plant and Equipment (“PPE”)The year end balance sheet includes PPE of $460.8m (2014 – $473.0m). This represents approximately 39% of the Group’s net assets (2014 – 33%).
A review of the carrying values of the rental equipment held within the Drilling Tools business unit was completed and, given the reduction in onshore drilling activity and the short to medium-term outlook in the recovery of this market segment, an impairment charge of $26.8m has been recorded against the carrying values of PPE.
The Committee reviewed the PPE impairment charge and following discussion was satisfied that the assumptions and the disclosures in the year end accounts were appropriate.
Oil and Gas Exploration and Development Asset ImpairmentThe Committee reviewed the valuation of estimated reserves held within the Group’s exploration and production segment and also considered the appropriateness of the future prices for oil and gas used to value reserves. After considering the valuation model, including the impact of recent weakness in oil prices, the Committee was satisfied that the reported impairment of oil and gas reserves was calculated appropriately.
TaxationIn view of the international spread of operations the Committee monitors tax risk, tax audits and provisions held for taxation. The Finance Director briefed the Committee on developments during the year.
Exceptional Items Charged to the Consolidated Income StatementThe Group reports a middle column within the Consolidated Income Statement which includes amortisation and exceptional items. The Committee considered the accounting policy definition of exceptional items and the items included within this column to ensure consistency of treatment and adherence to policy. The Committee also reviewed the calculation and composition of each exceptional item and has satisfied itself that they are reported appropriately.
Work Undertaken by Committee During 2015The Committee discussed, reviewed and made a number of decisions on key areas throughout 2015 which are set out below:
Mar Apr Aug Dec
Financial ReportingAnnual Report and Full-Year Results announcementGoing Concern AssumptionViability Statement*Final Dividend ProposalInterim Report and Interim Results announcementInterim Dividend ProposalDraft Annual ReportReview Accounting PoliciesInternal Control and Risk ManagementRisk management and internal control reportKey risks and mitigating controlsEffectiveness of internal controls and internal audit functionInternal Audit ReportProcedures for preventing bribery and corruptionBribery policy reviewInternal audit programme and resourcingExternal AuditorsAuditor objectivity, independence and re-appointmentFull-year report to the Audit CommitteeFinal Management Letter on internal controlsAuditor performance and effectivenessProposed year end audit plan including scope, fees and engagement letterInterim review report to the Audit CommitteeRisk of auditor leaving the marketOther BusinessWhistleblowing policy reviewCommittee effectivenessTerms of Reference
* in February 2016.
TrainingDuring the year, the Committee was briefed by PricewaterhouseCoopers LLP on the revised UK Corporate Governance Code, in particular the new requirements to review and monitor risk management and internal control procedures and to provide a statement on the longer-term viability of the Company.
Review of the 2015 Financial StatementsThe Committee reviews final drafts of the Group’s Report and Accounts for both the half and full year. As part of this process, the performance of the Group’s major divisions is considered, with key judgements, estimates and accounting policies being approved by the Committee ahead of a recommendation to the Board.
Significant issues reviewed by the Committee in connection with the 2015 Annual Report and Accounts were as follows:
Impairment ReviewsDuring 2015, the Group reported reduced trading due to the curtailment of drilling activity across the industry following the fall in the price of crude oil. As a consequence of this, management completed impairment reviews on the carrying values of assets held on the Group’s Balance Sheet.

ST
RA
TEG
IC R
EPO
RT
CO
RP
OR
AT
E G
OV
ER
NA
NC
EF
INA
NC
IAL
ST
AT
EM
ENT
SO
TH
ER IN
FO
RM
AT
ION
Hunting PLC2015 Annual Report and Accounts
57
MaterialityThe Committee has discussed materiality with the auditors both as regards accounting errors that will be brought to the Audit Committee’s attention and as regards amounts that would need to be adjusted so that the financial statements give a true and fair view. Overall audit materiality has been set at $5.0m (2014 – $8.0m). This equates to approximately 5% of the Group’s average reported profit before tax from continuing operations, adjusted for the impairment of goodwill and other non-current assets, for the past three years. This is within the range that audit opinions are considered to be reliable. Further, the auditors agreed to draw to the Audit Committee’s attention all identified uncorrected misstatements greater than $0.3m.
Auditor EffectivenessThe external auditors’ full-year report includes a statement on their independence, their ability to remain objective and their ability to undertake an effective audit. The Committee considers and assesses this independence statement on behalf of the Board, taking into account the level of fees paid particularly for non-audit services.
The effectiveness of the audit process is considered throughout the year with a formal review undertaken at the April meeting of the Committee. The assessment considers the following matters:
• the auditors’ understanding of the Group’s business and industry sector;
• the planning and execution of the audit plan approved by the Committee;
• the communication between the Group and audit engagement team;
• the auditors’ response to questions from the Committee, including during private meetings without management present;
• the independence, objectivity and scepticism of the auditor; • responses to a formal questionnaire on conduct of the audit
from the senior financial managers of the Group; • a report from the Finance Director and the Group Financial
Controller; and • finalisation of the audit work ahead of completion of the
Annual Report and Accounts.
In addition, the Committee reviewed and took account of the reports from the Financial Reporting Council on PricewaterhouseCoopers LLP. After considering these matters, the Committee was satisfied with the effectiveness of the year end audit.
PricewaterhouseCoopers LLP and its predecessor firms have been auditors to the Group since the Company’s formation on 7 August 1989 and under the firm’s audit partner rotation rules, the current Senior Statutory Auditor will rotate off the audit following completion of the 2018 statutory audit. The Committee has considered the European Union legislation relating to external auditors, rotation and intends to complete a tender process during 2017 in order to ensure a full 12-month period of independence before appointment of the selected firm as auditors effective 1 January 2019. The Company has commenced a process of engaging other firms to undertake non-audit assignments in order to assess the quality of each firm and its people as part of the early preparations for the tender process. This includes Deloitte, KPMG and EY, which have undertaken non-audit assignments for the Group.
In addition to briefings and supporting reports from the central finance team on principal significant issues, the Committee engages in discussion with the Group’s external auditors.
Going Concern Assumption and Viability StatementThe Committee reviewed the Going Concern Assumption and Viability Statement reported by the Group, as required by the revised UK Corporate Governance Code. Further information on the Going Concern Assumption can be found on page 30.
In December 2015, the Committee reviewed the Group’s draft Viability Statement, together with supporting information ahead of final approval at its meeting on 29 February 2016. The Committee was satisfied that the Viability Statement, noted on page 30 of the Strategic Report, presented a reasonable outlook for the Group for the next three years.
Fair, Balanced and Understandable AssessmentThe Committee has reviewed the financial statements together with the narrative contained within the Strategic Report set out on pages 2 to 47 and believes that the Annual Report and Accounts, taken as a whole, is fair, balanced and understandable.
In arriving at this conclusion the Committee undertook the following:
• review of early drafts of the Annual Report and Accounts, providing relevant feedback to the executive Directors;
• regular review and discussion of the financial results during the year including briefings by Group finance and operational management; and
• receipt and review of reports from the external and internal auditors.
The Committee advised the Board of its conclusion that the 2015 Annual Report and Accounts, taken as a whole, were fair, balanced and understandable at a Meeting of the Directors on 1 March 2016.
Internal AuditThe Committee receives reports from the Internal Audit department and reviews the internal audit process and effectiveness as part of the Group’s internal control and risk assessment programme. An annual programme of internal audit assignments is reviewed by the Committee. The Committee met with the head of internal audit without the presence of the executive Directors on three occasions during the year.
External AuditThe external auditors present reports at the March, April, August and December meetings for consideration by the Committee. In March, a full-year report is considered ahead of publication of the Group’s Annual Report and Accounts; in April an internal control report is presented, following the year end audit and in August an interim report is presented which includes the proposed full-year audit scope and fee. An update to the full-year plan was presented at the December meeting. The Committee considers the reappointment of the auditors annually at its March meeting and makes a recommendation to the Board. The Committee normally meets with the external auditors without executive Directors present at the end of each formal meeting.
Audit ScopeThe Audit Committee also considered the audit scope and materiality threshold. The audit scope was planned to cover Group-wide risks and local statutory reporting, enhanced by desk top reviews for smaller, low risk entities. Approximately 92% of the Group’s reported revenue and 91% of the reported profit before tax from continuing operations, adjusted for the impairment of goodwill and other non-current assets, was fully audited, covering 24 operating units across six countries.

Hunting PLC2015 Annual Report and Accounts
58
AUDIT COMMITTEE REPORTFOR THE YEAR ENDED 31 DECEMBER 2015
CONTINUED
WhistleblowingThe Company’s Senior Independent Director, John Hofmeister, is the primary point of contact for staff of the Group to raise, in confidence, concerns they may have over possible improprieties, financial or otherwise.
In addition, the Group engages the services of Safecall Limited, to provide an independent and anonymous whistleblowing service available to staff across all of Hunting’s operations.
All employees have been notified of these arrangements through the corporate magazine, Group notice boards and the Group’s website.
J O H N N I C H O L A SCHAIRMAN OF THE AUDIT COMMIT TEE
3 March 2016
The Committee closely monitors fees paid to the auditors in respect of non-audit services, which are analysed within note 8. In 2015, fees for non-audit services totalled $0.3m and comprised taxation services amounting to $0.3m. The scope and extent of non-audit work undertaken by the external auditors is monitored by, and, above certain thresholds, requires prior approval from the Committee to ensure that the provision of such services does not impair their independence or objectivity.
The Board received copies of all reports submitted to the Committee.
In compliance with EU legislation on non-audit services provided by a Company’s external auditor, the Group appointed Deloitte LLP from 1 January 2016 to undertake tax-related projects and review work.
Internal ControlsThe Group has an established risk management and internal control environment, which was in operation throughout the year. The Committee monitors these arrangements on behalf of the Board which are detailed in the Risk Management section of the Strategic Report on pages 22 to 30.
During the year enhancements to the internal control process were implemented and, following publication of the revised UK Corporate Governance Code, other control procedures were monitored to meet the revised Code’s requirements.
Bribery Act ComplianceIn compliance with the UK Bribery Act, Hunting has procedures in place, including the publication of Bribery and Corruption policies and detailed guidelines on interacting with customers, suppliers and agents, including specific policies for gifts, entertainment and hospitality. Senior managers across the Group are required to report their compliance activities, including an evaluation of risk areas. The Group has completed a screening exercise to identify relevant employees who face a heightened risk of bribery with all relevant personnel completing a formal training and compliance course, in line with the Group’s procedures. The Committee reviews the compliance procedures relating to the Bribery Act at its April and December meetings, which incorporate risk assessments completed by each business unit and gifts and entertainment disclosures made during the reporting period. The Group’s internal audit function reviews local compliance with the Bribery Act and reports control improvements and recommendations to the Committee where appropriate.
Code of ConductThe Group’s Code of Conduct contains policies and procedures covering how the Group conducts business and maintains its relationships with business partners. The Code of Conduct is available on the Group’s website.
“THE REMUNERATION OF HUNTING’S DIRECTORS IN 2015 CONTINUED TO FOLLOW
THE FRAMEWORK APPROVED BY SHAREHOLDERS IN 2014, WITH ALL PAYMENTS IN LINE WITH THE FIXED AND VARIABLE EMOLUMENTS WITHIN THE
DIRECTORS’ REMUNERATION POLICY.
FROM AN OPERATIONAL PERSPECTIVE, THE COMPANY FACED A MATERIAL DECLINE WITHIN ITS
CORE ENERGY SERVICES MARKETS, DUE TO THE IMBALANCE OF THE GLOBAL SUPPLY OF CRUDE
OIL, LEADING TO A SIGNIFICANT REDUCTION OR DEFERRAL OF CAPITAL EXPENDITURES WITHIN ITS CUSTOMER BASE . THIS HAS RESULTED IN A YEAR OF DECLINING REVENUES AND PROFITS FOR THE
COMPANY AS A WHOLE, WHICH HAS LED TO LOWER LEVELS OF REMUNERATION BEING PAID TO
THE EXECUTIVE DIRECTORS DURING THE YEAR. BASE SALARIES WERE FROZEN FOR THE MAJORITY
OF EMPLOYEES AS THE COMPANY ADJUSTED ITS COST BASE TO THE MARKET ENVIRONMENT THAT HAS PREVAILED THROUGHOUT THE YEAR.
IN LIGHT OF THIS DECLINE IN ACTIVITY ACROSS THE ENERGY INDUSTRY AND THE PERCEIVED TIME
FOR THE SECTOR TO RETURN TO GROWTH, THE COMMITTEE CONSULTED WITH SHAREHOLDERS IN THE YEAR ON PROPOSALS TO MODIFY THE
PERFORMANCE TARGETS OF THE HUNTING PERFORMANCE SHARE PLAN FOR FUTURE
AWARDS TO BETTER REFLECT THE CURRENT ENVIRONMENT AND TO ENSURE EXECUTIVES
REMAIN FAIRLY REMUNERATED.”
J O H N H O F M E I S T E RCHAIRMAN OF THE REMUNER ATION COMMIT TEE
ST
RA
TEG
IC R
EPO
RT
CO
RP
OR
AT
E G
OV
ER
NA
NC
EF
INA
NC
IAL
ST
AT
EM
ENT
SO
TH
ER IN
FO
RM
AT
ION
Hunting PLC2015 Annual Report and Accounts
59
REMUNERATION COMMITTEE REPORTFOR THE YEAR ENDED 31 DECEMBER 2015
Letter From The Remuneration Committee Chairman
IntroductionThe Remuneration Policy Summary and Annual Report on Remuneration that follow reflect the Remuneration Committee’s (the “Committee”) reporting requirements under the amended Companies Act 2006 and the Large and Medium-sized Companies and Groups (Accounts and Reports) (Amendment) Regulations 2013.
The Annual Report on Remuneration which follows, including this letter, details how the Directors’ Remuneration Policy was applied during 2015 and will be tabled for shareholder approval at the Annual General Meeting (“AGM”) on 13 April 2016.
Major Decisions and Substantial Changes to Remuneration Made by the Committee in 2015 • Salary review: the Committee considered the poor market
environment in which the Company operated during the year, including the reduction in workforce programme completed, and concluded that it was inappropriate to award base salary increases to the executive Directors in the year. The base salaries of Dennis Proctor and Peter Rose are therefore unchanged from 2014, with any movements reported being a function of fluctuations in the exchange rates of the currency in which the executive Director is paid.
• Fee review: while the responsibility of the annual fees of the non-executive Directors is a Board decision, the Committee recommended to the Board that no changes be made to the annual fees paid to the non-executive Directors for 2016.
• Annual Bonus: as noted above, the Committee noted the reduced trading performance of the Company in the year which resulted in no bonus awards to the executive Directors.
• Hunting Performance Share Plan: on 28 April 2015 share awards were made to the executive Directors in line with the rules of the 2014 Hunting Performance Share Plan (“the Hunting PSP”). Subject to the achievement of the performance conditions, these awards will vest on 28 April 2018.
• Modification of performance targets for future awards under the Hunting PSP: The Committee, in the latter part of 2015, reviewed the performance conditions and applicable targets to determine whether they were still a viable incentive to Hunting’s key management, given the prevailing market environment. Following the review, the Committee agreed that the performance conditions were still robust but proposed to reduce the minimum performance targets required to achieve a threshold vesting from 6% to 4% for underlying diluted earnings per share (“EPS”) growth and from 12% to 10% for underlying return on capital employed (“ROCE”). The maximum vesting targets of 15% and 17% respectively (averaged over the three-year vesting period) remain unchanged. The Committee also agreed to amend the comparator group used to measure total shareholder return (“TSR”) from 32 companies to 14 to better reflect Hunting’s peers in the oil equipment manufacturing subsector of the industry. In Q4 2015 and early 2016, certain key shareholders were consulted on these amendments to the Hunting PSP, with feedback being considered by the Committee. These amendments are designed to keep the Hunting PSP as a stretching and demanding long-term incentive for Hunting’s key executives, albeit acknowledging the current and severe industry decline reported.
At the AGM on 15 April 2015, 98.0% of the votes cast by shareholders were in favour of the Annual Report on Remuneration for 2014.

Hunting PLC2015 Annual Report and Accounts
60
Principal Activities Undertaken by the Remuneration Committee During 2015 The Committee’s principal activities and matters addressed during 2015 are as follows:
Mar Apr Aug Dec
Overall RemunerationAnnual Base Salary reviewReview senior management emolumentsItems specific to Annual BonusApprove Annual BonusReview Annual Bonus Plan RulesInterim review of Annual Bonus calculationsReview personal performance targets and approve bonus adjustor to be appliedAgree personal performance targets for year aheadItems specific to Long-Term IncentivesApprove PSP and LTIP vestingReview outstanding Long Term IncentivesApprove Hunting PSP grantsReview Hunting PSP performance conditionsInterim review of PSP, LTIP and Hunting PSP Vesting ReportsReview Hunting PSP Grant proposalsGovernance and other mattersApprove Annual Report on RemunerationReview and Approve Remuneration Policy (as required)Review governance voting reportsReview AGM proxy votes received for Annual Statement of Remuneration and Policy (as required)Review Committee EffectivenessReview Committee Terms of ReferenceReview draft Annual Report on Remuneration including Letter from Committee ChairmanReview Stock Ownership Schedules
Performance and Context of Remuneration Awarded in 2015The Group reported underlying profit before tax of $9.4m (2014 – $212.4m) and return on capital employed of 1.1% (2014 – 12.7%). As both measures failed to meet the threshold target of 80% of the Annual Budget as approved by the Board in March 2015, no bonus awards were payable to the executive Directors.
Following an interim measurement of the Total Shareholder Return performance condition on 19 February 2016, a zero vesting is anticipated for the 2013 performance based awards under the 2009 Performance Share Plan. A final measurement will be recorded on 19 March 2016. The Committee anticipates that no shares will vest for the executive Directors, with this nil result being recorded in the single figure remuneration table on page 66. These were the last awards granted under the 2009 Performance Share Plan, it being replaced by the Hunting PSP.
In accordance with the rules under the 2004 Long-Term Incentive Plan (“LTIP”) and the three-year cycle ending 31 December 2015, the incentive pool was $nil, resulting in no payments to either of the executive Directors. There will be no further awards under the 2004 LTIP, it being replaced by the Hunting PSP.
Further details of the emoluments of the executive Directors can be found within the Annual Report on Remuneration on pages 65 to 72.
J O H N H O F M E I S T E RCHAIRMAN OF THE REMUNER ATION COMMIT TEE
3 March 2016
REMUNERATION COMMITTEE REPORTFOR THE YEAR ENDED 31 DECEMBER 2015
CONTINUED
ST
RA
TEG
IC R
EPO
RT
CO
RP
OR
AT
E G
OV
ER
NA
NC
EF
INA
NC
IAL
ST
AT
EM
ENT
SO
TH
ER IN
FO
RM
AT
ION
Hunting PLC2015 Annual Report and Accounts
61
IntroductionHunting’s Directors’ Remuneration Policy (the “Policy”) was approved by the Company’s shareholders on 16 April 2014 and is valid for three years from that date. The Policy is located on the Company’s website at www.huntingplc.com. The Directors are planning to resubmit the Policy for shareholder approval at the 2017 Annual General Meeting.
The following Policy tables note the key elements of the approved Directors’ Remuneration Policy which was applied during 2015, with details of individual remuneration to the Directors contained in the Annual Report on Remuneration on pages 65 to 72, and in the Letter from the Chairman of the Remuneration Committee on pages 59 to 60.
Summary PolicyThe remuneration of the executive Directors is targeted to provide total emoluments at the market mid-point for the global industry in which Hunting operates. The remuneration of the Chief Executive is benchmarked to other companies within the global energy services industry that are comparable in size, profile and profitability to Hunting. The remuneration of the Finance Director is benchmarked to UK companies that are constituents of the FTSE 250. The remuneration of the executive Directors is divided into fixed and variable emoluments, with annual bonus and long-term incentives designed to be stretching and only pay out when strong Company performance has been delivered.
The fees paid to the non-executive Directors are benchmarked to FTSE 250 companies, and are targeted at above the market median, given the significant time commitment Hunting requires of its non-executive Directors.
Fixed EmolumentsExecutives
Remuneration Component – Base SalaryLink to Strategy Operation and Award Basis Maximum
• Attract, retain and reward executives with the necessary skills to effectively deliver the Company strategy.
• Base salaries are set at competitive rates which take into account the individual’s country of residence and primary operating location as well as companies in the same market segment.
• Aimed at the market mid-point. • Annual increases, where applied, take into account inflation
in the UK, US and increases across the total workforce. • Relocation and tax equalisation agreements are
also in place for employees working across multiple geographic jurisdictions.
• There is no prescribed maximum annual increase. The Committee is guided by the general increase for the broader employee population, but on occasions may need to recognise, for example, development in role, change in responsibility and/or specific retention issues.
Remuneration Component – Pension and Benefits • Provide normal pension and
benefit schemes appropriate to the country of residence.
• Each executive Director is provided with healthcare insurance and a company car with fuel.
• The Group contributes on behalf of the Chief Executive (resident in the US) to a US 401K deferred savings plan and an additional deferred compensation scheme.
• The Group contributes on behalf of the Finance Director (resident in the UK) to a UK final salary defined benefit pension scheme.
• N/A
DIRECTORS’ REMUNERATION POLICY SUMMARY

Hunting PLC2015 Annual Report and Accounts
62
REMUNERATION COMMITTEE REPORTFOR THE YEAR ENDED 31 DECEMBER 2015
CONTINUED
Non-Executives
Remuneration Component – Chairman’s feesLink to Strategy Operation Fee Detail and Maximum
• To attract and retain a high-calibre Chairman by offering a market-competitive fee level.
• The Chairman is paid a single fee for all his responsibilities including chairing the Nomination Committee.
• Fees are determined by the Board as a whole on recommendation of the executive Directors following receipt of external fee information and an assessment of the time commitment and responsibilities involved.
• The current fee for the Chairman is $295,784 (£193,500).
• Fees are reviewed annually in December.
Remuneration Component – Non-executive Director fees • To attract and retain
high-calibre non-executive Directors by offering a market-competitive fee level.
• The non-executive Directors are paid a basic fee. The Directors who chair the Board’s committees and the Senior Independent Director receive an additional fee to reflect their extra responsibilities.
• Fees are determined by the Board, on recommendation of the executive Directors, following receipt of external fee information and an assessment of the time commitment and responsibilities involved.
• The non-executive Directors do not receive any other benefits.
• The basic Board fee is $91,716 (£60,000) with an additional fee of $15,286 (£10,000) for chairing the Audit and Remuneration Committees, and for the role of Senior Independent Director. Fees are reviewed annually in December.
• Aggregate maximum fee for all non-executive Directors of $764,300 (£500,000) per annum.
Variable EmolumentsExecutives
Remuneration Component – Annual Cash BonusLink to Strategy Operation and Award Basis Maximum
• To incentivise annual delivery of financial and operational targets.
• High reward potential for exceeding demanding targets.
• The Annual Cash Bonus is indexed to the Group’s actual performance against the Annual Budget.
• Bonus is weighted 70% to Budgeted underlying Profit Before Tax (“PBT”) and 30% to Budgeted underlying Return on Capital Employed (“ROCE”).
• Bonuses accrue when 80% of Annual Budget targets are achieved, increasing on a straight-line basis to a maximum when 120% of Annual Budget targets are achieved.
• For an “on target” performance a bonus of 100% of base salary is paid to the Chief Executive and 75% of base salary to the Finance Director.
• Bonuses can be adjusted for meeting personal performance targets set by the Remuneration Committee.
• Bonuses can be adjusted for personal performance to zero or to a maximum of 1.25 times annual bonus – but not exceeding maximum.
• Chief Executive 200% of base salary.
• Finance Director 150% of base salary.
Remuneration Component – Hunting PSP • Recognition and reward to
executive Directors for the creation of shareholder value over the longer term.
• This element provides full alignment to shareholder interests.
• Annual grant of shares or nil cost options are subject to three stretching performance conditions (i) Total Shareholder Return (“TSR”) against a comparator group (ii) average ROCE achieved (iii) average diluted Earnings Per Share (“EPS”) growth achieved.
• Grant value of 450% of base salary for the Chief Executive and 210% of base salary for the Finance Director.
• Achievement of minimum performance target results in a 25% vesting of any element of the award.
• The maximum award noted provides the Committee with flexibility in cases such as recruitment. The Committee has set the award levels of the current executive Directors and does not intend to increase these further.
• Chief Executive 550% of base salary.
• Finance Director 450% of base salary.

ST
RA
TEG
IC R
EPO
RT
CO
RP
OR
AT
E G
OV
ER
NA
NC
EF
INA
NC
IAL
ST
AT
EM
ENT
SO
TH
ER IN
FO
RM
AT
ION
Hunting PLC2015 Annual Report and Accounts
63
Remuneration Component – 2009 Performance Share PlanLink to Strategy Operation and Award Basis Maximum
• Recognition and reward to executive Directors for the creation of shareholder value over the longer term.
• This element provides strong alignment with the interests of shareholders.
• Annual grant of shares or nil-cost options. • Vesting levels determined by TSR measured over
three years against a peer group. • 40% of shares vest for a median performance
increasing on a straight-line basis to 100% for a top quartile performance.
• Face value of award to Chief Executive and Finance Director is 100% and 80% of base salary respectively.
• Chief Executive 200% of base salary.
• Finance Director 200% of base salary.
Remuneration Component – 2004 Long-Term Incentive Plan • Recognition and reward to
executive Directors for the creation of shareholder value over the longer-term.
• Awards are made based on the accruing of an incentive pool over a three-year period.
• The incentive pool only accumulates if increases to average shareholder funds are achieved throughout the period.
• If the accruing incentive pool equals zero across the period, no payments are made.
• Chief Executive and Finance Director receive 35% and 15% of the accumulated incentive pool respectively, with actual payout limited to a maximum of 350% and 175% of base salary respectively.
• Chief Executive 350% of base salary.
• Finance Director 175% of base salary.
Stock Ownership RequirementThe Directors are also required to accumulate shares in the Company over a period of five years from 1 January 2014 or, for new Directors from the date of their appointment to the Board, to the following values, expressed as a multiple of their base salary or fee:
• Chief Executive – 5 times base salary. • Finance Director – 2 times base salary. • Non-executive Directors – 1 times annual fee.
Remuneration Committee DiscretionThe Committee has discretion within the Directors’ Policy framework in the following areas:
• annual base salary and fee reviews of the Directors; • application of the personal performance adjustor to the annual cash bonus; • application of the annual cash bonus following the exit of a Director; • composition of the comparator group for the Hunting PSP; • setting the performance targets for the Hunting PSP; and • specific recruitment considerations if new Directors are appointed.
Where applied, the Committee will disclose the rationale for the application of discretion.
Recovery of AwardsIn 2014, malus and clawback provisions on share awards under the Hunting PSP were introduced. The Committee may require the satisfaction of malus and/or clawback by way of a reduction in the amount of any existing or future bonus, the vesting of any future awards, the number of shares under any vested but unexercised option granted under certain share incentive plans, and/or a requirement to make a cash payment.
There are no malus or clawback provisions contained within the legacy long-term incentives.
The Annual Cash Bonus has been subject to clawback provisions since 2010. The Committee reserves the discretion to adjust the amount of any Bonus to reflect any fact or circumstances that the Committee considers to be relevant including allowing for the Bonus to be adjusted to zero.

Hunting PLC2015 Annual Report and Accounts
64
REMUNERATION COMMITTEE REPORTFOR THE YEAR ENDED 31 DECEMBER 2015
CONTINUED
Scenarios ChartsThe remuneration scenarios of the executive Directors for a fixed, target and maximum performance are presented in the charts below detailing remuneration under Hunting’s legacy long-term incentive arrangements and the future framework for remuneration following approval of the Hunting PSP in April 2014. The charts are based on 2015 remuneration data.
Legacy Remuneration
CHIEF EXECUTIVE
Maximum
Target
Fixed
$6,137k
$3,584k
$1,031k
16%
29%
100%
26%
22%
13%
11%
45%
38%
Fixed
FINANCE DIRECTOR
Maximum
Target
Fixed
$2,404k
$1,481k
$560k
24%
38%
100%
28%
23%
15%
12%
33%
27%
Annual Bonus PSP LTIP
Note:These charts are indicative as share price movement and dividend accruals have been excluded. Assumptions made for each scenario are as follows:• Fixed: latest known salary, benefits and normal pension contributions. • Target: fixed remuneration plus half of maximum annual cash bonus opportunity plus 50% vesting of awards under the PSP plus 50% vesting of awards under the LTIP. • Maximum: fixed remuneration plus maximum annual cash bonus opportunity plus 100% vesting of all long-term incentives.
The Finance Director is paid in Sterling and the equivalent total remuneration scenarios are as follows – fixed £366k; target £969k and maximum £1,572k.
Future Remuneration
Fixed Annual Bonus Hunting PSP
CHIEF EXECUTIVE
Maximum
Target
Fixed
$6,137k
$3,584k
$1,031k
16%
29%
100%
26%
22%
58%
49%
FINANCE DIRECTOR
Maximum
Target
Fixed
$2,199k
$1,379k
$560k
25%
40%
100%
31%
25%
44%
35%
Note:These charts are indicative as share price movement and dividend accruals have been excluded. Assumptions made for each scenario are as follows:• Fixed: latest known salary, benefits and normal pension contributions. • Target: fixed remuneration plus half of maximum annual cash bonus opportunity plus 50% vesting of awards under the Hunting PSP. • Maximum: fixed remuneration plus maximum annual cash bonus opportunity plus 100% vesting of all long-term incentives.
The Finance Director is paid in Sterling and the equivalent total remuneration scenarios are as follows – fixed £366k; target £902k and maximum £1,438k.
J O H N H O F M E I S T E RCHAIRMAN OF THE REMUNER ATION COMMIT TEE
3 March 2016

ST
RA
TEG
IC R
EPO
RT
CO
RP
OR
AT
E G
OV
ER
NA
NC
EF
INA
NC
IAL
ST
AT
EM
ENT
SO
TH
ER IN
FO
RM
AT
ION
Hunting PLC2015 Annual Report and Accounts
65
ANNUAL REPORT ON REMUNERATION
IntroductionThe principles noted within the summary of the Directors’ Remuneration Policy (the “Policy”) detailed on pages 61 to 64 have been in operation throughout 2015 and are detailed in the following report. The full Policy can be viewed on the Group’s website at www.huntingplc.com.
The Remuneration Committee (the “Committee”) will continue to implement these policies throughout 2016.
Role, Membership and AttendanceThe Committee is responsible for setting the remuneration of the executive Directors. The Chairman and Chief Executive are consulted on proposals relating to the remuneration of the Finance Director and designated senior management and, where appropriate, are invited by the Committee to attend meetings, but are not present when their own remuneration is considered. Remuneration of the non-executive Directors is agreed by the Board as a whole.
The full scope of the role of the Committee is set out in its terms of reference, which are reviewed annually, and can be found on the Group’s website at www.huntingplc.com.
The Committee consists entirely of independent non-executive Directors. On 2 February 2015, Annell Bay and Jay Glick were appointed to the Committee following their appointment to the Board of Directors.
The Committee met five times during the year and attendance details are shown in the table on page 51.
During the year, and to the date of signature of the accounts, the members of the Committee and their unexpired term of office were:
Director Latest appointment date Unexpired term as at 3 March 2016
John Hofmeister 29 August 2015 30 monthsAnnell Bay 2 February 2015 23 monthsJay Glick 2 February 2015 23 monthsJohn Nicholas 29 August 2015 30 months
External AdvisersDuring the year, New Bridge Street (a trading name of Aon Hewitt Ltd) and Pearl Meyer and Partners, were engaged by the Committee to provide remuneration consultancy services. Both firms, whose initial appointment was subject to a formal tender process, are regarded as independent having been appointed by the Committee and acting under direction of the Committee.
The total cost of advice to the Committee over the year to 31 December 2015 was $164,913 (2014 – $264,858) and reflects fees paid in respect of the review of remuneration, share plans and the remuneration reporting disclosure requirements.
Shareholder Voting at the 2015 Annual General Meeting (“AGM”)At the AGM of the Company held in April 2015, the resolution to approve the Annual Report on Remuneration received the following votes from shareholders:
Number of votes % of votes cast
For 108,559,438 98.03Discretion 22,433 0.02Against 2,164,046 1.95Votes withheld1 104,223 –Total votes cast 110,850,140 100.00
1. A vote withheld is not a vote in law and is not included in the calculation of the % of votes cast.
The Directors’ Remuneration Policy was approved by shareholders at the Company’s 2014 AGM, following the receipt of 91.5% votes for the resolution.
Shareholder ConsultationDuring the latter part of 2015 and in early 2016, the Committee consulted with shareholders regarding the modification of the performance targets for future awards to be made under the Hunting PSP and other proposed minor amendments to executive Director remuneration.
Following feedback from shareholders, the Committee proposes to amend the threshold vesting performance targets for the 2016 awards under the Hunting PSP and alter the comparator group adopted for the Total Shareholder Return performance condition. Further, as part of the dialogue with shareholders, the Committee also committed to reviewing the threshold vesting targets, once an industry wide recovery is confirmed. Further details of the amendments to the Hunting PSP are located in the Annual Statement from the Chairman on pages 59 and 60 and a full breakdown of the proposed 2016 performance targets can be found on page 72.

Hunting PLC2015 Annual Report and Accounts
66
REMUNERATION COMMITTEE REPORTFOR THE YEAR ENDED 31 DECEMBER 2015
CONTINUED
Director Remuneration (audited)
Fixed remuneration Variable remuneration
2015
Base salary/
fees1
$’000Benefits2
$’000Pension3
$’000Sub total
$’000
Annual cash
bonus4
$’000
PSPawards6
$’000
LTIPawards8
$’000Sub total
$’000
Otherremuneration10
$’000
Totalremuneration
2015$’000
ExecutivesDennis Proctor 786 71 174 1,031 – – – – – 1,031Peter Rose 456 44 60 560 – – – – – 560Non-executivesAnnell Bay11 84 – – 84 – – – – – 84Jay Glick11 84 – – 84 – – – – – 84John Hofmeister12 122 – – 122 – – – – – 122Richard Hunting 296 – – 296 – – – – – 296John Nicholas12 107 – – 107 – – – – – 107Total 1,935 115 234 2,284 – – – – – 2,284
Fixed remuneration Variable remuneration
2014
Base salary/
fees1
$’000Benefits2
$’000Pension3
$’000Sub total
$’000
Annual cash
bonus5
$’000
PSPawards7
$’000
LTIPawards9
$’000Sub total
$’000
Otherremuneration10
$’000
Totalremuneration
2014$’000
ExecutivesDennis Proctor 786 56 147 989 889 – 2,750 3,639 180 4,808Peter Rose 491 47 565 1,103 417 – 859 1,276 – 2,379Non-executivesJohn Hofmeister12 120 – – 120 – – – – – 120Richard Hunting 319 – – 319 – – – – – 319John Nicholas12 115 – – 115 – – – – – 115Andrew Szescila13 83 – – 83 – – – – – 83Total 1,914 103 712 2,729 1,306 – 3,609 4,915 180 7,824
Notes:1. Executive Directors’ salaries and non-executive Director fees were frozen during 2015. The movement in the £/$ exchange rate in the year has the effect of showing a
year-on-year decrease for the majority of Board members with the exception of Dennis Proctor whose base salary is determined and paid in US dollars. Average $/£ exchange rate in the year was 1.5286:1 (2014 – 1.6479:1).
2. Benefits include the provision of healthcare insurance, a company car and fuel benefits. 3. Dennis Proctor’s single figure pension remuneration represents the total Company contributions paid to his US pension arrangements. Peter Rose is a member of a
defined benefit pension scheme and his 2015 single figure pension remuneration has been calculated in a consistent way in accordance with the regulations and represents 20 times the increase in his accrued pension over 2014 after allowing for CPI inflation and deducting his own pension contributions.
4. As noted in the Letter from the Chairman of the Remuneration Committee, there were no annual bonus awards made to the executive Directors for 2015. 5. The annual bonus is comprised 70% on an underlying Profit Before Tax (“PBT”) target and 30% on an underlying Return on Capital Employed (“ROCE”) target and is
subject to the application of a personal performance adjustor. In 2014, the PBT and ROCE targets exceeded the Annual Budget by 2.4% and 3.1% respectively, leading to a bonus allocation equating to 113% of base salary for the Chief Executive and 85% of base salary for the Finance Director. Following a review of the personal performance objectives set by the Committee in March 2014, a bonus adjustor of 1.0 times was applied to the formula-driven allocation for each executive, resulting in no adjustment to the formula-driven annual bonus.
6. The 2013 awards under the PSP have a three-year performance period to 20 March 2016. The awards were measured on 19 February 2016 against the performance conditions specified on page 63, which indicated that the 2013 awards were unlikely to vest. On this basis, no payments will be paid to executive Directors.
7. The 2012 awards under the PSP had a three-year performance period to 16 April 2015. The awards were measured against the performance conditions specified on page 63, resulting in a zero vesting, with no shares being awarded to the executive Directors.
8. In accordance with the rules under the 2004 Long-Term Incentive Plan (“LTIP”) and the three-year cycle ending 31 December 2015, the incentive pool was $nil, resulting in no payments to either Dennis Proctor or Peter Rose.
9. In accordance with the rules under the 2004 LTIP and the three-year cycle ending 31 December 2014, the accumulated incentive pool totalled $9.8m, resulting in an entitlement of $2.8m to Dennis Proctor and an entitlement of $0.9m to Peter Rose. Under the rules of the LTIP, Dennis Proctor is entitled to 35% of the accumulated incentive pool while Peter Rose is entitled to 15% of the incentive pool. The maximum levels of award to Dennis Proctor and Peter Rose are capped at 350% and 175% of base salary respectively.
10. Other remuneration represents additional UK tax payable under a tax equalisation agreement, where applicable.11. Annell Bay and Jay Glick were appointed as Directors on 2 February 2015.12. John Hofmeister receives additional fees as Senior Independent Director and as Chairman of the Remuneration Committee, following his appointment as Chairman
on 16 September 2014. John Nicholas receives an additional fee as Chairman of the Audit Committee.13. Andrew Szescila retired from the Board on 15 September 2014.
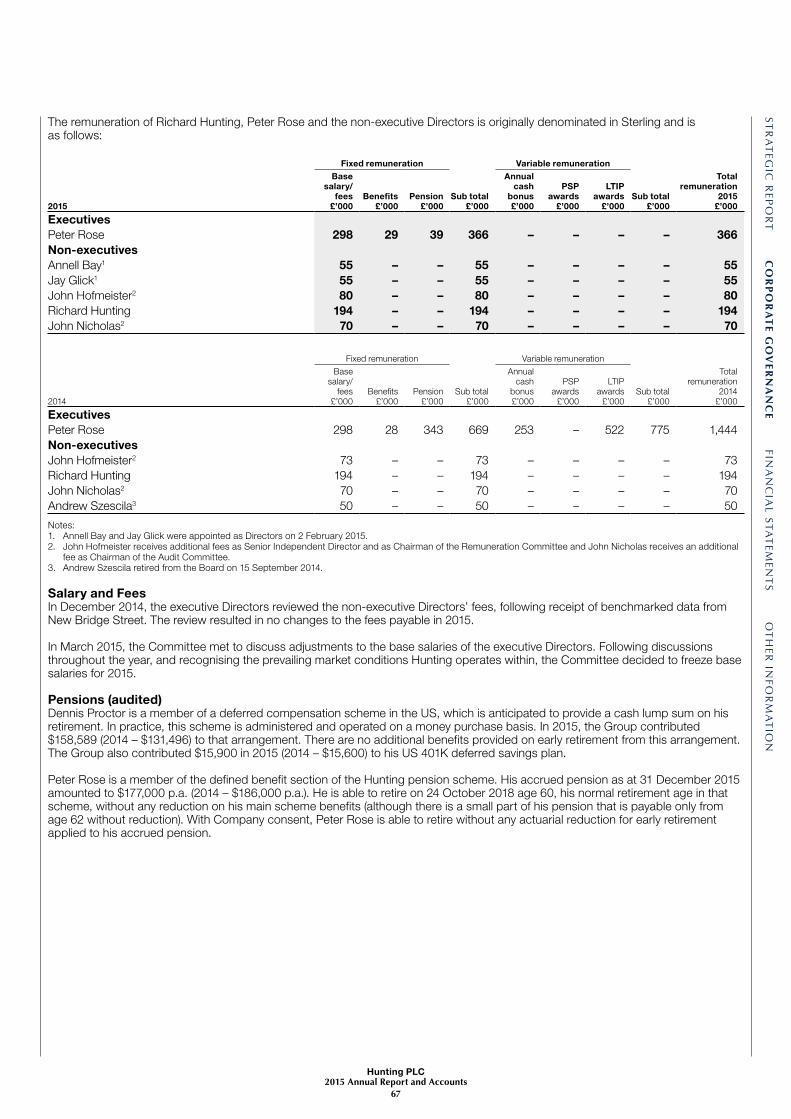
ST
RA
TEG
IC R
EPO
RT
CO
RP
OR
AT
E G
OV
ER
NA
NC
EF
INA
NC
IAL
ST
AT
EM
ENT
SO
TH
ER IN
FO
RM
AT
ION
Hunting PLC2015 Annual Report and Accounts
67
The remuneration of Richard Hunting, Peter Rose and the non-executive Directors is originally denominated in Sterling and is as follows:
Fixed remuneration Variable remuneration
2015
Base salary/
fees£’000
Benefits£’000
Pension£’000
Sub total£’000
Annual cash
bonus£’000
PSPawards
£’000
LTIPawards
£’000Sub total
£’000
Totalremuneration
2015 £’000
ExecutivesPeter Rose 298 29 39 366 – – – – 366Non-executivesAnnell Bay1 55 – – 55 – – – – 55Jay Glick1 55 – – 55 – – – – 55John Hofmeister2 80 – – 80 – – – – 80Richard Hunting 194 – – 194 – – – – 194John Nicholas2 70 – – 70 – – – – 70
Fixed remuneration Variable remuneration
2014
Base salary/
fees£’000
Benefits£’000
Pension£’000
Sub total£’000
Annual cash
bonus£’000
PSPawards
£’000
LTIPawards
£’000Sub total
£’000
Totalremuneration
2014 £’000
ExecutivesPeter Rose 298 28 343 669 253 – 522 775 1,444Non-executivesJohn Hofmeister2 73 – – 73 – – – – 73Richard Hunting 194 – – 194 – – – – 194John Nicholas2 70 – – 70 – – – – 70Andrew Szescila3 50 – – 50 – – – – 50
Notes:1. Annell Bay and Jay Glick were appointed as Directors on 2 February 2015.2. John Hofmeister receives additional fees as Senior Independent Director and as Chairman of the Remuneration Committee and John Nicholas receives an additional
fee as Chairman of the Audit Committee.3. Andrew Szescila retired from the Board on 15 September 2014.
Salary and FeesIn December 2014, the executive Directors reviewed the non-executive Directors’ fees, following receipt of benchmarked data from New Bridge Street. The review resulted in no changes to the fees payable in 2015.
In March 2015, the Committee met to discuss adjustments to the base salaries of the executive Directors. Following discussions throughout the year, and recognising the prevailing market conditions Hunting operates within, the Committee decided to freeze base salaries for 2015.
Pensions (audited)Dennis Proctor is a member of a deferred compensation scheme in the US, which is anticipated to provide a cash lump sum on his retirement. In practice, this scheme is administered and operated on a money purchase basis. In 2015, the Group contributed $158,589 (2014 – $131,496) to that arrangement. There are no additional benefits provided on early retirement from this arrangement. The Group also contributed $15,900 in 2015 (2014 – $15,600) to his US 401K deferred savings plan.
Peter Rose is a member of the defined benefit section of the Hunting pension scheme. His accrued pension as at 31 December 2015 amounted to $177,000 p.a. (2014 – $186,000 p.a.). He is able to retire on 24 October 2018 age 60, his normal retirement age in that scheme, without any reduction on his main scheme benefits (although there is a small part of his pension that is payable only from age 62 without reduction). With Company consent, Peter Rose is able to retire without any actuarial reduction for early retirement applied to his accrued pension.

Hunting PLC2015 Annual Report and Accounts
68
REMUNERATION COMMITTEE REPORTFOR THE YEAR ENDED 31 DECEMBER 2015
CONTINUED
Annual Performance-Linked Cash Bonus Plan (audited)The annual performance-linked cash bonus plan entitles the executive Directors to cash bonus payments when the actual financial results of the Group achieve pre-set financial targets based on the Group’s Annual Budget. The bonus has the potential to be adjusted to reflect the delivery of personal performance targets.
The approved Annual Budget reflected a material decline in the revenue and profitability of the Group compared to the actual results for 2014. The 2015 budgeted underlying PBT and ROCE were $95.0m and 6.6% respectively. Due to the 2015 outturn no annual bonus was payable to either executive Director.
In January 2015, the Committee set personal performance targets for each executive Director. The targets and outcome, including the personal performance adjustor applied to the bonus, of each executive Director are summarised below:
Description of Target Assessment Outcome
• Strategic Planning • Dynamic Leadership in a Volatile Period • Succession (Chief Executive only) • Organisational Effectiveness
(Finance Director only)
The Committee reviewed the delivery of the 2015 personal performance objectives by the executive Directors and agreed that each Target had been delivered. In particular the Committee noted the leadership by the executive Directors during the current subdued trading environment. However given that the threshold vesting performance conditions had not been met, no bonuses were paid to the executive Directors.
No adjustments were made to the annual bonuses for personal performance, given that no bonuses were paid to either executive Director.
The 2014 actual results exceeded Budgeted underlying PBT and ROCE by 2.4% and 3.1% respectively, leading to a cash bonus allocation of $889,299 for Dennis Proctor and $416,922 (£253,002) for Peter Rose, with no adjustments being made for personal performance. These amounts reflect 113% and 85% of the base salaries for Dennis Proctor and Peter Rose respectively. 2014 Budgeted underlying PBT and ROCE were $207.4m and 12.7% respectively.
2013 PSP Vesting (audited)The 2013 awards granted under the PSP with a three-year performance period to 20 March 2016 were measured by New Bridge Street on 19 February 2016 given that a substantial portion of the performance period had been completed. This measurement indicated that the awards were unlikely to vest. This result will be confirmed in the 2016 Annual Report on Remuneration, or should there be a vesting, announced to investors on receipt of the final measurement of the performance conditions.
The 2013 grant under the PSP are the final awards under the 2009 Performance Share Plan.
2012 PSP Vesting (audited)The 2012 awards granted under the PSP were measured by New Bridge Street on 17 April 2015 and resulted in a zero vesting. The 2012 share grants to the Chief Executive and Finance Director duly lapsed with no shares vesting for either executive Director.
2013 LTIP Vesting (audited)On 31 December 2015, the 2013 award under the LTIP for the three-year period commencing 1 January 2013 was measured in accordance with the plan rules and resulted in an incentive pool of $nil. As a result of this, no payments were made to either executive Director.
There will be no further awards made to either executive Director under the 2004 Long-Term Incentive Plan.
2012 LTIP Vesting (audited)On 31 December 2014, the 2012 award under the LTIP for the three-year period commencing 1 January 2012 was measured in accordance with the plan rules and resulted in an accumulated incentive pool of $9.8m. The executive Directors were awarded the following:
Director% of incentive pool awarded
Value of award$
Award as % of base salary
Dennis Proctor 35% 2,749,600 350Peter Rose 15% 859,380 175

ST
RA
TEG
IC R
EPO
RT
CO
RP
OR
AT
E G
OV
ER
NA
NC
EF
INA
NC
IAL
ST
AT
EM
ENT
SO
TH
ER IN
FO
RM
AT
ION
Hunting PLC2015 Annual Report and Accounts
69
2015 Hunting PSP GrantOn 28 April 2015, the Committee approved the allocation of nil-cost share awards to Dennis Proctor and nil-cost options to Peter Rose under the rules of the Hunting PSP. Awards will vest on 28 April 2018, subject to the achievement of the performance conditions detailed on page 62 of the Policy. Details of the grant are as follows:
DirectorAward as % of
base salaryNumber of
shares awarded
Face value of award at threshold
vesting of 25%$
Face value of maximum award vesting at 100%
$
Dennis Proctor 450% 372,534 883,800 3,535,200Peter Rose 210% 105,513 239,150 956,598
The targets for each performance condition remain the same as those set for the 2014 award.
The face value of the 2015 award is based on the closing mid-market share price on 28 April 2015 which was 590.5 pence.
Payments to Past Directors and for Loss of Office (audited)No payments were made in the year to past Directors in the normal course of business or for loss of office.
Directors’ Shareholdings, Ownership Policy and Share Interests (audited)The beneficial interests of the Directors in the issued Ordinary shares of the Company are as follows:
Director
At31 December
2015
At31 December
2014
Non-executive ChairmanRichard Hunting1 463,306 463,306– as trustee 979,049 979,049– as Director of Hunting Investments Limited 11,073,487 10,973,487ExecutivesDennis Proctor1 1,748,544 1,576,802Peter Rose1 86,864 57,410Non-executivesAnnell Bay1 3,500 –Jay Glick1 13,500 –John Hofmeister1 25,000 10,000John Nicholas1 11,000 5,000Andrew Szescila1 (at 15 September 2014) – 10,000
1. Beneficial share interests are those Ordinary shares owned by the Director or spouse which the Director is free to dispose of.
There have been no further changes to the Directors’ share interests in the period 31 December 2015 to 3 March 2016.
In 2014, the Group implemented a share ownership policy that requires Directors and certain senior executives within the Group to build up a holding in shares equal in value to a certain multiple of their base salary or fee. The multiple takes into account the post-tax value of vested but unexercised share awards or options.
The required shareholding of each Director and the current shareholding as a multiple of base salary as at 31 December 2015 is presented below:
DirectorRequired holding expressed as a multiple of base salary or fee
Value of holding in shares including the post-tax value of vested but unexercised share awards and options expressed as a multiple of base salary or fee as at 31 December 2015
Dennis Proctor 5 10.0Peter Rose 2 0.9Annell Bay 1 0.2Jay Glick 1 0.7Richard Hunting 1 7.3John Hofmeister 1 1.0John Nicholas 1 0.5
Directors have five years from 1 January 2014 (or from the date of appointment to the Board) in which to satisfy the shareholding requirement.
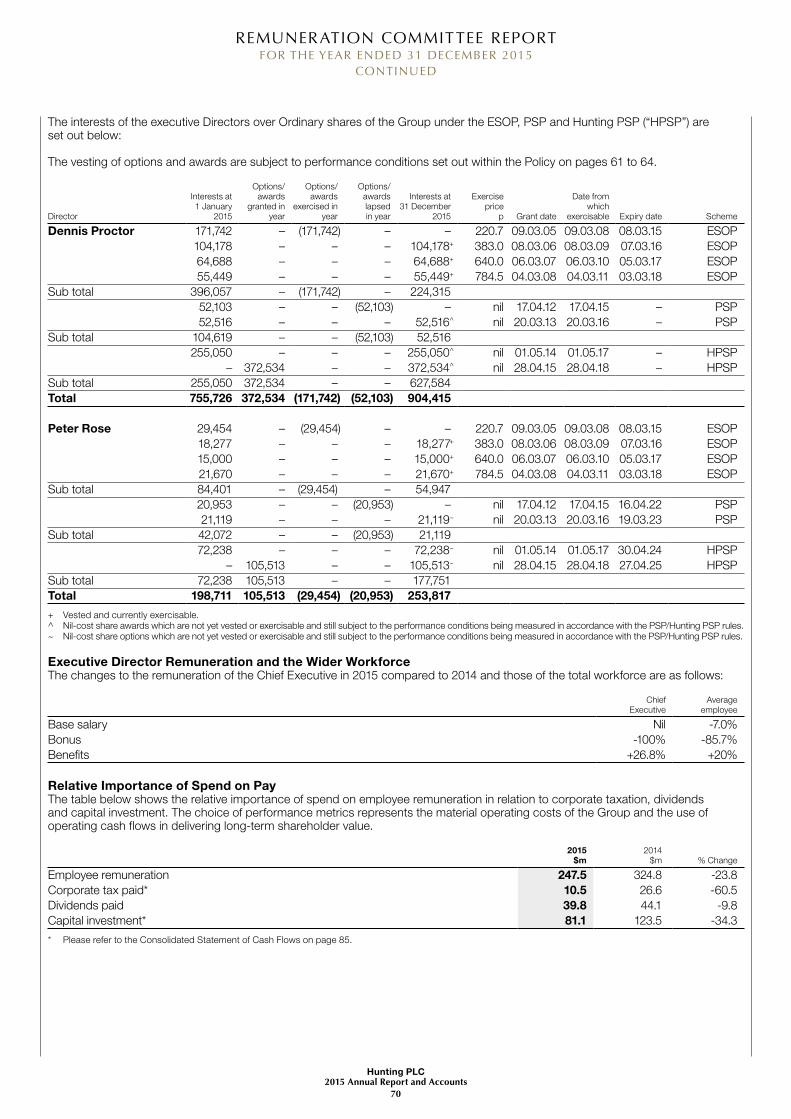
Hunting PLC2015 Annual Report and Accounts
70
REMUNERATION COMMITTEE REPORTFOR THE YEAR ENDED 31 DECEMBER 2015
CONTINUED
The interests of the executive Directors over Ordinary shares of the Group under the ESOP, PSP and Hunting PSP (“HPSP”) are set out below:
The vesting of options and awards are subject to performance conditions set out within the Policy on pages 61 to 64.
Director
Interests at1 January
2015
Options/awards
granted inyear
Options/awards
exercised in year
Options/awardslapsedin year
Interests at31 December
2015
Exerciseprice
p Grant date
Date fromwhich
exercisable Expiry date Scheme
Dennis Proctor 171,742 – (171,742) – – 220.7 09.03.05 09.03.08 08.03.15 ESOP104,178 – – – 104,178+ 383.0 08.03.06 08.03.09 07.03.16 ESOP64,688 – – – 64,688+ 640.0 06.03.07 06.03.10 05.03.17 ESOP55,449 – – – 55,449+ 784.5 04.03.08 04.03.11 03.03.18 ESOP
Sub total 396,057 – (171,742) – 224,31552,103 – – (52,103) – nil 17.04.12 17.04.15 – PSP52,516 – – – 52,516^ nil 20.03.13 20.03.16 – PSP
Sub total 104,619 – – (52,103) 52,516255,050 – – – 255,050^ nil 01.05.14 01.05.17 – HPSP
– 372,534 – – 372,534^ nil 28.04.15 28.04.18 – HPSPSub total 255,050 372,534 – – 627,584Total 755,726 372,534 (171,742) (52,103) 904,415
Peter Rose 29,454 – (29,454) – – 220.7 09.03.05 09.03.08 08.03.15 ESOP18,277 – – – 18,277+ 383.0 08.03.06 08.03.09 07.03.16 ESOP15,000 – – – 15,000+ 640.0 06.03.07 06.03.10 05.03.17 ESOP21,670 – – – 21,670+ 784.5 04.03.08 04.03.11 03.03.18 ESOP
Sub total 84,401 – (29,454) – 54,94720,953 – – (20,953) – nil 17.04.12 17.04.15 16.04.22 PSP21,119 – – – 21,119~ nil 20.03.13 20.03.16 19.03.23 PSP
Sub total 42,072 – – (20,953) 21,11972,238 – – – 72,238~ nil 01.05.14 01.05.17 30.04.24 HPSP
– 105,513 – – 105,513~ nil 28.04.15 28.04.18 27.04.25 HPSPSub total 72,238 105,513 – – 177,751Total 198,711 105,513 (29,454) (20,953) 253,817
+ Vested and currently exercisable.^ Nil-cost share awards which are not yet vested or exercisable and still subject to the performance conditions being measured in accordance with the PSP/Hunting PSP rules.~ Nil-cost share options which are not yet vested or exercisable and still subject to the performance conditions being measured in accordance with the PSP/Hunting PSP rules.
Executive Director Remuneration and the Wider WorkforceThe changes to the remuneration of the Chief Executive in 2015 compared to 2014 and those of the total workforce are as follows:
ChiefExecutive
Average employee
Base salary Nil -7.0%Bonus -100% -85.7%Benefits +26.8% +20%
Relative Importance of Spend on PayThe table below shows the relative importance of spend on employee remuneration in relation to corporate taxation, dividends and capital investment. The choice of performance metrics represents the material operating costs of the Group and the use of operating cash flows in delivering long-term shareholder value.
2015$m
2014$m % Change
Employee remuneration 247.5 324.8 -23.8Corporate tax paid* 10.5 26.6 -60.5Dividends paid 39.8 44.1 -9.8Capital investment* 81.1 123.5 -34.3
* Please refer to the Consolidated Statement of Cash Flows on page 85.

ST
RA
TEG
IC R
EPO
RT
CO
RP
OR
AT
E G
OV
ER
NA
NC
EF
INA
NC
IAL
ST
AT
EM
ENT
SO
TH
ER IN
FO
RM
AT
ION
Hunting PLC2015 Annual Report and Accounts
71
Executive Director Remuneration and Shareholder ReturnsThe following chart compares the TSR of Hunting PLC between 2008 and 2015 to the DJ Stoxx TM Oil Equipment, Services and Distribution and DJ US Oil Equipment and Services indices.
In the opinion of the Directors, these indices are the most appropriate indices against which the shareholder return of the Company’s shares should be compared because they comprise other companies in the oil and gas services sector.
Summary Table of Chief Executive’s RemunerationThe accompanying table details remuneration of the Chief Executive:
Single figureremuneration1
$’000
AnnualCash Bonus
%2
ESOP/PSP %
vesting3LTIP
% award4
2015 1,031 Nil Nil Nil2014 4,808 57 Nil 1002013 4,442 42 Nil 1002012 5,497 75 66 1002011 3,261 100 Nil 312010 1,876 100 100 52009 2,363 17 100 62
1. Single figure remuneration reflects the aggregate remuneration paid to the Chief Executive as defined within the Directors’ Remuneration Policy located at www.huntingplc.com.
2. Annual cash bonus percentages reflect the bonus received by the Chief Executive each year expressed as a percentage of maximum bonus opportunity. 3. Percentage vesting reflects the % of the ESOP that vested in the financial year and the % of the PSP where a substantial portion of the performance period was
completed at the financial year end. 4. LTIP award percentage reflects the award value expressed as a percentage of maximum award opportunity received each year measured at 31 December.
TOTAL SHAREHOLDER RETURN(REBASED TO 100 AT 31 DECEMBER 2008)
31/12/08 31/12/09 31/12/10 31/12/11 31/12/1331/12/12 31/12/14 31/12/15
350
300
250
200
150
100
50
350
300
250
200
150
100
50
Hunting PLC DJ US Oil Equipment & Services DJ Stoxx TM Oil Equipment, Services & Distribution

Hunting PLC2015 Annual Report and Accounts
72
REMUNERATION COMMITTEE REPORTFOR THE YEAR ENDED 31 DECEMBER 2015
CONTINUED
Implementation of Policies in 2016The remuneration policies for 2016 will be applied in line with those detailed on pages 61 to 64. For full details of the Policy refer to the Company’s website www.huntingplc.com.
In December 2015, the Board concluded that in the current trading environment there would be no changes made to fees payable to the non-executive Directors for 2016. Further, the Committee noted the cost reduction initiatives underway across the Group and following Board discussion agreed to reduce the annual fee of the Chairman from £193,500 to £100,000 with effect from 1 April 2016.
In February 2016, the Committee met to discuss base salary changes for the executive Directors, and concluded that due to the poor market environment in which the Company operated in during the year, including the reduction in workforce programmes that there would be no change to the base salaries payable to the executive Directors for 2016.
The annual performance-linked cash bonus for 2016 will be operated in line with the Policy detailed on page 62. The Committee will disclose details of the retrospective performance against the pre-set financial and personal performance targets.
The Committee plans to grant nil-cost share awards or options to the Chief Executive and Finance Director under the Hunting PSP in March 2016. The awards will be in line with the rules of the Hunting PSP and subject to the following performance conditions:
Proportion of awards Performance conditions Minimum performance target Maximum performance target
33.33% TSR 25% vests if median performance against a comparator group of companies is achieved.
100% vests if an upper quartile performance against a comparator group of companies is achieved.
33.33% Underlying EPS 25% vests if absolute EPS growth across the three-year vesting period averages 4%.
100% vests if absolute EPS growth across the three-year vesting period averages 15%.
33.33% Underlying ROCE 25% vests if average ROCE across the three-year vesting period averages 10%.
100% vests if average ROCE across the three-year vesting period averages 17%.
Following consultation with shareholders, the Committee has adjusted the threshold vesting targets for the EPS and ROCE performance conditions for the 2016 awards under the Hunting PSP to the executive Directors, compared to the performance targets set in 2015. The reasons for these modifications are wholly due to the depth and severity of the downturn in the global oil and gas market. The Committee believes that the oil and gas industry will remain subdued for the short term, as the crude oil supply/demand imbalance slowly recedes and the industry cautiously recommences investment. The Committee has responded to this market environment by amending the targets for the 2016 grant to ensure that the Hunting PSP continues to remain a strong incentive to management whilst remaining a credible, stretching and demanding long-term incentive. Further the Committee has reduced the comparator group, for the TSR performance condition, from 32 to 14 companies to better reflect the Group’s peers within the manufacturing subsector of the global oil and gas industry.
Further, the Committee is also committed to monitoring the market and restoring the original threshold EPS and ROCE performance targets, when a recovery across the oil and gas industry is confirmed.
J O H N H O F M E I S T E RCHAIRMAN OF THE REMUNER ATION COMMIT TEE
3 March 2016

Hunting PLC2015 Annual Report and Accounts
73
OT
HER
INF
OR
MA
TIO
NF
INA
NC
IAL
ST
AT
EM
ENT
SC
OR
PO
RA
TE
GO
VE
RN
AN
CE
ST
RA
TEG
IC R
EPO
RT
HUNTING SUBSEA MANUFACTURES COUPLING, VALVES AND OTHER PRODUCTS FOR DEEP SEA APPLICATION

INDEPENDENT AUDITORS’ REPORT TO THE MEMBERS OF HUNTING PLC
Hunting PLC2015 Annual Report and Accounts
74
Report on the financial statementsOur opinion In our opinion:
• Hunting PLC’s Group financial statements and Company financial statements (the “financial statements”) give a true and fair view of the state of the Group’s and of the Company’s affairs as at 31 December 2015, and of the Group’s loss and the Group’s and the Company’s cash flows for the year then ended;
• the Group financial statements have been properly prepared in accordance with International Financial Reporting Standards (“IFRSs”) as adopted by the European Union;
• the Company financial statements have been properly prepared in accordance with IFRSs as adopted by the European Union and as applied in accordance with the provisions of the Companies Act 2006; and
• the financial statements have been prepared in accordance with the requirements of the Companies Act 2006 and, as regards the Group financial statements, Article 4 of the IAS Regulation.
What we have auditedThe financial statements, included within the Annual Report and Accounts (the “Annual Report”), comprise:
• the Consolidated and Company Balance Sheets as at 31 December 2015; • the Consolidated Income Statement and the Consolidated Statement of Comprehensive Income for the year then ended; • the Consolidated and Company Statements of Cash Flows for the year then ended; • the Consolidated and Company Statements of Changes in Equity for the year then ended; and • the notes to the financial statements, which include a summary of significant accounting policies and other explanatory information.
The financial reporting framework that has been applied in the preparation of the financial statements is applicable law and IFRSs as adopted by the European Union and, as regards the Company financial statements, as applied in accordance with the provisions of the Companies Act 2006.
Our audit approachOverview
Materiality • Overall Group materiality was set at $5.0m which represents approximately 5% of three-year average profit before tax from continuing operations adjusted for the impairment of goodwill and other non-current assets.
Audit scope • We conducted audit work in six countries covering 24 operating units and visited a number of audit locations, including the one significant component, Hunting Titan.
• Our audit scope accounted for over 92% of Group revenues and 91% of Group absolute profit before tax from continuing operations adjusted for the impairment of goodwill and other non-current assets.
Areas of focus • Goodwill and non-current asset impairment assessment. • Impairment of oil and gas properties. • Direct tax exposures.
The scope of our audit and our areas of focusOur Group audit work was conducted in accordance with International Standards on Auditing (UK and Ireland) (“ISAs (UK & Ireland)”).
We designed our audit by determining materiality and assessing the risks of material misstatement in the financial statements. In particular, we looked at where the Directors made subjective judgements, for example in respect of significant accounting estimates that involved making assumptions and considering future events that are inherently uncertain. As in all of our audits we also addressed the risk of management override of internal controls, including evaluating whether there was evidence of bias by the Directors that represented a risk of material misstatement due to fraud.
The risks of material misstatement that had the greatest effect on our audit, including the allocation of our resources and effort, are identified as “areas of focus” in the table below. We have also set out how we tailored our audit to address these specific areas in order to provide an opinion on the financial statements as a whole, and any comments we make on the results of our procedures should be read in this context. This is not a complete list of all risks identified by our audit.

ST
RA
TEG
IC R
EPO
RT
CO
RP
OR
AT
E G
OV
ERN
AN
CE
FINA
NC
IAL
ST
AT
EM
EN
TS
OT
HER
INF
OR
MA
TIO
N
Hunting PLC2015 Annual Report and Accounts
75
Area of focus How our audit addressed the area of focus
Goodwill and non-current asset impairment assessmentRefer to pages 55 to 58 (Audit Committee report), page 87 (critical accounting estimates and judgements), pages 120 to 123 (principal accounting policies) and notes 14, 15 and 16 (property, plant and equipment, goodwill and other intangible assets).
The Group holds $230.6m of goodwill on the balance sheet, which is net of a $208.2m impairment recognised during the year. Additional intangible assets held by the Group, including customer relationships, unpatented technology and patents & trademarks, total $180.4m, which is net of an $11.2m impairment recognised during the year.
Goodwill and intangible asset valuation is a judgemental and complex area as it depends on the future financial performance of the cash generating unit (“CGU”) and future market performance. In particular there is significant uncertainty in the oil and gas market as a result of the impact of the continued decline in oil prices. As such the key area of focus is the carrying value of assets, with our focus on judgemental areas being the forecast revenue and profit, terminal growth rates and the discount rates.
During the year the Group recognised a $208.2m impairment against goodwill, of which $35.2m was recognised during the interim period to 30 June 2015. The charge was taken predominantly against the Hunting Titan, Electronics and Stafford CGUs of $107.6m, $28.7m and $17.8m respectively, with the remaining charge taken against goodwill across various US and UK based CGUs.
In addition, impairment charges of $11.2m have been recognised against customer relationship intangible assets, where the recoverable amount of the asset is no longer supported by the estimated future revenue and gross margin applicable to the associated customer.
Other non-current assets held by the Group totalling $460.8m, net of current year impairment of $33.2m include land and buildings, plant, machinery and motor vehicles, rental tools, and oil and gas exploration and development (see area of focus on impairment of oil and gas properties below). Following a review of the carrying value of these non-current assets undertaken at 30 June 2015, impairment charges totalling $26.8m were taken against the assets of the Drilling Tools CGU, comprising of $26.2m against rental tools, $0.5m against land and buildings and $0.1m for other plant, machinery and motor vehicles.
These impairments reflect the respective CGUs’ subdued financial performance in the year, as a result of increased competition, the impact of the continuing decline in oil prices on forecast revenue and the prolonged customer unwinding of inventory.
We tested management’s identification of the CGUs, considering business changes that would prompt a change to the classification of CGUs.
In order to test the impairment models, we challenged whether the future cash flow forecasts and the timing of recovery of these forecasts for the identified CGUs were appropriate.
More specifically, we challenged the key assumptions as follows:
• Forecast revenue and profit assumptions and how management has incorporated the impact of the decline in oil prices, by comparing them to historical results, comparing the growth rates to independent specialist third party published reports and considering the impact already observed within the market;
• Terminal growth rates, by comparing them to economic and industry forecasts; and
• Discount rates, by assessing the cost of capital assumption for each CGU and comparable organisations.
We found the above assumptions to be consistent and in line with our expectations and that management has followed a clear process for drawing up the future cash flow forecasts, which was subject to oversight and challenge by the Directors and which was consistent with Board approved budgets.
In addition to evaluating management’s assessments, we requested a “sum of the parts” valuation exercise be undertaken to determine the amount of the implied premium between the Group’s net book value compared to the Group’s market capitalisation. We compared the implied premium with observable implied premiums for similar groups within the industry, noting that the Group’s implied premium was within that range.
In respect of CGUs where impairments have been recognised, we sensitised each key driver of the cash flow forecasts, including the underlying assumptions listed above, by determining what we considered to be a reasonably possible change in the assumptions, based on current market data and historical and current business performance. Through this we determined an appropriate range for the fair value less cost of disposal for each CGU.
For all other CGUs, in particular those with lower relative headroom, we calculated the degree to which the key assumptions would need to change before an impairment was triggered. We assessed the likelihood of such a movement by comparison to sensitised forecasts and possible changes in discount rates and concluded that it was unlikely.
We concluded that the total goodwill impairment charge of $208.2m recognised is supported by our testing of key assumptions.
The impairment of $11.2m recognised against customer relationship intangible assets was taken against specific relationships which were recognised on acquisition of the associated CGU. We considered the decline in revenue and gross margin derived by the customers to which the relationships relate and consider the impairment recognised by management to be reasonable. We note the remaining balance of $118.5m is supported by the carrying value of the CGUs to which it relates.
The impairment recognised against property plant and equipment was taken in relation to specific assets which had been identified as surplus to requirements within the Drilling Tools CGU. We found the remaining non-current assets within the CGU are supported by the recoverable amount calculated through the impairment assessment management has performed.

INDEPENDENT AUDITORS’ REPORT TO THE MEMBERS OF HUNTING PLC
CONTINUED
Hunting PLC2015 Annual Report and Accounts
76
Area of focus How our audit addressed the area of focus
Impairment of oil and gas properties Refer to pages 55 to 58 (Audit Committee Report), page 87 (critical accounting estimates and judgements), pages 120 to 123 (principal accounting policies) and note 14.
The Group holds $4.8m of oil and gas exploration and development assets on the balance sheet, which is net of a $6.5m impairment recognised during the year. Management’s impairment model for the estimated recoverable amount of oil and gas exploration and development assets is judgemental, as it depends on the future financial performance of the assets and future market performance. In particular it is dependent on estimated oil reserves and forecast oil prices, which can fluctuate significantly from one year to the next.
The impairment of $6.4m recognised in the year reflects the decrease in forecast oil prices and a decrease in estimated oil reserves.
In order to test management’s impairment model, we challenged and evaluated the future cash flow forecasts and the process by which they were drawn up and tested the underlying calculations. In particular, for each of the following significant assumptions, we challenged:
• Forecast oil prices, by agreeing them to published forecast future oil prices;
• Estimated oil reserves, by agreeing them to independent third party reserves engineer reports and agreeing that the reserves engineer is independent, objective and appropriately accredited; and
• Discount rate, by assessing the cost of capital assumption against comparable organisations.
We found the assumptions to be appropriate and in line with our expectations.
We sensitised each key driver of the cash flow forecasts, including the underlying assumptions listed above, by determining what we considered to be a reasonably possible change in assumption, based on current market data and historical and current business performance. Through this we determined an appropriate range of value in use for oil and gas exploration and development assets. We concluded that the impairment of $6.4m recognised is within our independently determined range for the recoverable amount.
Direct tax exposuresRefer to pages 55 to 58 (Audit Committee Report), page 87 (critical accounting estimates and judgements), pages 120 to 123 (accounting policies) and note 19.
The Group operates in a number of different countries and is therefore subject to many tax regimes around the world. Provisions are estimated for uncertain direct tax positions and disputes with tax authorities, including transactions between Group companies. These are measured in accordance with relevant accounting standards. We considered this an area of focus because of the judgement required by management to assess matters across multiple jurisdictions.
We discussed potential direct tax exposures with senior Group management, and the basis for their positions with the Group’s in-house tax specialists.
We evaluated the calculations of the provisions, and considered:
• The accuracy of the calculations and ensured that appropriate tax rates have been used; and
• Key judgements made by management in determining the probability of potential outcomes.
Our evaluation of these judgements included using our tax specialists, in the UK and overseas, and with experience in the oil and gas and oilfield services industry, as well as our experience of similar challenges elsewhere.
Through these procedures we evaluated the level of provisions recognised and the disclosures made in the financial statements, which we consider to be in line with the Group’s policies and methodology, and relevant account standards.

ST
RA
TEG
IC R
EPO
RT
CO
RP
OR
AT
E G
OV
ERN
AN
CE
FINA
NC
IAL
ST
AT
EM
EN
TS
OT
HER
INF
OR
MA
TIO
N
Hunting PLC2015 Annual Report and Accounts
77
How we tailored the audit scopeWe tailored the scope of our audit to ensure that we performed enough work to be able to give an opinion on the financial statements as a whole, taking into account the geographic structure of the Group, the accounting processes and controls, and the industry in which the Group operates.
The Group financial statements are a consolidation of entities covering non-trading legal entities, centralised functions and 31 operating units.
In establishing the overall approach to the Group audit, we considered the type of work that needed to be performed at the operating units by us, as the Group engagement team, or component auditors within PwC UK and from other PwC network firms operating under our instruction. Where the work was performed by component auditors, we determined the extent of audit work needed at those operating units to be able to conclude whether sufficient appropriate audit evidence had been obtained as a basis for our opinion on the Group financial statements as a whole.
The Group’s operating units vary significantly in size and we identified 12 operating units that, in our view, required an audit of their complete financial information, due to their size or risk characteristics. Specific audit procedures over certain balances and transactions were performed at a further 12 operating units, to give appropriate coverage of all material balances at the Group level. In doing so we conducted work in six countries and the Group audit team visited multiple reporting locations in the US, which included visiting Hunting Titan, the one significant component, and the UK. Together, the operating units subject to audit procedures accounted for over 92% of Group revenues and 91% of absolute Group profit before tax from continuing operations, adjusted for the impairment of goodwill and other non-current assets. Further, specific audit procedures over central functions and areas of significant judgement, including taxation, treasury, pensions and impairment, were performed by the Group audit team centrally.
MaterialityThe scope of our audit was influenced by our application of materiality. We set certain quantitative thresholds for materiality. These, together with qualitative considerations, helped us to determine the scope of our audit and the nature, timing and extent of our audit procedures on the individual financial statement line items and disclosures and in evaluating the effect of misstatements, both individually and on the financial statements as a whole.
Based on our professional judgement, we determined materiality for the financial statements as a whole as follows:
Overall Group materiality $5.0m (2014: $8.0m).How we determined it Approximately 5% of three-year average profit before tax from continuing operations adjusted for the
impairment of goodwill and other non-current assets.Rationale for benchmark applied We applied this benchmark because, in our view, this is an appropriate metric against which the
performance of the Group is measured and of the recurring Group performance. This represents a change from the prior year where we used the current year profit before tax from continuing operations adjusted for the non-recurring impairment of goodwill and oil and gas exploration and development assets, to reflect the fact that Hunting’s 2015 result is significantly lower than more normalised levels due to the current volatility in the market.
Component materiality For each component in our audit scope, we allocated a materiality that is less than our overall Group materiality. The range of materiality allocated across components subject to a full scope audit was between $0.4m and $4.0m.
We agreed with the Audit Committee that we would report to them misstatements identified during our audit above $0.3m (2014: $0.4m) as well as misstatements below that amount that, in our view, warranted reporting for qualitative reasons.

INDEPENDENT AUDITORS’ REPORT TO THE MEMBERS OF HUNTING PLC
CONTINUED
Hunting PLC2015 Annual Report and Accounts
78
Going concernUnder the Listing Rules we are required to review the Directors’ statement, set out on page 30, in relation to going concern. We have nothing to report having performed our review.
Under ISAs (UK & Ireland) we are also required to report to you if we have anything material to add or to draw attention to in relation to the Directors’ statement about whether they considered it appropriate to adopt the going concern basis in preparing the financial statements. We have nothing material to add or to draw attention to.
As noted in the Directors’ statement, set out on page 30, the Directors have concluded that it is appropriate to adopt the going concern basis in preparing the financial statements. The going concern basis presumes that the Group has adequate resources to remain in operation, and that the Directors intend it to do so, for at least one year from the date the financial statements were signed. As part of our audit we have concluded that the Directors’ use of the going concern basis is appropriate.
However, because not all future events or conditions can be predicted, these statements are not a guarantee as to the Group’s ability to continue as a going concern.
Other required reportingConsistency of other informationCompanies Act 2006 opinionsIn our opinion, the information given in the Strategic Report and the Directors’ Report for the financial year for which the financial statements are prepared is consistent with the financial statements.
ISAs (UK & Ireland) reportingUnder ISAs (UK & Ireland) we are required to report to you if, in our opinion:
• Information in the Annual Report is: • materially inconsistent with the information in the audited financial statements; or • apparently materially incorrect based on, or materially inconsistent with, our knowledge of the
Group and Company acquired in the course of performing our audit; or • otherwise misleading.
We have no exceptionsto report.
• the statement given by the Directors on page 54, in accordance with provision C.1.1 of the UK Corporate Governance Code (the “Code”), that they consider the Annual Report taken as a whole to be fair, balanced and understandable and provides the information necessary for members to assess the Group’s and Company’s position of performance, business model and strategy is materially inconsistent with our knowledge of the Group and Company acquired in the course of performing our audit.
We have no exceptionsto report.
• the section of the Annual Report on pages 55 to 58, as required by provision C.3.8 of the Code, describing the work of the Audit Committee does not appropriately address matters communicated by us to the Audit Committee.
We have no exceptionsto report.

ST
RA
TEG
IC R
EPO
RT
CO
RP
OR
AT
E G
OV
ERN
AN
CE
FINA
NC
IAL
ST
AT
EM
EN
TS
OT
HER
INF
OR
MA
TIO
N
Hunting PLC2015 Annual Report and Accounts
79
The Directors’ assessment of the prospects of the Group and of the principal risks that would threaten the solvency or liquidity of the Group Under ISAs (UK & Ireland) we are required to report to you if we have anything material to add or to draw attention to in relation to:
• the Directors’ confirmation in the Annual Report, in accordance with provision C.2.1 of the Code, that they have carried out a robust assessment of the principal risks facing the Group, including those that would threaten its business model, future performance, solvency or liquidity.
We have nothing material to add or to draw attention to.
• the disclosures in the Annual Report that describe those risks and explain how they are being managed or mitigated.
We have nothing material to add or to draw attention to.
• the Directors’ explanation in the Annual Report, in accordance with provision C.2.2 of the Code, as to how they have assessed the prospects of the Group, over what period they have done so and why they consider that period to be appropriate, and their statement as to whether they have a reasonable expectation that the Group will be able to continue in operation and meet its liabilities as they fall due over the period of their assessment, including any related disclosures drawing attention to any necessary qualifications or assumptions.
We have nothing material to add or to draw attention to.
Under the Listing Rules we are required to review the Directors’ statement that they have carried out a robust assessment of the principal risks facing the Group and the Directors’ statement in relation to the longer-term viability of the Group, set out on page 30. Our review was substantially less in scope than an audit and only consisted of making enquiries and considering the Directors’ process supporting their statements; checking that the statements are in alignment with the relevant provisions of the Code; and considering whether the statements are consistent with the knowledge acquired by us in the course of performing our audit. We have nothing to report having performed our review.
Adequacy of accounting records and information and explanations receivedUnder the Companies Act 2006, we are required to report to you if, in our opinion:
• we have not received all the information and explanations we require for our audit; or • adequate accounting records have not been kept by the Company, or returns adequate for our audit have not been received from
branches not visited by us; or • the Company financial statements and the part of the Directors’ Remuneration Report to be audited are not in agreement with the
accounting records and returns.
We have no exceptions to report arising from this responsibility.
Directors’ remunerationDirectors’ remuneration report – Companies Act 2006 opinionIn our opinion, the part of the Directors’ Remuneration Report to be audited has been properly prepared in accordance with the Companies Act 2006.
Other Companies Act 2006 reportingUnder the Companies Act 2006, we are required to report to you if, in our opinion, certain disclosures of Directors’ remuneration specified by law are not made. We have no exceptions to report arising from this responsibility.
Corporate governance statementUnder the Listing Rules, we are required to review the part of the Corporate Governance Statement relating to ten further provisions of the UK Corporate Governance Code. We have nothing to report having performed our review.
INDEPENDENT AUDITORS’ REPORT TO THE MEMBERS OF HUNTING PLC
CONTINUED
Hunting PLC2015 Annual Report and Accounts
80
Responsibilities for the financial statements and the auditOur responsibilities and those of the directorsAs explained more fully in the Statement of Directors’ Responsibilities set out on page 54, the Directors are responsible for the preparation of the financial statements and for being satisfied that they give a true and fair view.
Our responsibility is to audit and express an opinion on the financial statements in accordance with applicable law and ISAs (UK & Ireland). Those standards require us to comply with the Auditing Practices Board’s Ethical Standards for Auditors.
This report, including the opinions, has been prepared for, and only for, the Company’s members as a body in accordance with Chapter 3 of Part 16 of the Companies Act 2006, and for no other purpose. We do not, in giving these opinions, accept or assume responsibility for any other purpose, or to any other person to whom this report is shown or into whose hands it may come, save where expressly agreed by our prior consent in writing.
What an audit of financial statements involvesAn audit involves obtaining evidence about the amounts and disclosures in the financial statements sufficient to give reasonable assurance that the financial statements are free from material misstatement, whether caused by fraud or error. This includes an assessment of:
• whether the accounting policies are appropriate to the Group’s and the Company’s circumstances and have been consistently applied and adequately disclosed;
• the reasonableness of significant accounting estimates made by the Directors; and • the overall presentation of the financial statements.
We primarily focus our work in these areas by assessing the Directors’ judgements against available evidence, forming our own judgements, and evaluating the disclosures in the financial statements.
We test and examine information, using sampling and other auditing techniques, to the extent we consider necessary to provide a reasonable basis for us to draw conclusions. We obtain audit evidence through testing the effectiveness of controls, substantive procedures or a combination of both.
In addition, we read all the financial and non-financial information in the Annual Report to identify material inconsistencies with the audited financial statements and to identify any information that is apparently materially incorrect based on, or materially inconsistent with, the knowledge acquired by us in the course of performing the audit. If we become aware of any apparent material misstatements or inconsistencies we consider the implications for our report.
N I C H O L A S C A M P B E L L - L A M B E R T(SENIOR STATUTORY AUDITOR)
for and on behalf of PricewaterhouseCoopers LLPChartered Accountants and Statutory AuditorsLondon3 March 2016

ST
RA
TEG
IC R
EPO
RT
CO
RP
OR
AT
E G
OV
ERN
AN
CE
FINA
NC
IAL
ST
AT
EM
EN
TS
OT
HER
INF
OR
MA
TIO
N
CONSOLIDATED INCOME STATEMENT
FOR THE YEAR ENDED 31 DECEMBER 2015
Hunting PLC2015 Annual Report and Accounts
81
Notes
2015 2014
Beforeamortisationi
andexceptional
items$m
Amortisationi
andexceptional
items(note 7)
$mTotal
$m
Beforeamortisationi
andexceptional
items$m
Amortisationi
andexceptional
items(note 7)
$mTotal
$m
Revenue 4 810.5 – 810.5 1,386.5 – 1,386.5Cost of sales (615.3) (37.9) (653.2) (942.6) (11.3) (953.9)Gross profit 195.2 (37.9) 157.3 443.9 (11.3) 432.6Other operating income 5 3.8 – 3.8 9.5 – 9.5Operating expenses 6 (182.6) (260.7) (443.3) (235.6) (92.6) (328.2)Profit (loss) from continuing operations 8 16.4 (298.6) (282.2) 217.8 (103.9) 113.9Finance income 10 3.3 – 3.3 7.5 – 7.5Finance expense 10 (10.1) – (10.1) (12.4) – (12.4)Share of associates’ post-tax losses (0.2) – (0.2) (0.5) – (0.5)Profit (loss) before tax from continuing operations 9.4 (298.6) (289.2) 212.4 (103.9) 108.5Taxation 11 (5.4) 63.2 57.8 (57.2) 20.5 (36.7)Profit (loss) for the year:From continuing operations 4.0 (235.4) (231.4) 155.2 (83.4) 71.8From discontinued operations 12 – 4.2 4.2 0.3 1.1 1.4Profit (loss) for the year 4.0 (231.2) (227.2) 155.5 (82.3) 73.2
Profit (loss) attributable to:Owners of the parent 4.6 (231.2) (226.6) 151.5 (82.3) 69.2Non-controlling interests (0.6) – (0.6) 4.0 – 4.0
4.0 (231.2) (227.2) 155.5 (82.3) 73.2
Earnings (loss) per share cents cents cents cents
Basic – from continuing operations 13 3.1 (156.1) 102.6 45.9 – from discontinued operations 13 – 2.8 0.2 1.0Group total 3.1 (153.3) 102.8 46.9
Diluted – from continuing operations 13 3.1 (156.1) 100.0 44.8 – from discontinued operations 13 – 2.8 0.2 1.0Group total 3.1 (153.3) 100.2 45.8
i. Relates to amortisation of intangible assets that arise on the acquisition of businesses (referred to hereafter as amortisation of acquired intangible assets).

CONSOLIDATED STATEMENT OF COMPREHENSIVE INCOME
FOR THE YEAR ENDED 31 DECEMBER 2015
Hunting PLC2015 Annual Report and Accounts
82
Notes2015
$m2014
$m
Comprehensive income(Loss) profit for the year (227.2) 73.2
Components of other comprehensive income after taxItems that have been reclassified to profit or loss:Fair value gains and losses:– gains transferred to income statement on disposal of cash flow hedges 30 – (1.3)– gain transferred to income statement on redemption of available for sale investment 30 – (0.2)Release of foreign exchange losses 30 0.6 3.8
0.6 2.3Items that may be reclassified subsequently to profit or loss:Exchange adjustments (17.1) (17.9)Fair value gains and losses:Losses originating on cash flow hedges arising during the year 30 – (0.1)
(17.1) (18.0)Items that will not be reclassified to profit or loss:Remeasurement of defined benefit pension schemes 9.2 1.5
Other comprehensive expense after tax (7.3) (14.2)
Total comprehensive (expense) income for the year (234.5) 59.0
Total comprehensive (expense) income attributable to:Owners of the parent (231.9) 57.2Non-controlling interests (2.6) 1.8
(234.5) 59.0
Total comprehensive (expense) income attributable to owners of the parent arises from:Continuing operations (236.5) 56.0Discontinued operations 4.6 1.2
(231.9) 57.2

ST
RA
TEG
IC R
EPO
RT
CO
RP
OR
AT
E G
OV
ERN
AN
CE
FINA
NC
IAL
ST
AT
EM
EN
TS
OT
HER
INF
OR
MA
TIO
N
CONSOLIDATED BALANCE SHEET
AT 31 DECEMBER 2015
Hunting PLC2015 Annual Report and Accounts
83
Notes2015
$m2014
$m
ASSETSNon-current assetsProperty, plant and equipment 14 460.8 473.0 Goodwill 15 230.6 440.6 Other intangible assets 16 180.4 224.8 Investments in associates 3.7 4.4 Investments 17 9.1 8.9 Retirement benefit assets 28 41.4 30.9 Trade and other receivables 18 4.0 3.3 Deferred tax assets 19 2.0 1.2
932.0 1,187.1
Current assetsInventories 20 331.2 381.8 Trade and other receivables 18 140.2 285.6 Current tax assets 33.5 1.6 Investments 17 4.6 3.8 Cash and cash equivalents 54.4 88.5 Assets classified as held for sale – 20.3
563.9 781.6
LIABILITIESCurrent liabilitiesTrade and other payables 21 104.2 197.7 Current tax liabilities 14.6 20.9 Borrowings 22 52.3 65.4 Provisions 23 5.4 10.6 Liabilities classified as held for sale – 15.5 176.5 310.1 Net current assets 387.4 471.5
Non-current liabilitiesBorrowings 22 117.2 157.9 Deferred tax liabilities 19 10.2 37.1 Provisions 23 12.6 14.1 Trade and other payables 21 11.3 11.2 151.3 220.3 Net assets 1,168.1 1,438.3
Equity attributable to owners of the parentShare capital 29 61.7 61.6 Share premium 29 153.0 151.9 Other components of equity 30 15.7 30.7 Retained earnings 31 911.5 1,163.9
1,141.9 1,408.1 Non-controlling interests 26.2 30.2 Total equity 1,168.1 1,438.3
The notes on pages 86 to 123 are an integral part of these consolidated financial statements. The financial statements on pages 81 to 85 were approved by the Board of Directors on 3 March 2016 and were signed on its behalf by:
D E N N I S P R O C T O R P E T E R R O S E DIRECTOR DIRECTOR Registered number: 974568

CONSOLIDATED STATEMENT OF CHANGES IN EQUITY
Hunting PLC2015 Annual Report and Accounts
84
Year ended 31 December 2015
Notes
Share capital
$m
Share premium
$m
Other components
of equity$m
Retained earnings
$mTotal
$m
Non-controlling
interests$m
Total equity
$m
At 1 January 61.6 151.9 30.7 1,163.9 1,408.1 30.2 1,438.3
Loss for the year – – – (226.6) (226.6) (0.6) (227.2)Other comprehensive (expense) income – – (14.5) 9.2 (5.3) (2.0) (7.3)Total comprehensive expense – – (14.5) (217.4) (231.9) (2.6) (234.5)
Dividends – – – (39.8) (39.8) (2.0) (41.8)Shares issued– share option schemes and awards 29 0.1 1.1 – – 1.2 – 1.2Treasury shares– purchase of Treasury shares 31 – – – (1.4) (1.4) – (1.4)Share options and awards– value of employee services – – 6.2 – 6.2 – 6.2– discharge – – (6.7) 6.5 (0.2) – (0.2)– taxation – – – (0.3) (0.3) – (0.3)Investment by non-controlling interest – – – – – 0.6 0.6Total transactions with owners 0.1 1.1 (0.5) (35.0) (34.3) (1.4) (35.7)
At 31 December 61.7 153.0 15.7 911.5 1,141.9 26.2 1,168.1
Year ended 31 December 2014
Notes
Share capital
$m
Share premium
$m
Other components
of equity$m
Retained earnings
$mTotal
$m
Non-controlling
interests$m
Total equity
$m
At 1 January 61.3 150.6 41.6 1,130.4 1,383.9 30.9 1,414.8
Profit for the year – – – 69.2 69.2 4.0 73.2 Other comprehensive (expense) income – – (13.5) 1.5 (12.0) (2.2) (14.2)Total comprehensive (expense) income – – (13.5) 70.7 57.2 1.8 59.0
Dividends – – – (44.1) (44.1) (2.5) (46.6)Shares issued– share option schemes and awards 29 0.3 1.3 – – 1.6 – 1.6 Treasury shares– purchase of Treasury shares 31 – – – (7.5) (7.5) – (7.5)Share options and awards– value of employee services – – 7.2 – 7.2 – 7.2 – discharge – – (4.6) 11.3 6.7 – 6.7 – taxation – – – 3.1 3.1 – 3.1 Total transactions with owners 0.3 1.3 2.6 (37.2) (33.0) (2.5) (35.5)
At 31 December 61.6 151.9 30.7 1,163.9 1,408.1 30.2 1,438.3

ST
RA
TEG
IC R
EPO
RT
CO
RP
OR
AT
E G
OV
ERN
AN
CE
FINA
NC
IAL
ST
AT
EM
EN
TS
OT
HER
INF
OR
MA
TIO
N
CONSOLIDATED STATEMENT OF CASH FLOWS
FOR THE YEAR ENDED 31 DECEMBER 2015
Hunting PLC2015 Annual Report and Accounts
85
Notes2015
$m2014
$m
Operating activities(Loss) profit from operations (282.2) 113.9 Acquisition amortisation and exceptional items 7 298.6 103.9Depreciation and non-acquisition amortisation 8 45.5 52.0Underlying EBITDA 61.9 269.8Loss on disposal of property, plant and equipment 1.8 6.0 Decrease (increase) in inventories 39.4 (3.1)Decrease (increase) in receivables 143.5 (34.7)(Decrease) increase in payables (86.9) 41.6 Decrease in provisions (6.7) (3.4)Restructuring costs 7 (5.9) –Taxation paid (10.5) (26.6)Proceeds from disposal of property, plant and equipment held for rental 2.9 7.0 Purchase of property, plant and equipment held for rental (9.0) (28.9)Other non-cash flow items 10.8 2.5 Discontinued operations 1.0 (0.9)Net cash inflow from operating activities 142.3 229.3 Investing activitiesInterest received 1.1 2.0 Dividends received from associates 0.1 4.5 Purchase of subsidiaries – (3.0)Proceeds from disposal of associates – 0.2 Net movement on loans to and from associates (0.2) 0.6 Proceeds from disposal of property, plant and equipment 1.3 0.6 Purchase of property, plant and equipment (72.1) (94.6)Purchase of intangible assets (8.0) (5.0)Increase in bank deposit investments (1.1) (2.0)Net proceeds from disposal of subsidiaries 0.7 3.9Net cash in subsidiaries sold 36 (3.9) –Indemnity receipts in respect of disposed subsidiaries 0.4 0.2 Net cash outflow from investing activities (81.7) (92.6)Financing activitiesInterest and bank fees paid (8.5) (7.6)Equity dividends paid 32 (39.8) (44.1)Non-controlling interest dividend paid (2.0) (2.5)Investment by non-controlling interest 0.6 –Share capital issued 1.2 1.6 Purchase of Treasury shares (1.4) (7.5)Proceeds from new borrowings 7.6 70.2 Repayment of borrowings (36.3) (155.9)Net cash outflow from financing activities (78.6) (145.8)
Net cash outflow in cash and cash equivalents (18.0) (9.1)Cash and cash equivalents at the beginning of the year 38.0 52.4 Effect of foreign exchange rates (1.9) (1.5)Reclassified from (to) held for sale 3.8 (3.8)Cash and cash equivalents at the end of the year 21.9 38.0
Cash and cash equivalents at the end of the year comprise:Cash at bank and in hand 54.4 88.5 Bank overdrafts included in borrowings 22 (32.5) (50.5) 21.9 38.0
* The 2014 Statement of Cash Flows has been represented to ensure a clearer relationship with management’s summarised cash flow statement on page 41 of the Strategic Report.

NOTES TO THE CONSOLIDATED FINANCIAL STATEMENTS
Hunting PLC2015 Annual Report and Accounts
86
1. Basis of PreparationThe financial statements consolidate those of Hunting PLC (the “Company”) and its subsidiaries (together referred to as the “Group”) and include the Group’s interests in associates.
The financial statements have been prepared in accordance with the Companies Act 2006 and those International Financial Reporting Standards (“IFRS”) and IFRS Interpretations Committee (“IFRS IC”) Interpretations as adopted by the European Union. The financial statements have been prepared on a going concern basis under the historical cost convention as modified by the revaluation of available-for-sale financial assets, the defined benefit pension asset and those financial assets and financial liabilities held at fair value through profit or loss. The Board’s consideration of the applicability of the going concern basis is detailed further in the Strategic Report on page 30.
The principal accounting policies applied in the preparation of these financial statements are set out in note 37. These policies have been consistently applied to all the years presented.
Adoption of New Standards, Amendments and InterpretationsThe following standards, amendments and interpretations have been adopted and are effective for the Group’s accounting period beginning on or after 1 January 2015:
• Annual Improvements to IFRSs 2011–2013 Cycle
Although the adoption of these amendments represents a change in accounting policy, comparative figures for 2014 have not been restated for these, as the changes do not impact the financial performance or position of the Group.
The following standards, amendments and interpretations are effective subsequent to the year end and are being assessed to determine whether there is a significant impact on the Group’s results or financial position:
• IFRS 9 Financial Instruments* • IFRS 15 Revenue from Contracts with Customers* • IFRS 16 Leases* • Amendments to IFRS 10, IFRS 12 and IAS 28 Investment Entities: Applying the Consolidation Exception* • Amendments to IAS 1: Disclosure Initiative • Amendments to IFRS 10 and IAS 28: Sale or Contribution of Assets between an Investor and its Associate or Joint Venture* • Amendments to IAS 27: Equity Method in Separate Financial Statements • Amendments to IAS 16 and IAS 38: Clarification of Acceptable Methods of Depreciation and Amortisation • Amendments to IFRS 11: Accounting for Acquisitions of Interests in Joint Operations • Amendments to IAS 19: Defined Benefit Plans: Employee Contributions • Amendments to IAS 12: Recognition of Deferred Tax Assets for Unrealised Losses* • Amendments to IAS 7: Disclosure Initiative* • Annual Improvements to IFRSs 2010–2012 Cycle • Annual Improvements to IFRSs 2012–2014 Cycle
* Not yet endorsed by the European Union.
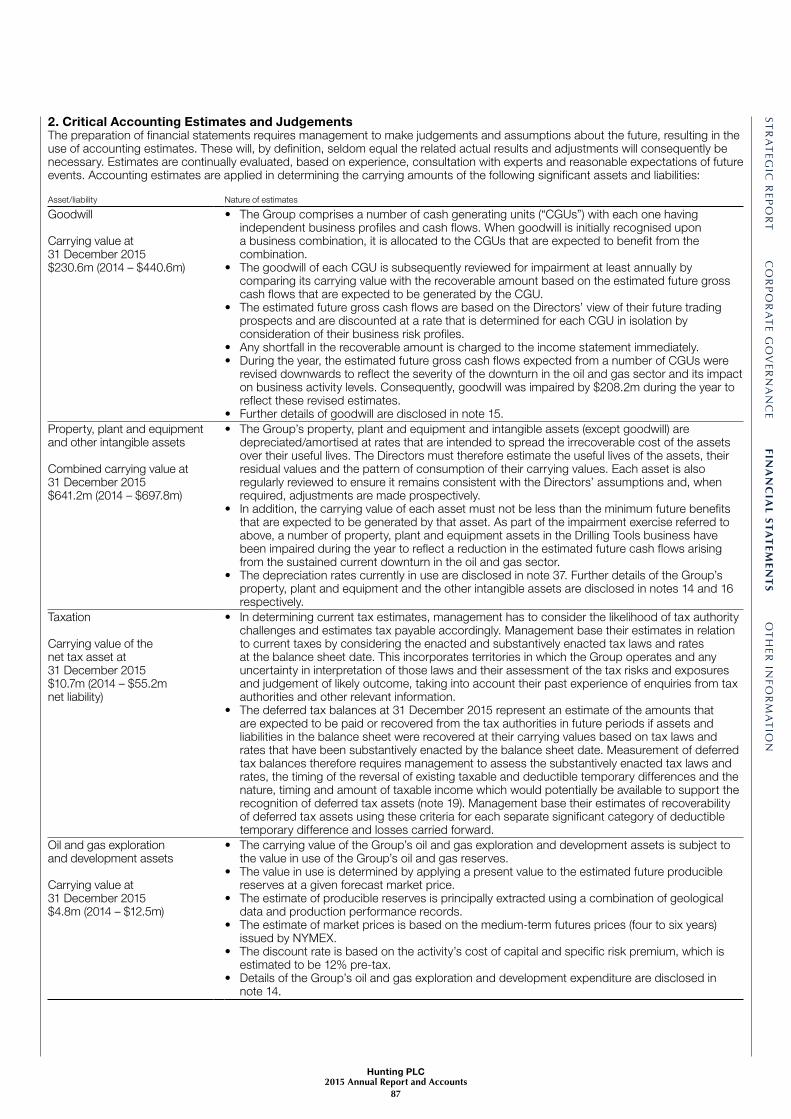
ST
RA
TEG
IC R
EPO
RT
CO
RP
OR
AT
E G
OV
ERN
AN
CE
FINA
NC
IAL
ST
AT
EM
EN
TS
OT
HER
INF
OR
MA
TIO
N
Hunting PLC2015 Annual Report and Accounts
87
2. Critical Accounting Estimates and JudgementsThe preparation of financial statements requires management to make judgements and assumptions about the future, resulting in the use of accounting estimates. These will, by definition, seldom equal the related actual results and adjustments will consequently be necessary. Estimates are continually evaluated, based on experience, consultation with experts and reasonable expectations of future events. Accounting estimates are applied in determining the carrying amounts of the following significant assets and liabilities:
Asset/liability Nature of estimates
Goodwill
Carrying value at 31 December 2015 $230.6m (2014 – $440.6m)
• The Group comprises a number of cash generating units (“CGUs”) with each one having independent business profiles and cash flows. When goodwill is initially recognised upon a business combination, it is allocated to the CGUs that are expected to benefit from the combination.
• The goodwill of each CGU is subsequently reviewed for impairment at least annually by comparing its carrying value with the recoverable amount based on the estimated future gross cash flows that are expected to be generated by the CGU.
• The estimated future gross cash flows are based on the Directors’ view of their future trading prospects and are discounted at a rate that is determined for each CGU in isolation by consideration of their business risk profiles.
• Any shortfall in the recoverable amount is charged to the income statement immediately. • During the year, the estimated future gross cash flows expected from a number of CGUs were
revised downwards to reflect the severity of the downturn in the oil and gas sector and its impact on business activity levels. Consequently, goodwill was impaired by $208.2m during the year to reflect these revised estimates.
• Further details of goodwill are disclosed in note 15.Property, plant and equipment and other intangible assets
Combined carrying value at 31 December 2015 $641.2m (2014 – $697.8m)
• The Group’s property, plant and equipment and intangible assets (except goodwill) are depreciated/amortised at rates that are intended to spread the irrecoverable cost of the assets over their useful lives. The Directors must therefore estimate the useful lives of the assets, their residual values and the pattern of consumption of their carrying values. Each asset is also regularly reviewed to ensure it remains consistent with the Directors’ assumptions and, when required, adjustments are made prospectively.
• In addition, the carrying value of each asset must not be less than the minimum future benefits that are expected to be generated by that asset. As part of the impairment exercise referred to above, a number of property, plant and equipment assets in the Drilling Tools business have been impaired during the year to reflect a reduction in the estimated future cash flows arising from the sustained current downturn in the oil and gas sector.
• The depreciation rates currently in use are disclosed in note 37. Further details of the Group’s property, plant and equipment and the other intangible assets are disclosed in notes 14 and 16 respectively.
Taxation
Carrying value of thenet tax asset at31 December 2015$10.7m (2014 – $55.2m net liability)
• In determining current tax estimates, management has to consider the likelihood of tax authority challenges and estimates tax payable accordingly. Management base their estimates in relation to current taxes by considering the enacted and substantively enacted tax laws and rates at the balance sheet date. This incorporates territories in which the Group operates and any uncertainty in interpretation of those laws and their assessment of the tax risks and exposures and judgement of likely outcome, taking into account their past experience of enquiries from tax authorities and other relevant information.
• The deferred tax balances at 31 December 2015 represent an estimate of the amounts that are expected to be paid or recovered from the tax authorities in future periods if assets and liabilities in the balance sheet were recovered at their carrying values based on tax laws and rates that have been substantively enacted by the balance sheet date. Measurement of deferred tax balances therefore requires management to assess the substantively enacted tax laws and rates, the timing of the reversal of existing taxable and deductible temporary differences and the nature, timing and amount of taxable income which would potentially be available to support the recognition of deferred tax assets (note 19). Management base their estimates of recoverability of deferred tax assets using these criteria for each separate significant category of deductible temporary difference and losses carried forward.
Oil and gas exploration and development assets
Carrying value at 31 December 2015 $4.8m (2014 – $12.5m)
• The carrying value of the Group’s oil and gas exploration and development assets is subject to the value in use of the Group’s oil and gas reserves.
• The value in use is determined by applying a present value to the estimated future producible reserves at a given forecast market price.
• The estimate of producible reserves is principally extracted using a combination of geological data and production performance records.
• The estimate of market prices is based on the medium-term futures prices (four to six years) issued by NYMEX.
• The discount rate is based on the activity’s cost of capital and specific risk premium, which is estimated to be 12% pre-tax.
• Details of the Group’s oil and gas exploration and development expenditure are disclosed in note 14.

NOTES TO THE CONSOLIDATED FINANCIAL STATEMENTS
CONTINUED
Hunting PLC2015 Annual Report and Accounts
88
3. Segmental ReportingThe Group reports on seven operating segments, three of which are discontinued operations, in its internal management reports which are used to make strategic decisions by the Hunting PLC Board, the Group’s Chief Operating Decision Maker (“CODM”). The Group’s continuing operating segments are strategic business units that offer different products and services to international oil and gas companies and undertake exploration and production activities.
The Group measures the performance of its operating segments based on revenue and profit from operations, before exceptional items and the amortisation of acquired intangible assets. Accounting policies used for segment reporting reflect those used for the Group. Inter-segment sales are priced on an arm’s length basis.
(a) Continuing OperationsThe Well Construction segment provides products and services used by customers for the drilling phase of oil and gas wells, along with associated equipment used by the underground construction industry for telecommunication infrastructure build-out and precision machining services for the energy, aviation and power generation sectors.
The Well Completion segment provides products and services used by customers for the completion phase of oil and gas wells.
The Well Intervention segment provides products and services used by customers for the production, maintenance and restoration of existing oil and gas wells.
The Exploration and Production segment includes the Group’s oil and gas exploration and production activities in the Southern US and offshore Gulf of Mexico. The Board of Hunting will not be making any new capital investment, beyond where the division has contractual commitments. No exploration and evaluation activities have occurred during the year. The division will in future focus on producing out its remaining reserves, with a view to winding down the operation.
Costs and overheads incurred centrally are apportioned to the continuing operating segments on the basis of time attributed to those operations by senior executives.
(b) Discontinued OperationsThe discontinued operations comprise Gibson Shipbrokers, which was sold on 31 March 2015, Field Aviation, which was sold in 2012, and Gibson Energy, which was sold in 2008. Gibson Energy and Field Aviation continue to generate accounting entries due to sale-related transactions and are required for reconciliation purposes.
The following tables present the results of the operating segments on the same basis as that used for internal reporting purposes to the CODM.
(c) Results From Operations
Year ended 31 December 2015
Total gross revenue
$m
Inter-segmental
revenue$m
Totalrevenue
$m
Profit from operations
before amortisationi
and exceptional
items$m
Amortisationi
andexceptional
items$m
Total$m
Continuing operations:Hunting Energy ServicesWell Construction 216.6 (5.2) 211.4 1.9 (113.8) (111.9)Well Completion 495.0 (6.4) 488.6 14.2 (146.8) (132.6)Well Intervention 107.6 (1.3) 106.3 4.6 (31.6) (27.0)
819.2 (12.9) 806.3 20.7 (292.2) (271.5)Other ActivitiesExploration and Production 4.2 – 4.2 (4.3) (6.4) (10.7)Total from continuing operations 823.4 (12.9) 810.5 16.4 (298.6) (282.2)
Net finance expense (6.8) – (6.8)Share of associates’ post-tax losses (0.2) – (0.2)Profit (loss) before tax from continuing operations 9.4 (298.6) (289.2)
Discontinued operations:Gibson Shipbrokers 11.6 – 11.6 – 4.9 4.9Gibson Energy – – – – 0.4 0.4Total from discontinued operations 11.6 – 11.6 – 5.3 5.3
Net finance income 0.1 – 0.1Taxation (0.1) (1.1) (1.2)Profit from discontinued operations – 4.2 4.2
i. Relates to amortisation of acquired intangible assets.

ST
RA
TEG
IC R
EPO
RT
CO
RP
OR
AT
E G
OV
ERN
AN
CE
FINA
NC
IAL
ST
AT
EM
EN
TS
OT
HER
INF
OR
MA
TIO
N
Hunting PLC2015 Annual Report and Accounts
89
3. Segmental Reporting continued
Year ended 31 December 2014
Total gross revenue
$m
Inter-segmental
revenue$m
Totalrevenue
$m
Profit from operations
before amortisationi
and exceptional
items$m
Amortisationi
andexceptional
items$m
Total$m
Continuing operations:Hunting Energy ServicesWell Construction 384.3 (6.0) 378.3 53.0 (57.1) (4.1)Well Completion 877.6 (15.0) 862.6 140.8 (34.7) 106.1 Well Intervention 135.8 (0.3) 135.5 23.8 (0.8) 23.0
1,397.7 (21.3) 1,376.4 217.6 (92.6) 125.0 Other ActivitiesExploration and Production 10.1 – 10.1 0.2 (11.3) (11.1)Total from continuing operations 1,407.8 (21.3) 1,386.5 217.8 (103.9) 113.9
Net finance expense (4.9) – (4.9)Share of associates’ post-tax losses (0.5) – (0.5)Profit before tax from continuing operations 212.4 (103.9) 108.5
Discontinued operations:Gibson Shipbrokers 47.4 – 47.4 0.5 – 0.5 Gibson Energy – – – – 0.2 0.2 Field Aviation – – – – 0.9 0.9 Total from discontinued operations 47.4 – 47.4 0.5 1.1 1.6
Net finance income 0.2 – 0.2 Taxation (0.4) – (0.4)Profit from discontinued operations 0.3 1.1 1.4
i. Relates to amortisation of acquired intangible assets.
(d) Other Segment Items
2015 2014
Depreciation$m
Amortisationof intangible
assets$m
Impairment$m
Depreciation$m
Amortisationof intangible
assets$m
Impairment$m
Continuing operations:Hunting Energy ServicesWell Construction 14.1 7.7 106.8 21.7 7.5 49.6 Well Completion 18.4 32.4 118.7 19.2 34.5 –Well Intervention 7.3 0.7 30.0 6.3 0.8 –
39.8 40.8 255.5 47.2 42.8 49.6 Other ActivitiesExploration and Production 3.8 – 6.4 4.8 – 11.3 Total – continuing operations 43.6 40.8 261.9 52.0 42.8 60.9
Discontinued operations:Gibson Shipbrokers – – – 0.3 – –

NOTES TO THE CONSOLIDATED FINANCIAL STATEMENTS
CONTINUED
Hunting PLC2015 Annual Report and Accounts
90
3. Segmental Reporting continued(e) Geographical InformationThe Group operates across a number of geographical areas. The UK is the domicile of Hunting PLC. The table below shows revenues from external customers, which are attributed to individual countries on the basis of the location in which the sale originated. Information on the location of non-current assets is also presented below. Non-current assets exclude defined benefit assets and deferred tax assets.
External revenue
Profit from operations before amortisationi and
exceptional items Non-current assets
2015$m
2014$m
2015$m
2014$m
2015$m
2014$m
Continuing operations:Hunting Energy Services US 507.0 867.3 31.7 170.0 748.4 985.6 Canada 56.1 95.5 (3.6) 3.8 9.1 25.6 North America 563.1 962.8 28.1 173.8 757.5 1,011.2
UK 119.4 163.5 (2.7) 8.4 66.3 75.0 Rest of Europe 15.2 30.7 (1.5) 2.5 4.7 4.4 Europe 134.6 194.2 (4.2) 10.9 71.0 79.4
Singapore 67.2 149.0 1.6 27.4 10.8 11.8 Rest of Asia 22.9 50.5 (1.9) 3.6 17.3 22.4 Asia Pacific 90.1 199.5 (0.3) 31.0 28.1 34.2
Middle East, Africa and Other 18.5 19.9 (2.9) 1.9 25.6 14.6 806.3 1,376.4 20.7 217.6 882.2 1,139.4
Other activitiesUS 4.2 10.1 (4.3) 0.2 6.4 15.6 810.5 1,386.5 16.4 217.8 888.6 1,155.0
Discontinued operations:UK 9.9 40.4 (0.2) (1.4) – –Other 1.7 7.0 0.2 1.9 – – 11.6 47.4 – 0.5 888.6 1,155.0
Unallocated assets:Deferred tax assets 2.0 1.2 Retirement benefit assets 41.4 30.9 Total non-current assets 932.0 1,187.1
i. Relates to amortisation of acquired intangible assets.
(f) Major Customer InformationThe Group received $86.3m (2014 – $155.5m) of revenue from the Halliburton Company Group, which is 11% (2014 – 11%) of the Group’s revenue from external customers. The revenue is included within the Well Construction, Well Completion and Well Intervention segments.
4. Revenue
2015$m
2014$m
Sale of goods 687.0 1,154.5 Revenue from services 72.3 110.3 Rental revenue 51.2 121.7 Continuing operations 810.5 1,386.5
5. Other Operating Income
2015$m
2014$m
Operating lease rental income 0.7 1.2 Gain on disposal of property, plant and equipment 1.3 4.2 Foreign exchange gains 1.1 2.8 Other income 0.7 1.3 Continuing operations 3.8 9.5

ST
RA
TEG
IC R
EPO
RT
CO
RP
OR
AT
E G
OV
ERN
AN
CE
FINA
NC
IAL
ST
AT
EM
EN
TS
OT
HER
INF
OR
MA
TIO
N
Hunting PLC2015 Annual Report and Accounts
91
6. Operating Expenses
2015$m
2014$m
Administration expensesii before amortisationi and exceptional items 111.1 133.9 Distribution and selling costs 68.4 91.5 Loss on disposal of property, plant and equipment 3.1 10.2 Operating expenses before amortisationi and exceptional items 182.6 235.6 Amortisationi and exceptional items (note 7) 260.7 92.6 Continuing operations 443.3 328.2
i. Relates to amortisation of acquired intangible assets.ii. Includes foreign exchange losses of $1.6m (2014 – $1.8m).
7. Amortisation and Exceptional Items
2015$m
2014$m
Impairment of property, plant and equipment (note 14) 33.2 9.6 Dry hole costs (note 14) – 1.7 Restructuring costs 4.7 –Charged to cost of sales 37.9 11.3 Amortisation of acquired intangible assets (note 8) 38.9 42.8 Impairment of goodwill (note 15) 208.2 49.6 Impairment of other intangible assets (note 16) 11.2 – Restructuring costs 2.4 – Release of foreign exchange on liquidation of subsidiaries – 4.8 Excess property provision release – (4.6)Charged to operating expenses 260.7 92.6 Amortisation and exceptional items 298.6 103.9 Taxation on amortisation and exceptional items (note 11) (63.2) (20.5)Continuing operations 235.4 83.4
Plant and equipment impairment of $26.8m (2014 – $nil) was recognised in the Drilling Tools business following a review of the carrying value given current trading conditions and future expectations and an impairment charge of $6.4m (2014 – $11.3m) for oil and gas exploration and development expenditure was recorded. Dry hole costs of $1.7m were incurred and paid during 2014 from Exploration and Production activities. Further details can be found in note 14.
A goodwill impairment charge of $208.2m (2014 – $49.6m) has been recognised. Further details can be found in note 15.
Restructuring costs of $7.1m (2014 – $nil) have been recognised in the year, reflecting the reduction in the Group’s workforce and the closure of the Canada Drilling Tools business. Restructuring costs gave rise to cash outflows of $5.9m (2014 – $nil) in the year.
Foreign exchange losses of $4.8m relating to cumulative foreign exchange differences previously recognised in the currency translation reserve were transferred to the income statement following the voluntary liquidation of central non-operating companies in 2014.
Property provisions of $4.6m were released in 2014 as they were no longer required following the signing of a lease termination agreement with the owner of a leasehold property. During the year, payments of $4.6m were made.

NOTES TO THE CONSOLIDATED FINANCIAL STATEMENTS
CONTINUED
Hunting PLC2015 Annual Report and Accounts
92
8. Profit (loss) from Continuing OperationsThe following items have been charged in arriving at profit (loss) from continuing operations:
2015$m
2014$m
Staff costs (note 9) 208.4 286.0 Depreciation of property, plant and equipment (note 14) 43.6 52.0 Amortisation of acquired intangible assets (included in operating expenses) (note 16) 38.9 42.8 Amortisation of other intangible assets (included in operating expenses) (note 16) 1.9 –Impairment of other intangible assets (included in operating expenses) (note 16) 11.2 –Impairment of goodwill (included in operating expenses) (note 15) 208.2 49.6 Impairment of property, plant and equipment (included in cost of sales) (note 14) 33.2 11.3 Impairment of trade and other receivables (included in operating expense) (note 18) 0.2 0.5 Cost of inventories recognised as expense (included in cost of sales) 559.5 839.2 Write down in inventories (included in cost of sales) 9.3 2.4 Net loss on disposal of property, plant and equipment 1.8 6.0 Operating lease payments (note 34) 14.2 16.2 Research and development expenditure 0.6 0.8
Fees payable to the Group’s auditors PricewaterhouseCoopers LLP and its associates for:
2015$m
2014$m
The audit of these accounts 1.9 1.9 The audit of the accounts of the Company’s subsidiaries 0.4 0.3 Total audit 2.3 2.2 Audit-related assurance services 0.1 0.1 Total audit and audit-related services 2.4 2.3
Taxation compliance services 0.2 0.2 Taxation advisory services 0.1 0.2 Total services relating to taxation 0.3 0.4
Other services – 0.1 Total other non-audit services – 0.1
Total fees 2.7 2.8
9. Employees
2015 2014
Continuing operations
$m
Discontinued operations
$mTotal
$m
Continuing operations
$m
Discontinued operations
$mTotal
$m
Wages and salaries 177.7 7.7 185.4 247.9 31.7 279.6 Social security costs 12.8 0.9 13.7 17.2 3.6 20.8 Share-based payments (note 33) 6.2 – 6.2 7.4 0.3 7.7 Pension costs– defined contribution schemes (note 28) 8.0 0.3 8.3 9.8 1.0 10.8 – defined benefit scheme (note 28) 3.7 0.5 4.2 3.7 2.3 6.0 Staff costs included in underlying profit from operations 208.4 9.4 217.8 286.0 38.9 324.9Defined benefit credit included in exceptional items – (5.5) (5.5) – – –
208.4 3.9 212.3 286.0 38.9 324.9Pension costs – net interest included in net finance expense (note 28) (0.8) – (0.8) (1.2) – (1.2)Staff costs for the year 207.6 3.9 211.5 284.8 38.9 323.7

ST
RA
TEG
IC R
EPO
RT
CO
RP
OR
AT
E G
OV
ERN
AN
CE
FINA
NC
IAL
ST
AT
EM
EN
TS
OT
HER
INF
OR
MA
TIO
N
Hunting PLC2015 Annual Report and Accounts
93
9. Employees continuedThe average monthly number of employees by geographical area (including executive Directors) during the year was:
2015 2014
Continuing operations
Discontinued operationsi Total
Continuing operations
Discontinued operations Total
UK 386 39 425 409 154 563 Rest of Europe 82 – 82 78 – 78 Canada 180 – 180 267 – 267 USA 2,032 – 2,032 2,359 1 2,360 Singapore 221 4 225 218 15 233 Rest of Asia Pacific 344 1 345 498 4 502 Middle East, Africa & Other 66 – 66 41 – 41 3,311 44 3,355 3,870 174 4,044
The average monthly number of employees by operating segment (including executive Directors) during the year was:
2015 2014
Continuing operations
Discontinued operationsi Total
Continuing operations
Discontinued operations Total
Well Construction 866 – 866 1,081 – 1,081 Well Completion 1,877 – 1,877 2,237 – 2,237 Well Intervention 499 – 499 483 – 483 Exploration and Production 4 – 4 4 – 4 Gibson Shipbrokers – 44 44 – 174 174 Central 65 – 65 65 – 65 3,311 44 3,355 3,870 174 4,044
i. The average monthly number of employees for discontinued operations was 178 for the three months during which the discontinued operations were part of the Group. In presenting the Group’s average numbers for the year, the discontinued average has been calculated across 12 months.
The actual number of employees at the year end was:
2015 2014
Continuing operations
Discontinued operations Total
Continuing operations
Discontinued operations Total
Male 2,227 – 2,227 3,271 149 3,420 Female 557 – 557 732 30 762 2,784 – 2,784 4,003 179 4,182
Key management comprises the executive and non-executive Directors only. Their compensation in the year was:
2015$m
2014$m
Salaries and short-term employee benefits 2.1 3.9 Social security costs 0.4 0.4 Post-employment benefits 0.2 0.5 Share-based payments – 1.5 2.7 6.3
Salaries and short-term benefits are included within the Directors Remuneration table on page 66 of the Annual Report on Remuneration. Post-employment benefits comprise employer pension contributions. Share-based payments comprise the charge to the income statement. Details of share options and awards are disclosed on page 70 of the Annual Report on Remuneration.

NOTES TO THE CONSOLIDATED FINANCIAL STATEMENTS
CONTINUED
Hunting PLC2015 Annual Report and Accounts
94
10. Net Finance Expense
2015$m
2014$m
Finance income:Bank balances and deposits 0.9 1.7 Pension interest income 1.1 1.5 Foreign exchange gains 0.8 3.3 Other finance income 0.5 1.0 3.3 7.5 Finance expense:Bank overdrafts (0.8) (1.4)Bank borrowings (2.6) (3.5)Bank fees and commissions (5.1) (4.1)Foreign exchange losses (0.4) (2.4)Other finance expense (1.2) (1.0) (10.1) (12.4)Net finance expense – continuing operations (6.8) (4.9)
11. Taxation
2015 2014
Beforeamortisationi
andexceptional
items$m
Amortisationi
andexceptional
items$m
Total$m
Beforeamortisationi
andexceptional
items$m
Amortisationi
andexceptional
items$m
Total$m
Current tax– current year (credit) expense (0.7) (26.8) (27.5) 58.4 (19.1) 39.3 – adjustments in respect of prior years (0.4) – (0.4) (6.5) – (6.5) (1.1) (26.8) (27.9) 51.9 (19.1) 32.8 Deferred tax– origination and reversal of temporary differences 6.1 (36.4) (30.3) 2.6 (1.4) 1.2 – change in tax rate 0.1 – 0.1 – – –– adjustments in respect of prior years 0.3 – 0.3 2.7 – 2.7
6.5 (36.4) (29.9) 5.3 (1.4) 3.9 Taxation charge (credit) – continuing operations 5.4 (63.2) (57.8) 57.2 (20.5) 36.7
i. Relates to amortisation of acquired intangible assets.
The weighted average applicable tax rate for continuing operations before amortisation and exceptional items is 57% (2014 – 27%).
The tax credit in the income statement of $63.2m (2014 – $20.5m) for amortisation and exceptional items comprises credits of $15.1m (2014 – $16.4m) on the amortisation of acquired intangible assets, $9.2m (2014 – $nil) on the impairment of plant, machinery and motor vehicles, $2.6m (2014 – $3.7m) on the impairment of oil and gas development expenditure, $3.1m (2014 – $nil) on the impairment of other intangible assets, $31.9m (2014 – $nil) on the impairment of goodwill, $1.3m (2014 – $nil) relating to restructuring costs, $nil (2014 – $0.7m) for dry hole costs, $nil (2014 – $0.7m) on the release of foreign exchange on liquidation of subsidiaries, and a charge of $nil (2014 – $1.0m) on the excess property provision release.
The total tax credit for the year is lower (2014 – the total tax charge was higher) than the standard rate of UK corporation tax of 20.25% (2014 – 21.5%) for the following reasons:
2015$m
2014$m
(Loss) profit before tax from continuing operations (289.2) 108.5 Tax at 20.25% (2014 – 21.5%) (58.6) 23.3 Permanent differences including tax credits 2.1 (4.0)Recognition of previously unrecognised deferred taxes – (0.1)Non-tax deductible (untaxed) exceptional items 41.4 11.1 Higher rate of tax on overseas profits (45.8) 10.2 Current year losses not recognised 3.1 –Change in tax rates 0.1 –Adjustments in respect of prior years (0.1) (3.8)Taxation – continuing operations (57.8) 36.7

ST
RA
TEG
IC R
EPO
RT
CO
RP
OR
AT
E G
OV
ERN
AN
CE
FINA
NC
IAL
ST
AT
EM
EN
TS
OT
HER
INF
OR
MA
TIO
N
Hunting PLC2015 Annual Report and Accounts
95
11. Taxation continuedTax effects relating to each component of other comprehensive income were as follows:
2015 2014
Before tax$m
Tax (charged) credited
$mAfter tax
$mBefore tax
$m
Tax (charged) credited
$mAfter tax
$m
Exchange adjustments (17.2) 0.1 (17.1) (19.4) 1.5 (17.9)Release of foreign exchange losses 0.6 – 0.6 4.8 (1.0) 3.8 Fair value gains and losses:– gain transferred to income statement on redemption of
available for sale investment – – – (0.2) – (0.2)– losses originating on cash flow hedges arising during
the year – – – (0.1) – (0.1)– gains transferred to income statement on disposal of
cash flow hedges – – – (1.7) 0.4 (1.3)Remeasurement of defined benefit pension schemes 10.9 (1.7) 9.2 1.7 (0.2) 1.5
(5.7) (1.6) (7.3) (14.9) 0.7 (14.2)
In respect of the tax on the remeasurement of defined benefit pension schemes, a $2.0m charge (2014 – $0.2m) arises on the current year’s movement and a credit of $0.3m (2014 – $nil) is due to a change in tax rates. The $1.7m charge comprises $1.5m deferred tax and $0.2m current tax.
In July 2013, the UK Government enacted a change in the UK corporation tax rate from 21% to 20% effective from 1 April 2015. The impact of the change in rate to 20% has been recognised in calculating the effective tax rate for the year ended 31 December 2015.
A number of changes to the UK corporation tax system were announced in the summer 2015 Budget Statement, whereby from 1 April 2017 the main rate of corporation tax will reduce from 20% to 19%, with a further reduction from 19% to 18% on 1 April 2020. The Finance Bill which included these changes received Royal Assent on 18 November 2015. The changes have not had a material impact on the Group’s UK deferred tax balances.
12. Discontinued OperationsThe results from discontinued operations were as follows:
2015 2014
Gibson Shipbrokers
$m
Gibson Energy
$m Total
$m
Gibson Shipbrokers
$m
Field Aviation
$m
Gibson Energy
$m Total
$m
Trading results:Revenue 11.6 – 11.6 47.4 – – 47.4 Gross profit 11.6 – 11.6 47.4 – – 47.4 Other operating income 0.1 – 0.1 0.4 – – 0.4 Other operating expenses (11.7) – (11.7) (47.3) – – (47.3)Profit from operations – – – 0.5 – – 0.5 Finance income 0.1 – 0.1 0.2 – – 0.2 Profit before tax 0.1 – 0.1 0.7 – – 0.7 Taxation (0.1) – (0.1) (0.4) – – (0.4)Profit for the year – – – 0.3 – – 0.3
Gain on disposal:Gain on sale before tax 4.9 0.4 5.3 – 0.9 0.2 1.1 Taxation (1.1) – (1.1) – – – –Gain on sale after tax 3.8 0.4 4.2 – 0.9 0.2 1.1
Total profit from discontinued operations 3.8 0.4 4.2 0.3 0.9 0.2 1.4
Gibson ShipbrokersOn 31 March 2015, the Group sold E.A. Gibson Shipbrokers Limited and its subsidiaries (together referred to as “Gibson Shipbrokers”) to an employee-owned trust formed by Gibson Shipbrokers’ employees. The selling price was $3.7m, with $3.0m deferred in the form of an interest-bearing loan note and the remainder paid in cash. A curtailment gain on the Group’s pension obligations of $5.5m was also recognised upon the sale.
Field AviationOn 27 April 2012, the Group sold its aviation engineering services business, Hunting Canadian Airport Holdings Ltd and its subsidiaries, including Field Aviation Company Inc (together referred to as “Field Aviation”). Under the terms of the sale, Hunting PLC and the purchaser established an environmental escrow account to address ongoing site condition costs relating to Field Aviation’s hangar facilities in Calgary. Additionally, part of the consideration was deferred in the form of an interest-bearing promissory note issued to Hunting PLC, repayable by the purchaser on or before 31 December 2018. On 30 September 2014, the promissory note was repaid in full and the environmental escrow account was wound up, with remaining funds distributed between Hunting PLC and the purchaser. This resulted in a gain of $0.9m included within discontinued items in 2014.

NOTES TO THE CONSOLIDATED FINANCIAL STATEMENTS
CONTINUED
Hunting PLC2015 Annual Report and Accounts
96
12. Discontinued Operations continuedGibson EnergyThe sale of Gibson Energy Inc, Hunting’s Canadian midstream services operation, was completed on 12 December 2008. Subsequent gains reported relate to the settlement of tax items.
13. Earnings per ShareBasic earnings per share (“EPS”) is calculated by dividing the earnings attributable to Ordinary shareholders by the weighted average number of Ordinary shares outstanding during the year.
For diluted earnings per share, the weighted average number of outstanding Ordinary shares is adjusted to assume conversion of all dilutive potential Ordinary shares. The dilution in respect of share options applies where the exercise price is less than the average market price of the Company’s Ordinary shares during the year and the possible issue of shares under the Group’s long-term incentive plans.
Reconciliations of the earnings and weighted average number of Ordinary shares used in the calculations are set out below:
2015$m
2014$m
Basic and diluted (loss) earnings attributable to Ordinary shareholdersFrom continuing operations (230.8) 67.8 From discontinued operations 4.2 1.4 Total (226.6) 69.2
Basic and diluted (loss) earnings attributable to Ordinary shareholders before amortisationi and exceptional itemsFrom continuing operations (230.8) 67.8 Add: amortisationi and exceptional items after taxation (note 7) 235.4 83.4 Total 4.6 151.2
From discontinued operations 4.2 1.4 Less: exceptional items after taxation (4.2) (1.1)Total – 0.3
millions millions
Basic weighted average number of Ordinary shares 147.8 147.3 Dilutive outstanding share options 0.1 0.6 Long-term incentive plans 2.0 3.2 Adjusted weighted average number of Ordinary shares 149.9 151.1
cents cents
(a) Reported (Loss) Earnings per Share
Basic EPSFrom continuing operations (156.1) 45.9 From discontinued operations 2.8 1.0 (153.3) 46.9
Diluted EPSii
From continuing operations (156.1) 44.8 From discontinued operations 2.8 1.0 (153.3) 45.8 (b) Underlying Earnings per Share
Basic EPSFrom continuing operations 3.1 102.6 From discontinued operations – 0.2 3.1 102.8
Diluted EPSii
From continuing operations 3.1 100.0 From discontinued operations – 0.2 3.1 100.2
i. Relates to amortisation of acquired intangible assets.ii. For the year ended 31 December 2015, the effect of dilutive share options and long-term incentive plans was anti-dilutive and, therefore, they have not been used to
calculate diluted earnings per share.
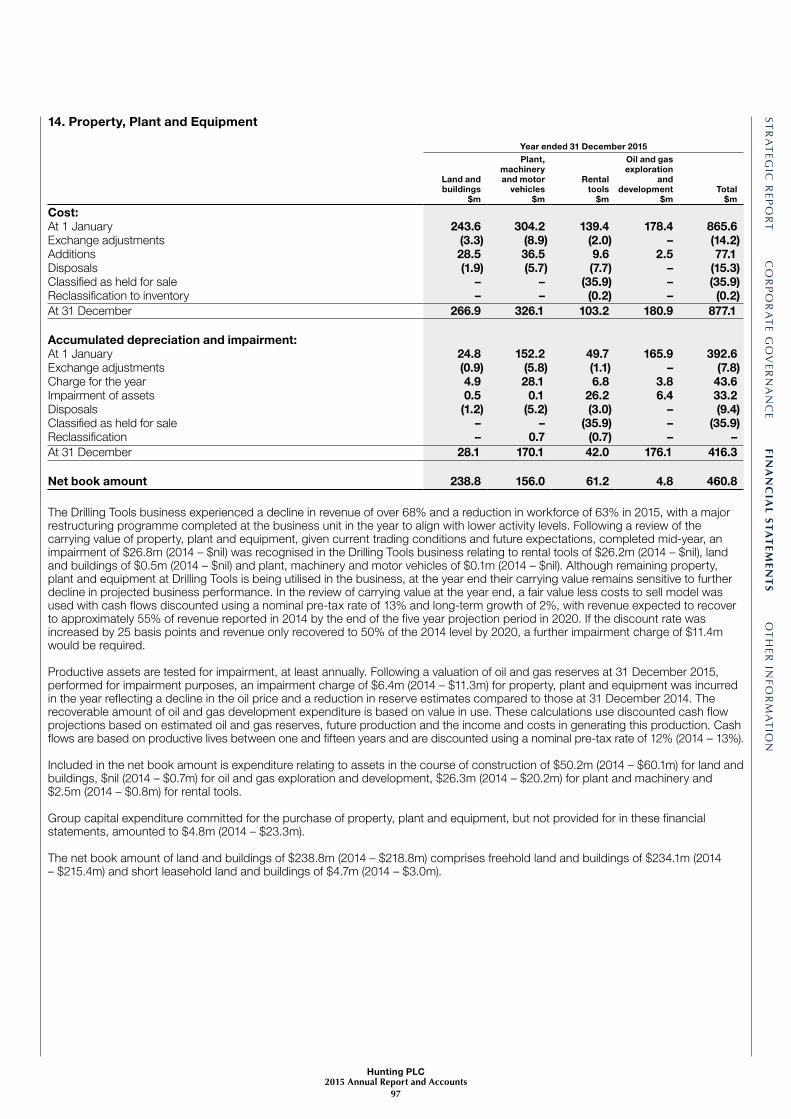
ST
RA
TEG
IC R
EPO
RT
CO
RP
OR
AT
E G
OV
ERN
AN
CE
FINA
NC
IAL
ST
AT
EM
EN
TS
OT
HER
INF
OR
MA
TIO
N
Hunting PLC2015 Annual Report and Accounts
97
14. Property, Plant and Equipment
Year ended 31 December 2015
Land andbuildings
$m
Plant,machinery and motor
vehicles$m
Rental tools
$m
Oil and gas exploration
anddevelopment
$mTotal
$m
Cost:At 1 January 243.6 304.2 139.4 178.4 865.6Exchange adjustments (3.3) (8.9) (2.0) – (14.2)Additions 28.5 36.5 9.6 2.5 77.1Disposals (1.9) (5.7) (7.7) – (15.3)Classified as held for sale – – (35.9) – (35.9)Reclassification to inventory – – (0.2) – (0.2)At 31 December 266.9 326.1 103.2 180.9 877.1
Accumulated depreciation and impairment:At 1 January 24.8 152.2 49.7 165.9 392.6Exchange adjustments (0.9) (5.8) (1.1) – (7.8)Charge for the year 4.9 28.1 6.8 3.8 43.6Impairment of assets 0.5 0.1 26.2 6.4 33.2Disposals (1.2) (5.2) (3.0) – (9.4)Classified as held for sale – – (35.9) – (35.9)Reclassification – 0.7 (0.7) – –At 31 December 28.1 170.1 42.0 176.1 416.3
Net book amount 238.8 156.0 61.2 4.8 460.8
The Drilling Tools business experienced a decline in revenue of over 68% and a reduction in workforce of 63% in 2015, with a major restructuring programme completed at the business unit in the year to align with lower activity levels. Following a review of the carrying value of property, plant and equipment, given current trading conditions and future expectations, completed mid-year, an impairment of $26.8m (2014 – $nil) was recognised in the Drilling Tools business relating to rental tools of $26.2m (2014 – $nil), land and buildings of $0.5m (2014 – $nil) and plant, machinery and motor vehicles of $0.1m (2014 – $nil). Although remaining property, plant and equipment at Drilling Tools is being utilised in the business, at the year end their carrying value remains sensitive to further decline in projected business performance. In the review of carrying value at the year end, a fair value less costs to sell model was used with cash flows discounted using a nominal pre-tax rate of 13% and long-term growth of 2%, with revenue expected to recover to approximately 55% of revenue reported in 2014 by the end of the five year projection period in 2020. If the discount rate was increased by 25 basis points and revenue only recovered to 50% of the 2014 level by 2020, a further impairment charge of $11.4m would be required.
Productive assets are tested for impairment, at least annually. Following a valuation of oil and gas reserves at 31 December 2015, performed for impairment purposes, an impairment charge of $6.4m (2014 – $11.3m) for property, plant and equipment was incurred in the year reflecting a decline in the oil price and a reduction in reserve estimates compared to those at 31 December 2014. The recoverable amount of oil and gas development expenditure is based on value in use. These calculations use discounted cash flow projections based on estimated oil and gas reserves, future production and the income and costs in generating this production. Cash flows are based on productive lives between one and fifteen years and are discounted using a nominal pre-tax rate of 12% (2014 – 13%).
Included in the net book amount is expenditure relating to assets in the course of construction of $50.2m (2014 – $60.1m) for land and buildings, $nil (2014 – $0.7m) for oil and gas exploration and development, $26.3m (2014 – $20.2m) for plant and machinery and $2.5m (2014 – $0.8m) for rental tools.
Group capital expenditure committed for the purchase of property, plant and equipment, but not provided for in these financial statements, amounted to $4.8m (2014 – $23.3m).
The net book amount of land and buildings of $238.8m (2014 – $218.8m) comprises freehold land and buildings of $234.1m (2014 – $215.4m) and short leasehold land and buildings of $4.7m (2014 – $3.0m).

NOTES TO THE CONSOLIDATED FINANCIAL STATEMENTS
CONTINUED
Hunting PLC2015 Annual Report and Accounts
98
14. Property, Plant and Equipment continued
Year ended 31 December 2014
Land andbuildings
$m
Plant, machinery and motor
vehicles$m
Rental tools
$m
Oil and gas exploration
anddevelopment
$mTotal
$m
Cost:At 1 January 192.1 281.5 135.2 171.3 780.1 Exchange adjustments (3.7) (6.6) (1.6) – (11.9)Additions 56.0 36.3 25.7 7.1 125.1 Disposals (0.1) (4.6) (19.7) – (24.4)Classified as held for sale (2.0) (1.3) – – (3.3)Reclassification 1.3 (1.1) (0.2) – –At 31 December 243.6 304.2 139.4 178.4 865.6
Accumulated depreciation and impairment:At 1 January 22.7 133.3 42.5 149.8 348.3 Exchange adjustments (0.8) (4.1) (0.9) – (5.8)Charge for the year* 4.4 28.6 14.5 4.8 52.3 Impairment of assets – – – 11.3 11.3 Disposals (0.1) (4.2) (6.4) – (10.7)Classified as held for sale (1.6) (1.2) – – (2.8)Reclassification 0.2 (0.2) – – –At 31 December 24.8 152.2 49.7 165.9 392.6
Net book amount 218.8 152.0 89.7 12.5 473.0
* Included in the charge for the year is $0.3m for discontinued operations.
15. Goodwill
2015$m
2014$m
Cost:At 1 January 522.5 529.2 Exchange adjustments (5.4) (3.7)Classified as held for sale – (3.0)At 31 December 517.1 522.5
Accumulated impairment:At 1 January 81.9 34.0 Exchange adjustments (3.6) (0.5)Charge for the year 208.2 49.6 Classified as held for sale – (1.2)At 31 December 286.5 81.9
Net book amount 230.6 440.6
The net book amount of goodwill at 1 January 2014 was $495.2m.
(a) Impairment Tests for GoodwillGoodwill is allocated to the Group’s cash-generating units (“CGUs”) as follows:
CGU2015
$m2014
$m
Titan 180.4 288.4 Hunting Stafford “Subsea” (formally National Coupling Company) 15.0 32.7 Electronics – 28.7 Dearborn 12.5 25.5 Welltonic 5.2 18.0 Drilling Tools – 4.4 Hunting Specialty 5.0 17.0US Manufacturing 12.5 12.5US Pipe – 2.3Canada Pipe – 8.9PT Hunting Energy Asia – 2.2 At 31 December 230.6 440.6

ST
RA
TEG
IC R
EPO
RT
CO
RP
OR
AT
E G
OV
ERN
AN
CE
FINA
NC
IAL
ST
AT
EM
EN
TS
OT
HER
INF
OR
MA
TIO
N
Hunting PLC2015 Annual Report and Accounts
99
15. Goodwill continuedThe downturn of the oil and gas sector continued to worsen during 2015. Likewise, the general view on the outlook for commodity prices remains progressively “lower for longer”. Hence, in addition to the $35.2m charge reflected in the half-year report, a further $173.0m impairment charge has been recognised at the year end, bringing the total charge for the year to $208.2m.
The recoverable amount for each CGU has been determined based on a fair value less costs to sell approach, thereby including currently approved capital projects which are in progress and deducting appropriate selling costs. The recoverable amount calculations use discounted pre-tax nominal cash flow projections. The key assumptions for the recoverable amount calculations are revenue growth rates, taking into account the impact these have on margins, terminal growth rates and the discount rates applied.
For 2016 and 2017, projections are based on management’s latest forecasts. For 2018 to 2020 management has made revenue projections using Spears and Associates “Drilling and Production Outlook” reports as a basis, selecting the most appropriate geographic market and driver (rig count, footage drilled or E&P spend) for each CGU. Management has then applied judgemental decreases to reflect the worsening of expectations and has then modelled the expected impact on margin and cash flow from the resulting revenue projections.
Market conditions remain volatile, difficult to predict and will impact CGUs differently. The compound annual growth rates (“CAGR”) for revenue for the CGUs between 2015 and 2020 vary between minus 7% and positive 12%. After 2020 a terminal value has been calculated assuming growth above inflation between 35 and 50 basis points, giving nominal growth rates between 2% and 6%.
Cash flows have been discounted using nominal pre-tax rates between 8% and 14%. The discount rates reflect current market assessments of the time value of money, the risks associated with the cash flows, the likely external borrowing rate of the CGU and expected levels of leverage. Consideration has also been given to other factors such as currency risk, operational risk and country risk.
(b) Impairment of Goodwill and SensitivitiesTitan – An impairment charge of $107.6m (2014 – $nil) has been recognised reflecting the downturn in the sector and, in particular, relates to the impact for onshore US shale which is Titan’s primary market. Titan represents 78% of the goodwill balance at 31 December 2015 (2014 – 65%) and has a carrying value, including amounts recognised on consolidation such as goodwill, of $503.0m (2014 – $654.0m). Projected annual growth rates vary between minus 13% and positive 11%. Cash flows have been discounted at a nominal pre-tax rate of 10%. If the expected upturn is delayed from 2017 to 2018 and if discount rates increase by a further 25 basis points, then a further $13.8m of impairment would be incurred.
Hunting Stafford (“Subsea”) – An impairment charge of $17.7m (2014 – $nil) has been recognised reflecting the downturn in the sector. Cash flows have been discounted at a nominal pre-tax rate of 12%. If the expected upturn is delayed from 2017 to 2018 and if discount rates increase by a further 25 basis points, then a further $10.5m of impairment would be incurred.
Hunting Dearborn – An impairment charge of $13.0m (2014 – $nil) has been recognised reflecting the downturn in the sector. Cash flows have been discounted at a nominal pre-tax rate of 9%. If the expected upturn is delayed from 2017 to 2018 and if discount rates increase by a further 25 basis points, then a further $8.6m of impairment would be incurred.
Welltonic – An impairment charge of $12.2m (2014 – $nil) has been recognised reflecting the downturn in the sector. Cash flows have been discounted at a nominal pre-tax rate of 9%. If the expected upturn is delayed from 2017 to 2018 and if discount rates increase by a further 25 basis points, then a further $2.2m of impairment would be incurred.
Hunting Specialty – An impairment charge of $12.0m (2014 – $nil) has been recognised reflecting the downturn in the sector. Cash flows have been discounted at a nominal pre-tax rate of 8%. If the expected upturn is delayed from 2017 to 2018 and if discount rates increase by a further 25 basis points, then a further $1.3m of impairment would be incurred.
Canada Pipe – An impairment charge of $8.1m (2014 – $nil) has been recognised reflecting the downturn in the sector, which reduced the balance on goodwill to $nil (2014 – $9.0m). Cash flows have been discounted at a nominal pre-tax rate of 9%.
US Pipe – An impairment charge of $2.3m (2014 – $nil) has been recognised reflecting the downturn in the sector, which reduced the balance on goodwill to $nil (2014 – $2.3m). Cash flows have been discounted at a nominal pre-tax rate of 11%.
Electronics – An impairment charge of $28.7m was incurred in the first half of 2015 following a prolonged period of customer de-stocking, increased competition, in particular from the Far East, and as a result of the sector downturn. Cash flows have been discounted at a nominal pre-tax rate of 10%. This fully impaired the goodwill, leaving the balance at $nil (2014 – $28.7m).

NOTES TO THE CONSOLIDATED FINANCIAL STATEMENTS
CONTINUED
Hunting PLC2015 Annual Report and Accounts
100
15. Goodwill continuedDrilling Tools – An impairment charge of $4.3m was incurred in the first half of 2015 as a result of increased competition, higher maintenance costs, and the significant impact of the downturn on the US shale and Canadian markets in which this CGU operated. Cash flows have been discounted at a nominal pre-tax rate of 13%. This fully impaired the goodwill leaving the balance at $nil (2014 – $4.4m). The Canadian Drilling Tools business has been closed in the year.
PT Hunting Energy Asia – An impairment charge of $2.2m was incurred in the first half of 2015 as a result of the sector downturn. This fully impaired the goodwill leaving the balance at $nil (2014 – $2.2m).
US Manufacturing – No impairment charge has been incurred as a result of the downturn (2014 – $nil). Cash flows have been discounted at a nominal pre-tax rate of 11%. If the expected upturn is delayed from 2017 to 2018, and if discount rates increase by a further 25 basis points, no impairment is required.
16. Other Intangible Assets
2015Customer
relationships$m
Unpatented technology
$m
Patents & Trademarks
$mOther
$mTotal
$m
Cost:At 1 January 247.6 60.2 50.7 22.6 381.1Exchange adjustments (0.2) (0.2) – (0.3) (0.7)Additions – 4.4 3.2 0.4 8.0Disposals – – – (0.3) (0.3)At 31 December 247.4 64.4 53.9 22.4 388.1
Accumulated amortisation and impairment:At 1 January 92.1 17.5 28.6 18.1 156.3Exchange adjustments (0.2) 0.1 – (0.2) (0.3)Charge for the year 25.8 5.9 7.6 1.5 40.8Impairment of assets 11.2 – – – 11.2Disposals – – – (0.3) (0.3)At 31 December 128.9 23.5 36.2 19.1 207.7
Net book amount 118.5 40.9 17.7 3.3 180.4
2014
Customer relationships
$m
Unpatented technology
$m
Patents & Trademarks
$mOther
$mTotal
$m
Cost:At 1 January 247.8 53.4 53.2 22.7 377.1 Exchange adjustments (0.2) (0.1) – (0.4) (0.7)Additions – 3.9 0.2 0.9 5.0 Classified as held for sale – – – (0.3) (0.3)Reclassification – 3.0 (2.7) (0.3) –At 31 December 247.6 60.2 50.7 22.6 381.1
Accumulated amortisation:At 1 January 66.3 12.2 21.1 14.5 114.1 Exchange adjustments (0.2) – – (0.1) (0.3)Charge for the year 26.0 5.3 7.5 4.0 42.8 Classified as held for sale – – – (0.3) (0.3)At 31 December 92.1 17.5 28.6 18.1 156.3
Net book amount 155.5 42.7 22.1 4.5 224.8
The net book amount of other intangible assets at 1 January 2014 was $263.0m.
A review of the carrying value of other intangible assets was undertaken, which led to the impairment of customer relationships arising on the acquisition of the Electronics and Doffing businesses of $11.2m (2014 – $nil).
Other intangible assets include software of $2.7m (2014 – $3.7m).
Internally generated intangible assets have been included within unpatented technology. Additions during the year amounted to $1.1m (2014 – $3.2m). The carrying value at the beginning of the year was $5.9m (2014 – $2.7m) and at the end of the year was $6.4m (2014 – $5.9m).

ST
RA
TEG
IC R
EPO
RT
CO
RP
OR
AT
E G
OV
ERN
AN
CE
FINA
NC
IAL
ST
AT
EM
EN
TS
OT
HER
INF
OR
MA
TIO
N
Hunting PLC2015 Annual Report and Accounts
101
16. Other Intangible Assets continuedAll intangible assets are regarded as having a finite life and are amortised accordingly. All amortisation charges relating to intangible assets have been charged to operating expenses.
Individual Material Intangible AssetsIncluded in the table above are the following individual material intangible assets:
2015Customer
relationships – Dearborn
$m
Customer relationships
– Titan$m
Cost:At 1 January and 31 December 14.7 190.2
Accumulated amortisation:At 1 January 6.2 62.6Charge for the year 1.9 19.0At 31 December 8.1 81.6
Net book amount 6.6 108.6Remaining amortisation period at 31 December – years 3.5 5.8
17. Investments
2015$m
2014$m
Non-current:Listed equity investments and mutual funds 9.1 8.9
Current:Bank deposits maturing after more than three months 4.6 3.8
18. Trade and Other Receivables
2015$m
2014$m
Non-current:Loan note 2.2 –Prepayments 1.6 3.1 Other receivables 0.2 0.2 4.0 3.3
Current:Trade receivables 119.1 255.6 Less: provision for impairment of receivables (2.7) (2.5)Net trade receivables 116.4 253.1 Prepayments 13.1 15.3 Accrued revenue 3.8 9.9 Loan note 0.7 –Other receivables 6.2 7.3 140.2 285.6
Payments on account to suppliers of $2.9m in 2014 have been reclassified from other receivables to prepayments.
Trade receivables that are not overdue and not impaired are expected to be fully recovered as there is no recent history of default or any indications that the customers will not meet their payment obligations. At the year end there are no trade receivables (2014 – none) whose terms have been renegotiated and would otherwise be past due or impaired.

NOTES TO THE CONSOLIDATED FINANCIAL STATEMENTS
CONTINUED
Hunting PLC2015 Annual Report and Accounts
102
18. Trade and Other Receivables continuedAt 31 December 2015, trade receivables of $56.5m (2014 – $112.0m) were overdue but not impaired. The ageing of these receivables at the year end is as follows:
2015$m
2014$m
Number of days overdue:1-30 days 26.6 54.3 31-60 days 11.5 24.8 61-90 days 6.9 23.1 91-120 days 5.5 6.9 more than 120 days 6.0 2.9 Receivables overdue not impaired 56.5 112.0 Receivables not overdue 59.8 141.1 Receivables not overdue and impaired 0.1 –Receivables overdue and impaired 2.7 2.5 Impairment (2.7) (2.5)Net trade receivables 116.4 253.1
Receivables that are overdue but not impaired relate to customers for whom there is no recent history of default.
Receivables that have been impaired mainly relate to debtors in financial difficulty where defaults in payments have occurred or concerns have been raised about the customer’s liquidity. Trade receivables are impaired when there is evidence that the Group will not be able to collect all amounts due according to the original terms of sale.
During the year, a provision of $0.7m (2014 – $1.3m) for the impairment of receivables was recognised, $nil (2014 – $0.7m) receivables were written off, $0.5m (2014 – $0.7m) unused provisions were released, and $nil (2014 – $1.3m) was classified as held for sale. The provision for the impairment of trade receivables at the year end was $2.7m (2014 – $2.5m).
The other classes of financial assets within trade and other receivables do not contain impaired assets.
Concentrations of credit risk with respect to trade receivables are limited due to the Group’s wide and unrelated customer base. The maximum exposure to credit risk is the fair value of each class of receivable. The carrying value of each class of receivable approximates their fair value as described in note 25.
The Group does not hold any collateral as security and no assets have been acquired through the exercise of any collateral previously held.
19. Deferred TaxDeferred income tax assets and liabilities are only offset when there is a legally enforceable right to offset and when the deferred income taxes relate to the same fiscal authority and there is an intention to settle the balance net. The offset amounts are as follows:
2015$m
2014$m
Deferred tax assets 2.0 1.2 Deferred tax liabilities (10.2) (37.1) (8.2) (35.9)
The movement in the net deferred tax liability is as follows:
2015$m
2014$m
At 1 January (35.9) (31.6)Exchange adjustments 0.7 0.6 Credit (charge) to the income statement* 28.9 (3.9)Change in tax rates (0.1) –Taken direct to equity (1.8) (0.8)Classified as held for sale – (0.2) At 31 December (8.2) (35.9)
* The credit to the income statement (2014 – charge) includes a charge of $1.1m relating to discontinued operations (2014 – $nil).
Deferred tax assets of $32.6m (2014 – $1.4m) have not been recognised as realisation of the tax benefit is not probable. This includes $3.8m in respect of tax losses (2014 – $1.4m). The tax losses do not have an expiry date.
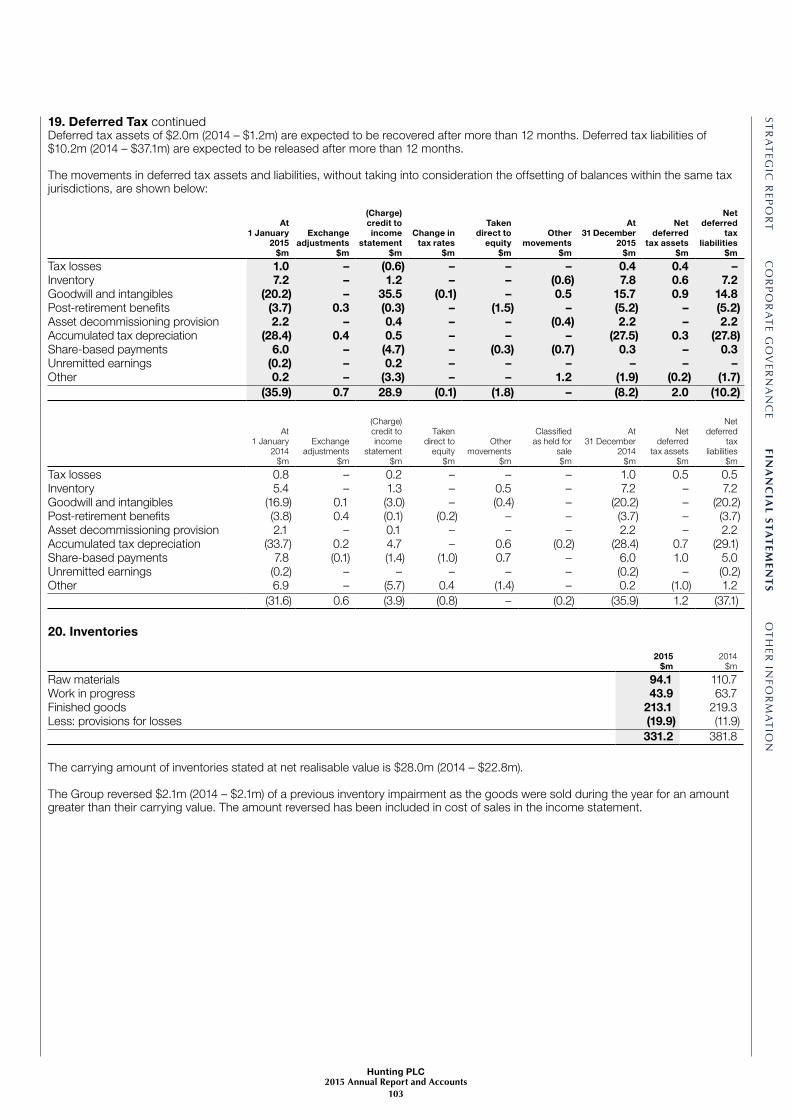
ST
RA
TEG
IC R
EPO
RT
CO
RP
OR
AT
E G
OV
ERN
AN
CE
FINA
NC
IAL
ST
AT
EM
EN
TS
OT
HER
INF
OR
MA
TIO
N
Hunting PLC2015 Annual Report and Accounts
103
19. Deferred Tax continuedDeferred tax assets of $2.0m (2014 – $1.2m) are expected to be recovered after more than 12 months. Deferred tax liabilities of $10.2m (2014 – $37.1m) are expected to be released after more than 12 months.
The movements in deferred tax assets and liabilities, without taking into consideration the offsetting of balances within the same tax jurisdictions, are shown below:
At 1 January
2015$m
Exchange adjustments
$m
(Charge) credit to income
statement$m
Change in tax rates
$m
Taken direct to
equity$m
Other movements
$m
At 31 December
2015$m
Net deferred
tax assets$m
Net deferred
tax liabilities
$m
Tax losses 1.0 – (0.6) – – – 0.4 0.4 –Inventory 7.2 – 1.2 – – (0.6) 7.8 0.6 7.2Goodwill and intangibles (20.2) – 35.5 (0.1) – 0.5 15.7 0.9 14.8Post-retirement benefits (3.7) 0.3 (0.3) – (1.5) – (5.2) – (5.2)Asset decommissioning provision 2.2 – 0.4 – – (0.4) 2.2 – 2.2Accumulated tax depreciation (28.4) 0.4 0.5 – – – (27.5) 0.3 (27.8)Share-based payments 6.0 – (4.7) – (0.3) (0.7) 0.3 – 0.3Unremitted earnings (0.2) – 0.2 – – – – – –Other 0.2 – (3.3) – – 1.2 (1.9) (0.2) (1.7) (35.9) 0.7 28.9 (0.1) (1.8) – (8.2) 2.0 (10.2)
At 1 January
2014$m
Exchange adjustments
$m
(Charge) credit to income
statement$m
Taken direct to
equity$m
Other movements
$m
Classified as held for
sale$m
At 31 December
2014$m
Net deferred
tax assets$m
Net deferred
tax liabilities
$m
Tax losses 0.8 – 0.2 – – – 1.0 0.5 0.5 Inventory 5.4 – 1.3 – 0.5 – 7.2 – 7.2 Goodwill and intangibles (16.9) 0.1 (3.0) – (0.4) – (20.2) – (20.2)Post-retirement benefits (3.8) 0.4 (0.1) (0.2) – – (3.7) – (3.7)Asset decommissioning provision 2.1 – 0.1 – – – 2.2 – 2.2 Accumulated tax depreciation (33.7) 0.2 4.7 – 0.6 (0.2) (28.4) 0.7 (29.1)Share-based payments 7.8 (0.1) (1.4) (1.0) 0.7 – 6.0 1.0 5.0 Unremitted earnings (0.2) – – – – – (0.2) – (0.2)Other 6.9 – (5.7) 0.4 (1.4) – 0.2 (1.0) 1.2 (31.6) 0.6 (3.9) (0.8) – (0.2) (35.9) 1.2 (37.1)
20. Inventories
2015$m
2014$m
Raw materials 94.1 110.7 Work in progress 43.9 63.7 Finished goods 213.1 219.3 Less: provisions for losses (19.9) (11.9) 331.2 381.8
The carrying amount of inventories stated at net realisable value is $28.0m (2014 – $22.8m).
The Group reversed $2.1m (2014 – $2.1m) of a previous inventory impairment as the goods were sold during the year for an amount greater than their carrying value. The amount reversed has been included in cost of sales in the income statement.

NOTES TO THE CONSOLIDATED FINANCIAL STATEMENTS
CONTINUED
Hunting PLC2015 Annual Report and Accounts
104
21. Trade and Other Payables
2015$m
2014$m
Non-current:Trade payables 0.4 –Accruals 1.7 1.5 Social security and other taxes 0.1 0.8 Other payables 9.1 8.9 11.3 11.2
Current:Trade payables 57.1 92.7 Social security and other taxes 7.3 12.5 Accruals 36.0 86.7 Other payables 3.8 5.8 104.2 197.7
22. Borrowings
2015$m
2014$m
Non-current:Unsecured bank loans 113.3 154.0 Other unsecured loans 3.9 3.9 117.2 157.9
Current:Bank overdrafts 32.5 50.5 Unsecured bank loans 19.8 14.9 52.3 65.4
Total borrowings 169.5 223.3
Analysis of Borrowings by CurrencyThe carrying amount of the Group’s borrowings is denominated in the following currencies:
Canadian dollars
$mSterling
$mUS dollars
$mEuro
$mOther
$mTotal
$m
Unsecured bank loans 29.8 24.9 75.6 2.3 0.5 133.1Other unsecured loans – – 3.9 – – 3.9Bank overdrafts – 13.1 19.4 – – 32.5At 31 December 2015 29.8 38.0 98.9 2.3 0.5 169.5
Canadian dollars
$mSterling
$mUS dollars
$mEuro
$mOther
$mTotal
$m
Unsecured bank loans 34.0 29.9 105.0 – – 168.9 Other unsecured loans – – 3.9 – – 3.9 Bank overdrafts – 24.0 26.5 – – 50.5 At 31 December 2014 34.0 53.9 135.4 – – 223.3
23. Provisions
Onerous contracts
$mOther
$mTotal
$m
At 1 January 2015 13.4 11.3 24.7Exchange adjustments (0.6) (0.2) (0.8)Charged to the income statement 0.9 1.0 1.9Adjustments to property, plant and equipment – (0.5) (0.5)Provisions utilised (6.1) (0.9) (7.0)Unutilised amounts reversed – (0.5) (0.5)Unwinding of discount 0.1 0.1 0.2At 31 December 2015 7.7 10.3 18.0
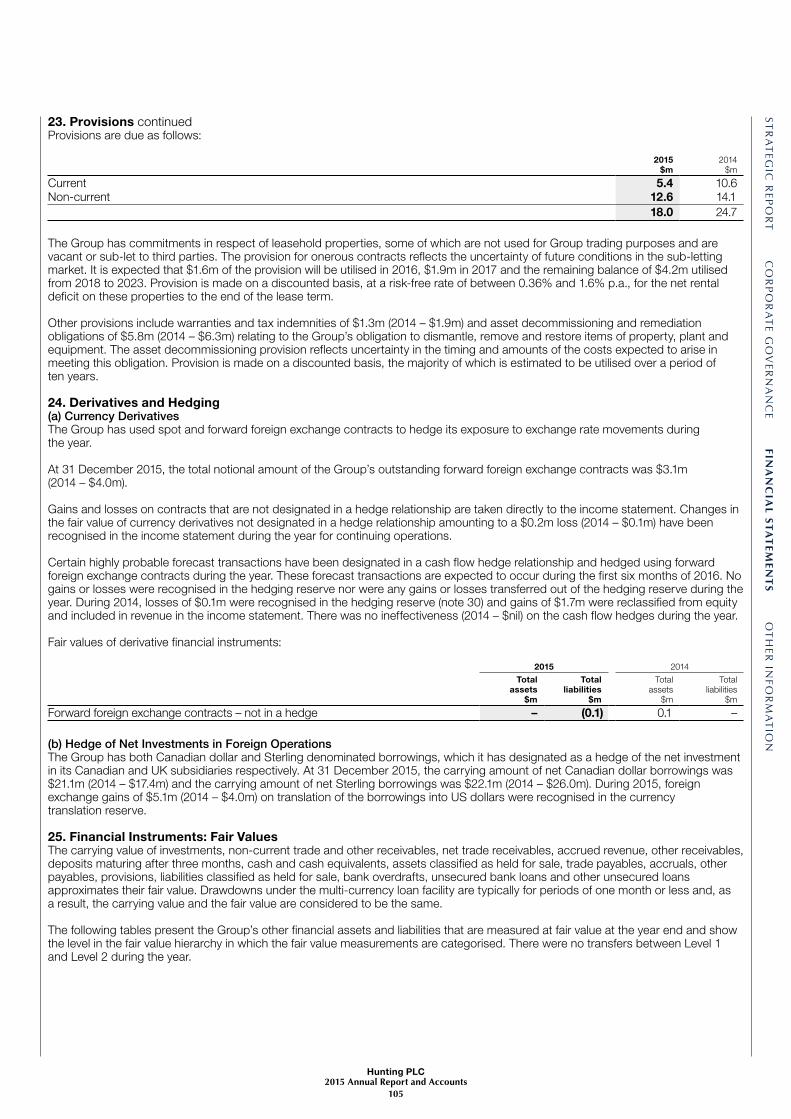
ST
RA
TEG
IC R
EPO
RT
CO
RP
OR
AT
E G
OV
ERN
AN
CE
FINA
NC
IAL
ST
AT
EM
EN
TS
OT
HER
INF
OR
MA
TIO
N
Hunting PLC2015 Annual Report and Accounts
105
23. Provisions continuedProvisions are due as follows:
2015$m
2014$m
Current 5.4 10.6 Non-current 12.6 14.1 18.0 24.7
The Group has commitments in respect of leasehold properties, some of which are not used for Group trading purposes and are vacant or sub-let to third parties. The provision for onerous contracts reflects the uncertainty of future conditions in the sub-letting market. It is expected that $1.6m of the provision will be utilised in 2016, $1.9m in 2017 and the remaining balance of $4.2m utilised from 2018 to 2023. Provision is made on a discounted basis, at a risk-free rate of between 0.36% and 1.6% p.a., for the net rental deficit on these properties to the end of the lease term.
Other provisions include warranties and tax indemnities of $1.3m (2014 – $1.9m) and asset decommissioning and remediation obligations of $5.8m (2014 – $6.3m) relating to the Group’s obligation to dismantle, remove and restore items of property, plant and equipment. The asset decommissioning provision reflects uncertainty in the timing and amounts of the costs expected to arise in meeting this obligation. Provision is made on a discounted basis, the majority of which is estimated to be utilised over a period of ten years.
24. Derivatives and Hedging(a) Currency DerivativesThe Group has used spot and forward foreign exchange contracts to hedge its exposure to exchange rate movements during the year.
At 31 December 2015, the total notional amount of the Group’s outstanding forward foreign exchange contracts was $3.1m (2014 – $4.0m).
Gains and losses on contracts that are not designated in a hedge relationship are taken directly to the income statement. Changes in the fair value of currency derivatives not designated in a hedge relationship amounting to a $0.2m loss (2014 – $0.1m) have been recognised in the income statement during the year for continuing operations.
Certain highly probable forecast transactions have been designated in a cash flow hedge relationship and hedged using forward foreign exchange contracts during the year. These forecast transactions are expected to occur during the first six months of 2016. No gains or losses were recognised in the hedging reserve nor were any gains or losses transferred out of the hedging reserve during the year. During 2014, losses of $0.1m were recognised in the hedging reserve (note 30) and gains of $1.7m were reclassified from equity and included in revenue in the income statement. There was no ineffectiveness (2014 – $nil) on the cash flow hedges during the year.
Fair values of derivative financial instruments:
2015 2014
Total assets
$m
Total liabilities
$m
Total assets
$m
Total liabilities
$m
Forward foreign exchange contracts – not in a hedge – (0.1) 0.1 –
(b) Hedge of Net Investments in Foreign OperationsThe Group has both Canadian dollar and Sterling denominated borrowings, which it has designated as a hedge of the net investment in its Canadian and UK subsidiaries respectively. At 31 December 2015, the carrying amount of net Canadian dollar borrowings was $21.1m (2014 – $17.4m) and the carrying amount of net Sterling borrowings was $22.1m (2014 – $26.0m). During 2015, foreign exchange gains of $5.1m (2014 – $4.0m) on translation of the borrowings into US dollars were recognised in the currency translation reserve.
25. Financial Instruments: Fair ValuesThe carrying value of investments, non-current trade and other receivables, net trade receivables, accrued revenue, other receivables, deposits maturing after three months, cash and cash equivalents, assets classified as held for sale, trade payables, accruals, other payables, provisions, liabilities classified as held for sale, bank overdrafts, unsecured bank loans and other unsecured loans approximates their fair value. Drawdowns under the multi-currency loan facility are typically for periods of one month or less and, as a result, the carrying value and the fair value are considered to be the same.
The following tables present the Group’s other financial assets and liabilities that are measured at fair value at the year end and show the level in the fair value hierarchy in which the fair value measurements are categorised. There were no transfers between Level 1 and Level 2 during the year.

NOTES TO THE CONSOLIDATED FINANCIAL STATEMENTS
CONTINUED
Hunting PLC2015 Annual Report and Accounts
106
25. Financial Instruments: Fair Values continued
Fair value at 31 December
2015$m
Level 1$m
Level 2$m
Non-current investmentsListed equity investments and mutual funds 9.1 9.1 –Derivatives held for tradingDerivative financial liabilities (0.1) – (0.1) 9.0 9.1 (0.1)
Fair value at 31 December
2014$m
Level 1$m
Level 2$m
Non-current investmentsListed equity investments and mutual funds 8.9 8.9 –Derivatives held for tradingDerivative financial assets 0.1 – 0.1 9.0 8.9 0.1
The fair value hierarchy has the following levels:Level 1 – inputs are quoted prices (unadjusted) in active markets for identical assets or liabilities.Level 2 – inputs other than quoted prices included within Level 1 that are observable for the asset or liability.
The fair value of forward foreign exchange contracts is determined by comparing the cash flows generated by the contract with the coterminous cash flows potentially available in the forward exchange market on the balance sheet date. The fair value of listed equities and mutual funds is based on their current bid prices in an active market, which is considered to be the most representative of fair value, at the balance sheet date. The fair values of non-US dollar denominated financial instruments are translated into US dollars using the year end exchange rate.
The inputs used to determine the fair value of derivative financial instruments are inputs other than quoted prices that are observable and so the fair value measurement can be categorised in Level 2 of the fair value hierarchy. The fair value of listed equity investments and mutual funds is based on quoted market prices and so the fair value measurement can be categorised in Level 1 of the fair value hierarchy.
26. Financial Risk ManagementThe Group’s activities expose it to certain financial risks, namely market risk (including currency risk, fair value interest risk and cas-ow interest risk), credit risk and liquidity risk. The Group’s risk management strategy seeks to mitigate potential adverse effects on its financial performance. As part of its strategy, both primary and derivative financial instruments are used to hedge certain risk exposures.
There are clearly defined objectives and principles for managing financial risk established by the Board of Directors, with policies, parameters and procedures covering the specific areas of funding, banking relationships, foreign currency and interest rate exposures and cash management.
The Group’s treasury function is responsible for implementing the policies and providing a centralised service to the Group for funding, foreign exchange and interest rate management and counterparty risk management. It is also responsible for identifying, evaluating and hedging financial risks in close co-operation with the Group’s operating companies.
(a) Foreign Exchange RiskThe Group’s international base is exposed to foreign exchange risk from its investing, financing and operating activities, particularly in respect of Sterling and Canadian dollars. Foreign exchange risks arise from future transactions and cash flows, and from recognised monetary assets and liabilities that are not denominated in the functional currency of the Group’s local operations.
The Group’s material foreign exchange rates are:
Sterling Canadian dollar
2015 2014 2015 2014
Average exchange rate to US dollars 0.65 0.61 1.28 1.10Year end exchange rate to US dollars 0.68 0.64 1.39 1.16
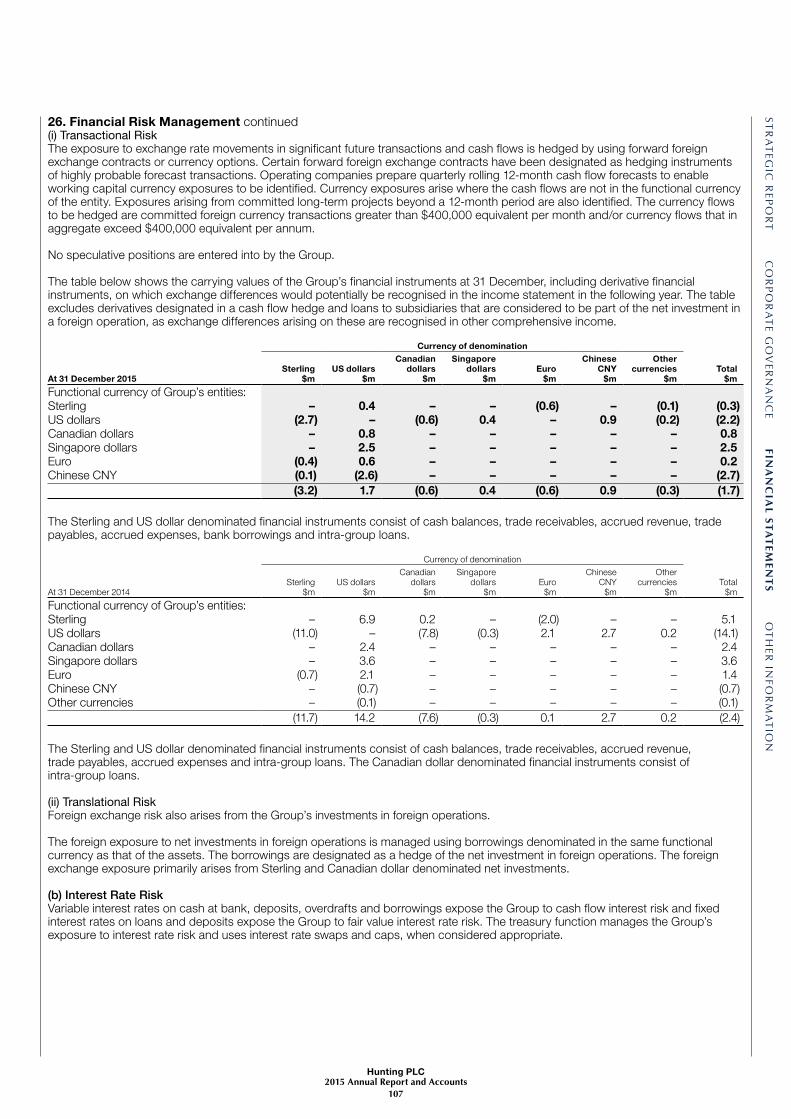
ST
RA
TEG
IC R
EPO
RT
CO
RP
OR
AT
E G
OV
ERN
AN
CE
FINA
NC
IAL
ST
AT
EM
EN
TS
OT
HER
INF
OR
MA
TIO
N
Hunting PLC2015 Annual Report and Accounts
107
26. Financial Risk Management continued(i) Transactional RiskThe exposure to exchange rate movements in significant future transactions and cash flows is hedged by using forward foreign exchange contracts or currency options. Certain forward foreign exchange contracts have been designated as hedging instruments of highly probable forecast transactions. Operating companies prepare quarterly rolling 12-month cash flow forecasts to enable working capital currency exposures to be identified. Currency exposures arise where the cash flows are not in the functional currency of the entity. Exposures arising from committed long-term projects beyond a 12-month period are also identified. The currency flows to be hedged are committed foreign currency transactions greater than $400,000 equivalent per month and/or currency flows that in aggregate exceed $400,000 equivalent per annum.
No speculative positions are entered into by the Group.
The table below shows the carrying values of the Group’s financial instruments at 31 December, including derivative financial instruments, on which exchange differences would potentially be recognised in the income statement in the following year. The table excludes derivatives designated in a cash flow hedge and loans to subsidiaries that are considered to be part of the net investment in a foreign operation, as exchange differences arising on these are recognised in other comprehensive income.
At 31 December 2015
Currency of denomination
Total$m
Sterling$m
US dollars$m
Canadian dollars
$m
Singapore dollars
$mEuro
$m
Chinese CNY
$m
Other currencies
$m
Functional currency of Group’s entities:Sterling – 0.4 – – (0.6) – (0.1) (0.3)US dollars (2.7) – (0.6) 0.4 – 0.9 (0.2) (2.2)Canadian dollars – 0.8 – – – – – 0.8Singapore dollars – 2.5 – – – – – 2.5Euro (0.4) 0.6 – – – – – 0.2Chinese CNY (0.1) (2.6) – – – – – (2.7) (3.2) 1.7 (0.6) 0.4 (0.6) 0.9 (0.3) (1.7)
The Sterling and US dollar denominated financial instruments consist of cash balances, trade receivables, accrued revenue, trade payables, accrued expenses, bank borrowings and intra-group loans.
At 31 December 2014
Currency of denomination
Total$m
Sterling$m
US dollars$m
Canadian dollars
$m
Singapore dollars
$mEuro
$m
Chinese CNY
$m
Other currencies
$m
Functional currency of Group’s entities:Sterling – 6.9 0.2 – (2.0) – – 5.1US dollars (11.0) – (7.8) (0.3) 2.1 2.7 0.2 (14.1)Canadian dollars – 2.4 – – – – – 2.4Singapore dollars – 3.6 – – – – – 3.6 Euro (0.7) 2.1 – – – – – 1.4 Chinese CNY – (0.7) – – – – – (0.7)Other currencies – (0.1) – – – – – (0.1) (11.7) 14.2 (7.6) (0.3) 0.1 2.7 0.2 (2.4)
The Sterling and US dollar denominated financial instruments consist of cash balances, trade receivables, accrued revenue, trade payables, accrued expenses and intra-group loans. The Canadian dollar denominated financial instruments consist of intra-group loans.
(ii) Translational RiskForeign exchange risk also arises from the Group’s investments in foreign operations.
The foreign exposure to net investments in foreign operations is managed using borrowings denominated in the same functional currency as that of the assets. The borrowings are designated as a hedge of the net investment in foreign operations. The foreign exchange exposure primarily arises from Sterling and Canadian dollar denominated net investments.
(b) Interest Rate RiskVariable interest rates on cash at bank, deposits, overdrafts and borrowings expose the Group to cash flow interest risk and fixed interest rates on loans and deposits expose the Group to fair value interest rate risk. The treasury function manages the Group’s exposure to interest rate risk and uses interest rate swaps and caps, when considered appropriate.

NOTES TO THE CONSOLIDATED FINANCIAL STATEMENTS
CONTINUED
Hunting PLC2015 Annual Report and Accounts
108
26. Financial Risk Management continued(c) Credit RiskThe Group’s credit risk arises from its pension assets, cash and cash equivalents, investments, derivative financial instruments, loan note and outstanding receivables.
At the year end, the Group had credit risk exposures to a wide range of counterparties. Credit risk exposure is continually monitored and no individual exposure is considered to be significant in the context of the ordinary course of the Group’s activities.
Exposure limits are set for each approved counterparty, as well as the types of transactions that may be entered into. Approved institutions that the treasury function can invest surplus cash with all must have a minimum of an A1, P1 or F1 short-term rating from Standard and Poor’s, Moody’s or Fitch rating agencies respectively and AAA rating for Money Market Funds.
At the year end, cash and cash equivalents totalled $54.4m (2014 – $88.5m) and current investments $4.6m (2014 – $3.8m). 90% of cash and cash equivalents were deposited with banks with Fitch short-term ratings of F1 to F1+. Of the remaining 10%, the vast majority was held on deposit with a mainland Chinese financial institution which, given the Group’s operations in this jurisdiction, were deemed necessary. Despite not having a formal credit rating, an internal vetting procedure determined that the bank’s credit profile was appropriate for this level of deposit.
The credit risk of foreign exchange contracts is calculated before the contract is acquired and compared to the credit risk limit set for each counterparty. Credit risk is calculated as a fixed percentage of the nominal value of the instrument.
Trade and other receivables are continuously monitored. Credit account limits are primarily based on the credit quality of the customer and past experience through trading relationships. To reduce credit risk exposure from outstanding receivables, the Group has taken out credit insurance with an external insurer, subject to certain conditions.
The Group operates a pension scheme in the UK, which includes a funded defined benefit section with pension plan net assets of $41.4m (2014 – $30.9m). The majority of the Scheme’s defined benefits are now covered by insurance company annuity policies, meaning the pensions-related risks have largely been eliminated. The pension buy-in has been effected by using a number of insurers, so as to spread its credit risk. The credit rating of these insurers is monitored.
The Group also operates a defined benefit pension scheme in the US, which is unfunded. Contributions are paid into a separate investment vehicle and invested in a wide portfolio of US mutual funds that are recognised as non-current investments. Investments at the year end amounted to $9.1m (2014 – $8.9m) and are expected to be fully recovered.
(d) Liquidity RiskThe Group needs to ensure that it has sufficient liquid funds available to support its working capital and capital expenditure requirements. All subsidiaries submit weekly and bi-monthly cash forecasts to the treasury function to enable them to monitor the Group’s requirements.
The Group has sufficient credit facilities to meet both its long and short-term requirements.
The Group’s credit facilities are provided by a variety of funding sources and total $414.6m (2014 – $649.8m) at the year end. The facilities comprise $350.0m (2014 – $584.7m) of committed facilities and $64.6m (2014 – $65.1m) of unsecured uncommitted facilities.
A new bank facility agreement was signed on 26 October 2015. The five-year, multi-currency revolving facility from a syndicate of five banks of $350.0m replaces the Sterling denominated £375.0m facility. This facility expires on 26 October 2020 and is unsecured. A commitment fee is payable on the undrawn amount.
The Group’s treasury function ensures flexibility in funding by maintaining availability under committed credit facilities. The Group had undrawn committed borrowing facilities available at the year end totalling $233.9m (2014 – $428.0m), which expire between two and five years.
The following tables analyse the Group’s non-derivative financial liabilities into relevant maturity groupings based on the remaining period at the balance sheet date to the contractual maturity date of the financial liabilities. The amounts are the contractual, undiscounted cash flows. The carrying amounts in the balance sheet are the discounted amounts. Balances due within one year have been included in the maturity analysis at their carrying amounts, as the impact of discounting is not significant.

ST
RA
TEG
IC R
EPO
RT
CO
RP
OR
AT
E G
OV
ERN
AN
CE
FINA
NC
IAL
ST
AT
EM
EN
TS
OT
HER
INF
OR
MA
TIO
N
Hunting PLC2015 Annual Report and Accounts
109
26. Financial Risk Management continued
2015On demand
or within one year
$m
Between two and
five years$m
After five years
$mTotal
$m
Non-derivative financial liabilities:Trade payables 57.1 0.4 – 57.5Accruals 36.0 0.6 1.1 37.7Other payables 2.3 – 9.1 11.4Onerous lease contracts 1.6 4.3 2.0 7.9Unsecured bank loans 22.0 124.4 – 146.4Other unsecured loans – – 3.9 3.9Bank overdrafts 32.5 – – 32.5Total 151.5 129.7 16.1 297.3
2014
On demand or within one year
$m
Between two and
five years$m
After five years
$mTotal
$m
Non-derivative financial liabilities:Trade payables 92.7 – – 92.7 Accruals 86.7 1.5 – 88.2 Other payables 3.1 – 8.9 12.0 Onerous lease contracts 6.2 4.4 3.0 13.6 Unsecured bank loans 19.6 159.6 – 179.2 Other unsecured loans – – 3.9 3.9 Bank overdrafts 50.5 – – 50.5 Total 258.8 165.5 15.8 440.1
The Group had no net settled financial liabilities at the year end (2014 – none).
The table below analyses the Group’s derivative financial instruments, which will be settled on a gross basis, into maturity groupings based on the period remaining from the balance sheet date to the contractual maturity date. The amounts disclosed in the table are the contractual, undiscounted cash flows.
On demand or within one year
2015$m
2014$m
Currency derivatives – held for trading– inflows 11.2 17.8 – outflows (11.3) (17.8)
(e) Capital Risk ManagementThe Group’s objectives, policies and processes for managing capital are outlined in the Strategic Report within the Financial Capital Management section on page 42. Within this section, the Group provides a definition of capital, provides details of the external financial covenants imposed, key measures for managing capital and the objectives for managing capital. Quantitative disclosures have been made together with the parameters for meeting external financial covenants.
27. Financial Instruments: Sensitivity AnalysisThe following sensitivity analysis is intended to illustrate the sensitivity to changes in market variables on the Group’s financial instruments and show the impact on profit or loss and shareholders’ equity. Financial instruments affected by market risk include cash and cash equivalents, borrowings, deposits and derivative financial instruments. The sensitivity analysis relates to the position as at 31 December 2015.
The analysis excludes the impact of movements in market variables on the carrying value of pension and other post-retirement obligations, provisions and on the non-financial assets and liabilities of foreign operations.
The following assumptions have been made in calculating the sensitivity analysis:
• Foreign exchange rate and interest rate sensitivities have an asymmetric impact on the Group’s results, that is, an increase in rates does not result in the same amount of movement as a decrease in rates.
• For floating rate assets and liabilities, the amount of asset or liability outstanding at the balance sheet date is assumed to be outstanding for the whole year.
• Fixed-rate financial instruments that are carried at amortised cost are not subject to interest rate risk for the purpose of this analysis. • The carrying values of financial assets and liabilities carried at amortised cost do not change as interest rates change.
Positive figures represent an increase in profit or equity.

NOTES TO THE CONSOLIDATED FINANCIAL STATEMENTS
CONTINUED
Hunting PLC2015 Annual Report and Accounts
110
27. Financial Instruments: Sensitivity Analysis continued(a) Interest Rate SensitivityThe sensitivity rate of 0.5% (2014 – 0.25%) for US interest rates represents management’s assessment of a reasonably possible change, based on historical volatility and a review of analysts’ research and banks’ expectations of future interest rates.
The post-tax impact on the income statement, with all other variables held constant, at 31 December, for an increase of 0.5% (2014 – 0.25%) in US interest rates, is to reduce profits by $0.3m (2014 – $0.2m). If US interest rates were to decrease by 0.5% (2014 – 0.25%), then the post-tax impact on the income statement would be to increase profits by $0.3m (2014 – $0.2m). The movements arise on US dollar denominated borrowings. There is no impact on other comprehensive income (“OCI”) for a change in interest rates.
(b) Foreign Exchange Rate SensitivityThe sensitivity rate of 10% (2014 – 10%) for Sterling and Canadian dollar exchange rates represents management’s assessment of a reasonably possible change, based on historical volatility and a review of analysts’ research and banks’ expectations of future foreign exchange rates.
The table below shows the post-tax impact for the year of a reasonably possible change in foreign exchange rates, with all other variables held constant, at 31 December.
2015 2014
Income statement
$mOCI$m
Income statement
$mOCI$m
Sterling exchange rate +10% (2014: +10%) (0.8) – (2.1) (0.2)Sterling exchange rate -10% (2014: -10%) 0.9 – 2.5 0.2Canadian dollar exchange rates +10% (2014: +10%) (0.1) – 0.3 (0.1)Canadian dollar exchange rates -10% (2014: -10%) 0.1 – (0.4) 0.1Singapore dollar exchange rates +10% (2014: +10%) 0.3 – (0.3) –Singapore dollar exchange rates -10% (2014: -10%) (0.4) – 0.3 –
The movements in the income statement mainly arise from cash, bank overdrafts, intra-group balances, trade receivables and payables and accrued expenses, where the functional currency of the entity is different from the currency that the monetary items are denominated in.
The movements in OCI arise from net Sterling and Canadian dollar borrowings designated in a hedge of net investments in foreign subsidiaries and from US and Canadian dollar denominated loans that have been recognised as part of the Group’s net investment in foreign subsidiaries.
28. Post-Employment Benefits(a) UK PensionsWithin the UK, the Group operates a funded pension scheme, which includes a defined benefit section with benefits linked to final salary and a defined contribution section with benefits dependent on future investment returns. The defined benefit section is closed to new UK employees who are offered membership of the defined contribution section. The majority of UK employees are members of one of these arrangements.
The UK scheme is registered with HMRC for tax purposes, is operated separately from the Group and managed by a Board of trustees. The trustees are responsible for the payment of benefits and the management of the scheme’s assets.
The UK scheme is subject to UK regulations, which require the Group and the trustees to agree a funding strategy and contributions schedule for the defined benefit section of the UK scheme. Contributions to the defined contribution section of the UK scheme and other Group defined contribution arrangements are payable in addition and are charged directly to profit and loss.
The Company has consulted with active members of the defined benefit section of the scheme over a proposal to close that section to future accrual of further benefits with effect from 30 June 2016. If closure is the final decision, then active members will be offered membership of the defined contribution section of the scheme from 1 July 2016. The effect of this change, if agreed, will be recognised in the Group’s 2016 financial statements.
Risk exposures and investment strategyThe weighted average duration to payment of the projected future cash flows from the defined benefit section of the UK scheme is about 17 years. The scheme is managed so that it is well funded and represents a low risk to the Group. In particular, the scheme’s assets are invested in a range of deferred annuity and immediate annuity policies with a number of insurers, which largely match the benefits to be paid to members of the scheme. This strategy significantly reduces the Group’s investment, inflation and demographic risks in relation to the scheme’s liabilities. This is demonstrated by the relative stability of the Group’s pension asset from year-to-year. The position would change materially if one of the insurers was no longer able to meet its obligations as the pension obligation ultimately rests with the Group.
The increase in the Group’s pension asset during 2015 principally reflects the gain arising from the trustees’ decision to surrender part of one of their insurance annuity policies and the impact of the sale of Gibson Shipbrokers.

ST
RA
TEG
IC R
EPO
RT
CO
RP
OR
AT
E G
OV
ERN
AN
CE
FINA
NC
IAL
ST
AT
EM
EN
TS
OT
HER
INF
OR
MA
TIO
N
Hunting PLC2015 Annual Report and Accounts
111
28. Post-Employment Benefits continuedFunding strategyThe trustees and the Group together agree a funding strategy for the scheme every three years. The trustees and the Group have agreed that the contributions ordinarily from the Group under this agreement in the next reporting period will be funded from the surplus in the scheme. As such, the Group expects to contribute approximately $nil to the defined benefit section of the UK scheme in the next reporting period.
The net assets for the UK post-employment benefit scheme are:
2015$m
2014$m
Present value of obligations (387.1) (438.3)Total fair value of plan assets 428.5 469.2 Net asset 41.4 30.9
Changes in the net asset recognised in the balance sheet
2015$m
2014$m
Opening balance sheet net asset 30.9 29.6Exchange adjustments (2.1) (1.8)Expense charged to the income statement – continuing operations (2.9) (4.3)Past service cost credited to the income statement – discontinued operations 5.5 –Amount recognised in other comprehensive income 10.6 2.1 Transfer to defined contribution scheme (1.8) –Employers contributions paid 1.2 5.3 Closing balance sheet net asset 41.4 30.9
The Group has concluded that it can recognise the full amount of this surplus on the grounds that it could gain sufficient economic benefit from a future reduction of its contributions to the scheme. Amendments to the current rules on recognising a surplus are currently being considered. The Group has concluded that the above accounting treatment will not be affected by the current proposed changes to these rules.
Movements in the present value of the defined benefit obligation for the defined benefit section of the UK scheme
2015$m
2014$m
Opening defined benefit obligation 438.3 428.2 Exchange adjustments (23.0) (27.2)Current service cost (employer) 4.0 5.8 Contributions by plan participants 0.3 0.5 Interest on benefit obligations 15.1 18.3 Remeasurements due to: Changes in financial assumptions (7.5) 31.6 Changes in demographic assumptions (4.5) – Experience on benefit obligations (11.3) (0.3)Past service cost (5.5) –Benefits and expenses paid (18.8) (18.6)Present value of the obligation at the end of the year 387.1 438.3
Movements in the fair value of the assets for the defined benefit section of the UK scheme
2015$m
2014$m
Opening fair value of plan assets 469.2 457.8 Exchange adjustments (25.1) (29.0)Interest on plan assets 16.2 19.8 Actual returns over interest on plan assets (12.7) 33.4 Transfer to defined contribution scheme (1.8) –Contributions by employer 1.2 5.3 Contributions by plan participants 0.3 0.5 Benefits and expenses paid (18.8) (18.6)Closing fair value of plan assets 428.5 469.2
The “Actual returns over interest on plan assets” shown in the table above principally includes the impact of both a gain arising from the surrender of some of the annuity policies and a loss following changes in financial assumptions on the value of the insurance annuity policies. The loss due to the changes in the assumptions broadly offsets the corresponding gain on the remeasurement of the defined benefit obligation, demonstrating that the pensions related risks have been mitigated by the scheme’s investment strategy.

NOTES TO THE CONSOLIDATED FINANCIAL STATEMENTS
CONTINUED
Hunting PLC2015 Annual Report and Accounts
112
28. Post-Employment Benefits continuedMajor asset categories for the defined benefit section of the UK scheme
2015$m
2014$m
Insurance annuity policies 395.3 459.8 Multi-asset fund 18.0 7.8 Bonds 10.6 –Cash/other 4.6 1.6 Fair value of plan assets 428.5 469.2
The scheme does not invest in property occupied by the Group or in financial securities issued by the Group.
Amounts recognised in the income statement in respect of the UK scheme
2015Continuing operations
$m
Discontinued operations
$mTotal
$m
Current service cost – operating expenses 3.5 0.5 4.0 Past service cost – gain on curtailment (note 12) – (5.5) (5.5)Total expense (credit) included within profit (loss) from operations 3.5 (5.0) (1.5)Net interest on the defined benefit asset – finance income (note 10) (1.1) – (1.1)Total expense (credit) included within staff costs (note 9) 2.4 (5.0) (2.6)
2014
Continuing operations
$m
Discontinued operations
$mTotal
$m
Current service cost – operating expenses 3.5 2.3 5.8 Net interest on the defined benefit asset – finance income (note 10) (1.5) – (1.5)Total expense included within staff costs (note 9) 2.0 2.3 4.3
The current service cost includes $1.2m (2014 – $1.5m) of administration costs.
In addition, employer contributions of $8.3m (2014 – $10.8m) for various Group defined contribution arrangements (including the defined contribution section of the UK scheme) are recognised in the income statement.
Special eventsThe following special events occurred during the year:
• The trustees surrendered some of the annuity policies during the year. The effect of this has been recognised through other comprehensive income.
• The sale of Gibson Shipbrokers was completed during the year. The effect of this has been recognised in the income statement within discontinued operations.
Both of these events have had the effect of increasing the value of the Group’s pension asset.
The principal assumptions used for accounting purposes reflect prevailing market conditions are:
2015 2014
Discount rate 3.8% p.a. 3.6% p.a.Future pension increase 3.3% p.a. 3.2% p.a.Future salary increase 5.3% p.a. 5.2% p.a.
Mortality assumption – life expectancy
2015Years
2014Years
Male aged 65 at the accounting date 25.0 24.9 Female aged 65 at the accounting date 27.7 27.1 Male aged 65 in 20 years 26.9 27.6 Female aged 65 in 20 years 29.1 29.5
The assumptions used to determine the end-of-year benefit obligations are also used to calculate the following year’s cost.

ST
RA
TEG
IC R
EPO
RT
CO
RP
OR
AT
E G
OV
ERN
AN
CE
FINA
NC
IAL
ST
AT
EM
EN
TS
OT
HER
INF
OR
MA
TIO
N
Hunting PLC2015 Annual Report and Accounts
113
28. Post-Employment Benefits continuedSensitivity analysisApart from the assumption for salary increases, the change in the obligation arising as a result of changes in the above assumptions is broadly matched by a corresponding change in the value of the insurance policies, so that the impact on the net balance sheet asset is significantly dampened.
A 0.25% p.a. increase in the salary increase assumption would increase the defined benefit obligation by about $1.0m (2014 – $2.7m) without having any impact on the value of the scheme’s assets. The net balance sheet is also now more sensitive to changes in the market value of the invested assets following the surrender of part of the insured annuity policies. A 5% fall in the value of those assets would reduce the net balance sheet by $1.1m (2014 – $0.3m).
(b) Other PensionsThe Group also operates a cash balance arrangement in the US for certain executives. Members build up benefits in this arrangement by way of notional contributions and notional investment returns. Actual contributions are paid into an entirely separate investment vehicle held by the Company, which is used to pay benefits due from the cash balance arrangement when the member retires.
Under IAS 19, the cash balance arrangement is accounted for as an unfunded defined benefit scheme.
The amounts recognised in the income statement during the year were $0.2m (2014 – $0.2m) for the employer’s current service cost (recognised in operating expenses) and $0.3m (2014 – $0.3m) interest cost (recognised in finance expense).
Movements in the present value of the obligation for the defined US deferred compensation plan
2015$m
2014$m
Present value of the obligation at the start of the year 8.9 8.0 Current service cost (equal to the notional contributions) 0.2 0.2 Interest on benefit obligations 0.3 0.3 Remeasurement – excess of notional investment returns over interest cost (0.3) 0.4 Present value of the obligation at the end of the year 9.1 8.9
29. Share Capital and Share Premium
2015Ordinary shares of 25p eachNumber
Ordinary shares of 25p each
$m
Share premium
$m
At 1 January 148,468,677 61.6 151.9 Shares issued – share option schemes and awards 372,831 0.1 1.1At 31 December 148,841,508 61.7 153.0
2014
Ordinary shares of 25p eachNumber
Ordinary shares of 25p each
$m
Share premium
$m
At 1 January 147,742,760 61.3 150.6 Shares issued – share option schemes and awards 725,917 0.3 1.3 At 31 December 148,468,677 61.6 151.9
There are no restrictions attached to any of the Ordinary shares in issue and all Ordinary shares carry equal voting rights. The rights attached to the Company’s Ordinary shares are summarised on page 140. All of the Ordinary shares in issue are fully paid.
At 31 December 2015, 914,225 (2014 – 980,996) Ordinary shares were held by an Employee Benefit Trust. Details of the carrying amount are set out in note 31.

NOTES TO THE CONSOLIDATED FINANCIAL STATEMENTS
CONTINUED
Hunting PLC2015 Annual Report and Accounts
114
30. Other Components of Equity
Year ended 31 December 2015
Other reserves
$m
Currency translation
reserve$m
Total$m
At 1 January 15.1 15.6 30.7Exchange adjustments – (15.1) (15.1)Release of foreign exchange losses net of tax – 0.6 0.6Share options and awards– value of employee services 6.2 – 6.2– discharge (6.7) – (6.7)At 31 December 14.6 1.1 15.7
Year ended 31 December 2014
Other reserves
$m
Cash flow hedge
reserve$m
Currency translation
reserve$m
Total$m
At 1 January 12.7 1.4 27.5 41.6 Exchange adjustments net of tax – – (15.7) (15.7)Release of foreign exchange losses net of tax – – 3.8 3.8 Fair value gains and losses:– gain transferred to income statement on redemption of available for sale investment (0.2) – – (0.2)– losses originating on cash flow hedges arising during the year net of tax – (0.1) – (0.1)– gains transferred to income statement on disposal of cash flow hedges net of tax – (1.3) – (1.3)Share options and awards– value of employee services 7.2 – – 7.2 – discharge (4.6) – – (4.6)At 31 December 15.1 – 15.6 30.7
31. Retained Earnings
2015$m
2014$m
At 1 January 1,163.9 1,130.4 (Loss) profit for the year (226.6) 69.2 Remeasurement of defined benefit pension schemes net of tax 9.2 1.5 Dividends paid (39.8) (44.1)Treasury shares– purchase of Treasury shares (1.4) (7.5)Share options and awards– discharge 6.5 11.3 – taxation (0.3) 3.1 At 31 December 911.5 1,163.9
The share options and awards taxation charge taken directly to equity of $0.3m (2014 – $3.1m credit) comprises a current tax credit of $nil (2014 – $4.1m) and a deferred tax charge of $0.3m (2014 – $1.0m).
Retained earnings include the following amounts in respect of the carrying amount of Treasury shares:
2015$m
2014$m
Cost:At 1 January (14.8) (13.8)Purchase of Treasury shares (1.4) (7.5)Disposal of Treasury shares 4.4 6.5 At 31 December (11.8) (14.8)
The loss on disposal of Treasury shares during the year, which is recognised in retained earnings, was $4.4m (2014 – $6.5m).

ST
RA
TEG
IC R
EPO
RT
CO
RP
OR
AT
E G
OV
ERN
AN
CE
FINA
NC
IAL
ST
AT
EM
EN
TS
OT
HER
INF
OR
MA
TIO
N
Hunting PLC2015 Annual Report and Accounts
115
32. Dividends Paid
2015 2014
Cents per share $m
Cents per share $m
Ordinary dividends:2015 interim paid 4.0 5.9 – –2014 final paid 22.9 33.9 – –2014 interim paid – – 8.1 12.0 2013 final paid – – 21.8 32.1 26.9 39.8 29.9 44.1
A final dividend of 4.0 cents per share has been proposed by the Board, amounting to an estimated distribution of $5.9m. The dividend will be paid in Sterling on 6 July 2016, to shareholders on the register on 10 June 2016, and the Sterling value of the dividend payable per share will be fixed and announced approximately two weeks prior to the payment date based on the average spot exchange rate over the three business days preceding the announcement date. The proposed final dividend is subject to approval by the shareholders at the Annual General Meeting to be held on 13 April 2016 and has not been provided for in these financial statements.
33. Share-Based Payments(a) 2001 Executive Share Option PlanThe Company operated an executive share option plan between 2001 and 2008 which granted options to eligible employees. Under this scheme, the final granting of options occurred on 4 March 2008 and the final vesting of options occurred on 4 March 2011. There is no longer a charge to the income statement attributable to this scheme. Following successful vesting of the options, the employee, subject to continued employment, has seven years in which to exercise the option. Details of movements in the outstanding share options are set out below.
(i) Share Option Movements During the Year
2015 2014
Numberof options
Weighted average exercise
pricep
Numberof options
Weighted average exercise
pricep
Outstanding at the beginning of the year 1,094,313 454 1,658,147 354Exercised during the year (372,831) 221 (563,834) 160Lapsed during the year (20,782) – – –Outstanding and exercisable at the year end 700,700 571 1,094,313 454
Options were granted with an exercise price equal to the average closing mid-market price of the Company’s share price for the three trading days prior to the date of grant.
The weighted average share price at the date of exercise during 2015 was 491.1p (2014 – 873.5p).
(ii) Share Options Outstanding at the Year End
2015Number
of options
2014Number
of options
Exerciseprice range
p Exercise period
Executive Share Options 2005 – vested – 372,831 220.7 09.03.08 – 08.03.15Executive Share Options 2006 – vested 298,471 298,471 383.0 08.03.09 – 07.03.16Executive Share Options 2007 – vested 205,440 216,534 640.0 06.03.10 – 05.03.17Executive Share Options 2008 – vested 196,789 206,477 784.5 04.03.11 – 03.03.18 700,700 1,094,313
(b) 2009 Performance Share Plan (“PSP”)(i) Performance Based Awards and OptionsThe Company granted performance-based share awards and options under the PSP between 2009 and 2013. Under the PSP annual conditional awards of shares and options were made to executive Directors and senior employees. Awards and options are subject to performance conditions during the vesting period. The PSP was replaced by the 2014 Hunting Performance Share Plan (“Hunting PSP”) following shareholder approval of the Hunting PSP at the Annual General Meeting (“AGM”) of the Company on 16 April 2014. The final grant under the PSP occurred in 2013 and will vest in 2016, subject to performance conditions and continued service. Awards and options were granted at nil cost under the PSP.
The performance-based awards and options will vest subject to a median or above total shareholder return (“TSR”) performance over a three-year period from the date of grant, relative to comparator companies from the DJ US Oil Equipment and Services sector index and the DJ STOXX TM Oil Equipment and Services sector index.
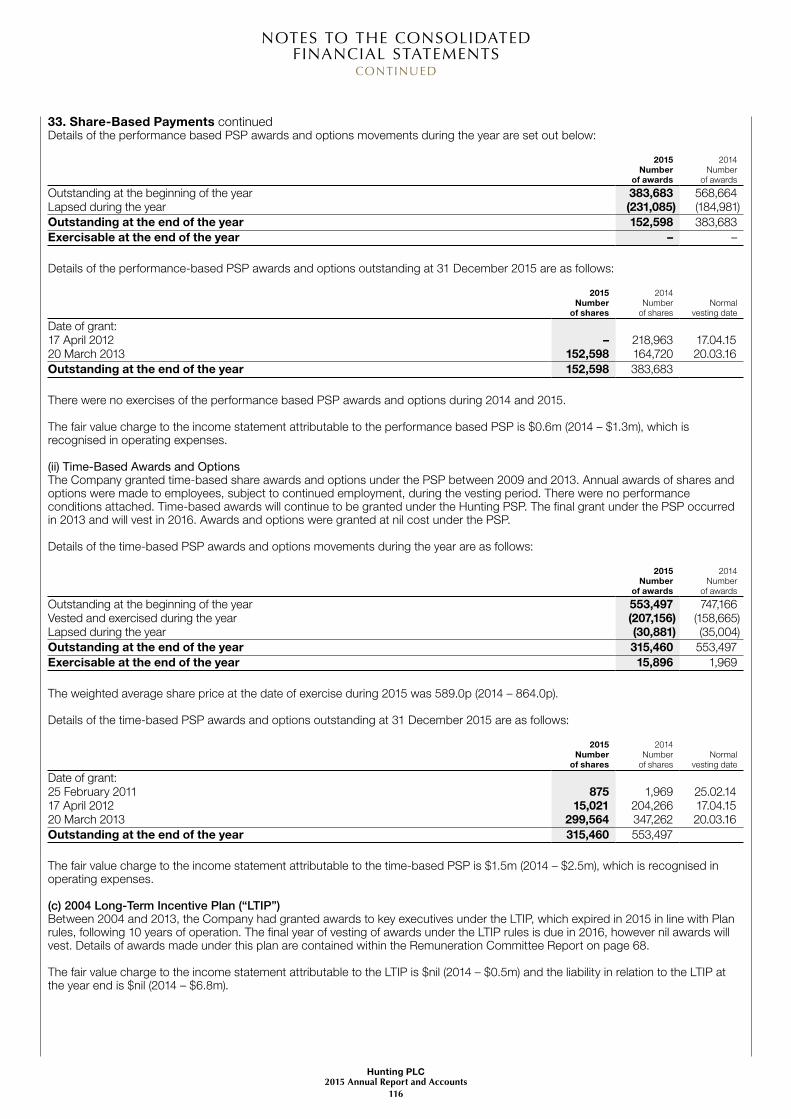
NOTES TO THE CONSOLIDATED FINANCIAL STATEMENTS
CONTINUED
Hunting PLC2015 Annual Report and Accounts
116
33. Share-Based Payments continuedDetails of the performance based PSP awards and options movements during the year are set out below:
2015Number
of awards
2014Number
of awards
Outstanding at the beginning of the year 383,683 568,664 Lapsed during the year (231,085) (184,981)Outstanding at the end of the year 152,598 383,683 Exercisable at the end of the year – –
Details of the performance-based PSP awards and options outstanding at 31 December 2015 are as follows:
2015Number
of shares
2014Number
of sharesNormal
vesting date
Date of grant:17 April 2012 – 218,963 17.04.1520 March 2013 152,598 164,720 20.03.16Outstanding at the end of the year 152,598 383,683
There were no exercises of the performance based PSP awards and options during 2014 and 2015.
The fair value charge to the income statement attributable to the performance based PSP is $0.6m (2014 – $1.3m), which is recognised in operating expenses.
(ii) Time-Based Awards and OptionsThe Company granted time-based share awards and options under the PSP between 2009 and 2013. Annual awards of shares and options were made to employees, subject to continued employment, during the vesting period. There were no performance conditions attached. Time-based awards will continue to be granted under the Hunting PSP. The final grant under the PSP occurred in 2013 and will vest in 2016. Awards and options were granted at nil cost under the PSP.
Details of the time-based PSP awards and options movements during the year are as follows:
2015Number
of awards
2014Number
of awards
Outstanding at the beginning of the year 553,497 747,166 Vested and exercised during the year (207,156) (158,665)Lapsed during the year (30,881) (35,004)Outstanding at the end of the year 315,460 553,497 Exercisable at the end of the year 15,896 1,969
The weighted average share price at the date of exercise during 2015 was 589.0p (2014 – 864.0p).
Details of the time-based PSP awards and options outstanding at 31 December 2015 are as follows:
2015Number
of shares
2014Number
of sharesNormal
vesting date
Date of grant:25 February 2011 875 1,969 25.02.1417 April 2012 15,021 204,266 17.04.1520 March 2013 299,564 347,262 20.03.16Outstanding at the end of the year 315,460 553,497
The fair value charge to the income statement attributable to the time-based PSP is $1.5m (2014 – $2.5m), which is recognised in operating expenses.
(c) 2004 Long-Term Incentive Plan (“LTIP”)Between 2004 and 2013, the Company had granted awards to key executives under the LTIP, which expired in 2015 in line with Plan rules, following 10 years of operation. The final year of vesting of awards under the LTIP rules is due in 2016, however nil awards will vest. Details of awards made under this plan are contained within the Remuneration Committee Report on page 68.
The fair value charge to the income statement attributable to the LTIP is $nil (2014 – $0.5m) and the liability in relation to the LTIP at the year end is $nil (2014 – $6.8m).

ST
RA
TEG
IC R
EPO
RT
CO
RP
OR
AT
E G
OV
ERN
AN
CE
FINA
NC
IAL
ST
AT
EM
EN
TS
OT
HER
INF
OR
MA
TIO
N
Hunting PLC2015 Annual Report and Accounts
117
33. Share-Based Payments continued(d) 2014 Hunting Performance Share Plan (“Hunting PSP”)(i) Performance-Based AwardsThe Company now grants performance-based share awards annually to executive Directors and senior employees under the Hunting PSP, which has replaced both the LTIP, which expired in 2015, and the PSP, which is no longer used. Awards are granted at nil cost under the Hunting PSP.
The performance-based Hunting PSP awards to the executive Directors are divided equally into three tranches. Each tranche is subject to a three-year vesting period, and is also subject to performance conditions. The three conditions are Company performance over a three-year period against (i) the TSR of a bespoke peer group, (ii) underlying diluted earnings per share (“EPS”) growth, and (iii) average underlying Return on Capital Employed (“ROCE”). The performance period for 2015 awards granted under the Hunting PSP is 1 January 2015 to 31 December 2017.
Details of the performance-based Hunting PSP awards movements during the year are set out below:
2015Number
of shares
2014Number
of shares
Outstanding at the beginning of the year 692,750 –Granted during the year 1,107,587 707,376 Lapsed during the year (108,807) (14,626)Outstanding at the end of the year 1,691,530 692,750
Details of the performance based Hunting PSP awards outstanding at 31 December 2015 are as follows:
2015Number
of shares
2014Number
of sharesNormal
vesting date
Date of grant:1 May 2014 644,772 692,750 01.05.1728 April 2015 1,046,758 – 28.04.18Outstanding at the end of the year 1,691,530 692,750
(ii) Time-Based AwardsThe Company also grants time-based share awards annually under the Hunting PSP. Annual awards of shares may be made to employees subject to continued employment during the vesting period. There are no performance conditions attached. Awards are granted at nil cost under the Hunting PSP.
Details of time based Hunting PSP awards movements during the year are set out below:
2015Number
of shares
2014Number
of shares
Outstanding at the beginning of the year 654,842 –Granted during the year 1,040,708 681,850 Vested and exercised during the year (16,250) (429)Lapsed during the year (182,369) (26,579)Outstanding at the year end 1,496,931 654,842
The weighted average share price at the date of exercise during 2015 was 426.4p (2014 – 649.0p).
Details of the time-based Hunting PSP awards outstanding at 31 December 2015 are as follows:
2015Number
of shares
2014Number
of sharesNormal
vesting date
Date of grant:1 May 2014 557,959 654,842 01.05.1728 April 2015 938,972 – 28.04.18Outstanding at the end of the year 1,496,931 654,842

NOTES TO THE CONSOLIDATED FINANCIAL STATEMENTS
CONTINUED
Hunting PLC2015 Annual Report and Accounts
118
33. Share-Based Payments continued(iii) Fair Value of Hunting PSP AwardsThe fair value of awards granted under the Hunting PSP is calculated using two separate models:
(1) The fair value of awards subject to a market-related performance condition, specifically Company performance against the TSR of a bespoke peer group, has been calculated using the Stochastic pricing model (also known as the “Monte Carlo” model).
The assumptions used in this model were as follows:
2015 2014
Date of grant/valuation date 28 April 2015 1 May 2014Weighted average share price at grant 590.5p 839.5pExercise price nil nilExpected dividend yield nil nilExpected volatility 36.5% 32.3%Risk-free rate 0.73% 1.08%Expected life 3 years 3 yearsFair value 300.5p 463.9p
(2) The fair value of performance-based awards not subject to a market-related performance condition, specifically Company performance against EPS and ROCE targets, and the time-based Hunting PSP awards has been calculated using the Black-Scholes pricing model.
The assumptions used in this model were as follows:
2015 2014
Date of grant/valuation date 28 April 2015 1 May 2014Weighted average share price at grant 590.5p 839.5pExercise price nil nilExpected dividend yield nil nilExpected volatility 36.5% 32.3%Risk-free rate 0.73% 1.08%Expected life 3 years 3 yearsFair value 590.5p 839.5p
The methods to calculate the assumptions for both models are:
• The expected volatility was calculated using historic weekly volatility, equal in length to the remaining portion of the performance period at the date of grant.
• The expected life of the award has been calculated commensurate with the vesting period. The risk-free rate is based on the UK gilt rate commensurate with the vesting period prevailing at the date of grant.
• Participants are entitled to a dividend equivalent over the number of shares that make up their award. It is accumulated over the vesting period and released subject to the achievement of the performance conditions. This is factored into the fair value calculation and as a result the dividend yield assumption is set to zero.
• The initial accounting charge of the performance-based Hunting PSP awards granted under the Hunting PSP incorporates an estimate of the number of shares that are expected to lapse for those participants who cease employment during the vesting period. The estimate of the expected forfeiture rate is 2.5% per annum. The subsequent accounting charge for 2015 includes an adjustment to the initial accounting charge to allow for actual lapses rather than estimated lapses.
The amount recognised in the income statement attributable to the performance-based Hunting PSP awards is a credit of $0.2m (2014 – $1.4m charge) and the charge to the income statement in respect of time-based Hunting PSP awards is $4.3m (2014 – $2.0m). These are recognised in operating expenses.
34. Operating Leases(a) The Group as LesseeOperating lease payments from continuing operations mainly represent rentals payable by the Group for properties:
2015 2014
Property$m
Others$m
Total$m
Property$m
Others$m
Total$m
Operating lease payments in the income statement:Lease and rental payments 13.1 1.1 14.2 13.7 2.5 16.2
The Group has provisions of $7.7m (2014 – $13.4m) for onerous contracts in respect of some leasehold properties, some of which are not used for Group trading purposes and are either vacant or sub-let to third parties (note 23).

ST
RA
TEG
IC R
EPO
RT
CO
RP
OR
AT
E G
OV
ERN
AN
CE
FINA
NC
IAL
ST
AT
EM
EN
TS
OT
HER
INF
OR
MA
TIO
N
Hunting PLC2015 Annual Report and Accounts
119
34. Operating Leases continuedTotal future aggregate minimum lease payments under non-cancellable operating leases expiring:
2015 2014
Property$m
Others$m
Total$m
Property$m
Others$m
Total$m
Within one year 14.6 0.5 15.1 13.1 0.8 13.9 Between two and five years 38.1 0.8 38.9 32.6 1.1 33.7 After five years 37.8 – 37.8 27.2 – 27.2 Total lease payments 90.5 1.3 91.8 72.9 1.9 74.8
(b) The Group as LessorProperty rental earned during the year was $0.7m (2014 – $1.2m). A number of the Group’s leasehold properties are sub-let under existing lease agreements.
Total future minimum sublease income receivable under non-cancellable operating leases expiring:
2015Property
$m
2014Property
$m
Within one year 0.7 0.6 Between two and five years 2.8 2.8 After five years 1.3 2.1 Total lease income receivable 4.8 5.5
35. Related-Party TransactionsThe following related-party transactions took place between wholly owned subsidiaries of the Group and associates during the year:
2015$m
2014$m
Transactions: Sales of goods and services – 0.1 Purchase of goods and services (0.1) (0.1) Royalties receivable 0.3 0.2 Dividends received from associates 0.1 4.5 Movement on loans to and from associates: Loans to associates (0.2) – Loans to associates repaid – 0.6 Year end balances: Receivables from associates 0.4 0.1 Payables from associates (0.1) (0.1)
The outstanding balances at the year end are unsecured and have no fixed date for repayment. No expense has been recognised in the year for bad or doubtful debts in respect of amounts owed by associates.
All ownership interests in associates are in the equity shares of those companies. The ownership interests in subsidiaries and associates are set out in note C17 to the Company financial statements.
The key management of the Company comprises the executive and non-executive Directors only. The details of the Directors’ compensation are disclosed in note 9. The Directors of the Company had no material transactions other than as a result of their service agreements.

NOTES TO THE CONSOLIDATED FINANCIAL STATEMENTS
CONTINUED
Hunting PLC2015 Annual Report and Accounts
120
36. Business DisposalsOn 31 March 2015, the Group sold E.A. Gibson Shipbrokers Limited and its subsidiaries (together referred to as “Gibson Shipbrokers”) to an employee-owned trust. The selling price was $3.7m, with $3.0m deferred in the form of an interest-bearing loan note and the remainder paid in cash. A curtailment gain on the Group’s pension obligations of $5.5m was also recognised upon the sale.
Details of the net assets disposed and consideration are set out below:
$m
Property, plant and equipment 0.5 Goodwill 1.8 Investments 0.7 Deferred tax assets 0.1 Trade and other receivables 10.4 Cash and cash equivalents* 3.9 Trade and other payables (13.2)Current tax liabilities (0.5)Net assets disposed 3.7 Gain on curtailment of pension obligations (5.5)Release of foreign exchange adjustments 0.6 Gain on disposal (note 12) 4.9 Consideration 3.7
The consideration comprised the following:Net cash proceeds 0.7 Deferred consideration 3.0 3.7
* Cash and cash equivalents of $3.8m were classified as held for sale at 31 December 2014.
As part of the consideration, the Group subscribed to a loan note, which is carried as a receivable at amortised cost. The note is repayable by 31 March 2019 and is unsecured.
37. Principal Accounting PoliciesThe Group’s principal accounting policies are described below:
(a) Consolidation • The Group accounts include the results of the Company and its subsidiaries, together with its share of associates. • Subsidiaries are consolidated from the date on which control is transferred to the Group and are de-consolidated from the date
control ceases. • The Group uses the acquisition method of accounting for business combinations. Consequently, the consideration is determined
as the fair value of the net assets transferred to the vendor and includes an estimate of any contingent consideration. The net assets acquired are also measured at their respective fair values for initial recognition purposes on the acquisition date.
• Acquisition-related costs are expensed to the income statement as incurred.
(b) Discontinued Operations • A discontinued operation is a component of the Group that has either been disposed of or that is classified as held for sale, which
represents a separate major line of business or geographical area of operations and is part of a single coordinated plan to dispose of a separate major line of business or geographical area of operations.
• The results of discontinued operations are presented separately in the income statement and are shown net of tax. • The assets and liabilities of discontinued operations, that have not been disposed of prior to the balance sheet date, are presented
separately in the balance sheet as assets and liabilities classified as held for sale.
(c) Revenue • Revenue is measured as the fair value of the consideration received or receivable for the provision of goods, services and rental
supplies in the ordinary course of business, taking into account trade discounts and volume rebates, and is stated net of sales taxes.
• Revenue from the sale of goods is recognised when the significant risks and rewards of ownership have been transferred to the customer, which is normally on delivery of the products. Products include manufactured goods and OCTG supplies, including tubulars acquired by Hunting as plain-end pipe on which lathing work has been applied and which is resold as threaded pipe.
• Revenue from the sale of services is recognised when the services are rendered. The Group’s service activities principally comprise lathing work to apply a thread on to customer-owned plain-end pipe.
• Revenue from the rental of plant and equipment is recognised as the income is earned.

ST
RA
TEG
IC R
EPO
RT
CO
RP
OR
AT
E G
OV
ERN
AN
CE
FINA
NC
IAL
ST
AT
EM
EN
TS
OT
HER
INF
OR
MA
TIO
N
Hunting PLC2015 Annual Report and Accounts
121
37. Principal Accounting Policies continued(d) Amortisation and Exceptional ItemsExceptional items are items of income or expense which the Directors believe should be separately disclosed by virtue of their significant size or nature to enable a better understanding of the Group’s financial performance. The Group discloses such items in the “middle column” of the income statement. In applying this policy, the following items have been treated as exceptional:
• Impairment charges of goodwill, other intangible assets and of property, plant and equipment have been recognised to reflect the protracted decline in the oil and gas sector, a prolonged period of customer de-stocking and increased competition.
• Impairments of property, plant and equipment specifically held by the Exploration and Production division. As the valuations are subject to the frequent changes in long-term oil and gas prices, such impairments can lead to volatility in the income statement that is unrelated to the underlying performance of the business.
• Dry hole costs in respect of unsuccessful exploration for commercially viable oil and gas reserves. • Costs of restructuring the Group’s operations, including the cost of redundancies, in response to the decline in the oil and gas
sector. • Foreign exchange losses relating to cumulative exchange differences previously recognised in the currency translation reserve
which have been transferred to the income statement in relation to central non-operating companies which have entered into voluntary liquidation.
• The release of excess property provisions no longer required following the termination of a lease agreement. • The tax effect of any transaction considered to be exceptional is also treated as exceptional.
Amortisation expenses for acquired intangible assets are also shown in the “middle column” due to the significance of these amounts and to clearly identify the effect on profits, which will arise as current balances become fully written-off, or as new acquisitions give rise to new expenses.
(e) Interest • Interest income and expense is recognised in the income statement using the effective interest method.
(f) Foreign Currencies(i) Individual Subsidiaries’ and Associates’ Accounts • The financial statements for each of the Group’s subsidiaries and associates are prepared using their functional currency. • The functional currency is the currency of the primary economic environment in which the entity operates. • Transactions denoted in currencies other than the functional currency are translated into the functional currency at the exchange
rate ruling at the date of the transaction. • Monetary assets and liabilities, except borrowings designated as a hedging instrument in a net investment hedge, denoted in non-
functional currencies are retranslated at the exchange rate ruling at the balance sheet date and exchange differences are taken to the income statement.
• Borrowings designated as a hedging instrument in a net investment hedge are retranslated at the exchange rate ruling at the balance sheet date and exchange differences are taken direct to equity.
(ii) Group Consolidated Accounts • The presentation currency of the Group is US dollars. • The net assets of non-US dollar denominated subsidiaries and associates are translated into US dollars at the exchange rates
ruling at the balance sheet date. • The income statements of subsidiaries and associates are translated into US dollars at the average rates of exchange for the year. • Exchange differences are recognised directly in equity in the currency translation reserve (“CTR”), together with exchange
differences arising on foreign currency loans used to finance foreign currency net investments. • Upon adoption of IFRS on 1 January 2004, accumulated exchange differences arising on consolidation prior to 31 December
2003 were reset to zero and the CTR recommenced under IFRS on 1 January 2004. • The balance on the CTR represents the exchange differences arising on the retranslation of non-US dollar amounts into US dollars
since 1 January 2004. • On the disposal of a business, the cumulative exchange differences previously recognised in the CTR relating to that business are
transferred to the income statement as part of the gain or loss on disposal.
(g) Taxation • The taxation recognised in the income statement comprises current tax and deferred tax arising on the current year’s result before
tax and adjustments to tax arising on prior years’ results. • Current tax is the expected tax payable or receivable arising in the current year on the current year’s result before tax, using tax
rates enacted or substantively enacted at the balance sheet date, plus adjustments to tax in respect of prior years’ results. • Deferred tax is the tax that is expected to arise when the assets and liabilities recognised in the associated balance sheet are
realised, using tax rates enacted or substantively enacted at the balance sheet date that are expected to apply when the asset is realised or the liability is settled.
• Full provision is made for deferred taxation, using the liability method, on all taxable temporary differences. Deferred tax assets and liabilities are recognised separately on the balance sheet and are reported as non-current assets and liabilities.
• Deferred tax assets are recognised only to the extent that they are expected to be recoverable. Deferred taxation on unremitted overseas earnings is provided for to the extent a tax charge is foreseeable.
• When items of income and expense are recognised in other comprehensive income, the current and deferred tax relating to those items is also recognised in other comprehensive income.
• Tax arising on the discharge of share options and awards is recognised directly in equity.

NOTES TO THE CONSOLIDATED FINANCIAL STATEMENTS
CONTINUED
Hunting PLC2015 Annual Report and Accounts
122
37. Principal Accounting Policies continued(h) Segmental Reporting • Financial information on operating segments that corresponds with information regularly reviewed by the Chief Operating Decision
Maker is disclosed in the accounts. • Operating segments are components of the Group that are engaged in providing related products. • Geographical information is based on the location of where the sale originated and where the non-current assets are located.
(i) Property, Plant and Equipment(i) General • Property, plant and equipment is stated at cost less accumulated depreciation and any impairment in value. Cost includes
expenditure that is directly attributable to the acquisition and installation of the asset. • Land, pre-production oil and gas exploration costs and assets under construction are not depreciated. • With the exception of drilling tools, which are depreciated using the units of production method, and oil and gas exploration and
production equipment (see (i)(ii) below), assets are depreciated using the straight-line method at the following rates:
Freehold buildings – 2% to 10% Leasehold buildings – life of lease Plant, machinery and motor vehicles – 6% to 331/3%
• The assets’ residual values and useful lives are reviewed, and adjusted if appropriate, at the end of each reporting period.
(ii) Exploration Expenditure • Oil and gas exploration and appraisal costs are initially capitalised pending determination of the existence of commercial reserves
and are included in the asset category oil and gas exploration and development. • Upon determination that commercially viable quantities of hydrocarbons are not found, the costs are charged immediately to the
income statement. • Depreciation of oil and gas expenditure commences when production commences. The costs are depreciated using the unit of
production method.
(j) Goodwill • Goodwill arises when the fair value of the consideration paid for a business exceeds the fair value of the Group’s share of the net
assets acquired. • Goodwill is recognised as an asset and is carried at cost less accumulated impairment losses. • Goodwill is allocated to cash-generating units for the purpose of impairment testing. The allocation is made to the cash-generating
units or groups of cash-generating units that are expected to benefit from the business combination in which the goodwill arose. • On the disposal of a business, goodwill relating to that business that remains on the balance sheet at the date of disposal is
included in the determination of the profit or loss on disposal.
(k) Other Intangible Assets • Other intangible assets are stated at cost less accumulated amortisation and impairment losses where applicable. • These assets have a finite life and are amortised in accordance with the pattern of expected future economic benefits, or when this
cannot be reliably estimated, by using the straight-line method. • Intangible assets are amortised over the following periods:
Customer relationships – eight to ten years Patents – eight to ten years Unpatented technology – eight to ten years Trademarks and domain names – one to five years (l) Impairments • The Group performs goodwill impairment reviews at least annually. • The Group also assesses at least annually whether there have been any events or changes in circumstances that indicate that
property, plant and equipment and intangible assets other than goodwill may be impaired. An impairment review is carried out whenever the assessment indicates that the carrying amount may not be fully recoverable.
• For the purposes of impairment testing, assets are grouped at the lowest levels for which there are separately identifiable cash flows. • Where impairment exists, the asset is written down to the higher of (a) its fair value minus costs to sell; and (b) its value in use.
Impairments are recognised immediately in the income statement. • An impairment to goodwill is never reversed. When applicable, an impairment of any other asset is reversed, but only to the extent
that the consequent carrying value does not exceed what would have been the carrying value had the impairment not originally been made.
(m) Inventories • Inventories are stated at the lower of cost and net realisable value. • Cost is determined using the first-in-first-out method and net realisable value is the estimated selling price less costs of disposal in
the ordinary course of business. The cost of inventories includes direct costs plus production overheads.

ST
RA
TEG
IC R
EPO
RT
CO
RP
OR
AT
E G
OV
ERN
AN
CE
FINA
NC
IAL
ST
AT
EM
EN
TS
OT
HER
INF
OR
MA
TIO
N
Hunting PLC2015 Annual Report and Accounts
123
37. Principal Accounting Policies continued(n) Cash and Cash Equivalents • Cash and cash equivalents comprise cash at bank and in hand and short-term deposits with a maturity of less than three months
from the date of deposit that are readily convertible to a known amount of cash. • For cash flow statement purposes, cash and cash equivalents include bank overdrafts and short-term deposits with a maturity
of less than three months from the date of deposit. In the balance sheet, bank overdrafts are shown within borrowings in current liabilities.
(o) Loans and Receivables • Loans and receivables are initially recognised at fair value at the trade date which is normally the consideration paid plus
transaction costs. • Loans and receivables are carried at amortised cost using the effective interest method. If collection is expected in one year or less
they are classified as current assets, otherwise they are presented as non-current assets. • The Group assesses at each balance sheet date whether a loan or receivable is impaired and, if necessary, the carrying amount is
reduced to the appropriate value. The loss is recognised immediately in the income statement. • Loans and receivables cease to be recognised when the right to receive cash flows has expired or the Group has transferred
substantially all the risks and rewards of ownership.
(p) Financial Liabilities • Financial liabilities are initially recognised at fair value at the trade date which is normally the consideration received less, in the
case of financial liabilities that are not measured at fair value through profit or loss, transaction costs. The Group subsequently remeasures all of its non-derivative financial liabilities, including trade payables, at amortised cost.
• Payables are classified as current liabilities if payment is due within one year, otherwise they are presented as non-current liabilities.
(q) Provisions • Provisions are liabilities for which the amount or timing of future expenditure is uncertain. • Provisions are recognised when the Group has a present obligation as a result of a past event and it is probable that an outflow of
resources will be required to settle the obligation. • Whenever the time value of money is material, provisions are discounted to their present value.
(r) Post-Employment Benefits(i) Defined Contribution Retirement Schemes • Payments to defined contribution retirement schemes are charged to the income statement when they fall due.
(ii) Defined Benefit Retirement Schemes • Payments to defined benefit retirement schemes are recognised as increments to the assets of the schemes. • The amount charged to the income statement with respect to these schemes, within profit from operations, is the increase in
the retirement benefit obligation resulting from the additional service provided by the participating employees during the current year, which for the funded scheme is measured using the Projected Unit method and for the unfunded scheme is equal to the contributions paid.
• Net interest arising on the net assets of the schemes is also recognised in the income statement within net finance costs. • Curtailment gains and losses are recognised fully and immediately in the income statement. • Remeasurement gains and losses are recognised fully and immediately in the statement of comprehensive income. • The assets of the funded scheme, which are invested in insurance policies, have been valued using the same methodology and
assumptions used to calculate the defined benefit obligation so that, where the assets match the liabilities, the value of the assets is equal to the value of the corresponding obligation.
(s) Share-Based Payments • Between 2004 and 2013, the Group issued three-year performance LTIP awards that were share-based payments, as they could
be settled in either cash or equity, to certain employees as consideration for services received from the employees. The LTIP consequently expired in 2015. A liability is recognised equal to the current fair value of the services received, determined at each balance sheet date. The fair value of the liability is remeasured at each subsequent reporting date and at the date of settlement, with any changes in fair value recognised in the income statement.
• The Group also issues equity-settled, share-based payments (Hunting PSP awards) to certain employees as consideration for services received from the employees. The fair value of the employees’ services is recognised as an expense in the income statement on a straight-line basis over the vesting period based on the Group’s estimate of awards that will ultimately vest. The obligation to settle these awards is recognised within other components of equity.
(t) Share Capital • The Company’s share capital comprises a single class of Ordinary shares, which are classified as equity. • Incremental costs directly attributable to the issue of new shares are charged to equity as a deduction from the proceeds, net
of tax.
(u) Dividends • Dividends to the Group’s shareholders are recognised as liabilities in the Group’s financial statements in the period in which the
dividends are approved by shareholders. Interim dividends are recognised when paid. All dividends are dealt with in the statement of changes in equity.

COMPANY BALANCE SHEET
AT 31 DECEMBER 2015
Hunting PLC2015 Annual Report and Accounts
124
Notes2015
$m2014
$m
ASSETSNon-current assetsInvestments in subsidiaries C4 436.8 436.8 Other receivables C5 171.3 171.3 608.1 608.1
Current assetsOther receivables C5 0.3 6.6 Current tax asset – 2.2 Cash and cash equivalents 0.1 16.0 0.4 24.8
LIABILITIESCurrent liabilitiesOther payables C6 3.3 1.3 Borrowings 15.1 6.5 Provisions 0.3 0.3 18.7 8.1 Net current (liabilities) assets (18.3) 16.7
Non-current liabilitiesDeferred tax liabilities – 0.2 Provisions 0.4 0.5 0.4 0.7 Net assets 589.4 624.1
Equity attributable to owners of the parentShare capital C11 61.7 61.6 Share premium C11 153.0 151.9 Other components of equity C12 (4.6) (4.1)Retained earnings C13 379.3 414.7 Total equity 589.4 624.1
The notes on pages 127 to 132 are an integral part of these consolidated financial statements. The financial statements on pages 124 to 126 were approved by the Board of Directors on 3 March 2016 and were signed on its behalf by:
D E N N I S P R O C T O R P E T E R R O S E DIRECTOR DIRECTOR Registered number: 974568

ST
RA
TEG
IC R
EPO
RT
CO
RP
OR
AT
E G
OV
ERN
AN
CE
FINA
NC
IAL
ST
AT
EM
EN
TS
OT
HER
INF
OR
MA
TIO
N
COMPANY STATEMENT OF CHANGES IN EQUITY
Hunting PLC2015 Annual Report and Accounts
125
Notes
Year ended 31 December 2015
Share capital
$m
Share premium
$m
Other components
of equity$m
Retained earnings
$mTotal
$m
At 1 January 61.6 151.9 (4.1) 414.7 624.1
Loss for the year – – – (0.7) (0.7)Total comprehensive expense – – – (0.7) (0.7)
Dividends C14 – – – (39.8) (39.8)Shares issued– share option schemes and awards 0.1 1.1 – – 1.2Treasury shares– purchase of Treasury shares – – – (1.4) (1.4)Share options and awards– value of employee services C12 – – 6.2 – 6.2– discharge – – (6.7) 6.5 (0.2)Total transactions with owners 0.1 1.1 (0.5) (34.7) (34.0)
At 31 December 61.7 153.0 (4.6) 379.3 589.4
Notes
Year ended 31 December 2014
Share capital
$m
Share premium
$m
Other components
of equity$m
Retained earnings
$mTotal
$m
At 1 January 61.3 150.6 (6.5) 259.1 464.5
Profit for the year – – – 195.9 195.9 Other comprehensive expense – – (0.2) – (0.2)Total comprehensive (expense) income – – (0.2) 195.9 195.7
Dividends C14 – – – (44.1) (44.1)Shares issued– share option schemes and awards 0.3 1.3 – – 1.6 Treasury shares– purchase of Treasury shares – – – (7.5) (7.5)Share options– value of employee services C12 – – 7.2 – 7.2 – discharge – – (4.6) 11.3 6.7 Total transactions with owners 0.3 1.3 2.6 (40.3) (36.1)
At 31 December 61.6 151.9 (4.1) 414.7 624.1

COMPANY STATEMENT OF CASH FLOWS
FOR THE YEAR ENDED 31 DECEMBER 2015
Hunting PLC2015 Annual Report and Accounts
126
Notes2015
$m2014
$m
Operating activities(Loss) profit from operations (3.0) 50.1 Gain on disposal of subsidiaries – (36.3)Decrease in receivables 6.3 21.2 Increase (decrease) in payables 1.9 (11.6)(Decrease) increase in provisions (0.1) 0.3 Other non-cash flow items 6.1 7.5 Taxation received 1.7 0.9 Net cash inflow from operating activities 12.9 32.1 Investing activitiesInterest received 2.8 1.9 Dividends received from subsidiaries – 144.6 Net proceeds from disposal of subsidiaries – 103.1 Net cash inflow from investing activities 2.8 249.6 Financing activitiesInterest and bank fees paid (0.3) (2.9)Equity dividends paid C14 (39.8) (44.1)Share capital issued 1.2 1.6 Purchase of Treasury shares (1.4) (7.5)Loan issued – (171.2)Loan issued repaid – 15.5 Repayment of borrowings – (92.2)Net cash outflow from financing activities (40.3) (300.8)
Net cash outflow in cash and cash equivalents (24.6) (19.1)Cash and cash equivalents at the beginning of the year 9.5 28.1 Effect of foreign exchange rates 0.1 0.5 Cash and cash equivalents at the end of the year (15.0) 9.5
Cash and cash equivalents at the end of the year comprise:Cash at bank and in hand 0.1 16.0 Bank overdrafts included in borrowings (15.1) (6.5) (15.0) 9.5

ST
RA
TEG
IC R
EPO
RT
CO
RP
OR
AT
E G
OV
ERN
AN
CE
FINA
NC
IAL
ST
AT
EM
EN
TS
OT
HER
INF
OR
MA
TIO
N
NOTES TO THE COMPANY FINANCIAL STATEMENTS
CONTINUED
Hunting PLC2015 Annual Report and Accounts
127
C1. Basis of PreparationThe financial statements have been prepared in accordance with the Companies Act 2006 and those International Financial Reporting Standards (“IFRS”) and IFRS Interpretations Committee (“IFRS IC”) Interpretations as adopted by the European Union. The financial statements have been prepared on a going concern basis under the historical cost convention as modified by the revaluation of those financial assets and financial liabilities held at fair value through profit or loss. The Board’s consideration of going concern is detailed further in the Strategic Report on page 30.
The Company’s principal accounting policies applied in the preparation of these financial statements are the same as those set out in note 37 of the Group’s financial statements, except as noted below. These policies have been consistently applied to all the years presented.
Investments in subsidiaries are stated at cost, which is the fair value of the consideration paid, less provision for impairment.
From the perspective of the Company, the principal risks and uncertainties are integrated with the principal risks of the Hunting PLC Group and are not managed separately. The principal risks and uncertainties of the Hunting PLC Group, which include those of the Company, are discussed on pages 26 to 29 and further detail on financial risks is provided within note C7.
In accordance with the exemption allowed by Section 408 of the Companies Act 2006, the Company has not presented its own income statement and statement of comprehensive income. A loss of $0.7m (2014 – $195.9m profit) has been accounted for in the financial statements of the Company.
C2. EmployeesThe Company had no employees during the current or prior year.
C3. Auditor’s RemunerationServices provided by the Company’s auditor, PricewaterhouseCoopers LLP, and its associates comprised:
2015$m
2014$m
Fees payable to the Company’s auditors and its associates for:
The audit of these accounts 0.5 0.5
Taxation compliance services 0.1 0.1 Taxation advisory services – 0.1 Total services relating to taxation 0.1 0.2
Total fees 0.6 0.7
C4. Investments in Subsidiaries
2015$m
2014$m
Cost:At 1 January 436.8 509.9 Disposals – (73.1)At 31 December 436.8 436.8
Impairment:At 1 January – 9.3 Disposals – (9.3)At 31 December – –
Net book amount 436.8 436.8
The Company’s subsidiaries are detailed in note C17. Investments in subsidiaries are recorded at cost, which is the fair value of the consideration paid, less impairment. The Directors believe that the carrying value of the investments is supported by their underlying net assets.

NOTES TO THE COMPANY FINANCIAL STATEMENTS
CONTINUED
Hunting PLC2015 Annual Report and Accounts
128
C5. Other Receivables
2015$m
2014$m
Non-current:Receivables from subsidiaries 171.2 171.2 Prepayments 0.1 0.1 171.3 171.3
Current:Receivables from subsidiaries 0.1 6.3 Prepayments 0.1 0.2 Other receivables 0.1 0.1 0.3 6.6
None of the Company’s other receivables (2014 – none) were past due at the year end and the Company does not consider it necessary to provide for any impairments. The Company’s maximum exposure to credit risk is the fair value of each class of receivable. The carrying value of receivables approximates their fair value.
The Company does not hold any collateral as security and no assets have been acquired through the exercise of any collateral previously held. Non-current receivables due from subsidiaries are unsecured and interest is charged based on a margin over bank lending rates. Current receivables due from subsidiaries are unsecured, interest free and repayable on demand.
C6. Other Payables
2015$m
2014$m
Current:Payables to subsidiaries 2.2 0.3Accruals 0.8 0.8Other payables 0.3 0.2 3.3 1.3
C7. Financial Instruments: Fair ValuesThe carrying value of receivables, cash and cash equivalents, accruals, other payables, provisions, borrowings and bank overdrafts approximates their fair value.
C8. Financial Risk ManagementThe Company’s activities expose it to certain financial risks, namely market risk (including currency risk, cash flow interest risk and fair value interest risk), credit risk and liquidity risk. From the perspective of the Company, these financial risks are integrated with the financial risks of the Hunting PLC Group and are not managed separately.
(a) Foreign Exchange RiskThe Company is mainly exposed to foreign exchange risk from its financing and operating activities in respect of Sterling. Foreign exchange risks arise from future transactions and cash flows and from recognised monetary assets and liabilities that are not denominated in US dollars. The Company has Sterling denominated financial assets and financial liabilities.
The carrying amount of the Company’s financial assets included in receivables from subsidiaries at 31 December, on which exchange differences would be recognised in the income statement in the following year, is $nil (2014 – $0.9m) for Sterling, $nil (2014 – $0.1m) for Euro and $nil (2014 – $0.4m) for Canadian dollar denominated financial assets. The Company’s cash and cash equivalents of $nil (2014 – $13.8m) are denominated in US dollars and $0.1m (2014 – $2.2m) are denominated in Sterling.
The carrying amount of the Company’s financial liabilities included in payables to subsidiaries, other payables and provisions at 31 December, on which exchange differences would be recognised in the income statement in the following year, is $2.1m (2014 – $1.9m) for Sterling denominated financial liabilities and $0.1m (2014 – $nil) for Canadian dollar denominated financial liabilities.
The Company’s borrowings comprise $15.1m (2014 – $6.5m) of bank overdrafts at the year end, of which $14.8m (2014 – $nil) are denominated in US dollars and $0.3m (2014 – $6.5m) are denominated in Sterling.
(b) Interest Rate RiskThe Company is exposed to cash flow interest rate risk from its cash and cash equivalents, bank overdrafts and from amounts owed by and to subsidiaries, which are at variable interest rates.
(c) Credit RiskThe Company’s credit risk arises from its outstanding receivables and cash and cash equivalents. The Company is exposed to credit risk to the extent of non-receipt of its financial assets; however, it has no significant concentrations of credit risk other than from related parties. Credit risk is continually monitored and no individual exposure is considered to be significant in the ordinary course of the Company’s activities.
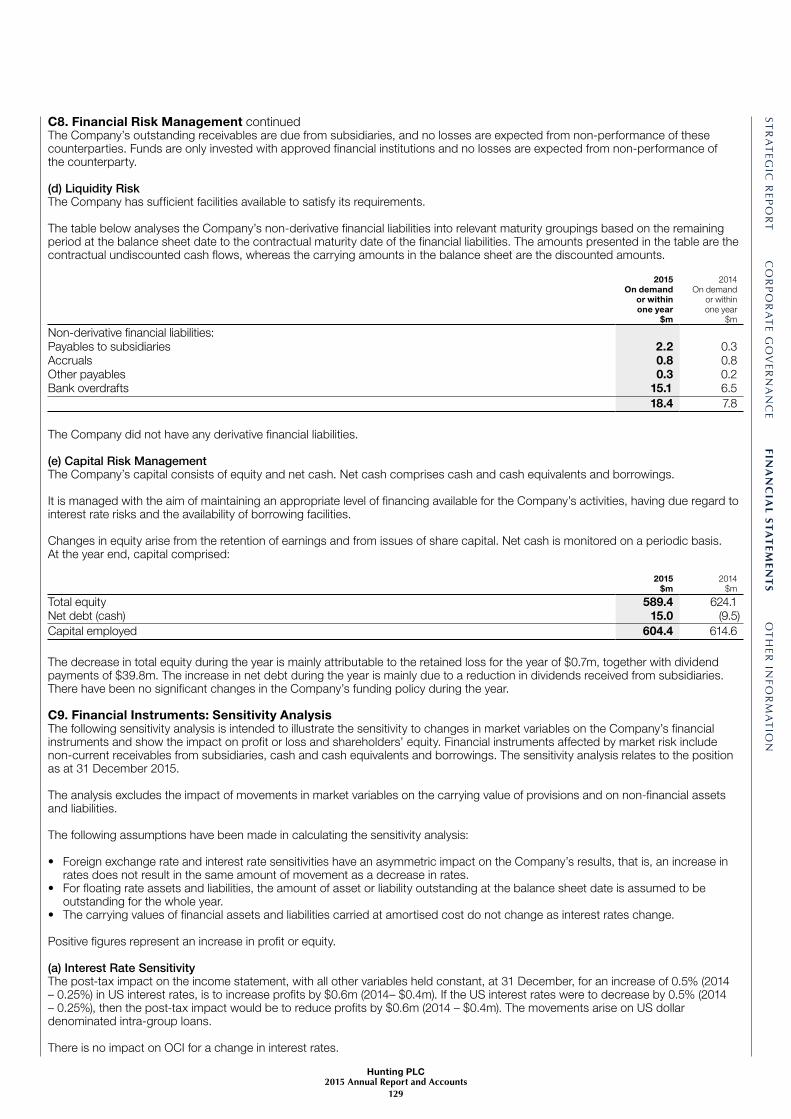
ST
RA
TEG
IC R
EPO
RT
CO
RP
OR
AT
E G
OV
ERN
AN
CE
FINA
NC
IAL
ST
AT
EM
EN
TS
OT
HER
INF
OR
MA
TIO
N
Hunting PLC2015 Annual Report and Accounts
129
C8. Financial Risk Management continuedThe Company’s outstanding receivables are due from subsidiaries, and no losses are expected from non-performance of these counterparties. Funds are only invested with approved financial institutions and no losses are expected from non-performance of the counterparty.
(d) Liquidity RiskThe Company has sufficient facilities available to satisfy its requirements.
The table below analyses the Company’s non-derivative financial liabilities into relevant maturity groupings based on the remaining period at the balance sheet date to the contractual maturity date of the financial liabilities. The amounts presented in the table are the contractual undiscounted cash flows, whereas the carrying amounts in the balance sheet are the discounted amounts.
2015On demand
or within one year
$m
2014On demand
or within one year
$m
Non-derivative financial liabilities:Payables to subsidiaries 2.2 0.3 Accruals 0.8 0.8 Other payables 0.3 0.2 Bank overdrafts 15.1 6.5 18.4 7.8
The Company did not have any derivative financial liabilities.
(e) Capital Risk ManagementThe Company’s capital consists of equity and net cash. Net cash comprises cash and cash equivalents and borrowings.
It is managed with the aim of maintaining an appropriate level of financing available for the Company’s activities, having due regard to interest rate risks and the availability of borrowing facilities. Changes in equity arise from the retention of earnings and from issues of share capital. Net cash is monitored on a periodic basis. At the year end, capital comprised:
2015$m
2014$m
Total equity 589.4 624.1Net debt (cash) 15.0 (9.5) Capital employed 604.4 614.6
The decrease in total equity during the year is mainly attributable to the retained loss for the year of $0.7m, together with dividend payments of $39.8m. The increase in net debt during the year is mainly due to a reduction in dividends received from subsidiaries. There have been no significant changes in the Company’s funding policy during the year.
C9. Financial Instruments: Sensitivity AnalysisThe following sensitivity analysis is intended to illustrate the sensitivity to changes in market variables on the Company’s financial instruments and show the impact on profit or loss and shareholders’ equity. Financial instruments affected by market risk include non-current receivables from subsidiaries, cash and cash equivalents and borrowings. The sensitivity analysis relates to the position as at 31 December 2015.
The analysis excludes the impact of movements in market variables on the carrying value of provisions and on non-financial assets and liabilities.
The following assumptions have been made in calculating the sensitivity analysis:
• Foreign exchange rate and interest rate sensitivities have an asymmetric impact on the Company’s results, that is, an increase in rates does not result in the same amount of movement as a decrease in rates.
• For floating rate assets and liabilities, the amount of asset or liability outstanding at the balance sheet date is assumed to be outstanding for the whole year.
• The carrying values of financial assets and liabilities carried at amortised cost do not change as interest rates change.
Positive figures represent an increase in profit or equity.
(a) Interest Rate SensitivityThe post-tax impact on the income statement, with all other variables held constant, at 31 December, for an increase of 0.5% (2014 – 0.25%) in US interest rates, is to increase profits by $0.6m (2014– $0.4m). If the US interest rates were to decrease by 0.5% (2014 – 0.25%), then the post-tax impact would be to reduce profits by $0.6m (2014 – $0.4m). The movements arise on US dollar denominated intra-group loans.
There is no impact on OCI for a change in interest rates.
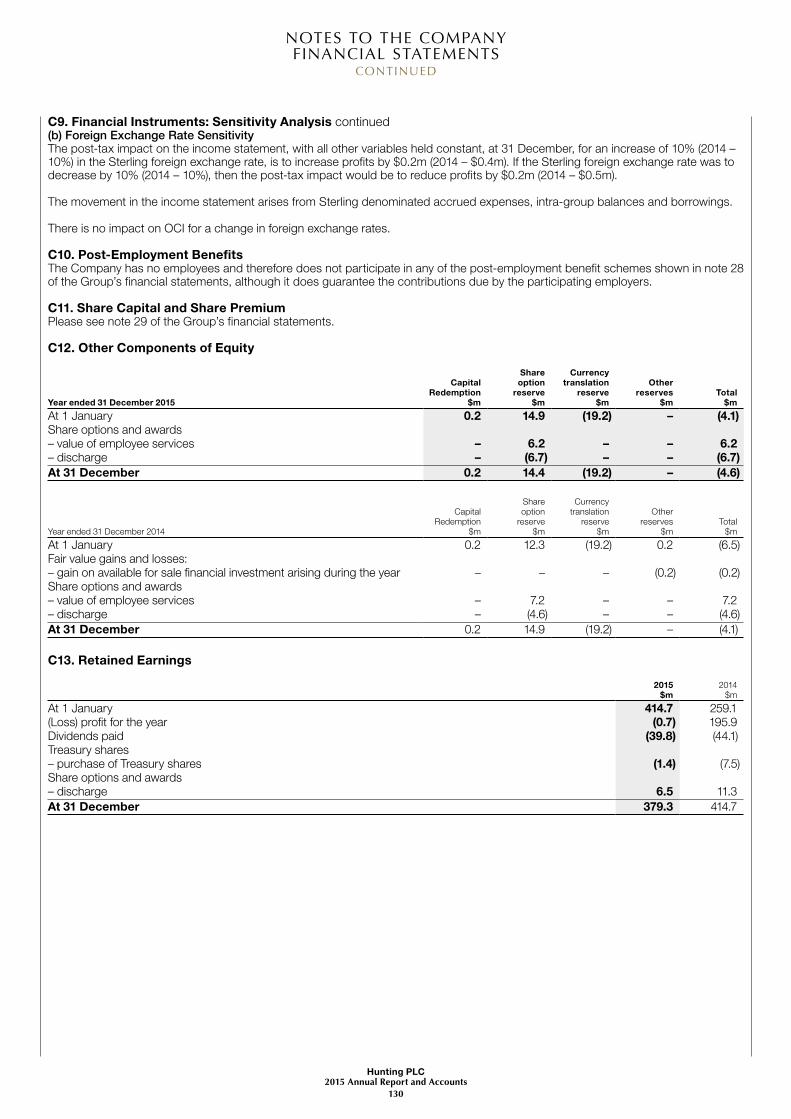
NOTES TO THE COMPANY FINANCIAL STATEMENTS
CONTINUED
Hunting PLC2015 Annual Report and Accounts
130
C9. Financial Instruments: Sensitivity Analysis continued(b) Foreign Exchange Rate SensitivityThe post-tax impact on the income statement, with all other variables held constant, at 31 December, for an increase of 10% (2014 – 10%) in the Sterling foreign exchange rate, is to increase profits by $0.2m (2014 – $0.4m). If the Sterling foreign exchange rate was to decrease by 10% (2014 – 10%), then the post-tax impact would be to reduce profits by $0.2m (2014 – $0.5m).
The movement in the income statement arises from Sterling denominated accrued expenses, intra-group balances and borrowings.
There is no impact on OCI for a change in foreign exchange rates.
C10. Post-Employment BenefitsThe Company has no employees and therefore does not participate in any of the post-employment benefit schemes shown in note 28 of the Group’s financial statements, although it does guarantee the contributions due by the participating employers.
C11. Share Capital and Share PremiumPlease see note 29 of the Group’s financial statements.
C12. Other Components of Equity
Year ended 31 December 2015
Capital Redemption
$m
Share option
reserve$m
Currency translation
reserve$m
Other reserves
$mTotal
$m
At 1 January 0.2 14.9 (19.2) – (4.1)Share options and awards– value of employee services – 6.2 – – 6.2– discharge – (6.7) – – (6.7)At 31 December 0.2 14.4 (19.2) – (4.6)
Year ended 31 December 2014
Capital Redemption
$m
Share option
reserve$m
Currency translation
reserve$m
Other reserves
$mTotal
$m
At 1 January 0.2 12.3 (19.2) 0.2 (6.5)Fair value gains and losses:– gain on available for sale financial investment arising during the year – – – (0.2) (0.2)Share options and awards– value of employee services – 7.2 – – 7.2 – discharge – (4.6) – – (4.6)At 31 December 0.2 14.9 (19.2) – (4.1)
C13. Retained Earnings
2015$m
2014$m
At 1 January 414.7 259.1 (Loss) profit for the year (0.7) 195.9 Dividends paid (39.8) (44.1)Treasury shares– purchase of Treasury shares (1.4) (7.5)Share options and awards– discharge 6.5 11.3 At 31 December 379.3 414.7

ST
RA
TEG
IC R
EPO
RT
CO
RP
OR
AT
E G
OV
ERN
AN
CE
FINA
NC
IAL
ST
AT
EM
EN
TS
OT
HER
INF
OR
MA
TIO
N
Hunting PLC2015 Annual Report and Accounts
131
C13. Retained Earnings continuedRetained earnings include the following amounts in respect of the carrying amount of Treasury shares:
2015$m
2014$m
Cost:At 1 January (14.8) (13.8)Purchase of Treasury shares (1.4) (7.5)Disposal of Treasury shares 4.4 6.5 At 31 December (11.8) (14.8)
The loss on disposal of Treasury shares during the year, which is recognised in retained earnings, was $4.4m (2014 – $6.5m).
C14. Dividends PaidPlease see note 32 of the Group’s financial statements.
C15. Share-Based PaymentsPlease see note 33 of the Group’s financial statements.
C16. Related Party TransactionsThe following related party transactions took place between the Company and wholly owned subsidiaries of the Group during the year:
2015$m
2014$m
Transactions: Royalties receivable 11.5 19.4 Management fees payable (11.2) (8.0) Recharges of share options and awards and administrative expenses 9.8 9.6 Loans from subsidiaries repaid – (92.2) Loan to subsidiary – (171.2) Loans to subsidiary repaid – 15.5 Interest payable on inter-company loans – (0.7) Interest receivable on inter-company loans 2.6 0.2 Dividends received from subsidiaries – 144.6 Year end balances: Payables to subsidiaries (2.2) (0.3) Receivables from subsidiaries 0.1 6.3 Loans owed by subsidiaries 171.2 171.2
All balances between the Company and its subsidiaries are unsecured.
The Company also serves as the Group’s intermediary for the provision of UK group tax relief, VAT and certain group insurances. At the year end, the outstanding payable for group tax was $0.1m (2014 – $2.5m receivable).
The key management of the Company comprises the executive and non-executive Directors only. The details of the Directors’ compensation are disclosed in note 9 of the Group’s financial statements. The Directors of the Company had no material transactions other than as a result of their service agreements.

NOTES TO THE COMPANY FINANCIAL STATEMENTS
CONTINUED
Hunting PLC2015 Annual Report and Accounts
132
C17. SubsidiariesAll Companies listed below are wholly owned by the Group, except where otherwise indicated.
SubsidiariesCountry of incorporation and/or operations Business
Oil and Gas activitiesHunting Energy Services (Australia) Pty Ltd Australia Holding companyHunting Titan (Australia) Pty Ltd Australia Oilfield servicesHunting Energy Services (Canada) Ltd Canada Oilfield servicesHunting Energy Services (Drilling Tools) Ltd Canada Drilling equipmentHunting Titan ULC Canada Oilfield servicesHunting Energy Services (Canada) Holdings Ltd Canada Holding companyHunting Energy Services (Wuxi) Co. Ltd (70%) China Oilfield servicesHunting Energy Completion Equipment (Wuxi) Co., Ltd China Oilfield servicesHunting Energy Services (International) Limited England and Scotland Oilfield servicesHunting Energy Services Overseas Holdings Limited England Holding companyPT Hunting Energy Asia Indonesia Oilfield servicesHunting Energy Services Italy S.r.l. Italy Oilfield servicesHunting Energy de Mexico Mexico Oilfield servicesHunting Energy Services BV (60%) Netherlands Oilfield servicesHunting Energy Services (Norway) AS Norway Oilfield servicesHunting Energy Services Limited Scotland Oilfield servicesHunting Energy Services (UK) Limited (60%) Scotland Oilfield servicesHunting Energy Services (Well Intervention) Limited Scotland, USA and UAE Oilfield servicesHunting Welltonic Limited Scotland Oilfield servicesHunting Energy Services (International) Pte. Ltd. Singapore Oilfield servicesHunting Energy Saudi Arabia LLC (60%) Saudi Arabia Oilfield servicesHunting Energy Services Pte. Ltd. Singapore Oilfield servicesHunting Energy Services (China) Pte. Ltd. (70%) Singapore Oilfield servicesHunting Welltonic Asia Pte. Ltd Singapore Oilfield servicesHunting Energy Services (Well Intervention) Pte. Ltd Singapore Oilfield servicesHunting Energy Services (South Africa) Pty Ltd South Africa Oilfield servicesHunting Energy Services (Thailand) Limited (49%) Thailand Oilfield servicesHunting Energy Services (Uganda) Ltd Uganda Oilfield servicesNational Coupling Company, Inc. USA Oilfield servicesHunting Energy Services, Inc. USA Oilfield and trenchless drilling products and servicesPremium Finishes, Inc. USA DormantHunting Dearborn, Inc. USA Oilfield services – precision engineeringHunting Energy Services (Drilling Tools), Inc. USA Drilling equipmentHunting Innova, Inc. USA Oilfield services electronic component manufacturerHunting Specialty Supply, Inc. USA Oilfield servicesHunting Titan, Inc. USA Oilfield services – perforating systems
Other activitiesTenkay Resources, Inc. USA Oil and natural gas exploration and production
Corporate activitiesHunting Energy Holdings Limited* England Holding companyHunting Oil Holdings Limited* England Holding companyHunting Knightsbridge Holdings Limited England FinanceHunting Knightsbridge (US) Finance Limited England FinanceHuntaven Properties Limited England Group propertiesHunting Pension Trust Limited* England Pension TrusteeHG Management Services Ltd England Provision of management servicesHuntfield Trust Limited England DormantStag Line Limited England DormantField Insurance Limited Guernsey Captive insurance companyHunting U.S. Holdings, Inc. USA Holding companyHunting Energy Corporation USA Holding company
AssociatesCountry of incorporation and/or operations Business
Tianjin Huaxin Premium Connection Pipe Co Ltd (28.5%) China Oilfield servicesHunting Airtrust Tubulars Pte. Ltd (50%) Singapore Oilfield servicesTubular Resources Pte. Ltd (30%) Singapore Oilfield services
Notes:1 Except where otherwise stated companies are wholly owned, being incorporated and operating in the countries indicated.2 Interests in companies marked * are held directly by Hunting PLC.3 All interests in subsidiaries and associates are in the equity shares of those companies.
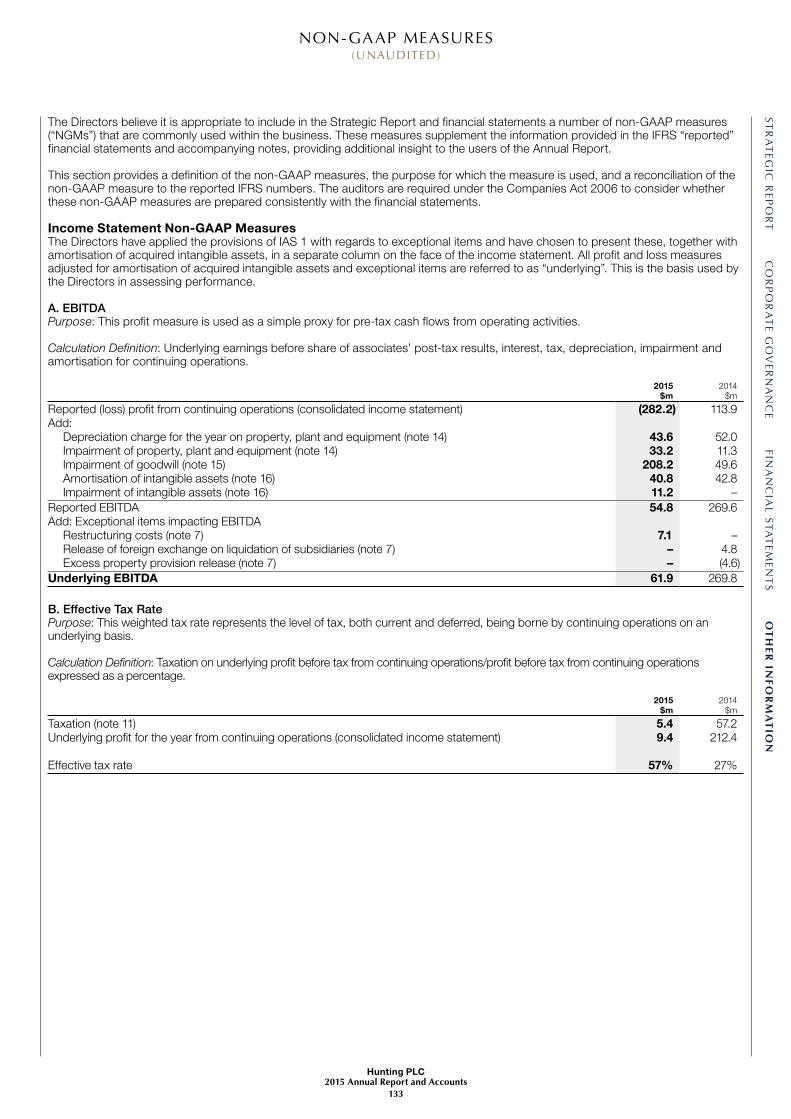
ST
RA
TEG
IC R
EPO
RT
CO
RP
OR
AT
E G
OV
ERN
AN
CE
FIN
AN
CIA
L S
TA
TE
MEN
TS
OT
HE
R IN
FO
RM
AT
ION
NON-GAAP MEASURES (UNAUDITED)
Hunting PLC2015 Annual Report and Accounts
133
The Directors believe it is appropriate to include in the Strategic Report and financial statements a number of non-GAAP measures (“NGMs”) that are commonly used within the business. These measures supplement the information provided in the IFRS “reported” financial statements and accompanying notes, providing additional insight to the users of the Annual Report.
This section provides a definition of the non-GAAP measures, the purpose for which the measure is used, and a reconciliation of the non-GAAP measure to the reported IFRS numbers. The auditors are required under the Companies Act 2006 to consider whether these non-GAAP measures are prepared consistently with the financial statements.
Income Statement Non-GAAP MeasuresThe Directors have applied the provisions of IAS 1 with regards to exceptional items and have chosen to present these, together with amortisation of acquired intangible assets, in a separate column on the face of the income statement. All profit and loss measures adjusted for amortisation of acquired intangible assets and exceptional items are referred to as “underlying”. This is the basis used by the Directors in assessing performance.
A. EBITDAPurpose: This profit measure is used as a simple proxy for pre-tax cash flows from operating activities.
Calculation Definition: Underlying earnings before share of associates’ post-tax results, interest, tax, depreciation, impairment and amortisation for continuing operations.
2015$m
2014$m
Reported (loss) profit from continuing operations (consolidated income statement) (282.2) 113.9 Add: Depreciation charge for the year on property, plant and equipment (note 14) 43.6 52.0 Impairment of property, plant and equipment (note 14) 33.2 11.3 Impairment of goodwill (note 15) 208.2 49.6 Amortisation of intangible assets (note 16) 40.8 42.8 Impairment of intangible assets (note 16) 11.2 –Reported EBITDA 54.8 269.6 Add: Exceptional items impacting EBITDA Restructuring costs (note 7) 7.1 – Release of foreign exchange on liquidation of subsidiaries (note 7) – 4.8 Excess property provision release (note 7) – (4.6)Underlying EBITDA 61.9 269.8
B. Effective Tax RatePurpose: This weighted tax rate represents the level of tax, both current and deferred, being borne by continuing operations on an underlying basis.
Calculation Definition: Taxation on underlying profit before tax from continuing operations/profit before tax from continuing operations expressed as a percentage.
2015$m
2014$m
Taxation (note 11) 5.4 57.2 Underlying profit for the year from continuing operations (consolidated income statement) 9.4 212.4
Effective tax rate 57% 27%

NON-GAAP MEASURES (UNAUDITED) CONTINUED
Hunting PLC2015 Annual Report and Accounts
134
Balance Sheet Non-GAAP MeasuresC. Working CapitalPurpose: Working Capital is a measure of the Group’s liquidity identifying whether the Group has sufficient assets to cover liabilities as they fall due.
Calculation Definition: Trade and other receivables, excluding receivables from associates, derivative financial assets, environmental escrow and promissory notes, plus inventories less trade and other payables, excluding payables due to associates, derivative financial liabilities, dividend liabilities and retirement plan obligations.
2015$m
2014$m
Trade and other receivables – non-current (note 18) 4.0 3.3 Trade and other receivables – current (note 18) 140.2 285.6 Inventories (note 20) 331.2 381.8 Trade and other payables – current (note 21) (104.2) (197.7)Trade and other payables – non-current (note 21) (11.3) (11.2)Less: non-working capital loan note (note 18) (2.9) –Add: non-working capital non-current other payables (note 21) 9.1 8.9Less: non-working capital current other receivables and other payables (0.3) (0.1) 365.8 470.6
D. Inventory DaysPurpose: This is a working capital efficiency ratio that measures inventory balances relative to business activity levels.
Calculation Definition: Inventory at the year end divided by underlying cost of sales per day, adjusted for the impact of acquisitions and disposals.
2015$m
Restated2014
$m
Inventory (note 20) 331.2 381.8 Underlying cost of sales (consolidated income statement) 615.3 942.6
Inventory days 196 days 148 days
Management has revised the method for calculating inventory days as they believe that the new measure provides them with a more relevant KPI. Previously inventory at the year end was divided by revenue per day.
E. Trade Receivables DaysPurpose: This is a working capital efficiency ratio that measures trade receivable balances relative to business activity levels.
Calculation Definition: Trade receivables at the year end divided by revenue per day, adjusted for the impact of acquisitions and disposals.
2015$m
2014$m
Net trade receivables (note 18) 116.4 253.1 Revenue (note 4) 810.5 1,386.5
Trade receivable days 52 days 67 days
F. Other Net Assets
2015$m
2014$m
Retirement benefit asset (note 28) 41.4 30.9Investments in associates (consolidated balance sheet) 3.7 4.4Non-current investments (note 17) 9.1 8.9Net assets held for sale (consolidated balance sheet) – 4.8Non-working capital loan note (NGM C) 2.9 – Non-working capital non-current other payables (NGM C) (9.1) (8.9)Non-working capital current other receivables and other payables (NGM C) 0.3 0.1 48.3 40.2

ST
RA
TEG
IC R
EPO
RT
CO
RP
OR
AT
E G
OV
ERN
AN
CE
FIN
AN
CIA
L S
TA
TE
MEN
TS
OT
HE
R IN
FO
RM
AT
ION
Hunting PLC2015 Annual Report and Accounts
135
G. Net DebtPurpose: Hunting operates a centralised Treasury function that manages all cash and loan positions throughout the Group and ensures funds are used efficiently through the use of interest offsetting arrangements and other such measures. As the Group manages funding on a net debt basis, internal reporting focuses on changes in net debt and this is presented in the Strategic Report. The net debt reconciliation provides an analysis of the movement in the year for each component of net debt split between cash and non-cash items.
Calculation Definition: Net debt comprises bank overdrafts, current and non-current borrowings, less cash and cash equivalents and bank deposits maturing after more than three months.
2015At
1 January 2015
$mCash flow
$m
Exchange movements
$m
Amortisation of loan
facility fees$m
Reclassified from held
for sale*
$m
At 31 December
2015$m
Cash and cash equivalents (consolidated balance sheet) 88.5 (35.0) (2.9) – 3.8 54.4Bank overdrafts (note 22) (50.5) 17.0 1.0 – – (32.5)
38.0 (18.0) (1.9) – 3.8 21.9Current investments (note 17) 3.8 1.1 (0.3) – – 4.6Non-current borrowings (note 22) (157.9) 36.3 4.7 (0.3) – (117.2)Current unsecured bank loans (note 22) (14.9) (7.6) 2.7 – – (19.8)
(131.0) 11.8 5.2 (0.3) 3.8 (110.5)
* The net assets of Gibson Shipbrokers disposed of on 31 March 2015 included $3.9m of cash and cash equivalents that were classified as held for sale at 31 December 2014.
2014
At 1 January
2014$m
Cash flow$m
Exchange movements
$m
Amortisation of loan
facility fees$m
Classified as held for sale
$m
At 31 December
2014$m
Cash and cash equivalents (consolidated balance sheet) 167.4 (71.9) (3.2) – (3.8) 88.5 Bank overdrafts (note 22) (115.0) 62.8 1.7 – – (50.5)
52.4 (9.1) (1.5) – (3.8) 38.0 Current investments (note 17) 2.0 2.0 (0.2) – – 3.8 Non-current borrowings (note 22) (239.3) 80.5 2.7 (1.8) – (157.9)Current unsecured bank loans (note 22) (20.9) 5.2 0.8 – – (14.9)
(205.8) 78.6 1.8 (1.8) (3.8) (131.0)
H. Capital EmployedPurpose: Used in the calculation of the return on average capital employed (see NGM P).
Calculation Definition: Capital employed is the amount of capital that the Group has invested in its business and comprises the historic value of total equity plus net debt at amortised cost.
The Group’s capital comprised:
2015$m
2014$m
Total equity (consolidated balance sheet) 1,168.1 1,438.3 Net debt (NGM G) 110.5 131.0 1,278.6 1,569.3
I. GearingPurpose: This ratio indicates the relative level of debt funding, or financial leverage, that the Group is subject to with higher levels indicating increasing levels of financial risk.
Calculation Definition: Gearing is calculated as net debt as a percentage of total equity (see NGM H).
2015 2014
Gearing 9% 9%

NON-GAAP MEASURES(UNAUDITED) CONTINUED
Hunting PLC2015 Annual Report and Accounts
136
Cash Flow Non-GAAP MeasuresJ. Cash Flow Working Capital MovementsPurpose: Reconciles the working capital movements in the summary of changes in net debt in the Strategic Report.
2015$m
2014$m
Working capital – opening balance 470.6 467.6 Foreign exchange (12.3) (4.6)Add: Gibson Shipbrokers cash flows on working capital balances shown as discontinued operations – 3.7 Purchase of subsidiaries (consolidated statement of cash flows) – 3.0 Non-cash flows: LTIP liability extinguished using Treasury Shares – 6.9 Transfer from property, plant and equipment (note 14) 0.2 – Capital investment debtors/creditors cash flows 3.5 – Other non-cash flow movement – (0.1)Less: Capital investment debtors/creditors cash flows – (1.6) Other cash flow movement (0.2) (0.5)Working capital – closing balance (NGM C) (365.8) (470.6)Cash flow 96.0 3.8
K. Capital InvestmentPurpose: Capital investment identifies the cash resources being absorbed organically within the business to maintain or enhance operating activity levels. The split of replacement and expansion capital investment is used in the calculation of free cash flow (see NGM M) used in the summary changes in net debt presented in the Strategic Report.
Calculation Definition: Capital investment is the cash paid on tangible non-current assets. Replacement capital investment is the cash spent on non-current tangible assets to maintain existing levels of operating activity. Expansion capital investment is the cash spent on tangible non-current assets that will grow the business from current operating levels and enhance operating activity.
2015$m
2014$m
Property, plant and equipment additions (note 14) 77.1 125.1 Capital investment debtors/creditors cash flows (NGM J) 3.5 (1.6)Adjustment to provisions (note 23) 0.5 –Cash flow 81.1 123.5
Replacement capital investment 22.0 69.0 Expansion capital investment 59.1 54.5 Cash flow 81.1 123.5
Well Construction 49.4 69.0Well Completion 20.0 42.5Well Intervention 8.6 4.5Exploration and Production 3.0 7.0 Central 0.1 0.5 Cash flow 81.1 123.5
L. Other Operating Cash and Non-Cash MovementsPurpose: Reconciles other operating cash and non-cash movements in the Summary Group Cash Flow in the Strategic Report.
2015$m
2014$m
Loss on disposal of property, plant and equipment (consolidated statement of cash flows) 1.8 6.0 Decrease in provisions (consolidated statement of cash flows) (6.7) (3.4)Other non-cash flow items Charge to the income statement for PSP and Hunting PSP share options and awards (note 30) 6.2 7.2 Pensions 4.6 0.3 Other – (0.2)
5.9 9.9

ST
RA
TEG
IC R
EPO
RT
CO
RP
OR
AT
E G
OV
ERN
AN
CE
FIN
AN
CIA
L S
TA
TE
MEN
TS
OT
HE
R IN
FO
RM
AT
ION
Hunting PLC2015 Annual Report and Accounts
137
M. Free Cash FlowPurpose: Free cash flow is a measure of financial performance and represents the cash that the Group is able to generate after replacement capital investment, which is required to maintain existing levels of operating activity. Free cash flow represents the amount of cash the Group has available to either retain for investment, whether organic or by way of acquisition, or to return to shareholders.
Calculation Definition: Underlying profit from continuing operations adjusted for working capital, tax, replacement capital investment and interest.
2015$m
2014$m
Underlying EBITDA (NGM A) 61.9 269.8 Working capital movements (NGM J) 96.0 3.8 Interest paid and bank fees (consolidated statement of cash flows) (7.4) (5.6)Tax paid (consolidated statement of cash flows) (10.5) (26.6)Restructuring costs (consolidated statement of cash flows) (5.9) –Replacement capital investment (NGM K) (22.0) (69.0)Other operating cash and non-cash movements (NGM L) 5.9 9.9
118.0 182.3
Other Non-GAAP MeasuresN. Dividend Per Share DeclaredPurpose: Identifies the total amount of dividend declared in respect of a period. This is also used in the calculation of dividend cover (see NGM O).
Calculation Definition: The amount in cents returned to Ordinary shareholders. Figures shown are calculated on an accruals basis.
2015cents per
share
2014cents per
share
Interim dividend 4.0 8.1 Final dividend 4.0 22.9 8.0 31.0
O. Dividend CoverPurpose: An indication of the Company’s ability to maintain the level of its dividend and indicates the proportion of earnings being retained in the business for future investment versus that returned to shareholders.
Calculation Definition: Earnings or loss per share from continuing operations attributable to Ordinary shareholders divided by the cash dividend per share to be returned to Ordinary shareholders, on an accruals basis.
2015 2014
Underlying Reported Underlying Reported
Earnings (loss) per shareBasic – from continuing operations (note 13) 3.1c (156.1)c 102.6c 45.9c Diluted – from continuing operations (note 13) 3.1c (156.1)c 100.0c 44.8c
Dividend (NGM N) 8.0c 8.0c 31.0c 31.0c
Dividend coverBasic – from continuing operations 0.4x (19.5)x 3.3x 1.5x Diluted – from continuing operations 0.4x (19.5)x 3.2x 1.4x
P. Return on Average Capital EmployedPurpose: Measures the levels of return the Group is generating from its capital employed.
Calculation Definition: Underlying profit before interest and tax from continuing operations, adjusted for the share of associates’ post-tax results, as a percentage of average gross capital employed. Average gross capital employed is a monthly average of capital employed based on 13 balance sheets from the closing December balance in the prior year to the closing December balance in the current year.
2015$m
2014$m
Average monthly gross capital employed (13 point average) 1,532.9 1,660.7
Underlying profit from continuing operations (consolidated income statement) 16.4 217.8 Share of associates’ post-tax losses (consolidated income statement) (0.2) (0.5)Underlying profit from continuing operations including associates 16.2 217.3
Return on average capital employed 1% 13%

FINANCIAL RECORD*/**(UNAUDITED)
Hunting PLC2015 Annual Report and Accounts
138
2015$m
2014$m
2013$m
2012$m
2011$m
Revenue 810.5 1,386.5 1,293.6 1,265.4 933.4 EBITDA 61.9 269.8 244.0 240.7 160.0 Depreciation and non-exceptional amortisation and impairment (45.5) (52.0) (44.0) (40.1) (34.1)Profit from continuing operations 16.4 217.8 200.0 200.6 125.9 Finance expense (6.8) (4.9) (2.9) (8.7) (2.7)Share of associates’ post-tax (losses) profits (0.2) (0.5) 0.4 1.5 1.7 Profit before tax from continuing operations 9.4 212.4 197.5 193.4 124.9 Taxation (5.4) (57.2) (52.1) (53.9) (34.8)Profit for the year from continuing operations 4.0 155.2 145.4 139.5 90.1 Profit (loss) for the year from discontinued operations – 0.3 (1.4) 1.1 2.7 Profit for the year 4.0 155.5 144.0 140.6 92.8
cents cents cents cents cents
Basic earnings per shareContinuing operations 3.1 102.6 96.8 92.2 62.0 Continuing and discontinued operations 3.1 102.8 95.8 93.0 63.9
Diluted earnings per shareContinuing operations 3.1 100.0 94.5 90.0 60.7 Continuing and discontinued operations 3.1 100.2 93.5 90.8 62.6
Dividend per share# 8.0 31.0 29.5 28.4 23.9
$m $m $m $m $m
Total assetsNon-current assets 932.0 1,187.1 1,249.1 1,254.9 1,234.1 Net current assets 387.4 471.5 483.0 464.4 357.9 1,319.4 1,658.6 1,732.1 1,719.3 1,592.0 Financed by:Shareholders’ funds (including non-controlling interests) 1,168.1 1,438.3 1,414.8 1,332.7 1,146.9 Non-current liabilities 151.3 220.3 317.3 386.6 445.1 1,319.4 1,658.6 1,732.1 1,719.3 1,592.0
cents cents cents cents cents
Net assets per share 785.0 968.6 957.9 906.6 783.9
* Prior years have been restated for the designation of Gibson Shipbrokers as a discontinued operation. ** Information is stated before exceptional items and amortisation of acquired intangible assets. # Dividend per share is stated on a declared basis. Following the change in functional currency from Sterling to US dollar in 2013, dividends are declared in US dollars
and paid in Sterling. The Sterling value of dividends paid is fixed and announced approximately two weeks prior to the payment date. For 2012 and prior years, dividends were declared in Sterling and have been presented in cents using the exchange rate on the date they were paid or approved for interim and final dividends respectively.
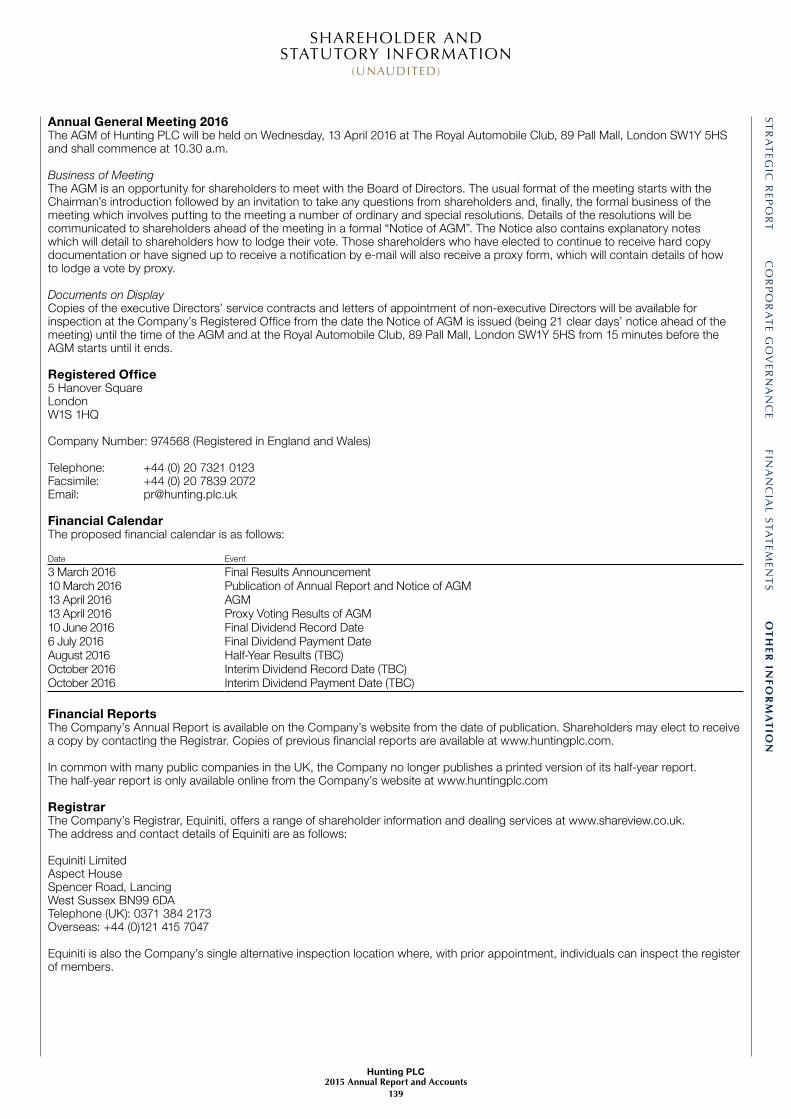
ST
RA
TEG
IC R
EPO
RT
CO
RP
OR
AT
E G
OV
ERN
AN
CE
FIN
AN
CIA
L S
TA
TE
MEN
TS
OT
HE
R IN
FO
RM
AT
ION
SHAREHOLDER AND STATUTORY INFORMATION
(UNAUDITED)
Hunting PLC2015 Annual Report and Accounts
139
Annual General Meeting 2016The AGM of Hunting PLC will be held on Wednesday, 13 April 2016 at The Royal Automobile Club, 89 Pall Mall, London SW1Y 5HS and shall commence at 10.30 a.m.
Business of MeetingThe AGM is an opportunity for shareholders to meet with the Board of Directors. The usual format of the meeting starts with the Chairman’s introduction followed by an invitation to take any questions from shareholders and, finally, the formal business of the meeting which involves putting to the meeting a number of ordinary and special resolutions. Details of the resolutions will be communicated to shareholders ahead of the meeting in a formal “Notice of AGM”. The Notice also contains explanatory notes which will detail to shareholders how to lodge their vote. Those shareholders who have elected to continue to receive hard copy documentation or have signed up to receive a notification by e-mail will also receive a proxy form, which will contain details of how to lodge a vote by proxy.
Documents on DisplayCopies of the executive Directors’ service contracts and letters of appointment of non-executive Directors will be available for inspection at the Company’s Registered Office from the date the Notice of AGM is issued (being 21 clear days’ notice ahead of the meeting) until the time of the AGM and at the Royal Automobile Club, 89 Pall Mall, London SW1Y 5HS from 15 minutes before the AGM starts until it ends.
Registered Office5 Hanover SquareLondon W1S 1HQ
Company Number: 974568 (Registered in England and Wales)
Telephone: +44 (0) 20 7321 0123Facsimile: +44 (0) 20 7839 2072Email: [email protected]
Financial CalendarThe proposed financial calendar is as follows:
Date Event
3 March 2016 Final Results Announcement10 March 2016 Publication of Annual Report and Notice of AGM13 April 2016 AGM13 April 2016 Proxy Voting Results of AGM10 June 2016 Final Dividend Record Date6 July 2016 Final Dividend Payment DateAugust 2016 Half-Year Results (TBC)October 2016 Interim Dividend Record Date (TBC)October 2016 Interim Dividend Payment Date (TBC)
Financial ReportsThe Company’s Annual Report is available on the Company’s website from the date of publication. Shareholders may elect to receive a copy by contacting the Registrar. Copies of previous financial reports are available at www.huntingplc.com.
In common with many public companies in the UK, the Company no longer publishes a printed version of its half-year report. The half-year report is only available online from the Company’s website at www.huntingplc.com
RegistrarThe Company’s Registrar, Equiniti, offers a range of shareholder information and dealing services at www.shareview.co.uk. The address and contact details of Equiniti are as follows:
Equiniti LimitedAspect HouseSpencer Road, LancingWest Sussex BN99 6DATelephone (UK): 0371 384 2173Overseas: +44 (0)121 415 7047
Equiniti is also the Company’s single alternative inspection location where, with prior appointment, individuals can inspect the register of members.

SHAREHOLDER AND STATUTORY INFORMATION
(UNAUDITED) CONTINUED
Hunting PLC2015 Annual Report and Accounts
140
Analysis of Ordinary ShareholdersAt 31 December 2015, the Company had 1,921 Ordinary shareholders (2014 – 2,000) who held 148.8 million (2014 – 148.5 million) Ordinary shares analysed as follows:
2015 2014
% of totalshareholders
% of totalshares
% of totalshareholders
% of totalshares
Size of holdings1 – 4,000 73.4 1.0 72.9 1.04,001 – 20,000 11.3 1.4 12.4 1.620,001 – 40,000 3.3 1.3 3.2 1.240,001 – 200,000 6.4 8.0 6.3 8.4200,001 – 500,000 3.0 12.5 2.5 10.8500,001 and over 2.6 75.8 2.7 77.0
Share Capital Hunting PLC is a premium-listed Company with its Ordinary shares quoted on the London Stock Exchange.
The Company’s issued share capital comprises a single class, which is divided into 148,841,508 Ordinary shares of 25 pence each. All of the Company’s issued Ordinary shares are fully paid up and rank equally in all respects.
Details of the issued share capital of the Company and the number of shares held in Treasury as at 31 December 2015 can be found in note 29 to the financial statements.
The Company’s total issued share capital as at 31 December 2015 was 148,841,508.
Subject to applicable statutes, shares may be issued with such rights and restrictions as the Company may, by ordinary resolution, decide, or (if there is no such resolution or so far as it does not make specific provision) as the Board (as defined in the Articles of Association) may decide.
Voting Rights and Restrictions on Transfer of SharesHolders of Ordinary shares are entitled to receive dividends (when declared), receive the Company’s Annual Report and Accounts, attend and speak at general meetings of the Company, and appoint proxies or exercise voting rights.
On a show of hands at a general meeting of the Company, every holder of Ordinary shares present in person or by proxy, and entitled to vote, has one vote, and, on a poll, every member present in person or by proxy and entitled to vote has one vote for every Ordinary share held. None of the Ordinary shares carry any special rights with regard to control of the Company. Proxy appointments and voting instructions must be received by the Company’s Registrars not later than 48 hours before a general meeting.
A shareholder can lose his entitlement to vote at a general meeting where that shareholder has been served with a disclosure notice and has failed to provide the Company with information concerning interests in those shares. Shareholders’ rights to transfer shares are subject to the Company’s Articles of Association.
Transfers of uncertificated shares must be carried out using CREST and the Directors can refuse to register a transfer of an uncertificated share in accordance with the regulations governing the operation of CREST.
The Directors may decide to suspend the registration of transfers, for up to 30 days a year, by closing the register of shareholders. The Directors cannot suspend the registration of transfers of any uncertificated shares without obtaining consent from CREST.
There are no restrictions on the transfer of Ordinary shares in the Company other than:
• certain restrictions that may from time to time be imposed by laws and regulations, for example insider trading laws; • pursuant to the Company’s share dealing code whereby the Directors and certain employees of the Company require approval to
deal in the Company’s shares; and • where a shareholder with at least a 0.25% interest in the Company’s certificated shares has been served with a disclosure notice
and has failed to provide the Company with information concerning interests in those shares.
Interests in Voting RightsOther than as stated in the table of Substantial Interests on page 53, the Company is not aware of any further agreements between shareholders that may result in restrictions on the transfer of Ordinary shares or on voting rights.
Market CapitalisationThe market capitalisation of the Company at 31 December 2015 was £455.5m.
Share Price2015
p2014
p
At 1 January 524.0 768.5At 31 December 305.5 531.5High during the year 664.0 910.0Low during the year 275.5 471.1
The table above sets out the middle market closing prices.
ST
RA
TEG
IC R
EPO
RT
CO
RP
OR
AT
E G
OV
ERN
AN
CE
FIN
AN
CIA
L S
TA
TE
MEN
TS
OT
HE
R IN
FO
RM
AT
ION
Hunting PLC2015 Annual Report and Accounts
141
DividendsThe Company normally pays dividends semi-annually. Details of the dividends paid are set out in note 32 of the financial statements.
Prior to January 2014, dividends were declared and paid in Sterling. On 5 December 2013, the Company announced that the presentational currency of the financial statements was changing from Sterling to US Dollars and as a result of this change future dividends would be declared in US Dollars. Following the change, dividends are still paid in Sterling with the Sterling value of the dividend payable per share fixed and announced approximately two weeks prior to the payment date and based on the average spot exchange rate over the three business days preceding the announcement date.
Dividend Calendar
Ex-Dividend Date Record Date Payment Date
2015 interim dividend 8 October 2015 9 October 2015 28 October 20152015 final dividend* 9 June 2016 10 June 2016 6 July 2016
* Subject to shareholder approval.
DirectorsPowers of the DirectorsSubject to the Company’s Articles of Association, UK legislation and any directions prescribed by resolution at a general meeting, the business of the Company is managed by the Board. The Articles of Association may only be amended by special resolution at a general meeting of shareholders. Where class rights are varied, such amendments must be approved by the members of each class of share separately.
Appointment and Replacement of DirectorsThe rules about the appointment and replacement of Directors are contained in the Articles of Association. On appointment in accordance with the Articles, Directors may be appointed by a resolution of the Board but are then required to be reappointed by ordinary resolution by shareholders at the Company’s next AGM.
Directors’ InterestsDetails of Directors’ remuneration, service contracts and interests in the Company’s shares and share options are set out in the Directors’ Remuneration Report and Annual Report on Remuneration, located at www.huntingplc.com. Further information regarding employee long-term incentive schemes is given in note 33 of the financial statements.
Directors’ Conflict of InterestAll Directors have a duty under the Companies Act 2006 to avoid a situation in which they have, or could have, a direct or indirect conflict of interest with the Company. The duty applies, in particular, to the exploitation of any property, information or opportunity, whether or not the Company could take advantage of it. The Company’s Articles of Association provide a general power for the Board to authorise such conflicts.
Directors are not counted in the quorum for the authorisation of their own actual or potential conflicts. Authorisations granted are recorded by the Company Secretary in a register and are noted by the Board.
On an ongoing basis, the Directors are responsible for informing the Company Secretary of any new, actual or potential conflicts that may arise, or if there are any changes in circumstances that may affect an authorisation previously given. Even when provided with authorisation, a Director is not absolved from his or her statutory duty to promote the success of the Company. If an actual conflict arises post-authorisation, the Board may choose to exclude the Director from receipt of the relevant information and participation in the debate, or suspend the Director from the Board, or, as a last resort, require the Director to resign.
As at 31 December 2015, no Director of the Company had any beneficial interest in the shares of Hunting’s subsidiary companies. Statement of Disclosure of Information to AuditorsIn accordance with the Companies Act 2006, all Directors in office as at the date of this report have confirmed, so far as they are aware, there is no relevant audit information of which the Group’s auditors are unaware and each Director has taken all reasonable steps necessary in order to make themselves aware of any relevant audit information and to establish that the Group’s auditors are aware of that information. This confirmation should be interpreted in accordance with the provisions of Section 418 of the Companies Act 2006.
Research and DevelopmentGroup subsidiaries undertake, where appropriate, research and development to meet particular market and product needs. The amount expensed by the Group during the year was $0.6m (2014 – $0.8m).
Political ContributionsIt is the Group’s policy not to make political donations. Accordingly, there were no political donations made during the year (2014- $nil).
Significant AgreementsThe Company is party to a revolving credit facility in which the counterparties can determine whether or not to cancel the agreement where there has been a change of control of the Company.
The service agreements of the executive Directors include provisions for compensation for loss of office or employment as a result of a change of control.
Statement of Listing Rule ComplianceIn accordance with Listing Rule 9.8.4C, the Directors confirm that all waivers of dividends over the Company’s Ordinary shares are noted on page 53.

GLOSSARY
Hunting PLC2015 Annual Report and Accounts
142
AGMAnnual General Meeting
AMG Advanced Manufacturing Group – combines the precision engineering and manufacturing capabilities in the Well Construction segment for the Electronics division (Hunting Innova) and Hunting Dearborn product lines. Hunting is aiming to become a leading single source of MWD/LWD tools.
APIAmerican Petroleum Institute.
Average gross capital employed*See NGM P.
Basic EPSBasic earnings per share – calculated by dividing the earnings from continuing operations attributable to Ordinary shareholders by the weighted average number of Ordinary shares in issue during the year.
bblBarrel of oil – one barrel of oil equals 159 litres or 42 US gallons.
BOEBarrel of oil equivalent.
cCents.
CAGRCompound annual revenue growth rate.
Capital employed*See NGM H.
Capital investment – “Capex”See NGM K.
CGUCash generating unit.
CO2
Carbon dioxide.
CO2eCarbon dioxide equivalent.
CPIConsumer Price Index.
CTRCurrency translation reserve.
DPS*See NGM N.
Diluted EPSDiluted earnings per share – earnings from continuing operations before amortisation and exceptional items, attributable to Ordinary shareholders, divided by the weighted average number of Ordinary shares in issue during the year, as adjusted for all potentially dilutive Ordinary shares.
Dividend cover*See NGM O.
DownholeDownhole refers to something that is located within the wellbore.
EBITDA*See NGM A.
ESOPExecutive Share Option Plan.
Free cash flow*See NGM M.
GAAPGenerally Accepted Accounting Principles.
Gearing*See NGM I.
GHGGreenhouse gas.
Growth capital investmentSee NGM K.
HEMSHunting Equipment Management Services – provides downhole tool rental equipment in the Well Construction segment.
Hunting PSPHunting Performance Share Plan.
HS&EHealth, Safety and Environment.
IASInternational Accounting Standards.
IFRICInternational Financial Reporting Interpretations Committee.
IFRSInternational Financial Reporting Standards.
Incident rateThe US Occupational Safety and Health Administration (“OSHA”) Recordable Incident Rate (or Incident Rate) is calculated by multiplying the number of recordable incidents by 200,000 and then dividing that number by the number of labour hours worked.
Intensity factorThe total controlled scope 1 and scope 2 emissions divided by the total facilities footprint of the Group.
Inventory days*See NGM D.
ISOInternational Standards Organisation.
KWhKilowatt hours.
LeanA production practice that eliminates wasteful processes, thereby reducing production time and costs, and improving efficiency.
LNGLiquefied Natural Gas.
LPGLiquefied Petroleum Gas.
LTIPLong-Term Incentive Plan.
m3
Cubic metre.
mcf1,000 cubic feet.
mmBtuMillion British Thermal Units.
MWD/LWDMeasurement-while-drilling/Logging-while-drilling.
MWhMegawatt hours.
Net debt*See NGM G.
NYMEXNew York Mercantile Exchange.
OCIOther comprehensive income.
OCTGOil Country Tubular Goods – pipe and tubular goods and products used in the oil and gas industry, such as drill pipe, pipe casings and production pipes.

ST
RA
TEG
IC R
EPO
RT
CO
RP
OR
AT
E G
OV
ERN
AN
CE
FIN
AN
CIA
L S
TA
TE
MEN
TS
OT
HE
R IN
FO
RM
AT
ION
Hunting PLC2015 Annual Report and Accounts
143
pPence.
PSP2009 Performance Share Plan.
Recordable incidentsAn incident is recordable if it results in any of the following: death, days away from work, restricted work or transfer to another job, medical treatment beyond first aid, or loss of consciousness. Also included are any significant injuries or illnesses diagnosed by a physician or other licensed health care professional, even if it does not result in death, days away from work, restricted work or job transfer, medical treatment beyond first aid, or loss of consciousness.
Replacement capital investmentSee NGM K.
ROCE*See NGM P.
Scope 1Scope 1 emissions are direct GHG emissions from sources that are owned or controlled by the entity. Scope 1 emissions include fossil fuels burned on site, emissions from vehicles and other direct sources.
Scope 2Scope 2 emissions are indirect GHG emissions resulting from the generation of electricity, heating and cooling or steam generated off site but purchased by the entity.
Trade receivable days*See NGM E.
TSR*Total Shareholder Return – the net share price change plus the dividends paid during that period.
UnderlyingResults for the year, as reported under IFRS, adjusted for amortisation of acquired intangible assets and exceptional items, which is the basis used by the Directors in assessing performance.
WellboreThe wellbore refers to the drilled hole.
Well completionWell completion refers to the processes of preparing a well for production. This involves the assembly of downhole tubulars and equipment required to enable safe and efficient production from an oil or gas well.
Well constructionWell construction refers to the initial drilling and processes of constructing the wellbore in an oil and gas well. These processes typically include drilling and logging the hole; running, cementing and logging the casing; hydraulic fracturing or stimulating the well and monitoring well performance and integrity.
Well interventionWell intervention refers to any operation carried out on an oil or gas well that maintains or enhances the production of the well or provides well diagnostics.
Working capital*See NGM C.
WTIWest Texas Intermediate – the price per barrel of Texas light sweet crude oil.
* Non-GAAP measure.

PROFESSIONAL ADVISERS
Hunting PLC2015 Annual Report and Accounts
144
SolicitorsCMS Cameron McKenna LLP
Independent AuditorsPricewaterhouseCoopers LLP
Joint Corporate BrokersDeutsche Bank and Barclays Bank
Financial AdvisersDC Advisory Limited
Insurance BrokersWillis Towers Watson
Pension Advisers & ActuaryLane Clark & Peacock LLP
Financial Public RelationsBuchanan Communications Limited
Registrars & Transfer OfficeEquiniti LimitedAspect HouseSpencer Road, LancingWest Sussex BN99 6DATelephone (UK): 0371 384 2173Overseas: +44 (0)121 415 7047

Designed and produced by Gatherwww.gather.london
Printed by Park Communicationson paper manufactured from Elemental Chlorine Free (ECF) pulp sourced from sustainable forests
Park Communications is certified to ISO 14001 Environmental Management System and the EU Eco‑Management and Audit Scheme (EMAS)

HUNTING PLC5 Hanover Square, London W1S 1HQ, United Kingdom
Tel: +44 (0)20 7321 0123Fax: +44 (0)20 7839 2072
www.huntingplc.com