Embed Size (px)
Citation preview

Managing Shipping Risk in the Global Supply
Chain – The Case for Freight Options
Nikos Nomikos Professor in Shipping Risk management
Director, MSc Shipping, Trade & Finance
Cass Business School
email: [email protected]

Slide 2 Freight Options Nikos Nomikos
Presentation Outline
•Structure of Shipping Markets
•Overview of Current Market Situation
•Supply – Demand Drivers
•The Market for Freight Options
•Asian Options on Freight
•Traditional vs Jump Diffusion models
Slide 3 Freight Options Nikos Nomikos
The Role of Shipping in Commodity Trade
• Shipping provides the link between the sources of supply and
demand for commodities around the world. The driving force is
Commodity Trade
• Market Segmentation
• Bulk vs Containers
• Across Type of Commodity
• Wet Market: Transportation of Crude Oil and Oil products
• Dry Market: Dry Bulk Commodities – Grains and agri, minerals etc.
• Across Sizes
• Commodities are transported in different sizes according to their Parcel
Size Distribution Function

Slide 4 Freight Options Nikos Nomikos
Breakdown of Global Dry-Bulk Cargo Trade
• About 50% of the cargoes
transported are related to the
steel industry
• as raw materials (iron ore and
coking coal)
• as final products (steel products
and scrap)
• The majority of iron ore, and
coal are destined to China
which absorbs about 60% of
both

Slide 5 Freight Options Nikos Nomikos
Shipping Markets
• World Seaborne Trade has increased
significantly over the last decade, reflecting
the increasing degree of industrialisation
and urbanization in emerging economies
(China and lately India)
• Growth in seaborne trade led to investment
in new tonnage which has now created
oversupply where available ships far
outweigh the cargoes available to carry
• Source: FT

Slide 6 Freight Options Nikos Nomikos
Hottest Commodity Trade in
2012?
• This creates a very volatile combination of
supply and demand forces
• Capesize freight rates dropped by 36% since
the beginning of 2012 due to new deliveries
of vessels and a reduction in iron ore imports
from China ahead of the Chinese New Year
celebrations.
• FT (11/1/12) : the hottest commodity trade in
the first weeks of 2012 is the spread between
orange juice and capesize index with a return
of 96%.
• Source: FT
Slide 7 Freight Options Nikos Nomikos
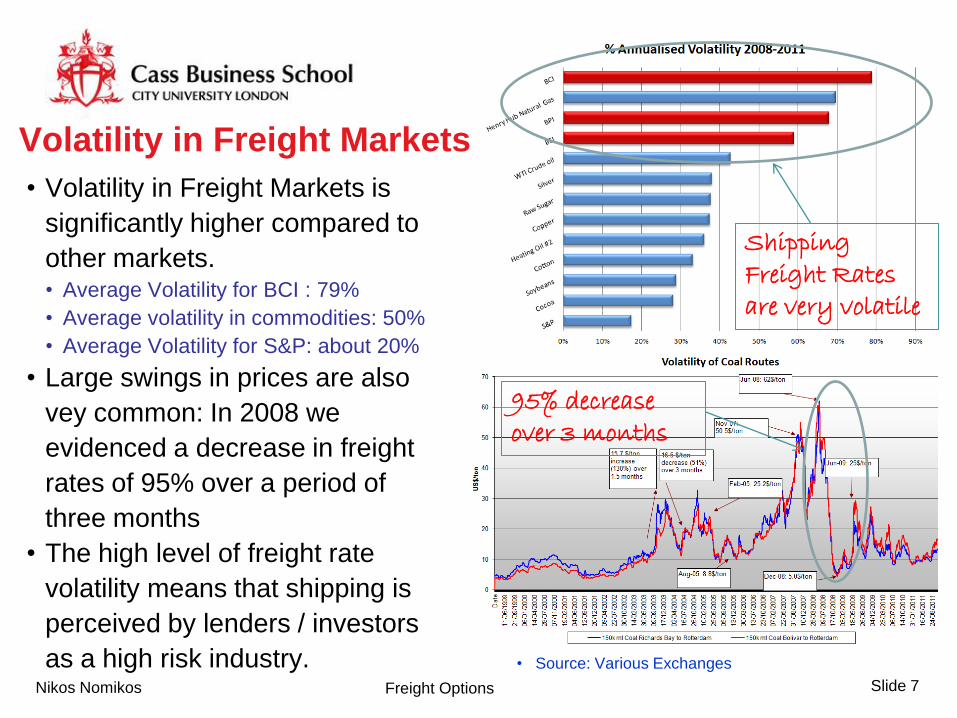
Volatility in Freight Markets
• Volatility in Freight Markets is
significantly higher compared to
other markets. • Average Volatility for BCI : 79%
• Average volatility in commodities: 50%
• Average Volatility for S&P: about 20%
• Large swings in prices are also
vey common: In 2008 we
evidenced a decrease in freight
rates of 95% over a period of
three months
• The high level of freight rate
volatility means that shipping is
perceived by lenders / investors
as a high risk industry. • Source: Various Exchanges
Shipping Freight Rates are very volatile
95% decrease over 3 months

Slide 8 Freight Options Nikos Nomikos
Why is Shipping so Volatile?
• Classical Supply-Demand Model
• Demand is inelastic
• Supply is elastic for low levels of
freight rates but becomes inelastic
as fleet utilisation increases.
• In the short-run supply depends on
factors such as port congestion,
average haul, etc.
• In the long-run, supply can
increase by building more ships.
• This model helps to explain the
high volatility in freight markets:
Supply-Demand Model
Freight Rate Volatility

Slide 9 Freight Options Nikos Nomikos
Forward Freight Agreements (FFAs)
• To manage freight risk, the market uses forward contracts on the
underlying shipping routes published by the Baltic Exchange, called
Forward Freight Agreements (FFAs).
• Contracts are available for the following indices
• Baltic Capesize Index (BCI) (150,000+ dwt)
• Baltic Panamax Index (BPI) (70,000+ dwt)
• Baltic Supramax Index (BSI) (52,000+dwt)
• FFA’s are cash-settled on the difference between the contract price
and the average of the settlement month. Contracts are OTC-
cleared.
• Total trading volume for 2011: about 1.1 m lots which reflects 1.1 bn
tons of physical cargo.

Slide 10 Freight Options Nikos Nomikos
The Market for Freight Options
• Asian-style options on the arithmetic average of the spot
freight rate
• Complements the FFA market as FFA positions are
needed to hedge short option positions
• Limited downside with unlimited upside are attractive
features to market participants
• More willing buyers than sellers!
• The issue of option pricing is pivotal when it comes to
trading options
• High volatility means higher premia
Slide 11 Freight Options Nikos Nomikos
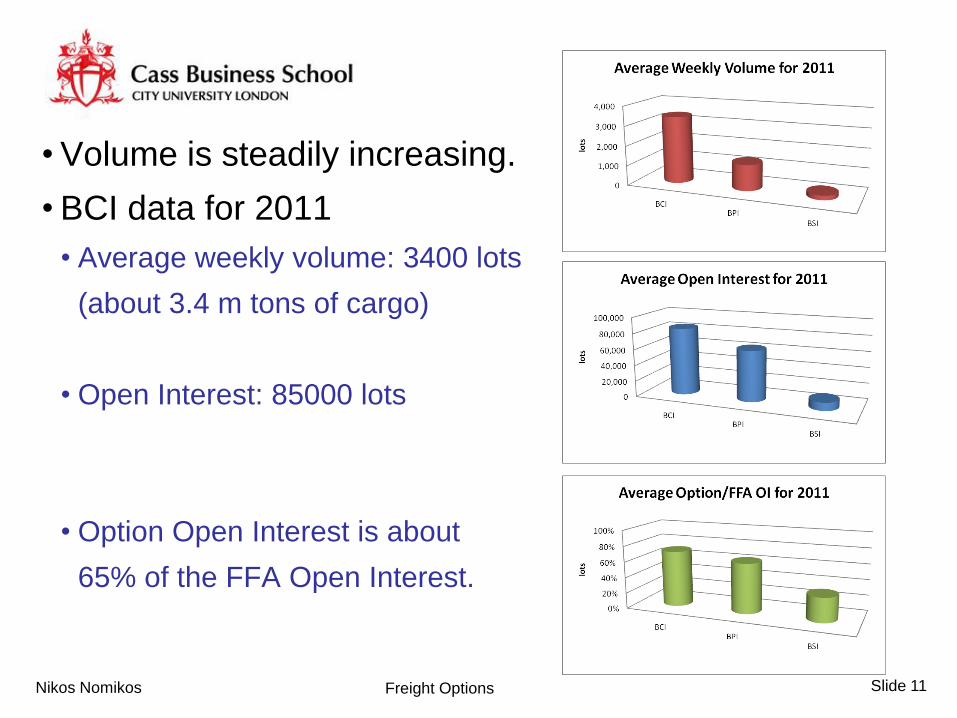
• Volume is steadily increasing.
• BCI data for 2011
• Average weekly volume: 3400 lots
(about 3.4 m tons of cargo)
• Open Interest: 85000 lots
• Option Open Interest is about
65% of the FFA Open Interest.

Slide 12 Freight Options Nikos Nomikos
Pricing Asian Options
• The market is using solutions based on the lognormal
approximation for the average spot freight rate: • Turnbull-Wakeman (1991) and Levy (1997) approximation
• Modified Black (76) for freight (Koekebakker et al, 2007)
• approximations generate option premia which are similar.
• differences between the models become smaller when we move
into longer maturity contracts as the relative duration of the
averaging period decreases.
TD3 Q1 08 Option Premia on 24/9/07 Calls Puts
T FFA TW CR KK BL TW CR KK BL Q1 08 90 13.49 13.49 13.49 14.64 13.49 13.49 13.49 14.64

Slide 13 Freight Options Nikos Nomikos
Pricing Freight Options
• The models examined previously provide a good
approximation in the lognormal framework. • That is we assume that price returns are normally distributed
• e.g. 3σ movements occur 0.1% of the time
• flat volatility smile across the strike prices
• However, freight rates exhibit much fatter tails than the normal
distribution • Probability of very high and
very low prices is higher
than under a normal
distribution
• Deep OTM and ITM options
should be more expensive.
Slide 14 Freight Options Nikos Nomikos
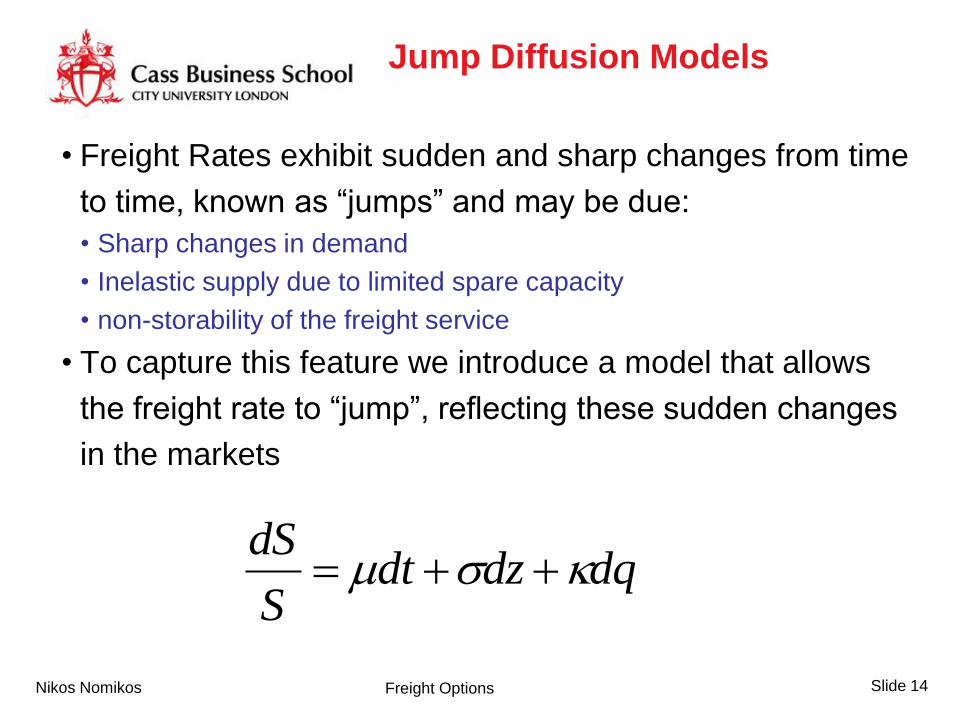
Jump Diffusion Models
• Freight Rates exhibit sudden and sharp changes from time
to time, known as “jumps” and may be due:
• Sharp changes in demand
• Inelastic supply due to limited spare capacity
• non-storability of the freight service
• To capture this feature we introduce a model that allows
the freight rate to “jump”, reflecting these sudden changes
in the markets
dqdzdt
S
dS

Slide 15 Freight Options Nikos Nomikos
Jump Diffusion Model
• The Jump diffusion model consists of two processes:
• One, based on a random walk model that follows a normal
distribution
• Another based on a jump process that remains 0 most of the time
and then changes (by a possibly random amount) during the jump
times:
• where:
• φ is the annualised frequency of the jumps
• k(bar) is the mean jump size
• γ is the jump volatility
dqdzdtS
dS
dtdqprob )1(2 21
ln(1 ) (ln(1 ) , )2
N

Slide 16 Freight Options Nikos Nomikos
Impact of Jumps on Prices
• Jumps have a big effect on the
implied volatility of options,
particularly in the short-run
• Jumps induce fat tails on the
distribution of returns
• The size of the jump causes
asymmetry in the underlying
distribution
• Positive Jumps cause positive
skewness
• Negative jumps cause left skewness.
• This way we can capture the
stylized features of freight rates
Slide 17 Freight Options Nikos Nomikos
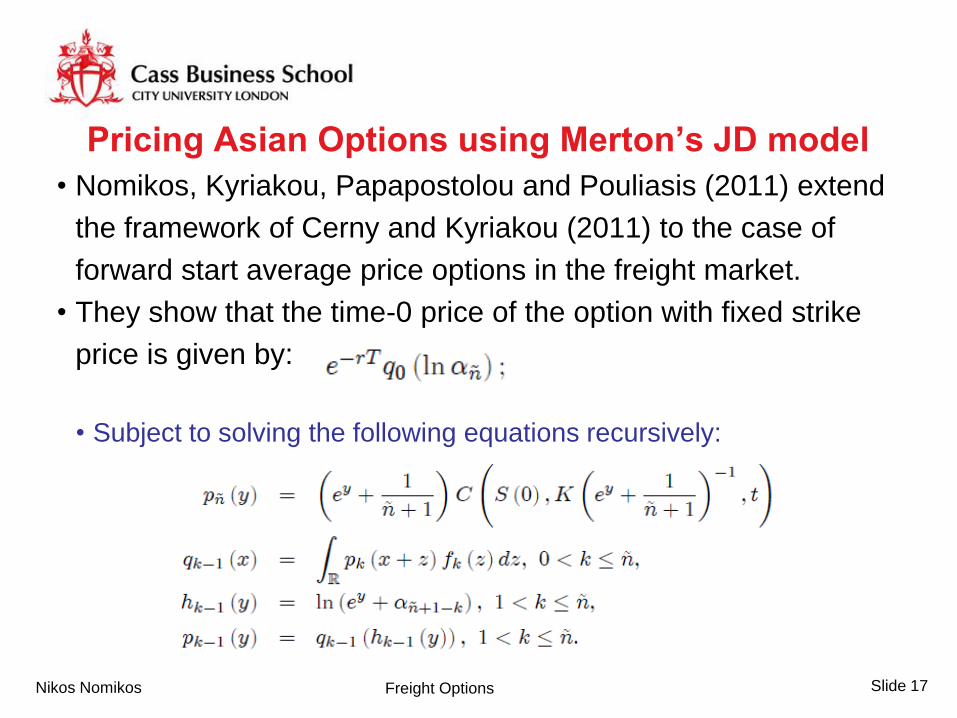
Pricing Asian Options using Merton’s JD model
• Nomikos, Kyriakou, Papapostolou and Pouliasis (2011) extend
the framework of Cerny and Kyriakou (2011) to the case of
forward start average price options in the freight market.
• They show that the time-0 price of the option with fixed strike
price is given by:
• Subject to solving the following equations recursively:

Slide 18 Freight Options Nikos Nomikos
Data Description
• We fit the model using the
Baltic IV for BCI, BPI and BSI
• we consider the following
maturities: +1Q, +2Q,+3Q, +4Q,
+1Cal, +2Cal.
• IV data are available as
annualised volatilities for ATM
options and as such we use
the Turnbull-Wakeman
approximation to infer the
corresponding option premia
in $/day.
Size Effect – vols are higher for BCI
Term Structure Effect
Slide 19 Freight Options Nikos Nomikos
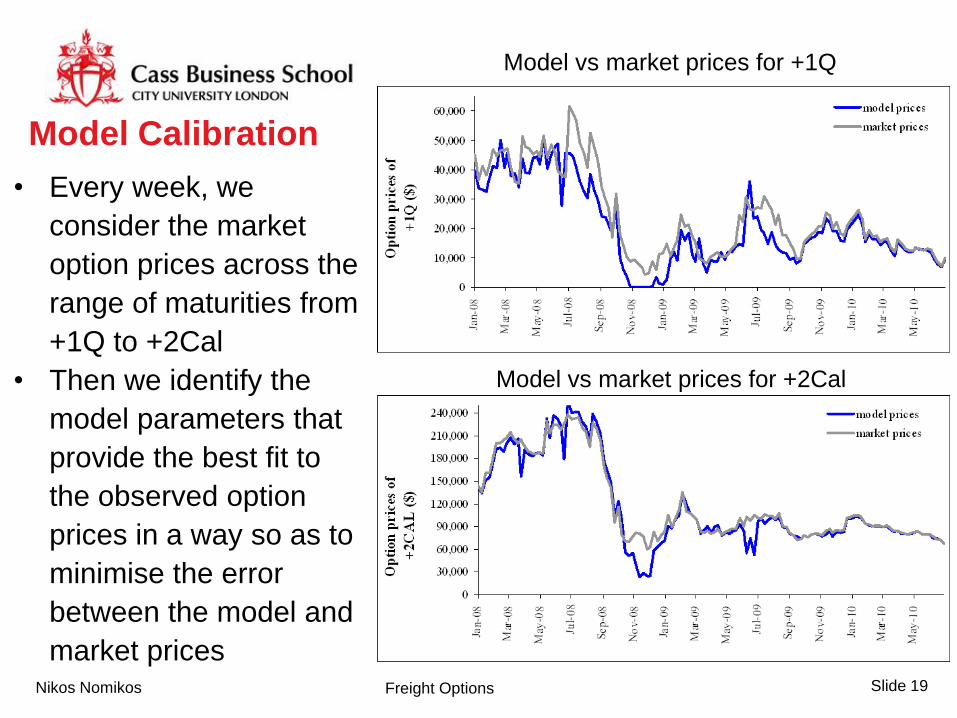
Model Calibration
• Every week, we
consider the market
option prices across the
range of maturities from
+1Q to +2Cal
• Then we identify the
model parameters that
provide the best fit to
the observed option
prices in a way so as to
minimise the error
between the model and
market prices
Model vs market prices for +1Q
Model vs market prices for +2Cal
Slide 20 Freight Options Nikos Nomikos
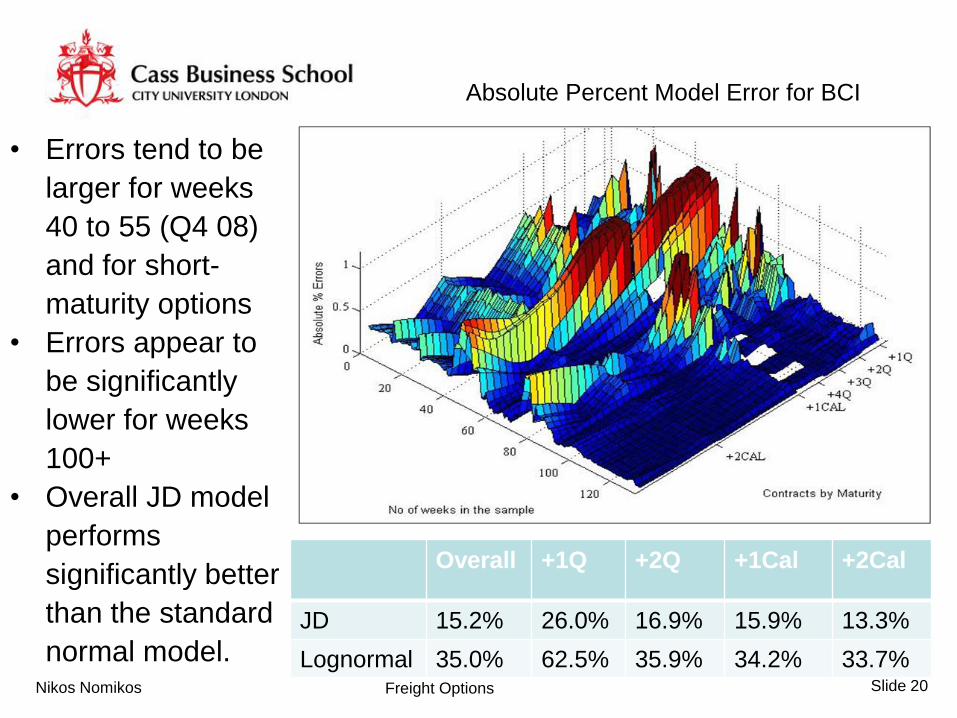
• Errors tend to be
larger for weeks
40 to 55 (Q4 08)
and for short-
maturity options
• Errors appear to
be significantly
lower for weeks
100+
• Overall JD model
performs
significantly better
than the standard
normal model.
Absolute Percent Model Error for BCI
Overall +1Q +2Q +1Cal +2Cal
JD 15.2% 26.0% 16.9% 15.9% 13.3%
Lognormal 35.0% 62.5% 35.9% 34.2% 33.7%

Slide 21 Freight Options Nikos Nomikos
Model Calibration: BCI &BPI
• BCI: jump size= 11.0%; jump arrival φ= 0.5 (1 jump every 2 years)
• BPI: jump size= -50.0%; jump arrival φ= 0.8 (1 jump every 1.1 year) • Jump volatility is higher than diffusive volatility
• Skewness and kurtosis are also highly significant
• Mostly positive signs consistent with the theoretical shape of the
supply stack although negative jumps were observed in Q4 08 and
were, on average larger than positive jumps.
φ Jump Size Jump Vol diffusive Vol Skew Kurt
BC
I
2008/10 0.50 0.11 0.75 0.44 0.27 2.05
2008 0.67 -0.98 1.03 0.61 -1.19 2.34
2009 0.40 0.73 0.60 0.38 0.71 1.33
BP
I
2008/10 0.81 -0.50 0.70 0.47 -0.92 1.79
2008 1.61 -1.99 0.50 0.59 -0.79 0.69
2009 0.33 0.16 0.74 0.44 0.37 2.17

Slide 22 Freight Options Nikos Nomikos
Model Calibration
• There exist significant
fluctuations across the
estimates
• Jumps: mostly less than
1 jump per year with the
exception of the 2008
crisis
• Jumps are mostly
positive but during the
2008 crisis this was
reversed
Jump Arrival Rate (Jumps pa)
Mean Jump Size

Slide 23 Freight Options Nikos Nomikos
BCI and BPI Volatility
• Volatility seems to
hover around the 100%
mark with the exception
of the crisis period (Q4
08).
• The increase in volatility
in that period was
attributed to the higher
jump persistence
BPI Volatility
BCI Volatility

Slide 24 Freight Options Nikos Nomikos
Additional Robustness Tests
• Option prices obtained with the Jump Diffusion model are less
prone to systematic error compared to those obtained from the
benchmark. • Hence the inclusion of jumps reduces the systematic bias in option premia
• The model is also tested on a “forward looking” basis by
examining whether the model captures the options prices in the
following week • Overall MJD is more able to capture sudden changes in option prices and
produce less outliers by capturing the likely jumps in the underlying process.
Slide 25 Freight Options Nikos Nomikos
Conclusions • Under the assumption of a Jump Diffusion model for the spot freight rate,
we price forward start Average Price options in the freight market
• Provides a flexible framework for modelling extreme market
movements
• The pricing algorithm is faster and more accurate than MC simulation
• The model is tested in the BCI, BPI and BSI options market and provides
better results than other commonly used lognormal approximations that
preclude jumps
• Pricing errors and biases are significantly lower
• Superior model fitting performance
• A pricing model that captures market risks efficiently
• Important not only for pricing options but also for managing options
price risk

Managing Shipping Risk in the Global Supply
Chain – The Case for Freight Options
Nikos Nomikos Professor in Shipping Risk management
Director, MSc Shipping, Trade & Finance
Cass Business School
email: [email protected]