Embed Size (px)
Citation preview

Managing R&D Project Shifts in High-TechOrganizations: A Multi-Method Study
Aravind ChandrasekaranFisher College of Business, The Ohio State University, 2100 Neil Avenue Columbus OH 43210, USA, [email protected]
Kevin LindermanCarlson School of Management, University of Minnesota, 321 19th Avenue South, Minneapolis MN 55455, USA, [email protected]
Fabian J. StingRotterdam School of Management, Erasmus University, Burgemeester Oudlaan 50, 3062 PA Rotterdam, Netherlands, [email protected]
Mary J. BennerCarlson School of Management, University of Minnesota, 321 19th Avenue South, Minneapolis MN 55455, USA, [email protected]
H igh-tech organizations maintain a portfolio of R&D projects that address problems with different levels of complexity.These projects use different strategies to search for technological solutions. Projects refining existing products, pro-
cesses, and technologies, for instance, employ a local search strategy to improve performance, while projects developing newproducts, processes, and technologies employ a distant search strategy. However, projects can shift in their levels of complex-ity due to exogenous technological changes, and failure to change search strategy in turn can negatively impact project per-formance. This study first develops grounded theory via case studies to understand how high-tech organizations manageR&D projects when complexity shifts. The case data come from 142 informants in 12 R&D projects at three high-tech businessunits. A cross-case comparison shows that three interconnected mechanisms positioned at multiple levels within the organi-zation enable high-tech organizations to identify such shifts and adjust the project’s search. We refer to this strategy as respon-sive search. We then conduct agent-based simulation experiments to examine the conditions under which the responsivesearch outperforms other canonical search strategies. Overall, this study sheds light on the underexplored question of how tomake mid-project corrections by effectively identifying and managing shifts in project complexity.
Key words: High-Tech R&D; case studies; NK model; search strategy; project complexity; project uncertainty; combined-methodsHistory: Received: January 2014; Accepted: May 2015 by Tsan-Ming Choi, after 3 revisions.
1. Introduction
High-tech organizations need to continuously innovateproducts and processes to address customers’ currentand future needs (Mallick and Schroeder 2005). Theydo so by implementing a portfolio of R&D projects thathave different levels of complexity (Chao and Kava-dias 2008, Levinthal 1997) and, in turn, use differentstrategies to search for technological solutions (Mihmet al. 2010). For complex problems, projects mayemploy a distant search strategy that entails develop-ing new products, processes, and technologies (Bennerand Tushman 2003, Levinthal 1997). These problemshave a large number of decision variables that interactwith one another (Sommer and Loch 2004). In contrast,projects for less complex problems may employ a localsearch strategy that entails enhancing existing prod-ucts, processes, and technologies. These problems have
fewer decision variables with sparse interactions.Scholars have used the terms “exploration” and“exploitation” (He and Wong 2004) or “radical” and“incremental” innovation (Chandrasekaran et al. 2015)to refer to local and distant search strategies, respec-tively. One challenge organizations face is how tomanage R&D projects with different search strategies.Research shows that R&D projects using a local searchstrategy may crowd out distance search projectsbecause they have lower risks and quicker returns(Chen and Katila 2008, Levinthal 1997, March 1991).To overcome this cannibalization, companies use “stra-tegic buckets” to classify R&D projects based on theirsearch strategies (Chao and Kavadias 2008). Once clas-sified, they employ different project management tech-niques such as incentives, leadership styles, anddecision-making autonomy to manage projects withineach bucket (Chandrasekaran et al. 2015).
390
Vol. 25, No. 3, March 2016, pp. 390–416 DOI 10.1111/poms.12410ISSN 1059-1478|EISSN 1937-5956|16|2503|0390 © 2015 Production and Operations Management Society

While a substantial amount of research has investi-gated how to categorize and manage different typesof R&D projects, these studies do not fully capture theoperational realities high-tech organizations face. Thisresearch effort began with the intent to enhance ourunderstanding of how high-tech R&D organizationsmanage different types of R&D projects. We con-ducted extensive fieldwork, tracking the progress of12 R&D projects within three business units (Micro-Tech, CommNet, and CommTech) at two high-techorganizations (Microsystems and CommCorp). Wespecifically wanted to investigate how high-tech R&Dunits manage tensions across projects—that is, howthey monitor and track resources across projects withdifferent search strategies. However, as the studyunfolded we found these units experienced otherR&D project challenges that the literature has notaddressed. What emerged inductively from the caseanalyses was the realization that the level of complex-ity of an R&D project sometimes may suddenlychange. For example, a project may have begun as asimple refinement to a current product or processtechnology using existing knowledge (local search).However, as the project progresses, external eventssuch as technological advancements can change theproject’s complexity, driving a need to develop newtechnology (distant search) instead of refining anexisting one. In other words, an exogenous change incomplexity may require managers to alter the pro-ject’s search strategy to improve performance. Wedefine project shift as an exogenous change in a pro-ject’s complexity during the course of the project.Executives in discussion said their firms faced chronicproject shifts, and the failure to identify these shiftsand alter the project’s search strategy resulted indelayed product launches and inferior market perfor-mance. To examine this phenomenon, this studyinvestigates the following question: How do high-techorganizations deal with R&D project shifts?A cross-case analysis of R&D projects shows differ-
ences in how business units managed R&D projectshifts. Specifically, CommNet and CommTech fol-lowed the conventional approaches discussed in theNPD literature to manage R&D projects: Senior man-agers made decisions about project search strategieson an annual basis and then used different projectmanagement approaches based on their search strate-gies (e.g., Chao and Kavadias 2008, Wheelwright andClark 1992). Project shifts, however, did not triggertimely adjustments to search strategies. Rather, thesebusiness units maintained the original search strategyin spite of a project shift, which led to poor outcomes.In contrast, senior managers at MicroTech made
decisions about project search strategies each monthand monitored their decisions each week, using simi-lar processes to track the all R&D projects’ progress.
Importantly, they did not explicitly differentiate pro-jects based on their search strategies, enabling them toquickly alter search strategy to distant from localwhen the project shifted. We define responsive searchas the strategy to quickly alter a project to distantsearch from local search upon project shifts. Thecross-case analysis identifies three interconnectedmechanisms at multiple levels that enabled respon-sive search at MicroTech. These enablers include thefollowing: (i) a universal risk-evaluation metric thatcontinuously tracks risk across all strategically impor-tant R&D projects, (ii) a weekly cross-level communi-cation process that facilitates continuous informationexchanges across project and strategic levels, and (iii)a continuous planning process that gathers monthlyupdates on technology and market changes. The con-tinuous planning, then, connects to the universal riskevaluation metric and the cross-level communicationprocess. Although these mechanisms may seemordinary in isolation, their interconnections helpedMicroTech manage project shifts.The case study finds that project shifts occur in
high-tech organizations. The case method also offersrich insights into the mechanisms that enabledresponsive search through a cross-case comparison(Glaser and Strauss 1967). The case method does,however, have limitations that should be recognized.For one, the case analysis makes it difficult to isolatethe benefits of responsive search from other organiza-tional factors at MicroTech. In addition, it has limitedexternal validity and does not provide insights intothe boundary conditions for the responsive search.This is because all projects from our cases operate inenvironments characterized by high levels of techno-logical turbulence and time-to-market pressures. Toovercome these limitations, we augmented the caseanalysis with agent-based simulation experiments.These varied the levels of technological turbulenceand time-to-market pressures to better understandthe boundary conditions of the responsive search. Thesimulation has the advantage of isolating the influ-ence of responsive search on project outcomes, irre-spective of other organizational effects. Figure 1 givesan overview of the research design.The agent-based simulations use the NK model to
represent the landscape of an innovation project’spossible outcomes (Kauffman 1993, Levinthal 1997).This landscape abstraction has been widely used tocharacterize search problems with varying levels ofcomplexity (e.g., Fleming and Sorenson 2001, 2004,Kavadias and Sommer 2009, Rivkin and Siggelkow2003). In the context of high-tech R&D projects, thecomplexity determines the ruggedness of the projectlandscape, which—when systematically varied—cap-tures the project shifts found in the case studies. Wecompare the responsive search from MicroTech,
Chandrasekaran, Linderman, Sting, and Benner: Managing R&D Project ShiftsProduction and Operations Management 25(3), pp. 390–416, © 2015 Production and Operations Management Society 391

where search strategy alters between local and distantconsistent with landscape shifts, with the conven-tional approach used at CommNet and CommTech.Specifically, we investigate the following researchquestion using the NK model: How effective is respon-sive search under various levels of technological turbulenceand time-to-market pressures when compared with othersearch strategies? Results show that the responsivesearch strategy is more effective than others in envi-ronments with high technological turbulence andtime-to-market pressures. However, these benefitsdiminish in environments with low technological tur-bulence and time-to-market pressures. This suggeststhat the effectiveness of responsive search is contin-gent on the environment—that is, it is does not uni-versally benefit all organizations. Taken together, theresults from both methods offer novel insights onhow to identify and manage project shifts to makemidcourse project corrections.
2. Background
NPD scholars have taken particular interest in thequestion of how to manage R&D projects with differ-ent search strategies (Chao and Kavadias 2008,Wheelwright and Clark 1992). A brief overview of thisliterature suggests that factors such as external com-petition (Chao and Kavadias 2008), firms’ competitivepriorities (Chan et al. 2007), and industry clockspeed(Fine 1998) help managers determine the “right” mixof R&D projects in their organizations. Scholars alsonote that decisions on project mix typically occur onan annual basis (Grant 2003, Hamel 1996), and man-agers tend to use different approaches to manage
R&D projects within these portfolios (Hutchison-Krupat and Kavadias 2014, Wheelwright and Clark1992). For instance, studies show that R&D directorsbecome more involved in day-to-day operations andrequire more frequent updates on projects adoptingdistant search but are less involved and require onlyperiodic updates for projects using local search(Chandrasekaran et al. 2015, Holmqvist 2004).Although research has advanced our knowledge on
how to manage different types of R&D projects, itviews project complexity from a static perspectiveand does not account for shifts over time. In a high-tech R&D setting, a project that begins as a simplerefinement to an existing product or process designmay need to alter its course and develop new technol-ogies due to exogenous changes in technical require-ments. Conversely, a project may start out as a searchfor new technologies but can change course to refineexisting technologies in response to changes in cus-tomer preferences or other competitive actions. Theliterature offers limited insights on how to alter a pro-ject’s search strategy in response to such exogenouschanges in project complexity (e.g., Hayes et al. 2005).A parallel stream of research by organizational
scholars has taken a more dynamic approach to con-ceptualize search (Chao et al. 2012, Lavie and Rosen-kopf 2011, Siggelkow and Levinthal 2003). From thisperspective, local search represents improvements inexisting technology trajectories, while distant searchrepresents “long jumps” to new technological possi-bilities (Fleming and Sorenson 2004, Posen and Levin-thal 2012). It has been argued that local searchstrategy helps find solutions in low-complexity tech-nology landscapes, while distant search strategy is
Case Analyses: Within and cross-case analyses showed differences in managing project shifts across business units
Simulation Analyses: Evaluate the performance differences between responsive search and other search strategies
Theory Refinement: Develop a contingency perspective on the effectiveness of the responsive search strategy
Method 1: Multiple Case Studies for Internal Validity
Method 2: Agent Based Simulation for External Validity
Field Observations: Projects shifted in their complexity. Inability to identify and alter the project search strategy with project shift affected project outcomes
Theory Development: A cross-case comparison finds three interconnected mechanisms at one of the business unit that enabled to identify project shifts.
Theory Augmentation: Iterating between case analysis and the literature gives rise to the responsive search strategy to deal with project shifts.
Figure 1 A Multi-Method Study Design
Chandrasekaran, Linderman, Sting, and Benner: Managing R&D Project Shifts392 Production and Operations Management 25(3), pp. 390–416, © 2015 Production and Operations Management Society
more effective in those with high levels of complexity(Fleming and Sorenson 2004, Levinthal 1997).Although these studies advance our understanding ofsearch strategies beyond the static approaches, theydo not focus on technology landscapes with shiftingcomplexities, be it at the organizational or projectlevels. Consequently, they do not examine howmidcourse project complexity changes affect searchstrategy, or how organizations can design mecha-nisms that detect exogenous changes to project com-plexity. Our research takes a first step towardunderstanding these issues.
3. Case Method and Data
3.1. Research SitesThe research sites for the cases consist of three theo-retically sampled business units (MicroTech, Comm-Tech and CommNet) from two high-tech organizations(Micro Systems Incorporated & Comm Corp Incorporated).Unlike random sampling, which aims to capture arepresentative sample of the population, theoreticalsampling seeks variation to understand conceptualdifferences (Eisenhardt 1989, Glaser and Strauss1967). We selected business units that (i) operated in ahigh-tech industry with fast industry clockspeed (Fine1998), (ii) had R&D projects that searched for newtechnologies as well as refined existing technologies,and (iii) experienced variations in project perfor-mance outcomes (successful, delayed). A brief intro-duction to the research sites follows (see Appendix Afor more details).
3.1.1. Micro Systems Incorporated. Micro Sys-tems manufactures precision electronic componentssuch as suspension drive assemblies, disk drive com-ponents and medical device components that requireminiature design and manufacturing capabilities. Ithas approximately 6000 employees and close to US$1 billion in annual sales. Micro System’s primarybusiness is designing and manufacturing suspensionassemblies made by MicroTech.1 The business unithad high levels of innovation within its R&D units, itschief technology officer (CTO) stating the company“operates in an industry where one thing is certain: costalways goes down, while product and process requirementsalways change rapidly.”
3.1.1.1. MicroTech Business Unit: The MicroTechBusiness Unit leads the industry in the design andmanufacturing of electronic components used in com-puters. R&D spending for this unit accounts for 15%of sales. MicroTech operates as a contract equipmentmanufacturer in this business segment, with themajority of its customers located in Southeast Asia. Itspecializes in close-tolerance design and manufactur-ing that requires chemical, mechanical, and electronic
technologies. The components this unit develops arevery small (<1 mm) and require high levels of reliabil-ity and precision. When asked about the unit’s prod-uct, the CEO offered the following analogy: “Imaginescaling up our product to the size of a Boeing 747. In thatcase, the airplane would be flying at five times the speed ofsound, at about 0.125 inch off the ground. And it mustmaintain that short distance at that speed over ocean wavesand mountains and still be counting the blades of grasswhile doing it.” This business unit leads the industry,with 65% market share, and has three design andmanufacturing facilities in the United States. Theresearch team visited two of these facilities and theheadquarters site.
3.1.2. Comm Corp Incorporated. Comm Corp is aFortune 500 company known for its global leadershipin high-tech manufacturing that specializes in embed-ded systems and integrated circuit design. It has threebusiness units (CommTech, CommNet, and CommCustomer Solution2) with 60,000 employees andannual sales exceeding US $40 billion.
3.1.2.1. CommTech Business Unit: CommTechemploys around 40,000 and is the primary businessunit of Comm Corp. It leads the industry’s communi-cation and data management technologies. R&Dspending accounts for 12% of sales. The unit’s designand pilot testing facilities, which the research teamvisited, are located in the United States, while its man-ufacturing takes place in Mexico, South America, andAsia. CommTech was the market leader until the late1990s, when it moved out of the top spot for reasonsattributed to a poor innovation decision on a key tech-nology (Tech Z, explained later in the study).
3.1.2.2. CommNet Business Unit: CommNet branchedout of the CommTech unit because of a technologycompetency. R&D expenditures account for 10% ofits sales. This unit has over 10,000 employees andoperates within the United States. It leads in thedesign and development of communication systemsfor the government and public sector. AlthoughCommNet’s customers were governmental institu-tions, their product offerings had a faster clockspeed(Fine 1998) and were comparable to both CommTechand MicroTech.
3.2. Data Collection & Research MethodsThe data from these sites include structured andsemi-structured interviews, observations at the busi-ness units and project meetings and archival materi-als. We had access to data from 12 R&D projects inthese units. Because eight of the 12 projects studiedin this research started prior to data collection, partof the data is retrospective and part is collected in“real-time.” However, we followed several stepsdetailed in this section to mitigate retrospective bias.
Chandrasekaran, Linderman, Sting, and Benner: Managing R&D Project ShiftsProduction and Operations Management 25(3), pp. 390–416, © 2015 Production and Operations Management Society 393

The seven-step procedure in Table 1, adaptedfrom Cardinal et al. (2004), summarizes the datacollection process and research methods. Consistentwith the grounded theory building technique, webegan with Micro Systems and then proceeded toComm Corp.Senior management in these business units helped
identify informants at both the strategic and projectlevels. We designed separate interview protocols forthe strategic level managers, project leaders, and theproject team members. Interviews at the strategiclevel focused on senior management’s role in decisionmaking and the organizational mechanisms used tomanage R&D projects. The project leader and teammember protocols focused on organizational andbehavioral issues when working on R&D projects.Projects were selected to obtain a mix of developingnew products, processes, and technologies outsidethe current knowledge as well as improving existingproducts, processes, and technologies by using cur-rent knowledge (i.e., using distant and local search).Additional interview protocols for the intellectualproperty and strategic planning departments werealso developed during the course of our study. Theinterviews included at least two research investiga-tors, one leading the interview and the other serving
as an observer and note-taker. The qualitative data forthe purpose of this study consisted of 41 interviews(16 strategic level and 25 project level) with over 142participants across all three business units (all inter-views at the project level had multiple participants).The strategic-level interviews included 16 senior
executives in three waves and involved the CEO,CTO, chief quality officer, vice presidents, directors,and business unit managers involved in making R&Dproject decisions (eight from MicroTech, five fromCommTech, three from CommNet). All interviewslasted 1–2 hours and included open-ended questions.Post-interview discussions took place within 24 hoursof the interviews and focused on summarizing andcross-validating observations (Gioia and Thomas1996). We recorded and transcribed all interviews forthe qualitative data analysis. This analysis also usedother forms of data, including planning reports, train-ing documents, IP documentation, company videos,financial analysis reports, industry publications, andreports from board meetings.We initially collected data from five R&D projects
at MicroTech, all with budgets exceeding $1 millionand considered high priority by senior management(average budget: $28.5 million). They included oneinnovation project (Vision Plus) focused on introduc-
Table 1 Research Methods for Case Analyses
1. Select cases fromMicrosystems Inc
1. Theoretically sample Microsystems and contact Microsystems to gain access to the MicroTech2. Identify the Strategic Level Informants (e.g., CEO, CTO, Senior VPs, Strategic Planning Officers, Intellectual Property
Officer, etc.) from MicroTech3. Begin sampling R&D projects within the MicroTech. Identify the informants for these projects (Project Leaders &
Project Team Members)4. Schedule site visits and interviews in MicroTech
2. Site visit preparation 1. Develop three different protocols based on existing literature for the Strategic Level, Project Leader and ProjectTeam Member Interviews.
2. Develop interview protocols for the Planning and Intellectual Property department interviews.3. Collect archival data on the organization and its competitors through Research Insights and Factiva databases.
3. Site visits at Micro Systems 1. Two researchers conduct interviews with the strategic level informants, project leaders, project team members2. Multiple informants are interviewed (e.g., project leader and team member) separately to avoid retrospective bias.3. Multiple visits to track project progress and gather additional data4. Researchers immediately discuss and share insights after each interviews.5. Collect other forms of data (e.g., IP Documents, Planning Reports, Board Meeting Reports, Project Reports, etc.)
4. Post Micro Systems toother sites
1. Transcribe the interviews and other forms of data. Contact the informants for clarification2. Discuss themes and generate codes after reading the transcripts3. Identify CommCorp & Terabyte Corp to collect data. Terabyte refused to participate. Select the CommTech and
CommNet from CommCorp4. Modify Interview protocols based on the evidence from Microsystems5. Sample informants and projects from both the business units
5. Data analysis and codingProcess
1. Three researchers code the data individually (open, axial coding).2. Generate open code lists which are reduced to axial code lists3. Compute inter-rater reliabilities for the coding process.
6. Additional sampling 1. Selective coding around the “project shifting” theme2. Collect additional data on project shifts (Drive Innovation from MicroTech and Tech Z from CommTech)3. Conduct a larger cross-case analysis across three business units
7. Theory development 1. Develop higher level findings from the cases2. Share the insights from the case analysis back with participants from Microsystems and CommCorp
Chandrasekaran, Linderman, Sting, and Benner: Managing R&D Project Shifts394 Production and Operations Management 25(3), pp. 390–416, © 2015 Production and Operations Management Society

ing a new technology and three innovation projects(Tech Yield, Tech Time, and Customer Defects)focused on refining existing technologies. Our samplealso included one project (Sigmatel) that started as arefinement to an existing technology but ended updeveloping new technology. At CommCorp, we ini-tially collected data from five R&D projects (averageproject size: $24.7 million). This included two innova-tion projects (Video Share from CommTech, Communi-cate from CommNet) that focused on developing newtechnologies and two innovation projects (Cost Reduc-tion from CommTech, Third Party from CommNet)that focused on refining existing technologies. Our sam-ple also included one project (Tablet from CommNet)initially started out as refinement to existing technologythat ended up developing a new technology.Appendix B gives details on all the projects stud-
ied. All projects varied in size, complexity, duration,and performance and were recently completed ornear completion. We were able to obtain updates onproject performance for incomplete R&D projects dur-ing follow-up visits. Separate interviews with the pro-ject leader and the project team members on the sametopics helped minimize retrospective bias. Multipleteam members were present during the project teammember interviews, improving response reliability.Additional archival data in the form of project presen-tations, stage-gate reports, team meeting minutes,and internal newsletters also helped minimize the ret-rospective bias (Langley 1999).For the data analyses, the research team familiar-
ized themselves with more than 500 pages of tran-scribed interviews and other related documents,including annual reports and business press articles,and developed a coding scheme to analyze the data.The team (three researchers and two research assis-tants) followed general guidelines of open, axial, andselective coding during this process (Miles andHuberman 1994), meeting for multiple rounds after theinitial site visits to develop a strategy for synthesizingthe data. To reduce data during the open codingprocess, we used the vocabulary of the interviewees,for example, “PPD (Product–Process Development)scorecards,” “scanning the market,” “cross-levelscorecards,” etc., as codes. This process resulted in aset of 127 codes representing about 1084 text seg-ments. We reduced these to 31 codes and seven cate-gories during the axial coding process, coding thedata in new ways by grouping conceptually similarcodes. For instance, “PPD scorecards” used at MicroSystems and “cross-level scorecards” used at Comm-Corp performed similar functions of connecting stra-tegic and project-level goals. We combined these as“cross-level communication” during the axial codingprocess. Code lists then were classified as eithera priori (PC) or grounded (GC) depending on whether
they were derived from our interview protocols oremerged inductively from the data. The coding pro-gress involved transitioning to second-order themesfrom first-order concepts that came from comments,views and facts made by the informants. Thesethemes emerged when we searched for relationshipsbetween the bundled first-order concepts. We finallyarrived at the aggregate dimensions based on the con-cepts that they represent.A minimum of three investigators coded the data
using NVIVO, openly discussing disagreements duringthe coding process and resolving them through evi-dence from the data. We used the Perreault and Leigh(1989) approach to determine inter-rater reliability3 (Ir)based on the observed frequency of agreementsbetween judges, the total number of judgments madeand the number of possible ways to code each concept.Average inter-rater reliability for the coding processwas 0.92 (for 31 axial codes), consistent with previousresearch (Morse 1997). Having multiple and separaterespondents for both the project-level and the strategic-level data across these business units helped establishreliability for the constructs examined herein.To sharpen understanding of the phenomenon, we
moved during the selective coding process to a fewtheoretical categories from a large number of codesproduced from the axial coding process. This isbecause our codes included topics such as knowledgecreation from projects and project portfolio manage-ment (Chandrasekaran and Linderman 2015, Chandr-asekaran et al. 2015) which are not relevant to thisresearch. As a result, we reduced all our axial codesto understand the project shifts. This process involves“integration and abstraction through comparison ofcoded passages, as well as comparison to the litera-ture (Volkoff et al. 2007, p. 837).” The selective codingprocess is complete upon theoretical saturation, thatis, when the relationships between categories are sup-ported by sufficient data (Strauss and Corbin 1990).Our initial data collected from all three sites involvedtwo projects (of 10) that experienced project shifts.These data did not offer a sufficiently compellingunderstanding of how project shifts are managedacross these units. Hence, we decided to revisit ourcases to search for other instances of project shifts.Going through our interview notes and archival data,we were able to find two more of the units’ projectsthat experienced complexity shifts: (i) Drive Innova-tion project from MicroTech, which experienced achange to high complexity from low complexity; and(ii) Tech Z from CommTech, which experienceda change to low complexity from high complexity.Analyzing these projects drew similar conclusions tothe previous two that experienced project shifts. Thissupported category saturation from our cases and isdeveloped in the robustness section. The final step in
Chandrasekaran, Linderman, Sting, and Benner: Managing R&D Project ShiftsProduction and Operations Management 25(3), pp. 390–416, © 2015 Production and Operations Management Society 395
the data analyses included a cross-case analyses tocompare and interpret strategic- and project-leveldata across the three business units (Miles and Huber-man 1994). Field data collection ended with feedbacksessions in February 2008.
4. Case Findings
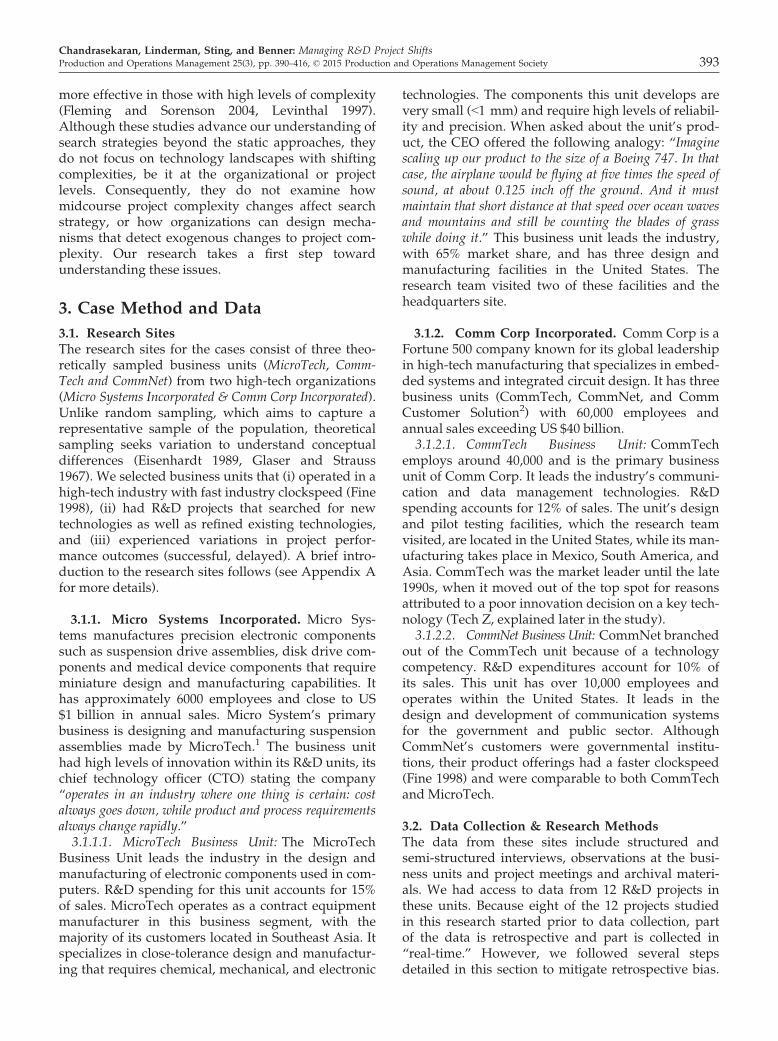
The cross-case business unit comparisons revealedcomplexity shifts in two projects: the Sigmatel projectat MicroTech, and the Tablet project at CommNet. Bothprojects began by building on existing technologiesand capabilities. Sigmatel entailed modifying existingproduct and process designs for making suspensiondrive assemblies at MicroTech, while Tablet involveddesigning a rugged laptop that was a minor improve-ment over another CommNet design (Figure 2a sche-matically represents the technological landscapes ofthese projects). Given the low levels of complexity(with relatively fewer project decision variables andsimple interactions between them), these projects ini-tially operated on a less-rugged landscape and used alocal search strategy to find acceptable technologicalsolutions. An exogenous technology change, however,brought more complexity (with more project decisionsand more involved interactions between them), creat-ing rugged landscapes for these projects, as shown inFigure 2b and 2c. Both projects eventually needed todevelop radically new technologies whose delivera-
bles senior management viewed as strategicallyimportant. At MicroTech, a quick alteration to the pro-ject search strategy to distant search from local searchquickly followed the exogenous project shift (See Fig-ure 2b). Here, the project team allocated additionalresources to the project and quickly changed its man-agement approach, encouraging more experimenta-tion to create new knowledge. In terms of outcomes,Sigmatel was a big success, industry reports stating itradically changed “the way suspension assemblies weredesigned and manufactured.”In contrast, the case analyses revealed CommNet
did not quickly identify the shift in Tablet’s projectlandscape and the search strategy stayed unchangedand local, as shown in Figure 2c. The project teamhad limited resources and senior management dis-couraged experimentation and out-of-box thinking,continuing to incrementally change the current prod-uct design even after the project shift. Only after sev-eral months of months of persuasion and additionaltests did the project change to a distant search strat-egy, ultimately delaying the product launch. Called a“subpar product” by the business press, the Tablet wasdiscontinued in 2009. According to senior managers,the company eventually lost its leadership position inthe rugged laptop market. The following discussionprovides a detailed description of these projects andmanagement’s response to project shifts. We thenhighlight important differences between these pro-
Project performance
Project performance
Local search strategy to navigate low complexitylandscapes in Sigmatel and Tablet projects
Project performance
Distant search strategy to navigate high complexity landscape inSigmatel project
Local search strategy to navigate high complexity landscape inTablet project
Project Shift
(a)
(b)
(c)
Figure 2 (a–c): Landscape Shifts for Sigmatel and Tablet Projects
Chandrasekaran, Linderman, Sting, and Benner: Managing R&D Project Shifts396 Production and Operations Management 25(3), pp. 390–416, © 2015 Production and Operations Management Society

jects and compare the findings with other projectsand the extant literature.
4.1. Sigmatel Project at MicroTechSigmatel started as modification to an existing productand process for making suspension assemblies. Theproduct changes involved using a slightly differentraw material that would offer better electrical conduc-tivity, increased mechanical control, and decreasedsize. The process changes involved adjusting theassembly process for the modified product. In general,project teams drew on MicroTech’s existing technolog-ical capabilities for both product and process technol-ogy changes and all key informants at MicroTechbelieved they had the relevant knowledge to executethe project. As a result, Sigmatel started with a localsearch strategy to improve the product design andeliminate any process variations. That is, the projectteam sought solutions based on their existing knowl-edge. For instance, when asked about the early phasesof Sigmatel, the project leader remarked:
For the first 3 months of the project, I just had acouple of manufacturing people working onchanging the machine specifications, program-ming them to make these components. We alsoinvolved some personnel from the advanceddevelopment R&D group to discuss strategies tooptimize our manufacturing process. Overall, itwas more a routine workload and was based onexisting skills [at MicroTech]
Irrespective of the project search strategy, seniormanagement at MicroTech used the same proprietaryproject management procedure called the PPD totrack all strategically important R&D projects. Micro-Tech had a full-time staff member reporting to theCTO charged with collecting project risk “scorecards”in the PPD process and working with the planningstaff to update risk scores. When asked about the roleof PPD at MicroTech, she said:
PPD is MicroTech’s quality assurance processthat is used to objectively identify and addresstechnical and business issues associated with pro-jects that are deemed to be of strategic impor-tance. These scorecards are completed by theproject leaders periodically through the LotusNotes Database. It is a relatively easy procedurethat involves clicking and responding to tenquestions related to their respective projects.
The PPD process at MicroTech proceeds as follows:At the beginning of each week, project leadersupdated a scorecard through their internal LotusNotes database to assess the technological and market
risks associated with the project. The scorecard con-sisted of ten questions on topics such as design formanufacturing risks, market entry risks and supplyrisks, etc., which are measured on a 5-point LikertScale (1 = No Risks, 2 = Some Risks, 3 = ModerateRisks, 4 = Less than substantial Risks, and5 = Substantial Risks). Projects with an average scoreabove 2 in the PPD scorecards were consideredhigher-risk projects, while projects scoring below 2 onthis scorecard were considered lower-risk projects.When over four consecutive weeks a previously low-risk project averages above 2, or a previously high-risk project averages below 2, a PPD staff memberflags them for further assessments. In general, projectssearching for new technologies had more risk thanprojects refining existing technologies because theyfaced several decision alternatives (e.g., componentsize, material used, process parameters, etc.) that hadmultifaceted interactions, i.e., a rugged landscape.Consequently, changes in project complexity coin-cided with changes in PPD risks.It is noteworthy that senior managers at MicroTech
used the same project risk tracking approach univer-sally for all types of R&D projects, even for low-risk,low-complexity R&D projects that refined existingproducts and processes. However, during project exe-cution, senior managers, project teams, and projectleaders at MicroTech used different tools and proce-dures depending on the project risk levels e.g., a six-step improvement approach for low risk project vs. afive-step innovation approach for high-risk project.At MicroTech, we found that projects based on exist-ing knowledge typically scored less than 2 in the PPDscorecards, thus carried less risk when compared withprojects focusing on creating new knowledge.During the initial stages of the project (between
Nov 2004 and Feb 2006), Sigmatel was considered lowrisk, scoring less than 2 in PPD assessments. Table 2gives the search strategy, structured approach, tools,and methods used by Sigmatel during the initialmonths prior to project shift. As seen in Table 2, theteam used tools such as Statistical Process Controlcharts, Pareto charts, FMEA (Failure Mode EffectsAnalysis), all of which emphasized efficiency andfocused on improving current product and processdesigns. They also used a six-step structuredapproach typically used with the local search strategy.According to the project leader, the project-level andorganizational-level leadership interacted very littleduring this phase. In January 2006, a “continuousplanning forum” (described in section 4.3) projectedchanges in the product and process requirements forthe suspension assemblies due to exogenous technol-ogy and market changes (advancements in a newmaterial technology to make suspension assemblies)that increased project risks over the next 2 years. It
Chandrasekaran, Linderman, Sting, and Benner: Managing R&D Project ShiftsProduction and Operations Management 25(3), pp. 390–416, © 2015 Production and Operations Management Society 397

also revealed that, due to these advancements, a localsearch strategy may not be effective to enhance themanufacturing of these miniature suspension assem-blies. These insights were made available to the prod-uct leadership team (CTO, two senior VPs and abusiness unit manager), which was responsible forevaluating technology investment decisions at Micro-Tech. The PPD staff member also used this informa-tion during her monthly update of these scorecardsalong the dimensions of manufacturing and supplyrisks for suspension assemblies.The updated PPD scorecard the project leader at
Sigmatel used in the subsequent weeks indicatedhigher levels of overall risks (exceeding a score of 3),which triggered discussions among the project lead-ers, PPD staff member and product leadership team.The product leadership team was aware of theserecent updates from the continuous planning forums,and all stakeholders agreed to stop improving the
current designs and radically change the product andprocess designs. During our initial visits in 2006,Sigmatel’s search strategy altered to distant from localsearch in response to this technological change.According to the CEO at MicroTech:
When we were analyzing our roadmaps on thisparticular technology, we realized that theincrease in development and manufacturing costsalong with the future customer demands forSigmatel can make our current manufacturingprocess redundant. We needed to find a totallynew approach to make these suspension assem-bly components. This made us reevaluate our sta-tus quo [of using existing technology] whichended up in developing this new technology.
Following this shift, Sigmatel’s resources expandedto include engineers with specific technical expertise inmaterial science and chemical etching technology. The
Table 2 Comparing Search Strategy, Tools and Methods used by SigmaTel and Tablet Before and After Project Shifts (Time in Brackets)
Time Characteristic Sigmatel Tablet
Beforeprojectshift
Search strategy (Nov 2004 – Feb 2006)Improve current product and process design;for example, minor changes to sub-assemblies
(June 2006 – Dec 2006)Improve current product and process design; forexample, minor refinements to the laptop screen
size and processor
Structured approach (Nov 2004 – Feb 2006)Define – Understand – Measure - Analyze –
Change – Control
(June 2006 – Dec 2006)Define – Measure – Analyze – Improve – Control
Tools used (Nov 2004 – Feb 2006)Ishikawa, Pareto, SPC, FMEA, 5S
(June 2006 – Dec 2006)Gap Analysis, Affinity Diagram, SPC, Pareto, Ishikawa.
Senior managementinvolvement
(Nov 2004 – Feb 2006)Minimal involvement (Only through the
PPD risk scorecards)
(June 2006 – Dec 2006)Minimal involvement (No risk tracking)
Project shift happened (Jan – Feb 2006)New material technology available to make
suspension assemblies
(Dec 2006)New developments in the supplier processor
technology used in Tablet
Afterprojectshift
Search strategy (March 2006 – Project Completion)Radically change the product and process design;for example, brought in new experts in chemical
and metallurgical engineering to develop new assemblies
(Dec 2006 – June 2007)Continue to Improve current product and process design
(June 2007 – Project Completion)Radically change the product and process design;for example, brought in new technology expertsand supplier for a different screen and processor
Structured approach (March 2006 – Project Completion)Define – Measure – Analyze – Design – Verify
(Dec 2006 – June 2007)Define – Measure – Analyze – Improve – Control
(June 2007 – Project Completion)Define – Measure – Analyze – Design – Verify
Tools used (March 2006 – Project Completion)DFMEA, Quality Function Deployment, Design for
Manufacturing, Experimental Design, Decision Analysis
(Dec 2006 – June 2007)Gap Analysis, Affinity Diagram, SPC, Pareto, Ishikawa.
(June 2007 – Project Completion)Fault-tree analysis, DFMEA, Design for Manufacturing,
X-gates
Senior managementinvolvement
(March 2006 – Project Completion)More involvement. Weekly meetings open to
senior management (PPD risk tracking)
(Dec 2006 – June 2007)Minimal involvement
(June 2007 – Project Completion)More Frequent involvement through stage gate reviews
(Risks discussed during stage gate reviews)
Chandrasekaran, Linderman, Sting, and Benner: Managing R&D Project Shifts398 Production and Operations Management 25(3), pp. 390–416, © 2015 Production and Operations Management Society

overall team size of the project increased to 70 FTE andthe overall budget increased to $65 million. From thispoint on, Sigmatel was deemed a high-risk project,and correspondingly, the management approachimmediately changed, as shown in Table 2. Forinstance, the project team began using the Define-Measure-Analyze-Design-Verify approach associatedwith a distant search strategy (instead of a six-stepimprovement approach associated with a local searchstrategy). They also used tools such as DFMEA(Design for Failure Mode Effects Analysis) andexperimental design from this point; these promotedmore experimentation and variation. This change alsotriggered an increase in the project’s visibility as seniormanagement began to closely monitor the project.Senior management (sometimes even the CEO)became a common sight at Sigmatel’s weekly projectmeetings, resulting in faster communication across thestrategic and project levels. The project team memberof Sigmatel said this about the structure:
We have a monthly review, with what we call themarket direction team, a group of senior manag-ers, directors, VPs and all the way up to our CEO.And, we put all our information together, process,equipment, manufacturing, long-range manufac-turing plans, which are presented to them. We alsohave weekly meetings that are open to senior man-agement; probably one or two show up everytime. They go over the individual process steps orindividual project with each engineer and typi-cally go over concerns and questions on that.
In terms of project outcomes, Sigmatel was a majorinnovation that yielded a breakthrough for producingsuspension assemblies, as evidenced by industryreports. Microsystems announced this innovation inits 2007 annual report. Microsystems’ stock priceincreased following this announcement and ship-ments tripled between 2008 and 2011. Appendix Cprovides a detailed timeline of the project events.During our final interviews, we found that MicroTechbegan working with its customers on the develop-ment of suspension assemblies for their next-genera-tion disk drive programs, which further corroboratesthis project’s true success.
4.2. Tablet Project at CommNetSimilar to MicroTech’s Sigmatel project, CommNet’sTablet project also experienced a project shift. UnlikeMicroTech, CommNet’s approach did not quicklyidentify and alter the project search strategy inresponse to a shift in complexity, which eventuallyresulted in a subpar and delayed product launch.The Tablet project involved designing a rugged lap-
top for use in extreme temperature and pressure con-ditions, with firefighters and police personnel among
target customers. Tablet shared many features withNexus, an existing CommNet product, but requireda wider screen size and a minor processor designchange to withstand high temperature and airpressure. The project started in June 2006 as Nexusdesign refinement. Senior management believed thatthey had all the relevant technical expertise andknowledge required to improve the product designand associated process, thus it began using a localsearch strategy. The project, managed by one full-timeproject leader and eight team members, used in its ini-tial stages the DMAIC approach and the tools listedin Table. In the beginning of the project, the R&Ddirector and business unit manager met with the pro-ject team leader to develop the project scope in termsof resources required, project deliverables, and otherrequirements. These details were aligned with thebusiness unit scorecards for that fiscal year and, oncethe scope of the project was defined, interaction withsenior managers was minimal. While MicroTech usedthe PPD approach for all R&D projects, senior man-agement at CommNet used different approaches tomonitor projects depending on their search strategy.And while MicroTech universally tracked risks for allprojects, CommNet did not do so for projects using alocal search strategy (e.g., Tablet in its early stages).Even for projects using a distant search strategy, lead-ers assessed risks only after completing a particularstage-gate phase or project milestone, rather thanweekly. For such projects, CommNet maintained fourdifferent types of scorecards members from differentorganizational levels (e.g., project team members, pro-ject leaders, R&D director) completed. This informa-tion was made available to the product leadershipteam (comprising of R&D Director and senior manag-ers in charge of new product decisions). For projectsusing local search, CommNet maintained similarscorecards, but these were not readily available to theproduct leadership team. CommNet’s scorecardswere updated annually and were based on the resultsfrom their strategic planning forum; in contrast,MicroTech had monthly updates. Overall, Comm-Net’s structured approach facilitated efficient infor-mation exchange across levels, and update frequencydepended on the project’s search strategy, anapproach consistent with the extant literature (Hutch-ison-Krupat and Kavadias 2014, Wheelwright andClark 1992). It proved also successful for monitoringprojects such as Communicate and Third Party, whichdid not experience any shifts in complexity (based onpost-project interviews).In December 2006, our first interviews at CommNet
about Tablet’s progress revealed mixed emotions onproject progress at both the strategic and projectlevels. The project was in its measurement phase whentest results indicated that improved designs of the
Chandrasekaran, Linderman, Sting, and Benner: Managing R&D Project ShiftsProduction and Operations Management 25(3), pp. 390–416, © 2015 Production and Operations Management Society 399
Nexus-based architecture and processor were notrobust enough to meet the new operating conditionsrequired for the product (high temperature andpressure demanded by the customer). The cross-levelscorecards revealed this to the R&D director, who thentold the product leadership team, which notably didnot have access to the scorecards. The project came toa halt because the product leadership team wanted theproject team to conduct additional experiments beforeabandoning the existing design. The project teamspent three additional months collecting supplemen-tary data before presenting it to the business unit man-ager. They still, however, used the tools and method(e.g., DMAIC—Define, Measure, Analyze, Improve,Control) associated with the local search strategy andhad limited resources for experimentation, even afterthe project shift. After a long delay and several meet-ings with the product leadership team, they agreedthat refining the existing design based on the Nexusplatform did not fit Tablet requirements. The projectleader said the following about the process:
There were lot of disconnects between the projectteam and senior leadership. This was not correctedduring the course of our project. It was more likethe senior managers defining what the critical suc-cess factors were and any disagreements wereresolved through additional analysis that were thencommunicated back through the normal require-ment process. Overall this resulted in some delays.
After another 3 months of delay in waiting for theproduct leadership team’s approval, Tablet’s projectscope in June 2007 shifted to involve developing acomponent architecture and a processor radically dif-ferent from the Nexus design. Senior managementfinally decided to alter the project’s search strategy(from local search to distant) and, 6 months after theshift, began using the tools and method (e.g.,DMADV—Define, Measure, Analyze, Design, Verify)related to distant search (see Table 2). CommNetselected a new supplier that specialized in this com-ponent architecture and processor and added newpersonnel to the project who had not only design anddevelopment skills but advanced degrees (PhDs).Overall project size grew to 25 members while theoverall budget increased to $20 million. The projectstarted using a stage-gate approach (X-gates), wheresenior management and the product leadership teammet with the project team at the end of each stage-gatereview. These reviews served as the only contactpoints between senior management and projectteams, which delayed information exchanges. InOctober 2007, for instance, Tablet encountered addi-tional delays in the verification stage due to vibrationissues in the new design. Our conversations with theproject leader after the project’s completion revealed
the team was unaware of the technology changes(e.g., material change for the processor technology)that happened externally. Hence, the project teamspent time and effort gathering information on thenewly available material as well as performing addi-tional tests on this new technology. The R&D Directorsaid the following about this communication delay:
We did a very poor job in our communicationduring the last 3 years because look where we areright now. Previous senior leadership team justdid not put much emphasis into a formal [com-munication] process. They wanted to more or lessdo it by themselves [during gate meetings] and sowe are kind of in a retooling mode here.
After several months of delay, Tablet finally hit themarket in May 2008.4 Appendix D provides thedetailed event timeline for the project. In terms of pro-ject performance, the product suffered from vibrationissues when compared with the competitor’s product.Business press reviews suggested the laptop’s vibra-tion issues affected its battery and processor perfor-mance. Reviews blamed the laptop’s use of “sub-parmaterial technology,” which resulted in an inferiorproduct when compared with the competition. Thelaptop was discontinued in 2009.
4.3. Cross-Case Comparison between MicroTechand CommNetAt the business-unit level, Sigmatel and Tablet showseveral similarities in terms of the processes used tomanage R&D projects. For instance, both projectsbegan as refinements to existing designs and technolo-gies using a local search strategy. Both MicroTech andCommNet used formal processes such as PPD andcross-level scorecards to track projects. At the projectlevel, both business units employed structuredapproaches (e.g., stage gates and improvement meth-ods) and maintained different tools and processes forthese projects. However, several differences emergedupon closer examination. In terms of project tracking,senior managers at MicroTech used the same universalPPD process to monitor projects and assess changes inrisks. For instance, we noticed that Customer Defects,Tech Yield, and Tech Time projects involved minormodifications to existing product or process designsusing local search, but the project leader still completedPPD scorecards to monitor risk on a weekly basis. Thebusiness unit had the same staff member who collectedtechnological and market risk data from all R&D pro-jects. Everyone in the organization was trained on thisuniversal approach to assess risks. When asked aboutthe needed training, a staff member remarked:
We have a web-based training for PPD that isdone to educate all our project leaders on the
Chandrasekaran, Linderman, Sting, and Benner: Managing R&D Project Shifts400 Production and Operations Management 25(3), pp. 390–416, © 2015 Production and Operations Management Society

purpose of collecting these risks data. This wasimplemented in 2001. Before that, it was left tothe project leader to fill in risk information thatthey think is applicable for their project. So thatwas not very helpful since they were all overthe place. Now we have a better approach togather this information.
In contrast, senior managers at CommNet utilizeddistinct approaches to track R&D projects dependingon their search strategy. Although these projects coex-isted, project leaders managed them differently anddifferent personnel were charged with data collectionand monitoring. Moreover, the product leadershipteam did not frequently review innovation projectsthat were refining existing technologies. Stage-gatereviews tracked project risks only for innovation pro-jects such as Communicate—which were developingnew product or process technologies. The same didnot apply to innovation projects such as Third Partyand Tablet (in its initial stages) that involved minorrefinements to existing product or process designs.MicroTech and CommNet also showed major differ-ences in how they communicated decisions betweenthe strategic and project levels (i.e., between seniormanagement and project team personnel). At Micro-Tech, structured communications took place weeklythrough the PPD scorecard updates for all R&D pro-jects, while at CommNet, frequent updates were onlytracked for projects developing new technologies, butnot for projects with minor refinements to existingtechnologies.
4.3.1. Inputs to PPD and Cross-Level Scorecards.To examine potential reasons for different projectoutcomes at MicroTech and CommNet, we furtherconsidered the inputs into the PPD and cross-levelscorecards. MicroTech and CommNet had few differ-ences in the inputs as it related to project search strat-egy. Both relied heavily on their planning forums forcritical information. However, the cross-case compari-sons show substantial differences in the way theseunits held their planning forums.MicroTech had a continuous planning process with
a full-time planning manager who constantly moni-tored changes in product, process, measurement, ser-vice, and supply chain technologies happeningexternally. This manager also was responsible fordeveloping technology roadmaps that projected theevolution of MicroTech’s key technologies. This plan-ning manager worked closely with the PPD staff todetermine technology and market risks associatedwith the roadmaps. The roadmaps themselvesinvolved a sequential process starting with theproduct, followed by process, metrology, quality, andservice roadmaps. The senior leadership team
received all this information on a monthly basis. Thebusiness unit president told us that the continuousplanning approach helped MicroTech reduce its plan-ning horizon to 3 years from 10 years while most ofMicroTech’s competitors were still on a 10-year plan-ning horizon. Monthly updates to product, process,metrology, quality, and service technologies providedreal-time information to the PPD scorecards. Whenasked about this planning process, the business unitpresident said the following:
We have decision processes that are pretty big,which helps us to adjust and readjust our focus.We have got a continuous planning processwhich happens throughout the year where weare stepping back and looking at our number ofkey players in the engineering side and the opera-tion side and the metrology side, etc. And wekeep revisiting, trying to understand where ourmarketplace is going: Where are new opportuni-ties? What is happening with the requirements?What does all our market stuff imply for what wereally have to do this year, next year, and for thenext five, six, seven, 8 years? And so do we havethe discipline in our house? So we try to keep anongoing view of what is our interim issue andwhat is our long-term issue. And then what doesthat imply if we were to be a market leader in ourbusiness. And in some cases, this may cause us touse our existing capabilities. In other cases, wemay have to develop capabilities and technolo-gies that may be completely new, what we havegot is enough representation along electrical engi-neering, chemical, mechanical engineering andmetrology.
CommNet also used results from the planning for-ums as inputs to the cross-level scorecards. However,the strategic planning process at CommNet was anannual planning event and was not updated on areal-time basis. Strategic planning occurred at thebeginning of the fiscal year and used informationabout current and future trends. This weeklong eventfocused on mapping the company’s product and ser-vice trajectories based on customer and technologicalinformation. It involved various personnel from engi-neering, marketing, R&D, and senior leadership. Theplanning horizons at CommNet typically spanned5–10 years, the industry standard. Results from theseforums became inputs to the business unit scorecardsto make resource allocation and funding decisionsfor different types of projects for that year. UnlikeMicroTech, CommNet did not have full-time staff toconstantly refresh its roadmaps on a monthly basis.Consequently, the scorecards’ information about thetechnology landscape was not up-to-date, so project
Chandrasekaran, Linderman, Sting, and Benner: Managing R&D Project ShiftsProduction and Operations Management 25(3), pp. 390–416, © 2015 Production and Operations Management Society 401

team members as well as senior management wereless knowledgeable about emerging technologies. Inthe case of Tablet project, this proved costly as teammembers were unaware of developments in materialtechnology for the processor that could haveresolved the vibration issues in the laptop. Instead,they spent valuable time and effort collecting andanalyzing additional data around the existing config-uration, which eventually led to losing the race tocompetitors.Comparing these planning processes shows major
differences in how MicroTech and CommNet identi-fied project shifts and dealt with a shift in technologylandscape. At MicroTech, the connection betweenPPD and continuous planning forums that occurredmonthly helped the Sigmatel project obtain real-timeinformation about a shift in the technology landscape.Project team members quickly identified that improv-ing the existing technology using a local search strat-egy would not resolve the issues making suspensionassemblies with the current process. In contrast, Tab-let project team members lacked real-time updatesabout emerging processor technologies, which theysaid was a major factor in the delayed launch. Real-time updates from the continuous planning process atMicroTech also ensured that both senior managementand project personnel were aware of relevanttechnological changes. As a result, quicker action (i.e.,altering the project search strategy) could be takenwhen PPD scorecards indicated higher levels of risks,
as in the case of Sigmatel. Given the absence of theseupdates at CommNet, senior managers and the pro-ject team failed to quickly react on the project shift,which resulted in extensive delays.In addition, frequent (weekly) communication
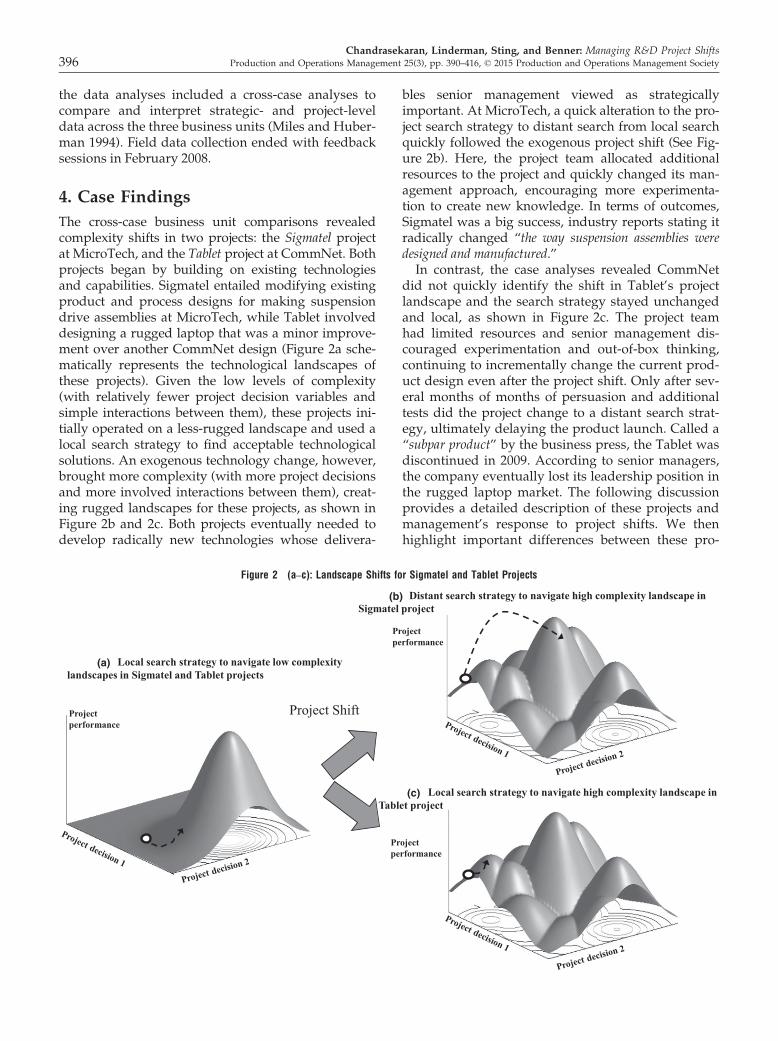
across different organizational levels at MicroTechfacilitated by using the same PPD process for all R&Dprojects helped identify and manage changes in com-plexity for the Sigmatel project. In contrast, CommNetused separate scorecards for projects based on searchstrategy, which failed to identify changes to projectcomplexity for Tablet. Figures 3a and b summarizethe processes at MicroTech and CommNet.
4.4. Comparing Findings with Current LiteratureWe also iterated between the case data and extant lit-erature, which helped both illuminate and contrastour findings with existing theories. Findings from theCommNet case were consistent with existing theorieson how to manage different types of R&D projects.For instance, CommNet had an annual strategic plan-ning process that senior managers from various back-grounds (e.g., technology, operations, marketing, etc.)attended to gather technology and market informa-tion. CommNet’s approach to conducting annual stra-tegic planning forums is generally consistent withthe literature (e.g., Hamel 1996). Researchers haveattributed variations in the length of planning cycles(annual vs. shorter) to the amount of resourcesrequired for this planning process (Grant 2003). The
At MicroTech
Technology and Market Changes
Continuous Planning
Cross-level Communication
Product Leadership Team
Universal Risk Tracking for all R&D Projects
Monthly
Weekly
Technology and Market Changes
Annual Strategic Planning
Yearly
Product Leadership Team
Business Unit Scorecards
Director Level Scorecards
Director Level Scorecards
Project Level Scorecards
Project Level Scorecards
During stage gates
Adhoc Communication
Projects using Local Search Strategy
Projects using Distant Search Strategy
At CommNet and CommTech(a) (b)
Figure 3 (a & b): Managing R&D Project Shifts
Chandrasekaran, Linderman, Sting, and Benner: Managing R&D Project Shifts402 Production and Operations Management 25(3), pp. 390–416, © 2015 Production and Operations Management Society

information from strategic planning forums was usedwhen deciding on portfolio project mix for the fiscalyear, which is also consistent with the literature (Chaoand Kavadias 2008). Senior management at CommNettracked progress in their innovation projects usingdifferent scorecards. For instance, senior managementat CommNet closely monitored innovation activi-ties using distant search strategies with frequent“information exchanges” between strategic andproject-level members at the end of each stage gate(Andriopoulos and Lewis 2009). They promoted moreexperimentation and risk-taking behaviors for theseproject teams to create new knowledge. Similarly, theproject management adopted a local search strategyand became more decentralized with little seniormanagement involvement once projects in these unitswere classified as refinements to existing technologiesbased on their annual strategic plans. Senior leader-ship did not encourage experimentation and learnedof changes on a “need-to-know” basis. In general, themechanisms employed at CommTech to manageR&D projects (as seen in Figure 3b) are consistentwith the existing literature. However, such anapproach failed to identify and to effectively manageshifts in project complexity.On the other hand, findings from the MicroTech
case were inconsistent with existing project-manage-ment theories. It is this inconsistency, however, thatoffers novel insights on how high-tech business unitscan effectively identify and manage project shifts.The cross-case analyses identify three distinct mecha-nisms MicroTech used (absent at CommNet) thatenabled team members to identify changes to Sigma-tel’s project complexity and appropriately altersearch strategy. We refer to these mechanisms as“enablers of responsive search.” Specifically, theyinclude: a universal metric for evaluating project riskacross all types of R&D projects, a weekly cross-levelcommunication process, and a process for monitor-ing ongoing changes in the external environment(See Table 3). These mechanisms were at multiplelevels within MicroTech. They were interconnectedand enabled responsive search, that is, the projectquickly altered between local and distant search. Inwhat follows, we describe the three interactingmechanisms.(i) Universal Project Risk Evaluation Metric. At Micro-
Tech, senior managers used the same mechanism tocontinuously assess risks for all R&D projects. Thisallowed MicroTech to identify exogenous changes inproject complexity and risks. It further allowed Mic-roTech to alter their project search strategy. This find-ing does not align well with current theories onproduct development (Wheelwright and Clark 1992).That is, studies suggest using different risk-trackingprocesses for R&D projects based on their search Ta
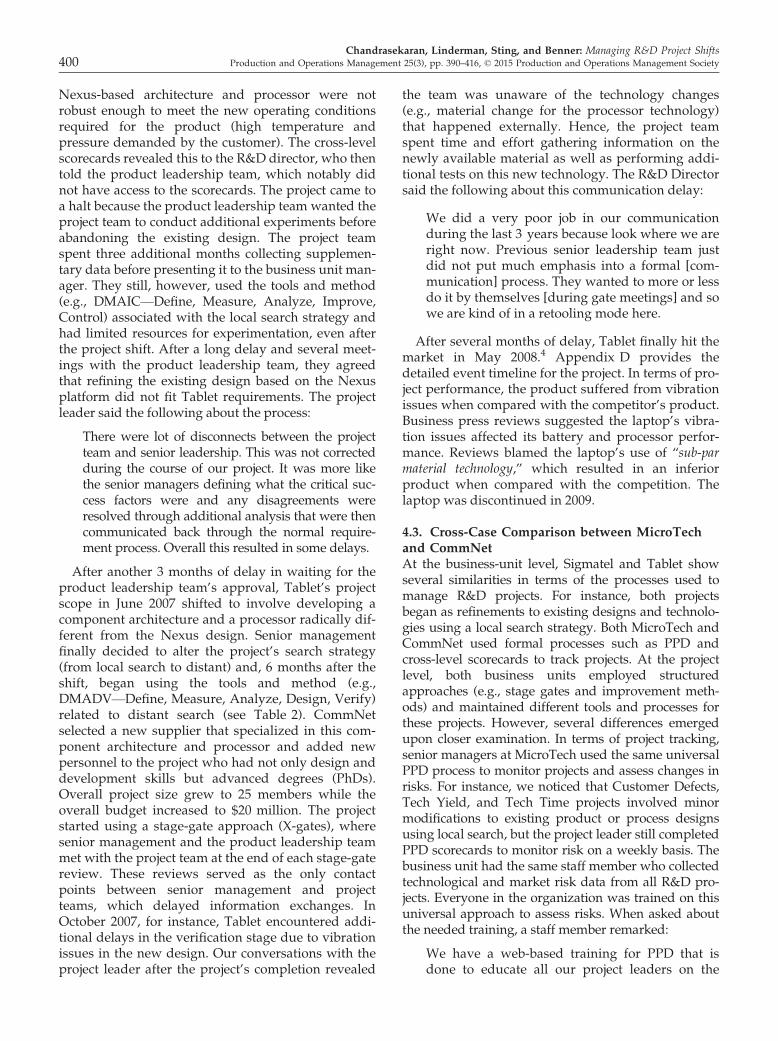
ble3
Project
Com
parisons
Sigmatel
(MicroTech)
VisionPlus
(MicroTech)
Video
Share
(Com
mTech)
Com
municate
(Com
mNet)
Tablet
(Com
mNet)
Tech
Yield
(MicroTech)
Tech
Time
(MicroTech)
Customer
Defects
(MicroTech)
Third-Party
(Com
mNet)
Cost-
Reduction
(Com
mTech)
Drive
Inno
vation*
(MicroTech)
Tech
Z*
(Com
mTech)
Project
Shift?
Yes
No
No
No
Yes
No
No
No
No
No
Yes
Yes
Plann
ing
Process
Con
tinuous
(monthly
updates)
Con
tinuous
(monthly
updates)
Ann
ual
(yearly
updates)
Ann
ual
(yearly
updates)
Ann
ual
(yearly
updates)
Con
tinuous
(monthly
updates)
Con
tinuous
(monthly
updates)
Annual
(yearly
updates)
Annual
(yearly
updates)
Annual
(yearly
updates)
Con
tinuous
(monthly
updates)
Ann
ual(yearly
updates)
Cross-Level
Com
munication
PPDProcess
(weekly)
PPDProcess
(weekly)
Inno
vation
Scorecards
(during
stagegates)
Inno
vation
Scorecards
(during
stagegates)
Inno
vation
Scorecards
(during
stagegates)
PPDProcess
(weekly)
PPDProcess
(weekly)
PPDProcess
(weekly)
Adhoc
Adhoc
PPDProcess
(weekly)
Inno
vation
Scorecards
(duringstage
gates)
Universal
Risk
Tracking
Don
eevery
week
Don
eevery
week
Don
edu
ring
stagegates
Don
edu
ring
stagegates
Not
Don
eDon
eevery
week
Don
eevery
week
Not
Don
eNot
Don
eNot
Don
eDon
eeveryweek
Don
edu
ring
stagegates
Perform
ance
onmanaging
projectshift
Successfully
managed
shifts
NA
NA
NA
Failedto
identifyand
manage
shifts
NA
NA
NA
NA
NA
Successfully
managed
shifts
Failedto
identifyand
manageshifts
*Sam
pled
afteranalyzingthecases.
Chandrasekaran, Linderman, Sting, and Benner: Managing R&D Project ShiftsProduction and Operations Management 25(3), pp. 390–416, © 2015 Production and Operations Management Society 403

strategies (a more frequent risk-tracking approach forprojects using a distant search strategy, and a less fre-quent and ad-hoc approach for projects using localsearch strategy) (Cooper et al. 2002). Had MicroTechfollowed this conventional approach, however, itwould have taken much more time and effort to shiftSigmatel from local search to improve existing com-ponent design (one that could not have withstoodproduct miniaturization) to a distant search of radi-cally innovating a new component design (one thatcould).(ii) Weekly Cross-Level Communication Process. Micro-
Tech used the same project tracking approach (e.g.,PPD) for communicating between strategic and pro-ject levels on a weekly basis. It promoted frequentinteractions between senior leadership (e.g., CTO/Senior VPs) and the project teams. The effectivenessof this weekly cross-level communication processchallenges existing coordination theories (e.g., Rous-seau 1985, Sinha and Van de Ven 2005), which recom-mend against frequent cross-level interactions due toan increase in workload. Instead, MicroTech’s weeklycross-level communication mechanism was fairlysimple and involved continuous monitoring ofchanges in project risks. This approach had dual bene-fits to both project teams and senior leaders. It pro-moted both top-down and bottom-up informationexchanges without substantial coordination costs(once implemented). For project teams, this communi-cation mechanism also provided weekly updatesfrom continuous planning, creating more awarenessof technology and market changes. For senior leaders,this mechanism quickly communicated changes inproject complexity, which helped them rapidly adjuststrategic level goals.(iii) Continuous planning process. MicroTech used a
continuous planning process that involved gatheringreal-time updates on technology and market changesevery month through the use of a full-time planningstaff member. This is in contrast to the literature thatdescribes strategic planning as “a calendar-driven rit-ual. . .which assumes that the future is more like thepresent” (Hamel 1996). The PPD scorecards providedupdates from the continuous planning process to theproject team members, who used it as a critical inputfor the risk assessments in the scorecards. Havingreal-time changes to the risk metrics meant seniormanagers could revisit the decisions on R&D oppor-tunities even after they made the decisions. The pres-ence of this continuous planning process also differsfrom current theories that advocate calendar-drivendecision making with planning horizons of 5–10 years (Barczak et al. 2009). Rather, the continuousplanning shortened the planning horizons to 2–3 years, and senior managers’ roles changed from
reviewing and approving to debating and decidingon decision alternatives.Taken together, the three interconnected mecha-
nisms enabled responsive search at MicroTech (seenin Figure 3a). That is, they allowed MicroTech torespond to landscape shifts by altering Sigmatel pro-ject’s search strategy to distant search from localsearch. However, strategic-level interviews with Mic-roTech suggested the enablers of responsive searchincurred setup costs. For instance, the business unitpresident revealed that developing PPD scorecardswas an onerous task that required assessing the tech-nological and market risks associated with the prod-uct and processes developed in the business unit. Infact, MicroTech’s senior management team spent6 months developing the risk scorecards. In addition,MicroTech needed to train all project leaders on theimportance of evaluating project risks on a weeklybasis and hired a full-time planning specialist toconstantly monitor changes in product, process andtechnology roadmaps. This resulted in substantialinitial investments. According to the president atMicroTech:
The protocol writing [for our PPD] and the crite-rion requirements really took us more than6 months. And this is because, once wedesigned the initial protocol, we have got every-body to approve it, everybody had changes andwe went a few rounds that way. There wasquite a bit of work in getting that piece in place.
In spite of the significant implementation cost andthe extensive involvement of several personnel (e.g.,project leaders, product leadership team, continuousplanning staff, PPD staff, etc.), our findings suggestthat once implemented, these enablers of responsivesearch (i.e., all three mechanisms) did not incur sub-stantial additional operating costs. Moreover, thesemechanisms were well integrated into their regularresponsibilities, thus did not impose additional oper-ating constraints. For instance, the project leader’s riskscorecard completion took little time and became apart of the weekly routine. One project leader com-mented that it was as simple as “completing a surveyregarding the project status” every week. Toward theend of the project, the risk levels were known andthey could stop monitoring the risks. The PPD staffmember noted that once a project has completed itsmanufacturing verification review it no longerrequired the PPD approach. Overall, the individualresponsibilities of project leaders, PPD staff andsenior leaders seemed less onerous given the overalltask of identifying and managing project shifts. Toconclude, the following propositions summarize ourfindings on the enablers of responsive search and
Chandrasekaran, Linderman, Sting, and Benner: Managing R&D Project Shifts404 Production and Operations Management 25(3), pp. 390–416, © 2015 Production and Operations Management Society

their effectiveness in identifying and managing pro-ject shifts.
PROPOSITION 1A. The combined use of continuous plan-ning, universal risk tracking and weekly cross-level com-munication enables responsive search.
PROPOSITION 1B. Responsive search is positively associ-ated with project performance in environments prone toproject shifts.
4.5. Robustness Checks for case analysesWe conducted several robustness checks tostrengthen the findings from the case analyses. First,eight projects in the case study (see Table 3) did notexperience any project shifts. This may raise concernsabout the frequency of project shifts in these settings.To address these concerns, we revisited our data toexamine whether there were any other instances ofproject shift. Experts from our interviews suggestedthat two projects, Drive Innovation (low complexity tohigh complexity) from MicroTech and Tech Z (highcomplexity to low complexity) from CommTech, alsoexperienced project shifts. Appendix E gives thedetails of these projects. More importantly, and con-sistent with the findings, the responsive search ena-blers at MicroTech helped identify and alter thesearch strategy (to local search from distant search)for Drive Innovation, while the Tech Z project experi-enced significant delays due to the absence of these e-nablers at CommTech. Tech Z continued to search fornew technologies when the customer and market-trend changes required it to use pre-existing solutionsavailable to CommTech. Eventually, CommTech lostsignificant market share on this technology to its com-petition.Second, the case analyses revealed that project com-
plexity changed due to exogenous factors (e.g., cus-tomer preferences, technology changes). To rule outany internal project causes, we reanalyzed the data toexamine whether any factors in the control of projectteams (e.g., project personnel turnover, incentives,and poor management) created these shifts. Forinstance, one might argue that Sigmatel could havelost key personnel. Our analyses revealed no signifi-cant differences among these factors between projectsthat shifted and those that did not, minimizing suchconcerns. For example, turnover rates for the Sigmatelproject were comparable to that of Vision Plusprojects.Finally, CommNet and CommTech had a few
projects that were not completed during our visits butwe were able to collect follow-up information.For instance, Video Share and Third Party did notexperience any project shifts and concluded success-fully at CommTech and CommNet using distant
search and local search strategies, respectively. Thisfurther minimizes concerns that the Tablet and TechZ failures were due to CommNet and CommTech’sinability to manage R&D projects.
5. Simulation Study: TheoryRefinement and Augmentation
Although case studies help gain rich insights onresponsive search and its enablers, this approach doesnot allow us to disentangle the benefits of responsivesearch from other organization effects at MicroTech.Moreover, all three business units in our cases comefrom industries with high technological turbulence(i.e., a high likelihood that the level of complexitychanges) and time-to-market pressures. Our caseapproach therefore does not let us assess how varyingindustry level conditions affect the performance ofresponsive search.To address these limitations, we built an agent-
based simulation model that captures the rich andnon-linear dynamics of complexity shifts in the casestudy projects. Specifically, we use organizationalfitness landscapes to investigate different search strat-egies, as proposed by Levinthal (1997). This canonicalapproach adopts Kauffman’s (1993) NK model to rep-resent the project’s technological performance land-scape. The NK model has been widely used and iswell suited to capture a project’s search strategy onperformance landscape (e.g., Kavadias and Sommer2009, Rivkin and Siggelkow 2003, Siggelkow andRivkin 2005). Results from the model can helpaugment the propositions developed from the casestudies. That is, the simulations allow us to comparethe performance benefits from responsive searchfound at MicroTech (Figure 3a) to other canonicalsearch strategies in R&D projects. Furthermore, thesimulations can help assess how much the speed ofsensing and responding to landscape shifts contributeto project performance. We now describe the keymodel ingredients.Project Landscapes. In the NK model of a technology
landscape, a number of N specifications define theproject’s current technological configuration, that is,the project’s coordinates in the landscape. Forinstance, in the case of CommNet’s Tablet project,specifications for the processor, screen size and otherfeatures reflect the technological configuration. For-mally, the project configuration is given by a specifi-cation vector s = (s1, . . ., si, . . ., sN), where, forsimplicity, each specification si is either 0 or 1. Theentire landscape, therefore, consists of 2N potentialproject configurations. A performance function PðsÞmaps the N-dimensional project configuration onto aone-dimensional performance measure (a project’scurrent performance on the landscape). By definition,
Chandrasekaran, Linderman, Sting, and Benner: Managing R&D Project ShiftsProduction and Operations Management 25(3), pp. 390–416, © 2015 Production and Operations Management Society 405

the landscapes of innovation projects differ based ontheir levels of complexity, with less complex projectshaving a “smooth” landscape (hence easier to search)and more complex projects having a “rugged” land-scape (hence more difficult to search) (Miller andPage 2007). Whether they appear smooth or ruggeddepends on complexity parameter K. That is, environ-ments of projects such as Tech Yield, Tech Time, CostReduction, etc., can be represented by smooth land-scapes as project specifications are relatively indepen-dent due to low complexity, while projects such asVision Plus and Communicate have rugged land-scapes. Here, specifications have dense interactions.To capture different landscape structures, let pidenote the performance contribution of variable si.Project landscapes appear (more or less) ruggedbecause pi depends not only on the specification si butalso on the value of K other specifications; denoted bythe vector s�i = (si1, . . ., siK). For every possible com-bination of (si1, . . ., siK), a random draw from a stan-dardized uniform distribution determines theperformance contribution pi(si, s�i) of the interactions.The overall project performance is the average of allvariables’ contributions. Formally, we define projectperformance as
PðsÞ ¼XN
i¼1
piðsi; s�iÞN
;
This function defines the one-dimensional perfor-mance for all project configurations on the land-scape.Modeling Shifts in the Project Landscapes. The project
landscapes that we consider are prone to exogenouslandscape shifts, triggered by technological turbu-lence, as evidenced by the case studies. Parameter srepresents the probability that the complexity of alandscape shifts in any given period t of the pro-ject’s search process. That is, s represents the techno-logical turbulence experienced in these settings. Alandscape shift affects PðsÞ due to changes in land-scape complexity or ruggedness. A landscape’s rug-gedness shifts from K = Kl to K = Kh, or vice versafrom K = Kh to K = Kl, where Kl < Kh, and where alandscape’s initial K is drawn from these twoparameters by nature with equal probabilities. Amore rugged landscape (as represented by Kh) mayemerge when newly identified technologies featuremore involved interactions between project decisionvariables. Such a project shift is exemplified by theadvent of a groundbreaking technological change inCommNet’s Tablet project, which led to the emer-gence of a more rugged technology landscape thatrequired distant search. In contrast, a less ruggedlandscape (as represented by Kl) may appear wheninitially novel and complex technologies standardize
during the course of the project. For instance, domi-nant designs have appeared that feature well-defined interfaces, which the project can easilyadopt into its R&D program. In our case study, theTech Z project from CommTech experienced such ashift (see Appendix E). This project started out on acomplex landscape requiring distant search strategy,but the landscape leveled out in the course of theproject, as technologies required were readily avail-able from CommTech’s development teams in Eur-ope. Once such a landscape shift has occurred, newvalues are assigned to pi(si, s�i)—based on a randomdraw from a standardized uniform distribution. Thisrenewed valuation corresponds to an updated bodyof technology information in our project cases. Anexogenous landscape shift gives rise to a period-spe-cific landscape structure, which is embodied in andformalized by the period-specific performance func-tion PðtÞ.Project R&D Search Strategies. We modeled four dif-
ferent strategies to represent a project’s R&D search.Three of these were found in our study, while thefourth is well established in the organizational learn-ing literature. A description of the search mechanismsfollows.
1. Local search strategy—In this strategy, the pro-ject only searches locally to improve existingtechnology. In every period, it iteratively picksa single variable si, evaluates whether changingits specifications (from 0 to 1, or vice versa)improves project performance PðtÞðsÞ, and thenupdates the project configuration. CommNet’sTablet project initially used local search.
2. Distant search strategy—In this strategy, the pro-ject only uses distant search to look for newtechnological possibilities. This approach takes“long jumps” every period, generating a set ofnew specification vectors s whose N variableswere simultaneously altered to arrive at ran-dom position on the landscape. It then evalu-ates this position and adopts it if the newconfiguration enhances performance. Comm-Tech’s Video Sharing project followed this typeof mechanism.
3. Responsive search strategy—In this strategy, theproject searches distantly if the landscape hasrecently (i.e., in the last period) changed to amore rugged appearance (from Kl to Kh), but itotherwise searches locally. That is, thisapproach alters the project’s search strategywhenever there is an exogenous landscapeshift. It precisely captures the responsivesearch of MicroTech’s Sigmatel project, enabledby weekly communication across levels, uni-versal risk-evaluation metrics and continuousplanning process. It does not include any other
Chandrasekaran, Linderman, Sting, and Benner: Managing R&D Project Shifts406 Production and Operations Management 25(3), pp. 390–416, © 2015 Production and Operations Management Society
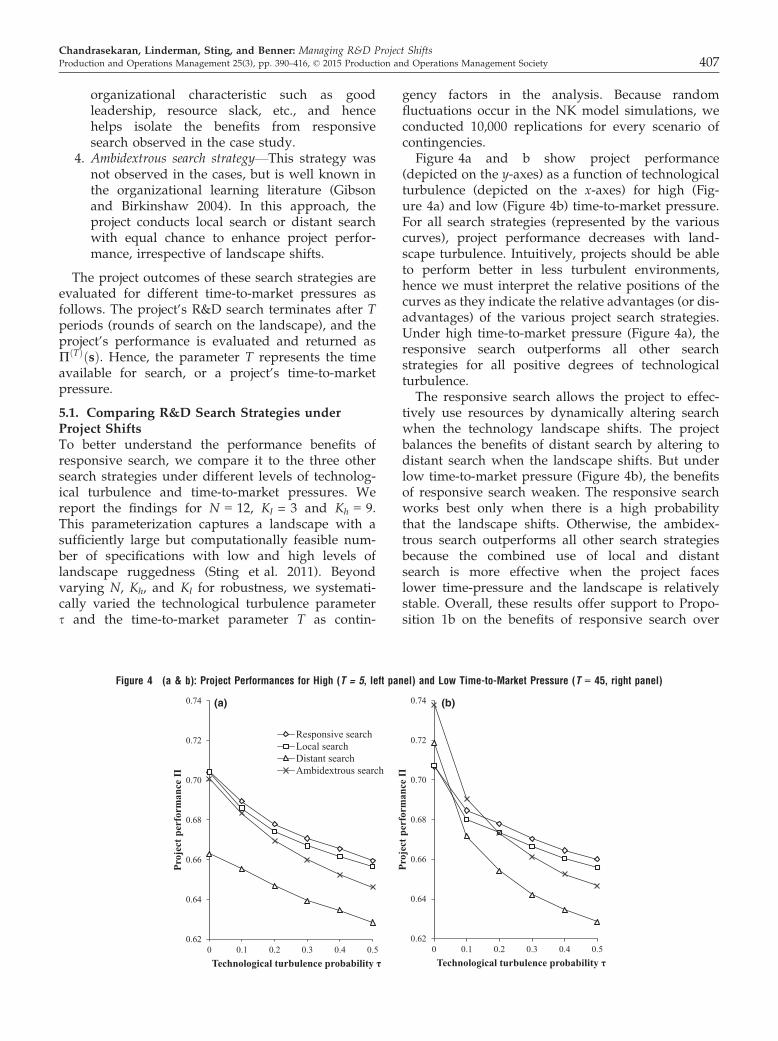
organizational characteristic such as goodleadership, resource slack, etc., and hencehelps isolate the benefits from responsivesearch observed in the case study.
4. Ambidextrous search strategy—This strategy wasnot observed in the cases, but is well known inthe organizational learning literature (Gibsonand Birkinshaw 2004). In this approach, theproject conducts local search or distant searchwith equal chance to enhance project perfor-mance, irrespective of landscape shifts.
The project outcomes of these search strategies areevaluated for different time-to-market pressures asfollows. The project’s R&D search terminates after Tperiods (rounds of search on the landscape), and theproject’s performance is evaluated and returned asPðTÞðsÞ. Hence, the parameter T represents the timeavailable for search, or a project’s time-to-marketpressure.
5.1. Comparing R&D Search Strategies underProject ShiftsTo better understand the performance benefits ofresponsive search, we compare it to the three othersearch strategies under different levels of technolog-ical turbulence and time-to-market pressures. Wereport the findings for N = 12, Kl = 3 and Kh = 9.This parameterization captures a landscape with asufficiently large but computationally feasible num-ber of specifications with low and high levels oflandscape ruggedness (Sting et al. 2011). Beyondvarying N, Kh, and Kl for robustness, we systemati-cally varied the technological turbulence parameters and the time-to-market parameter T as contin-
gency factors in the analysis. Because randomfluctuations occur in the NK model simulations, weconducted 10,000 replications for every scenario ofcontingencies.Figure 4a and b show project performance
(depicted on the y-axes) as a function of technologicalturbulence (depicted on the x-axes) for high (Fig-ure 4a) and low (Figure 4b) time-to-market pressure.For all search strategies (represented by the variouscurves), project performance decreases with land-scape turbulence. Intuitively, projects should be ableto perform better in less turbulent environments,hence we must interpret the relative positions of thecurves as they indicate the relative advantages (or dis-advantages) of the various project search strategies.Under high time-to-market pressure (Figure 4a), theresponsive search outperforms all other searchstrategies for all positive degrees of technologicalturbulence.The responsive search allows the project to effec-
tively use resources by dynamically altering searchwhen the technology landscape shifts. The projectbalances the benefits of distant search by altering todistant search when the landscape shifts. But underlow time-to-market pressure (Figure 4b), the benefitsof responsive search weaken. The responsive searchworks best only when there is a high probabilitythat the landscape shifts. Otherwise, the ambidex-trous search outperforms all other search strategiesbecause the combined use of local and distantsearch is more effective when the project faceslower time-pressure and the landscape is relativelystable. Overall, these results offer support to Propo-sition 1b on the benefits of responsive search over
0.62
0.64
0.66
0.68
0.70
0.72
0.74
0 0.1 0.2 0.3 0.4 0.5
Proj
ect p
erfo
rman
ce Π
Technological turbulence probability τ
Responsive searchLocal searchDistant searchAmbidextrous search
0.62
0.64
0.66
0.68
0.70
0.72
0.74
0 0.1 0.2 0.3 0.4 0.5
Proj
ect p
erfo
rman
ce Π
Technological turbulence probability τ
(a) (b)
Figure 4 (a & b): Project Performances for High (T = 5, left panel) and Low Time-to-Market Pressure (T = 45, right panel)
Chandrasekaran, Linderman, Sting, and Benner: Managing R&D Project ShiftsProduction and Operations Management 25(3), pp. 390–416, © 2015 Production and Operations Management Society 407

other search strategies (including ambidextroussearch, not observed in our cases) under high tech-nological turbulence and high time-to-market pres-sures. In addition, it also helps identify theboundary conditions of the responsive search byelucidating contingency factors that influence therelative benefits of the responsive search mecha-nism, as indicated in the following proposition:
PROPOSITION 2. The performance of responsive search iscontingent on technological turbulence and time-to-mar-ket pressure, that is, responsive search is beneficial forprojects under high technological turbulence or hightime-to-market pressure. Its performance advantagedecreases when both technological turbulence and time-to-market pressure are low.
5.2. Examining the Value of Sensing andResponding to Project ShiftsThe previous analysis shows that responsive searchhas the most benefits in environments with hightechnological turbulence and high time-to-marketpressure. The case analysis and Proposition 1a sug-gest that the three interconnected mechanisms (i.e.,continuous planning, universal risk tracking andweekly cross-level communication) enabled respon-sive search at MicroTech. In this simulation experi-ment, we examine the extent to which the presenceof all three mechanisms contributes to responsivesearch. We examine this issue by incorporatingdelays (D) for detecting and responding to land-scape shifts and direct its search on the new land-scape. This part of the simulation helps augmentProposition 1a on the benefits of responsive searchenablers without interference of any other effectat MicroTech. The absence of any of these mech-anisms might delay the response to landscapeshifts.Under high responsiveness (delay D = 0 time peri-
ods, the default reported in Figure 4a and b), a projectimmediately can sense landscape shifts and adjust itssearch strategy to the new landscape (responsivesearch without any delay). Under lower responsive-ness, the project will alter its search strategy only aftera delay (D = 1 or more time periods). Before thisdelay has elapsed, the project cannot alter its searchstrategy and continues to evaluate technology config-urations as if it were still on the outdated landscapefrom period t to D. Hence, a lagged project formallyadjusts its R&D activities toward the (outdated) land-scape performance objective Pðmaxft�D;0gÞ in everyperiod t.Figure 5 shows the relative benefits of altering the
projects search strategy under varying levels of tech-nological turbulence. First, and most strikingly, we
observe that an additional delay period causes thelargest difference in performance between a projectwith a zero time lag (D = 0) and a project with atime lag of only one period (D = 1). This corrobo-rates the value of responding immediately to land-scape shifts, and underscores the importance ofhaving all three enablers of responsive search (asevidenced in Proposition 1a). Second, the value ofsensing and rapidly responding to a landscape shiftis highest when the likelihood for such shifts s ishigh. This can be seen by the fact that a project witha timely response is much less affected by additionaltechnological turbulence than a project whoseresponse is lagged. Figure 5 shows the situationwhere the project faces high time-to-market pressure(T = 5), but the results consistently hold under lowtime-to-market pressure (T = 25 and 45). Overall,this result illuminates the importance of implement-ing all three enabling mechanisms to ensure a timelyresponse.To summarize, the simulation experiments enhance
the external validity of our case findings by corrobo-rating the benefits of managing project shifts viaresponsive search. They also illuminate the boundaryconditions of responsive search and show that it iscontingent on the level of technological turbulenceand time-to-market pressure. In addition, resultsshow that the responsive search has increasing bene-fits when it can more quickly respond to exogenouschanges (approaches D = 0).We also conducted the following additional analy-
ses to ensure robustness of our simulation results.First, we examined the effect of larger project sizes byvarying N from 12 to 24. Second, we analyzed how
0.50
0.55
0.60
0.65
0.70
0 0.1 0.2 0.3 0.4 0.5
Proj
ect p
erfo
rman
ce Π
Technological turbulence probability τ
D=0 D=1D=2 D=3D=4 D=5
Implementation delay
Figure 5 Project Performances under Varied Responsiveness to Land-scape Shifts for High Time to Market Pressure (T = 5)
Chandrasekaran, Linderman, Sting, and Benner: Managing R&D Project Shifts408 Production and Operations Management 25(3), pp. 390–416, © 2015 Production and Operations Management Society
higher levels of project complexity affect the resultsby setting Kl = 6 and Kh = 12. Third, we examined theeffect of increased resource availabilities by doublingthe number of search steps that a project can performper period. Our results remained stable under all ofthese variations. (To enhance replicability of ourresults, we offer a pseudo-code of our simulationmodel in the Appendix F).
6. Conclusions
6.1. Implications for Theory and PracticeAlthough research has considered how to manageinnovation projects with different search strategies(Hayes et al. 2005, Sommer and Loch 2004, Wheel-wright and Clark 1992), it has not examined theoperational realities that firms face when an exoge-nous change in technology occurs. Projects thatstarted out using a local search strategy may need tomake a midcourse correction and shift to a distantsearch strategy due to exogenous changes in theproject’s level of complexity. This study suggeststhat the ability to identify and manage such projectshifts by altering their search strategy affects projectoutcomes. Prior research has examined eitherproject selection decisions (Loch and Kavadias 2002,Sommer and Loch 2004, Wheelwright and Clark1992) or project execution decisions (Carrillo andGaimon 2004, Swink et al. 2006), while intermediatedecisions on altering a project’s fundamental searchstrategy have received scant attention. Supportingthis view, Hayes et al. (2005) note that “top managersoften fundamentally misunderstand what is required tomanage [an innovation] project funnel. Many confinetheir involvement to either reviewing project conceptsand selecting specific projects (front end of the funnel) ormanaging the resulting product’s production ramp-upand market roll-out (back end of the funnel). . .. However,they tend to avoid the tough but essential decisionsregarding whether to stop [or alter already ongoing] pro-jects (pp. 232–233).” Our study contributes to thisgap by unearthing the benefits of sensing andresponding to technological changes and then alter-ing the project’s fundamental direction (the middlepart of the innovation funnel). Enabled by trackingtechnological risks, responsive search offers oneapproach by adjusting project search accordingly.Traditional approaches to manage R&D projects donot dynamically sense and respond to exogenoustechnological changes. Projects are not cast in stoneonce launched, but often need to be adjusted andreoriented after they have been launched. Our find-ings therefore contribute to the emerging literatureon project management that deals with mid-projecttermination or correction decisions (Chan et al.2007).
Second, by taking a multilevel view, our studyhelps explain how high-tech organizations solve the“innovation to organizations” problem of connect-ing R&D decisions across strategy and operations(Dougherty and Hardy 1996, Hutchison-Krupat andKavadias 2014). To date, research has taken a piece-meal (either strategic or operational) approach thatoften has failed to recognize the cross-level connec-tions and interdependencies. Even the limited num-ber of studies that adopt a multilevel approach(e.g., Andriopoulos and Lewis 2009, Dougherty andHardy 1996) often suggest an organization-leveltop-down approach, developing an R&D strategyand executing it employing projects with appropri-ate search strategies (Jansen et al. 2009). In contrast,our study shows that project-level changes in riskscan (and will) affect strategic technology decisionsat the organizational level in a bottom-up fashion.The responsive search that emerges in this studycreates reinforcing feedback loops between projectexecution and strategic project selection. This find-ing thus contributes to the emerging literature inNPD that argues how operational-level (i.e., project-level) decisions affect the overall strategic decisionssenior managers make (Hutchison-Krupat and Kav-adias 2014).Third, our findings also contribute to the growing
research on how to manage different types of R&Dprojects. For instance, the majority of research on thistopic focuses on a static conceptualization of R&Dprojects (e.g., Wheelwright and Clark 1992, Chandr-asekaran et al. 2014, Chao and Kavadias 2008). Thatis, they do not account for changes in project complex-ity during its course. Although some studies in thisstream take a more dynamic approach to manageR&D (Lavie and Rosenkopf 2006, 2011, Nickerson andZenger 2002, Siggelkow and Levinthal 2003), they aremostly at the organizational level of analysis and donot explain how to alter project search strategieswhen the technology landscapes shift at the organiza-tional or project level. Results from our study contrib-ute to this stream by showing that high-tech R&Dunits can effectively manage project shifts by facilitat-ing responsive search through three interconnectedenabling mechanisms, namely: universal risk sharing,continuous planning and cross-level communicationfor all R&D projects. Although these mechanismsmay seem ordinary in isolation, their interconnectionsenable responsive search—to alter a project’s searchstrategy to distant search from local. Our simulationexperiments incorporate delays in responding to pro-ject shifts to illuminate how the absence of any one ofthese enablers could negatively impact project perfor-mance.Finally, the above contributions would not have
been possible without taking a multi-method research
Chandrasekaran, Linderman, Sting, and Benner: Managing R&D Project ShiftsProduction and Operations Management 25(3), pp. 390–416, © 2015 Production and Operations Management Society 409

approach. The case study discovered the mechanismthat enabled organizations to identify project shifts.The agent-based simulation helped disentangle thebenefits of the responsive search from other organiza-tional effects. It also helped identify contingenciesand boundary conditions for which the responsivesearch outperforms other search strategies. Usingmultiple methods, therefore, allowed us to unearthmultifaceted insights on such a complex phenomenonas project shift.This study has important implications for both
senior managers (e.g., R&D directors) and projectleaders. Successfully managing R&D projects inhigh-tech environments may require monitoringand altering the project’s search strategy. Doing thisnecessitate investments in several interconnectedmechanisms across different levels in the organiza-tion, which may incur start-up and training costs.For instance, the case study found that mechanismsto continuously monitor and update changes inproduct, process, measurement, service and supplychain technologies may require additional personnelin the planning department. Similarly, having pro-ject leaders periodically assess changes in projectrisks may require additional training, support struc-tures (e.g., PPD scorecards) and resources (timefrom senior managers). Consequently, developingand implementing the responsive search mechanismdescribed in this study comes at some initial costs.Nevertheless, evidence from our study suggests thatthe additional cost can pay off, especially in high-tech organizations. The case findings suggest thatwhen these processes are tightly integrated andinstitutionalized, the additional administrativeburden may not be too heavy. As summarized bythe President of MicroTech, “the biggest challenge islaying the foundation for all these processes. Onceestablished, it was like clockwork and everybody inthe organization knew what to look out for.” Ourstudy identifies several practices for managersthat allow them to better sense and respond toexogenous technology and market changes in theseenvironments.
6.2. Limitations and Future ResearchSeveral limitations of this research should be recog-nized. First, some of the projects started before ourdata collection, which might lead to retrospectivebias concerns. This is especially true for Drive Inno-vation and Tech Z, as we did not conduct any pro-ject team member interviews. However, we followed
several strategies to minimize retrospective bias,such as selecting the key informants, using multipleinformants, asking about “concrete facts,” maintain-ing informant confidentiality, and validating retro-spective facts using secondary sources of data suchas project team meeting minutes and newsletters(Golden 1992). Second, we limited our research tounderstand project shifts that emerged inductivelyfrom our case analyses. This is not the only form ofproject shift; projects obviously can change coursedue to other factors such as scope creep, team turn-over and budget issues. Although we did notobserve these in our cases, we do recognize them asa potential explanation for project-shifting behaviors.We also recognize that projects may not always pur-sue local or distant search strategies. Hybrid projects(see Chandrasekaran et al. 2015), for instance, mayrequire a combination of local and distant searchstrategies. While this combined approach is alsointeresting, we note that it is outside the scope ofour research, which is focused on identifying andmanaging project shifts.This study leads to several new research questions.
First, the responsive search, with its three enablingmechanisms that emerged from our qualitative induc-tive case study, offer one approach to deal with pro-ject shifts. Other effective approaches to identify andmanage project shifts may very well exist. This mayrequire additional in-depth case studies (similar tothe one presented in this study) in other high-techR&D units. We also developed three testable proposi-tions, two based on the responsive search identifiedin our study and one augmented using agent basedsimulations on NK model. Future research couldincorporate these findings and develop empiricallytestable hypotheses that can be validated throughlarge-scale studies. We hope our findings will pro-mote an expanded and more dynamic view on thephenomenon of project shifts in other contextsemploying both granular and large-scale theoreticallenses.
Acknowledgments
The authors thank the three anonymous reviewers, Pro-fessor Jason Choi for their valuable feedback on thepaper. They also thank Professors Jaideep Anand, DanielLevinthal and Roger Schroeder for the feedback on earlierversions of the manuscript. Finally, they thank ProfessorMurat Tarakci for his help with the landscape figures. Allerrors and omissions remain the responsibility of theauthors.
Chandrasekaran, Linderman, Sting, and Benner: Managing R&D Project Shifts410 Production and Operations Management 25(3), pp. 390–416, © 2015 Production and Operations Management Society

Appendix A: Description of the Research Sites
Business Unit MicroTech CommTech CommNet
Research Setting Four plants within the United States Corporate headquarters andpilot plants within the United States
Corporate headquarters and pilotplants within the United States
Annual Revenues (millions) $950 $30,000 $10,000Size (No. of Employees) 6000 40,000 10,000Age 40 years 80 years 60 yearsPrimary customers OEM (Other Equipment Manufacturer) General public Governmental and educational institutionsStrategic Level Informants(CEO, CTO, VP)
8 5 3
Number of Projects 6 (retrospective data from 1 project) 3 (retrospective datafrom 1 project)
3
Project Interviews(Leader + Team Members)
12 8 5
Project Informants(Includes Team Leaderand Team Members)
48 23 17
Data Collected • Recorded interviews
• Annual Reports
• Review of company, business unitand project documents
• Training documents
• Banquet Videos
• Recorded Interviews
• Annual Reports
• Supplementary books onproduct development approaches
• Portfolio ActionCommittee documents
• Recorded Interviews
• Annual Reports
• Supplementary books and procedures
• Portfolio Action Committee documents
Appendix B: Description of Projects
Project NameBusinessUnit Dimensions Time Span Budget Project Size Outcome
Sigmatel - New Process tech for manufacturing newelectronic components
MicroTech Product andProcess
2004–2008 $65 million 70 people Success (15% costreduction in next5 years)
Vision Plus - Vision Technology to eliminatemanual inspection
MicroTech Product andProcess
1998–2006 $40 million 20 people Success after somepreliminary delays
Tech Yield - Improvement of 20% yield in thecurrent process
MicroTech Process 2005–2007 $7.5 million 20 people Success
Tech Time - 30% reduction in direct labor by improvingthe current production process
MicroTech Product andProcess
2003–2009* $10 million 30 people Team Issues
Customer Defects - Reducing defect rates by improvingthe existing product/process designs
MicroTech Product andProcess
2007–2009 $12 million 25 people Success
Drive Innovation† - Developing a new drive design toimprove reading capability
MicroTech Product 2004–2006 $12 million 30 people Successful in termsof quality and speedto market
Video Share - Video Sharing through digital signals CommTech Product andProcess
2004–2009* $50 million 25 people Success
Tech Z† - Developing next generation communicationtechnology
CommTech Product 2005–2007 $10 million 25 People Management wentwith Tech W whichwas not consistentwith the industry
Cost Reduction - Reducing the warranty costs throughrobust design of the new products catered
CommTech Product 2005–2008 $1.5 million 15 people Delay
Third-Party - Optimizing the third party component design CommNet Process 2005–2009* $15 million 30 people SuccessCommunicate - Development of a new way ofcommunication
CommNet Process andProduct
2006–2008 $45 million 125 people Success after somepreliminary delays
Tablet - Development of a robust computer for usage inextreme conditions
CommNet Product andProcess
2006–2008 $20 million 25 people Product launchedafter delays, StoppedProduction in 2009
*Projects were not complete at the end our study. We were able to get updates on these projects through email correspondence.†Projects sampled later in the study.
Chandrasekaran, Linderman, Sting, and Benner: Managing R&D Project ShiftsProduction and Operations Management 25(3), pp. 390–416, © 2015 Production and Operations Management Society 411

Appendix C: Event Timeline for Sigmatel Project
Timeline Events Description of events Source/informants
November 2004 Sigmatel projectbegins
Sigmatel project begins. Idea is to make suspension assemblies using a differentraw material composition for better electrical conduction, mechanical controlthat can allow future miniaturization (Initial Budget: $10 million)Mostly routine changes by refining existing assembling process. Hard deadlinesto launch this new production approach in a year1 Project lead (fulltime) + 8 part-time members working across other projects
Separate interview notesfrom Project Leader,Team Members andSenior Executives
January 2006 Continuous planningforums Mappingproduct andprocess maps
Results from the continuous planning forums indicate that the size of suspensionassembly is constantly decreasing and cannot be made using current materialtechnologiesThis information is communicated to the Product Leadership Team (PLT)members and the members of PPDPPD scorecards are adjusted for these changes
Planning Reports,Planning Personnel,VP R&D and CTO
February 2006 Sigmatel riskschanged inPPD scorecard
Project leader when evaluating Sigmatel based on updated PPD finds that theproject scored over 3. Triggers conversations among PLT, project team andSenior Management
Project Leader andProject PresentationReports
March 2006 Change inSigmatel’ssearch strategy
Everyone is convinced that refining current process technology does not meetthe product technology demands for the next 3 years. Sigmatel’s projectmanagement approach is changed to a distant search for new technologiesusing different methods and tools. New Budget: $65 million. PLT members helpMicroTech changes its organizational goals on producing suspensionassemblies. Stake holders are informed on this “ground-breaking” productionchange in their Annual Reports
CEO, CTO, VP Quality,Division Head, ProjectLeader and ProjectTeam Members, AnnualReports (2006),Shareholder Events(Webcast)
December 2006 Project progresssmoothly throughits manufacturingverification review
Senior Management and PLT are frequently updated on Sigmatel’s progressPPD also gets updated with continuous planning forum—Sigmatel still remainsas a project exploring new technologies. Sigmatel has around 70 teammembers distributed across four different production sites
Division Head, ProjectLeader and ProjectTeam Members
August 2007 First phase ofproduction
MicroTech makes first batch of Sigmatel at two of their main production facilities CTO, Division Head,Project Leader
March 2008 Project ended Project ends at MicroTech. Project leaders and a smaller set of team membersstart working closely with their customers on educating them on thistechnology process
Project Leader, CTO,project interviews,Annual Reports
2008-2011 Marketperformance
MicroTech reports 500% ramp up in producing Sigmatel across the four facilities Annual reports andpress releases
Appendix D: Event Timeline for Tablet Project
Timeline Events Description of events Source/informants
June 2006 Tablet ProjectIdea Discussed
Customer (VOC) indicated that the current laptop Nexus has some issues atextreme conditions (temperature and pressure).Idea discussed on how to improve the existing design. More data on theimprovements needed sought from the customer
Project LeaderDirector of ProcessImprovement
August 2006 Tablet ProjectLaunched
Tablet project launched with the idea of refining Nexus design with updatedscreen a refinement to processor design supplied by an external supplier—allfocused on withstanding high temperatures and pressuresInitial team meetings between Division Head, Director Process Improvement,Project Lead (Black Belt). Discussed project scope and other deliverablesderived from their annual business unit scorecards. Project charter created withthese information (Initial Budget: $2 million).12 team members (Green Belts) are involved. Followed a structured approach(e.g., DMAIC)
CQO, Director of ProcessImprovement and TeamMembers
(continued)
Chandrasekaran, Linderman, Sting, and Benner: Managing R&D Project Shifts412 Production and Operations Management 25(3), pp. 390–416, © 2015 Production and Operations Management Society
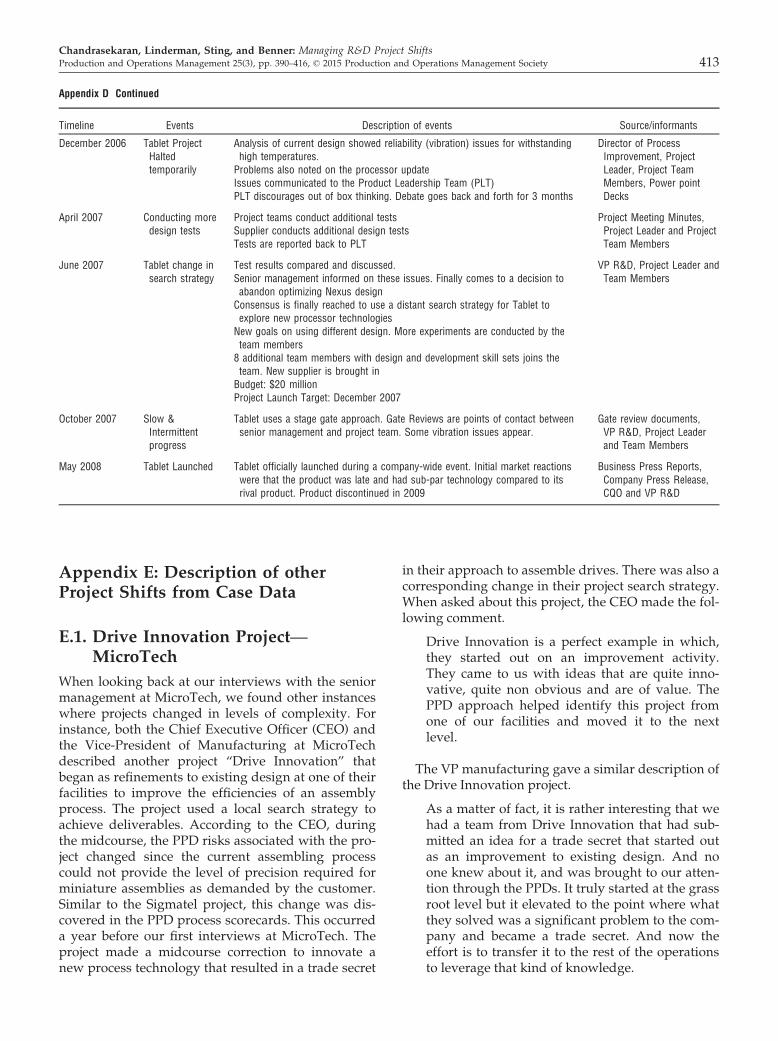
Appendix D Continued
Timeline Events Description of events Source/informants
December 2006 Tablet ProjectHaltedtemporarily
Analysis of current design showed reliability (vibration) issues for withstandinghigh temperatures.Problems also noted on the processor updateIssues communicated to the Product Leadership Team (PLT)PLT discourages out of box thinking. Debate goes back and forth for 3 months
Director of ProcessImprovement, ProjectLeader, Project TeamMembers, Power pointDecks
April 2007 Conducting moredesign tests
Project teams conduct additional testsSupplier conducts additional design testsTests are reported back to PLT
Project Meeting Minutes,Project Leader and ProjectTeam Members
June 2007 Tablet change insearch strategy
Test results compared and discussed.Senior management informed on these issues. Finally comes to a decision toabandon optimizing Nexus designConsensus is finally reached to use a distant search strategy for Tablet toexplore new processor technologiesNew goals on using different design. More experiments are conducted by theteam members8 additional team members with design and development skill sets joins theteam. New supplier is brought inBudget: $20 millionProject Launch Target: December 2007
VP R&D, Project Leader andTeam Members
October 2007 Slow &Intermittentprogress
Tablet uses a stage gate approach. Gate Reviews are points of contact betweensenior management and project team. Some vibration issues appear.
Gate review documents,VP R&D, Project Leaderand Team Members
May 2008 Tablet Launched Tablet officially launched during a company-wide event. Initial market reactionswere that the product was late and had sub-par technology compared to itsrival product. Product discontinued in 2009
Business Press Reports,Company Press Release,CQO and VP R&D
Appendix E: Description of otherProject Shifts from Case Data
E.1. Drive Innovation Project—MicroTech
When looking back at our interviews with the seniormanagement at MicroTech, we found other instanceswhere projects changed in levels of complexity. Forinstance, both the Chief Executive Officer (CEO) andthe Vice-President of Manufacturing at MicroTechdescribed another project “Drive Innovation” thatbegan as refinements to existing design at one of theirfacilities to improve the efficiencies of an assemblyprocess. The project used a local search strategy toachieve deliverables. According to the CEO, duringthe midcourse, the PPD risks associated with the pro-ject changed since the current assembling processcould not provide the level of precision required forminiature assemblies as demanded by the customer.Similar to the Sigmatel project, this change was dis-covered in the PPD process scorecards. This occurreda year before our first interviews at MicroTech. Theproject made a midcourse correction to innovate anew process technology that resulted in a trade secret
in their approach to assemble drives. There was also acorresponding change in their project search strategy.When asked about this project, the CEO made the fol-lowing comment.
Drive Innovation is a perfect example in which,they started out on an improvement activity.They came to us with ideas that are quite inno-vative, quite non obvious and are of value. ThePPD approach helped identify this project fromone of our facilities and moved it to the nextlevel.
The VP manufacturing gave a similar description ofthe Drive Innovation project.
As a matter of fact, it is rather interesting that wehad a team from Drive Innovation that had sub-mitted an idea for a trade secret that started outas an improvement to existing design. And noone knew about it, and was brought to our atten-tion through the PPDs. It truly started at the grassroot level but it elevated to the point where whatthey solved was a significant problem to the com-pany and became a trade secret. And now theeffort is to transfer it to the rest of the operationsto leverage that kind of knowledge.
Chandrasekaran, Linderman, Sting, and Benner: Managing R&D Project ShiftsProduction and Operations Management 25(3), pp. 390–416, © 2015 Production and Operations Management Society 413

E.2. Tech Z—CommTech
Revisiting our interviews with the senior leadershipat CommTech also revealed another instance of pro-ject shift. CommTech developed an innovative tech-nology (Tech W) that senior management believedwould be the future of communications technology. Itinvolved radically different product and processdesign. Senior management made their commitmentto Tech W based on early insights from North Ameri-can consumers that were made available through theannual strategic planning forum. The project startedwith a distant search strategy using DMADV method.The Vice President of R&D informed us that thisapproach resulted in ignoring new information on anexisting technology, Tech Z, developed by Comm-Tech’s overseas development team that was spread-ing at a faster rate in the European market. Tech Zwas based on their existing technology patent atCommTech, and hence would have been a projectusing current knowledge. However, senior manage-ment decided to explore Tech W, they ignored newinformation about Tech Z from their developmentteams in Europe (This would have been available toCommTech if they had continuous planning mecha-
nism seen at MicroTech). According to business pressreports, this decision proved to be a “major fiasco” thatallowed CommTech’s competitor to gain significantNorth American market share. When asked abouttheir strategic decision-making process, the ChiefQuality Officer at CommTech provided the followingresponse:
There is a paradox [tension] involved in manag-ing these decisions. I will openly admit it. I do notbelieve we have figured it out and probably thereare other groups that would do better than us.There is got to be an approach beyond just listen-ing to your customers or your engineers. We donot have a process driven innovation approach toevaluate ideas [as they change]. To me, this issomething that we all struggle and it a real quan-dary that we have here [at CommTech]
These additional examples illustrate that the shiftsfrom either low to high complexity (e.g., the DriveInnovation project) or high to low complexity (TechZ) were fairly common in these environments. Theyalso suggest the value of these responsive search toidentify such shifts.
Appendix F: Pseudo-Code of the NK Model Simulation
Chandrasekaran, Linderman, Sting, and Benner: Managing R&D Project Shifts414 Production and Operations Management 25(3), pp. 390–416, © 2015 Production and Operations Management Society

Notes1Micro Systems also had a start-up medical device busi-ness, MicroDevice. We collected data from this unit butexcluded it because very few projects were refinements toexisting technologies.2We studied CommTech and CommNet units becausethey had innovation projects in their R&D units. CommCustomer Solution was primarily a service entity ofCommCorp and did not have R&D of its own. Hence, itwas excluded from our study.3Perreault and Leigh’s (1989) Ir coefficient is based on theobserved frequency of agreements, and is a betterapproach compared to the conventional Cohen’s Kappa,which is based on the expected frequency of agreements.4A follow-up survey of the project team members revealedthat Tablet’s project prioritized both innovation andefficiency (hybrid in nature) owing to time-to-marketpressures.
ReferencesAndriopoulos, C., M. W. Lewis. 2009. Exploitation–exploration
tensions and organizational ambidexterity: Managing para-doxes of innovation. Organ. Sci. 20(4): 696–717.
Barczak, G., A. Griffin, K. B. Kahn. 2009. Perspective: Trends anddrivers of success in NPD practices: Results of the 2003PDMA best practices study. J. Prod. Innov. Manag. 26: 3–23.
Benner, M. J., M. L. Tushman. 2003. Exploitation, exploration, andprocess management: The productivity dilemma revisited.Acad. Manage. Rev. 28(2): 238–256.
Cardinal, L. B., S. B. Sitkin, C. P. Long. 2004. Balancing and rebal-ancing in the creation and evolution of organizational control.Organ. Sci. 15: 411–431.
Carrillo, J., C. Gaimon. 2004. Managing knowledge-basedresource capabilities under uncertainty. Manage. Sci. 50(11):1504–1518.
Chan, T., J. A. Nickerson, H. Owan. 2007. Strategic managementof R&D pipelines with cospecialized investments and technol-ogy markets. Manage. Sci. 53(4): 667–682.
Chandrasekaran, A., K. Linderman. 2015. Managing knowledgecreation in High-Tech R&D projects: A Multi-method study.Sciences 46(2): 267–300.
Chandrasekaran, A., K. Linderman, R. Schroeder. 2015. The roleof project and organizational context in managing high-techR&D projects. Prod. Oper. Manag. 24: 560–586.
Chao, R. O., S. Kavadias. 2008. A theoretical framework for man-aging the new product development portfolio: When andhow to use strategic buckets. Manage. Sci. 54(5): 907–921.
Chao, R., M. Lipson, E. Loutskina. 2012. How organizationalcomplexity impacts R&D portfolio decisions and technologysearch distance. Working paper, Darden School of Business.
Chen, E., R. Katila. 2008. Rival interpretations of balancing explo-ration and exploitation: Simultaneous or sequential? Editedby Scott Shane, eds. Blackwell Handbook on Technology andInnovation Management. John Wiley & Sons, NY, 197–214.
Cooper, R., S. J. Edgett, E. J. Kleinschmidt. 2002. Portfolio Manage-ment for New Products. Perseus, New York.
Dougherty, D., C. Hardy. 1996. Sustained product innovation inlarge mature organizations: Overcoming innovation to organi-zation problems. Acad. Manage. J. 39(5): 1120–1153.
Eisenhardt, K. M. 1989. Building theory from case study research.Acad. Manage. Rev. 14(4): 532–550.
Fine, C. 1998. Clockspeed: Winning Industry Control in the Age ofTemporary Advantage. Perseus Books, New York.
Fleming, L., O. Sorenson. 2001. Technology as a complex adaptivesystem: Evidence from patent data. Res. Policy 30(7): 994–1017.
Fleming, L., O. Sorenson. 2004. Science as a map in technologicalsearch. Strateg. Manag. J. 25: 909–928.
Gibson, C. B., J. Birkinshaw. 2004. The antecedents, consequencesand mediating role of organizational ambidexterity. Acad.Manage. J. 47(2): 209–226.
Gioia, D. A., J. B. Thomas. 1996. Identity, image, and issue inter-pretation: Sensemaking during strategic change in academia.Adm. Sci. Q. 41(3): 370–403.
Glaser, B., A. Strauss. 1967. The Discovery of Grounded Theory: Strate-gies for Qualitative Research. Aldine Transaction, New Jersey.
Golden, B. R. 1992. The past is the past—Or is it? The use ofretrospective accounts as indicators of past strategy. Acad.Manage. J. 35(4): 848–860.
Grant, R. 2003. Strategic planning in turbulent environments:Evidence from the oil majors. Strateg. Manag. J. 24(6): 491–517.
Hamel, G. 1996. Strategy as a revolution. Harv. Bus. Rev. 74(4):69–76.
Hayes, R., G. Pisano, D. Upton, S. Wheelwright. 2005. Operations,Strategy and Technology: Pursuing the Competitive Edge. JohnWiley and Sons, Hoboken, NJ.
He, Z. L., P. K. Wong. 2004. Exploration vs. exploitation: Anempirical test of the ambidexterity hypothesis. Organ. Sci.15(4): 481–494.
Holmqvist, M. 2004. Experiential learning process of exploitationand exploration within and between organizations: Anempirical study of product development. Organ. Sci. 15(1):70–81.
Hutchison-Krupat, J., S. Kavadias. 2014. Strategic resource alloca-tion processes: Top-down, bottom-up, and the value of strate-gic buckets. Manage. Sci. 61(2): 391–412.
Jansen, J. P., M. Tempelaar, F. A. J. van den Bosch, H. W.Volberda. 2009. Structural differentiation and ambidexterity:The mediating role of integration mechanisms. Organ. Sci.20(4): 797–811.
Kauffman, S. A. 1993. The Origins of Order: Self-Organization andSelection in Evolution. Oxford University Press, New York,NY.
Kavadias, S., S. C. Sommer. 2009. The effects of problem structureand team diversity on brainstorming effectiveness. Manage.Sci. 55(12): 1899–1913.
Langley, A. 1999. Strategies for theorizing from process data.Acad. Manage. J. 4: 691–710.
Lavie, D., L. Rosenkopf. 2006. Balancing exploration and exploita-tion in alliance formation. Acad. Manage. J. 49: 797–818.
Lavie, D., L. Rosenkopf. 2011. Balance within and across domains:The performance implications of exploration and exploitationin alliances. Organ. Sci. 22(6): 1517–1538.
Levinthal, D. 1997. Adaptation on rugged landscapes. Manage. Sci.43(7): 934–950.
Loch, C. H., S. Kavadias. 2002. Dynamic portfolio selection of NPDprograms using marginal returns.Manage. Sci. 48(10): 1227–1241.
Mallick, D., R. G. Schroeder. 2005. An integrated framework formeasuring product development performance in high-techindustries. Prod. Oper. Manag. 14(2): 142–158.
March, J. 1991. Exploration and exploitation in organizationallearning. Organ. Sci. 2(1): 71–88.
Mihm, J., C. H. Loch, D. Wilkinson, B. Huberman. 2010. Hierar-chical structure and search in complex organizations. Manage.Sci. 56(5): 831–848.
Chandrasekaran, Linderman, Sting, and Benner: Managing R&D Project ShiftsProduction and Operations Management 25(3), pp. 390–416, © 2015 Production and Operations Management Society 415

Miles, M. B., M. Huberman. 1994. Qualitative Data Analysis. SagePublications, New York.
Miller, J. H., S. Page. 2007. Complex Adaptive Systems: An Introduc-tion to Computational Models of Social Life. Princeton UniversityPress, Princeton New Jersey.
Morse, J. M. 1997. Perfectly healthy, but dead, the myth of inter-rater reliability. Qual. Health Res. 7(4): 445–447.
Nickerson, J. A., T. R. Zenger. 2002. Being efficiently fickle: Adynamic theory of organizational choice. Organ. Sci. 13(5):547–566.
Perreault, W. D., L. E. Leigh. 1989. Reliability of nominal databased on qualitative judgments. J. Mark. Res. 26: 135–148.
Posen, H., D. A. Levinthal. 2012. Chasing a moving target: Explo-ration and Exploitation in Dynamic Environment. Manage. Sci.58: 587–601.
Rivkin, J. W., N. Siggelkow. 2003. Balancing search and stability:Interdependencies among elements of organizational design.Manage. Sci. 49: 290–311.
Rousseau, D. 1985. Issues of level in organizational research: Mul-tilevel and cross level perspectives. L. L. Cummings, B. M.Staw, eds. Res. Organ. Behav. 7: 1–37.
Siggelkow, N., D. A. Levinthal. 2003. Temporarily divide to con-quer: Centralized, decentralized, and reintegrated organiza-
tional approaches to exploration and adaptation. Organ. Sci.14(6): 650–669.
Siggelkow, N., J. Rivkin. 2005. Patterned interactions in complexsystems: Implications for exploration. Manage. Sci. 53: 1068–1085.
Sinha, K. K., A. H. Van de Ven. 2005. Designing work within andbetween organizations. Organ. Sci. 16(4): 389–408.
Sommer, S. C., C. H. Loch. 2004. Selectionism and learning in pro-jects with complexity and unforeseeable uncertainty. Manage.Sci. 50(10): 1334–1347.
Sting, F. J., J. Mihm, C. H. Loch. 2011. Collaborative Search. Work-ing paper, Insead.
Strauss, A., J. Corbin. 1990. Basics of Qualitative Research: GroundedTheory Procedures and Techniques. Newbury Park, CA: Sage.
Swink, M., S. Talluri, T. Pandejpong. 2006. Faster, better, cheaper:A study of NPD project efficiency and performance tradeoffs.J. Oper. Manag. 24(5): 542–562.
Volkoff, O., D. M. Strong, B. M. Elmes. 2007. Technologicalembeddedness and organizational change. Organ. Sci. 18(5):832–848.
Wheelwright, S., K. Clark. 1992. Creating project plans to focusproduct development. Harv. Bus. Rev. 70(2): 70–82.
Chandrasekaran, Linderman, Sting, and Benner: Managing R&D Project Shifts416 Production and Operations Management 25(3), pp. 390–416, © 2015 Production and Operations Management Society