Embed Size (px)
Citation preview
1
Managing Oracle Fusion Middleware with Oracle
Enterprise Manager 11g Oracle Corporation
Redwood Shores, CA USA
Keywords:
Oracle Enterprise Manager 11g SOA OSB WebLogic Service Bus ALSB WebCenter ADF BI
IDM BTM Business Intelligence Transaction Management Identity Management Performance
Configuration Management Provisioning
Introduction
Organizations have to be agile in order to compete globally and adapt to changes in business
and technology. To achieve this objective, many large IT organizations have implemented
complex integration solutions that include Java EE application servers, Service Oriented
Architecture (SOA) and business process management, Identity Management, and Business
Intelligence platforms. These technologies form an enterprise architecture that supports
distributed applications and orchestration of complex end-to-end business processes and
services.
These integration environments enable new business applications and services to be developed
in a much shorter time and with fewer resources. These applications tend to run the business
processes that are the most critical to the enterprise, usually requiring reliable support for
numerous users and always with hefty service-level requirements.
Increasingly, the productivity and financial benefits delivered by these applications are making
them an indispensable part of their owners‘ day-to-day business operations. These mission-
critical applications handle complex business processes, ranging from processes that
orchestrate financial transactions to processes that prepare insurance quotes. Maintaining high
application availability and performance is vital to the owners of these applications.
Unfortunately, managing this class of applications is no simple task.
Oracle Fusion Middleware 11g provides the runtime engine for mission-critical Java EE, SOA
and middleware applications. This white paper outlines some common challenges faced by IT
administrators running enterprise applications deployed on Oracle Fusion Middleware 11g,
and describes how Oracle Enterprise Manager enables customers to reduce the cost of
management by providing a single management console to manage the end-to-end application
environment.
2
Top Challenges for Administrators
To compete and survive in the midst of the current economic situation, organizations are trying
to keep their costs low. IT administrators have more responsibilities and fewer resources for
keeping their infrastructure running and maintaining the service levels of their applications.
Oracle Fusion Middleware administrators in particular are faced with a number of challenges
that arise while managing their complex application architecture.
Performance and Diagnostics
Most administrators are responsible for numerous Oracle WebLogic Server domains. For
example, a typical administrator may be responsible for domains that host development,
quality assurance, and production servers for an application family. Most tools, such as the
WebLogic Server Administration Console, are effective for managing a single WebLogic
Server domain but cannot be used to manage multiple domains. Hence administrators must
monitor and manage each domain individually which becomes very time intensive and
expensive.
Managing application performance and maintaining service levels for applications is another
significant challenge for administrators. Often, administrators come to know about application
performance issues from end-user complaints rather than from proactively monitoring the
application and its underlying infrastructure. Compounding this problem further is that most
operations teams end up taking ownership of ―black boxes‖ when they accept an application
for production. So when a performance issue occurs, administrators do not understand the
internal workings of the application and consequently cannot diagnose and resolve the
problem.
In such scenarios, they rely on a combination of application-specific support personnel (such
as senior developers or architects) and silo-based performance tools. However, the application
performance issue may be due to something outside the silo, such as other slow application
components, a slow running SQL query or host machine. In addition, most application
performance issues are hard to reproduce in a test environment, and many application
diagnostics tools cannot be deployed in a production environment due to their performance
overhead and restart requirements.
Business Transaction Management
Organizations are increasingly turning to composite applications to implement critical business
transactions. These composite applications serve a single purpose—to execute business
transactions such as operations and business support services (OSS/BSS), account provisioning
and activation, and insurance claims processing. The rise of SOA and composite applications
means that these business-critical transactions can be obscured by integrations, by components
that are widely distributed across both internal and external systems, and by infrastructure, such as acceleration and security technologies and appliances.
Business transactions are often executed by arranging or "orchestrating‖ existing applications
and infrastructure to implement business processes. They incorporate a wide variety of
technologies, deployed across many platforms and organizational boundaries. Common
technologies include intermediaries such as Enterprise Service Buses (ESBs), Process Engines,
legacy and packaged applications. Composite applications incorporate a range of shared
components, such as SOAP services, packaged applications, Portals, EJBs, POJOs, and
3
databases. However, despite the complexity of such processes, they must behave as a single, seamless transaction from the point of view of the business user.
Operations and application support staff responsible for these business systems therefore face a
variety of challenges, such as:
Monitoring health and availability of services and business transactions
Securing application environments end-to-end
Tracking usage of services
Managing transaction errors and fallout
Neither IT nor business teams have traditionally had the visibility and control needed to
efficiently manage these composite applications. IT and business staff usually first discover
transaction issues through cryptic log entries or calls from vexed customers. What commonly
follows are resource-intensive fire drills and finger pointing across various teams, increasing the maintenance overheads incurred by IT.
Configuration and Change Management
As IT infrastructures continue to expand, managing configurations and configuration change
has become one of the most critical tasks in day-to-day IT operations. If administrators are
unable to manage their configurations they can significantly and negatively impact their
business‘ bottom line by not preventing unplanned downtime.
At the forefront of various challenges in the configuration and change management space is
knowing what assets exist in a datacenter. Often, administrators simply do not have a clear
understanding of what is installed and running in their enterprise. They are unable to answer -
with conviction - simple questions such as the following:
Which WebLogic Servers do not have a particular patch applied?
How many WebLogic Servers use the JRockit JVM?
Which WebLogic Servers are listening on port 8001?
Which WebLogic Servers rely on a particular JDBC data source?
If by chance they do have this data, the information was gathered in a time-consuming, error-
prone fashion, and is maintained manually in cumbersome spreadsheets. Consequently, being
able to efficiently analyze data across multiple WebLogic Server domains in the enterprise is
close to impossible. For instance, if a production application is not performing as well as the
same application in the QA environment – and the two underlying infrastructures are
supposedly configured identically – administrators do not have the means to quickly compare
the two environments end-to-end in hopes of pinpointing the differences in configuration and,
therefore, the potential cause of poor performance.
More and more organizations are implementing compliance frameworks such as Sarbanes-
Oxley (SOX), Information Technology Infrastructure Library (ITIL), and Payment Card
Industry (PCI) data security standards – as well as unique business standards. Because of this
it has become increasingly more critical to efficiently monitor the configuration of the
enterprise. IT staff lacks an effective method for ensuring and tracking compliance with these
4
frameworks and standards. Consequently, being audited becomes a very stressful and costly
experience for the IT organization.
When administrators are unable to ensure compliance with standards, down time is likely to
occur. In such situations, one of the first things that administrators look at in order to
troubleshoot the problem is the configuration of the environment. More specifically, they look
for configuration items that recently changed that could have impacted availability, and
whether the configuration change was an authorized change. Typically, IT organizations do
not possess this level of historical insight, nor are they immediately alerted when configuration
changes occur which are outside of any approved request for change.
These challenges in configuration and change management are substantial. When they are not
addressed, there is more downtime and significantly higher IT costs – both of which affect a
business‘ bottom line. Oracle Enterprise Manager offers a solution to these configuration and
change management challenges. Specific features which address these challenges will be
described in detail later in this white paper.
Application Lifecycle Management
In today's data center, proliferation of low cost servers and numerous software deployments on
those servers have brought in a fresh set of lifecycle management challenges. One well-known
challenge is deployment of software which supports the business. Such software spans from
the application to the middleware to the database, and on down to the underlying operating
system. Installing, configuring, and patching all these tiers is time consuming and error prone.
Another common problem is administrators‘ difficulty in managing capacity to changing
workload patterns. When there is an increased demand for services, there is no efficient nor
automated way to adjust the underlying infrastructure – by adding capacity - to improve
application performance. Manual, error-prone methods are most often relied upon. Such
lifecycle management challenges eventually result in administrators spending a significant
amount of time in software provisioning and maintenance operations.
Comprehensive Management of Oracle Fusion Middleware
The challenges in managing complex enterprise applications and their underlying
infrastructure are substantial. When they are not addressed, there is more down time and
significantly higher IT costs – both of which affect a business‘ bottom line. To address the
challenges outlined above, IT organizations can rely on Oracle Enterprise Manager. Oracle
Enterprise Manager is a next-generation application management solution designed
specifically for this new class of distributed applications built on Oracle Fusion Middleware
11g. Using Oracle Enterprise Manager, administrators can manage each middleware
component of Oracle Fusion Middleware more effectively and efficiently.
Oracle WebLogic Server Management
Managing Oracle WebLogic Server requires a broad end-to-end management perspective as
these application servers routinely are not only providing the external face of applications, but
also handling the majority of the business logic. Commonly, this means multiple clusters of
managed servers that handle both presentation and business logic and communicate with each
other via RMI, Web Services, and other remote invocations in order to complete transactions
for front-end processes. In order to properly manage these WebLogic Servers - whether there
are multiple large-scale deployments or just a couple clusters - administrators need to keep
track of performance, service levels, configurations, error/exception handling, and the general
5
application life cycle. The following sections provide details into Oracle Enterprise Manager‘s
comprehensive management solution for Oracle WebLogic Server – the core of your Oracle
Fusion Middleware deployments.
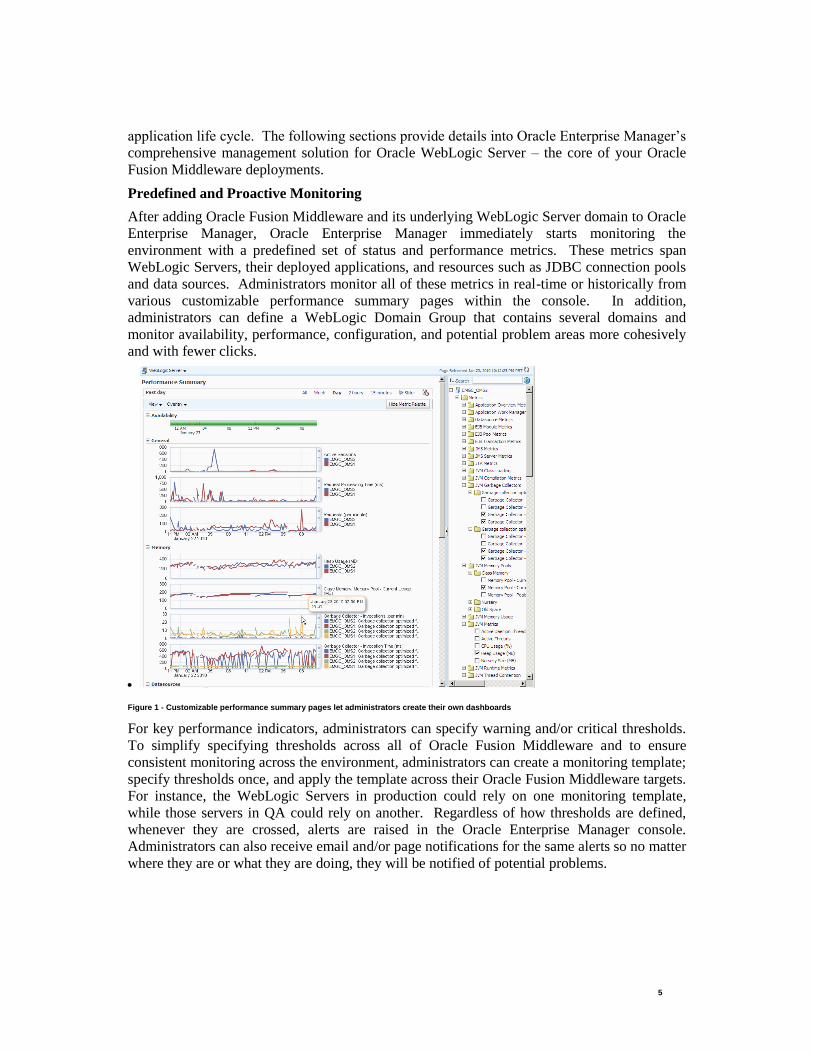
Predefined and Proactive Monitoring
After adding Oracle Fusion Middleware and its underlying WebLogic Server domain to Oracle
Enterprise Manager, Oracle Enterprise Manager immediately starts monitoring the
environment with a predefined set of status and performance metrics. These metrics span
WebLogic Servers, their deployed applications, and resources such as JDBC connection pools
and data sources. Administrators monitor all of these metrics in real-time or historically from
various customizable performance summary pages within the console. In addition,
administrators can define a WebLogic Domain Group that contains several domains and
monitor availability, performance, configuration, and potential problem areas more cohesively
and with fewer clicks.
Figure 1 - Customizable performance summary pages let administrators create their own dashboards
For key performance indicators, administrators can specify warning and/or critical thresholds.
To simplify specifying thresholds across all of Oracle Fusion Middleware and to ensure
consistent monitoring across the environment, administrators can create a monitoring template;
specify thresholds once, and apply the template across their Oracle Fusion Middleware targets.
For instance, the WebLogic Servers in production could rely on one monitoring template,
while those servers in QA could rely on another. Regardless of how thresholds are defined,
whenever they are crossed, alerts are raised in the Oracle Enterprise Manager console.
Administrators can also receive email and/or page notifications for the same alerts so no matter
where they are or what they are doing, they will be notified of potential problems.
6
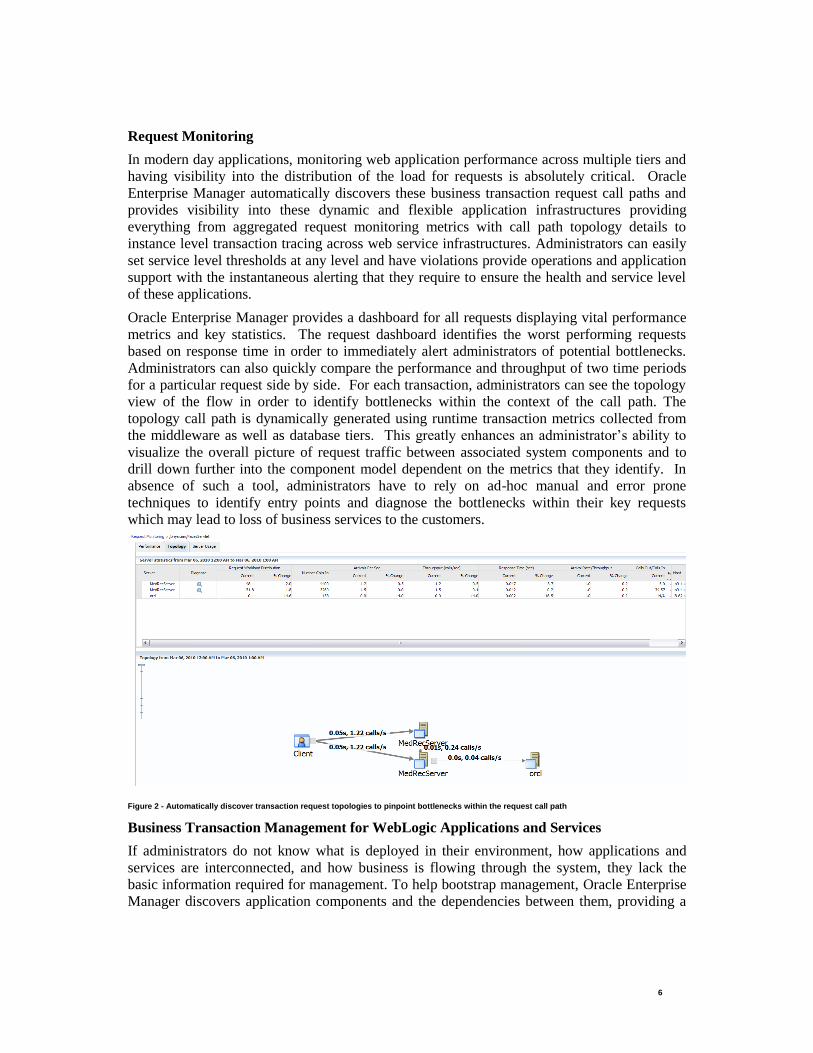
Request Monitoring
In modern day applications, monitoring web application performance across multiple tiers and
having visibility into the distribution of the load for requests is absolutely critical. Oracle
Enterprise Manager automatically discovers these business transaction request call paths and
provides visibility into these dynamic and flexible application infrastructures providing
everything from aggregated request monitoring metrics with call path topology details to
instance level transaction tracing across web service infrastructures. Administrators can easily
set service level thresholds at any level and have violations provide operations and application
support with the instantaneous alerting that they require to ensure the health and service level
of these applications.
Oracle Enterprise Manager provides a dashboard for all requests displaying vital performance
metrics and key statistics. The request dashboard identifies the worst performing requests
based on response time in order to immediately alert administrators of potential bottlenecks.
Administrators can also quickly compare the performance and throughput of two time periods
for a particular request side by side. For each transaction, administrators can see the topology
view of the flow in order to identify bottlenecks within the context of the call path. The
topology call path is dynamically generated using runtime transaction metrics collected from
the middleware as well as database tiers. This greatly enhances an administrator‘s ability to
visualize the overall picture of request traffic between associated system components and to
drill down further into the component model dependent on the metrics that they identify. In
absence of such a tool, administrators have to rely on ad-hoc manual and error prone
techniques to identify entry points and diagnose the bottlenecks within their key requests
which may lead to loss of business services to the customers.
Figure 2 - Automatically discover transaction request topologies to pinpoint bottlenecks within the request call path
Business Transaction Management for WebLogic Applications and Services
If administrators do not know what is deployed in their environment, how applications and
services are interconnected, and how business is flowing through the system, they lack the
basic information required for management. To help bootstrap management, Oracle Enterprise
Manager discovers application components and the dependencies between them, providing a
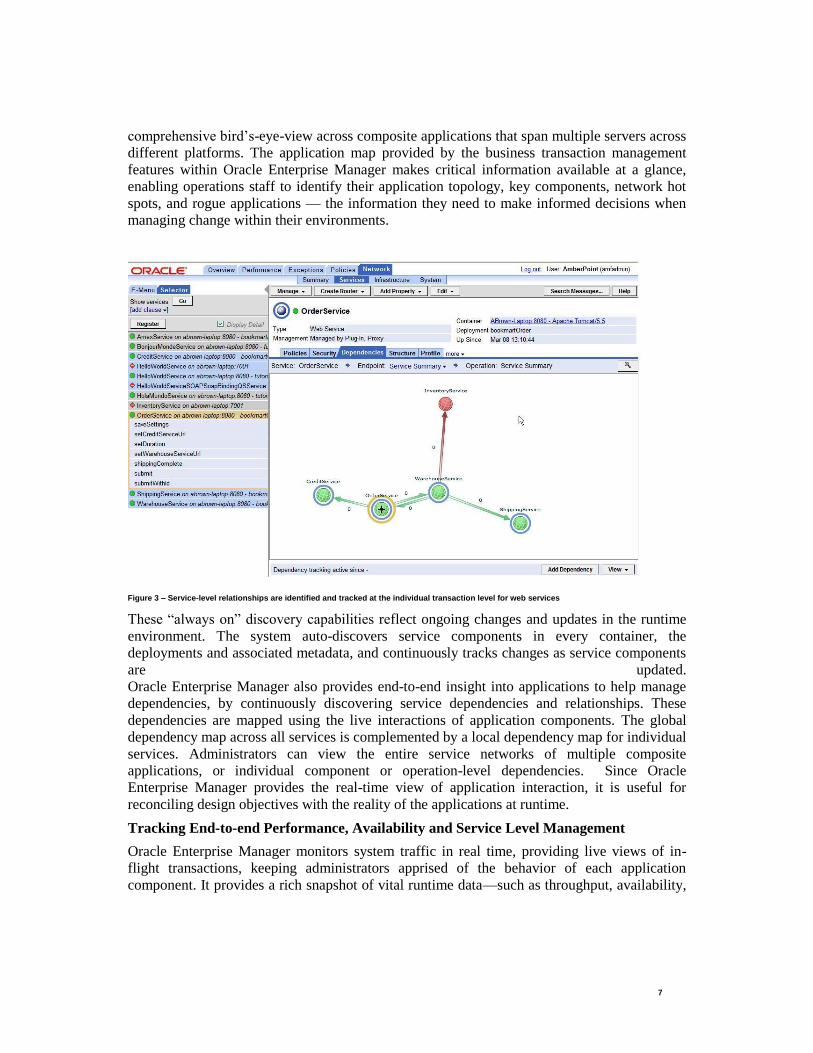
7
comprehensive bird‘s-eye-view across composite applications that span multiple servers across
different platforms. The application map provided by the business transaction management
features within Oracle Enterprise Manager makes critical information available at a glance,
enabling operations staff to identify their application topology, key components, network hot
spots, and rogue applications — the information they need to make informed decisions when
managing change within their environments.
Figure 3 – Service-level relationships are identified and tracked at the individual transaction level for web services
These ―always on‖ discovery capabilities reflect ongoing changes and updates in the runtime
environment. The system auto-discovers service components in every container, the
deployments and associated metadata, and continuously tracks changes as service components
are updated.
Oracle Enterprise Manager also provides end-to-end insight into applications to help manage
dependencies, by continuously discovering service dependencies and relationships. These
dependencies are mapped using the live interactions of application components. The global
dependency map across all services is complemented by a local dependency map for individual
services. Administrators can view the entire service networks of multiple composite
applications, or individual component or operation-level dependencies. Since Oracle
Enterprise Manager provides the real-time view of application interaction, it is useful for
reconciling design objectives with the reality of the applications at runtime.
Tracking End-to-end Performance, Availability and Service Level Management
Oracle Enterprise Manager monitors system traffic in real time, providing live views of in-
flight transactions, keeping administrators apprised of the behavior of each application
component. It provides a rich snapshot of vital runtime data—such as throughput, availability,
8
response times and faults—across a range of time intervals and within the context of the
business transaction and the business user.
Oracle Enterprise Manager brings predictability, visibility and control to applications by
delivering comprehensive service level management for services, transactions and business
processes across heterogeneous environments. It monitors all flavors of application services,
ranging from SOAP and XML services to virtually any application service or legacy
component—such as EJBs and Plain Old Java Objects (POJOs). Oracle Enterprise Manager
can instrument virtually any distributed application service.
Oracle Enterprise Manager continuously monitors message exchange and application
invocations—both synchronous and asynchronous--to collect data on the operational health of
application components and to relate that behavior to the higher level construct of the
associated business transactions. Oracle Enterprise Manager extends visibility to primary
application services, such as SOAP and REST web services, to underlying implementation
components such as EJBs, POJOs, and JMS queues components, right down to database
queries.
With Oracle Enterprise Manager, users can:
Define different SLAs for discrete business segments
Prioritize service use by any business criteria
Focus on the most valuable users (e.g. customers and partners)
Deliver the best quality of service during peak hours
Set and monitor SLAs for individual services as well as composites such as processes and transactions
Knowing the business user is a critical aspect of understanding and controlling systems that
execute business transactions. Oracle Enterprise Manager shows who is consuming the
services and segments these consumers for SLA-driven quality of service. Its support for
detailed usage analysis and reporting over time helps organizations to identify trends and
revenue opportunities.
Transaction Diagnostics and Root-cause Analysis
Oracle Enterprise Manager provides sophisticated instrumentation for real-time detection,
alerting, and remediation of various types of unexpected technical exceptions or business
conditions. Using Oracle Enterprise Manager, application support personnel can quickly search
transactions based on message content and context—such as time of arrival, message type,
customer ID, or part number—to locate the transaction in question and rapidly nail down the
root cause of a problem. They can examine the full set of messages or correlated application
invocations to understand the full context of any anomaly. These capabilities mean that Oracle
Enterprise Manager slashes the time it takes to diagnose runtime issues from hours to minutes.
9
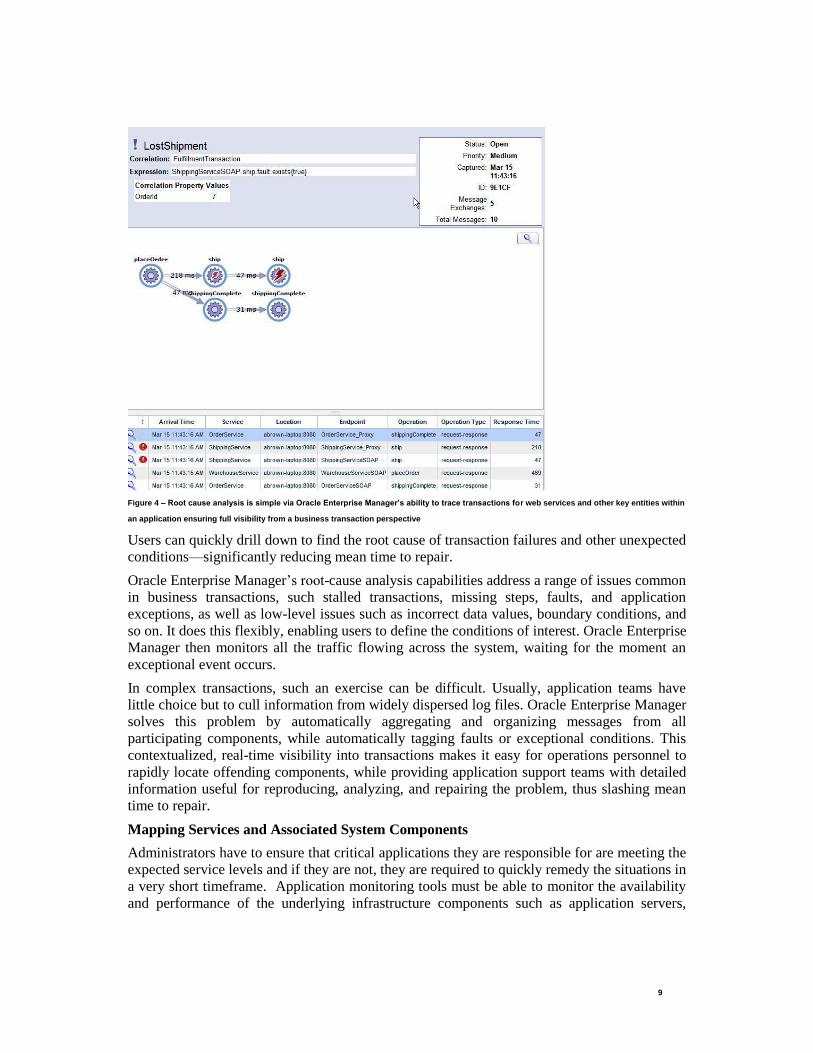
Figure 4 – Root cause analysis is simple via Oracle Enterprise Manager’s ability to trace transactions for web services and other key entities within
an application ensuring full visibility from a business transaction perspective
Users can quickly drill down to find the root cause of transaction failures and other unexpected
conditions—significantly reducing mean time to repair.
Oracle Enterprise Manager‘s root-cause analysis capabilities address a range of issues common
in business transactions, such stalled transactions, missing steps, faults, and application
exceptions, as well as low-level issues such as incorrect data values, boundary conditions, and
so on. It does this flexibly, enabling users to define the conditions of interest. Oracle Enterprise
Manager then monitors all the traffic flowing across the system, waiting for the moment an
exceptional event occurs.
In complex transactions, such an exercise can be difficult. Usually, application teams have
little choice but to cull information from widely dispersed log files. Oracle Enterprise Manager
solves this problem by automatically aggregating and organizing messages from all
participating components, while automatically tagging faults or exceptional conditions. This
contextualized, real-time visibility into transactions makes it easy for operations personnel to
rapidly locate offending components, while providing application support teams with detailed
information useful for reproducing, analyzing, and repairing the problem, thus slashing mean
time to repair.
Mapping Services and Associated System Components
Administrators have to ensure that critical applications they are responsible for are meeting the
expected service levels and if they are not, they are required to quickly remedy the situations in
a very short timeframe. Application monitoring tools must be able to monitor the availability
and performance of the underlying infrastructure components such as application servers,
10
databases, virtual machines, and hosts. Oracle Enterprise Manager solves this problem by
providing a comprehensive system and service monitoring solution which covers all tiers
within the application infrastructure.
Oracle Enterprise Manager proactively alerts administrators of any service level violations
ensuring that critical environments are monitored and tracked around the clock.
Administrators can group related system components together to form a system and associate
that with a particular service. By looking at system metrics, IT operations and administrators
can quickly predict which business services might be impacted so that they can take corrective
measures before actual service levels are affected. For example, if a particular managed
WebLogic Server is consuming too much CPU, there may be a need to expand the cluster in
order to accommodate the load of the system. Similarly, if business users report an issue with
service levels such as a performance delay of a key service, IT teams can quickly identify
whether the root cause of the problem is a particular system component within the overall
infrastructure.
Application Components Dependency and Contextual Performance
Java EE metadata can be complex and abstract and this complexity keeps growing with the
introduction of new frameworks. In order to map the interdependencies between various
application components such as Servlets, JSPs, EJBs, and underlying SQL calls, it is important
to understand the metadata defining those relationships. Oracle Enterprise Manager models
Java EE applications based on metadata automatically gathered from the various containers
within the infrastructure and builds views based on standard Java EE components as well as
non-standard Java components such as portlets (WSRP, JSR-168) and BPEL. These metrics
are organized on their URI mappings with multiple entry points provided for top-down context
and at the lower levels based upon the method-level call graph as well as from a component
hierarchical perspective.
Using Oracle Enterprise Manager, administrators can quickly see the dependencies and
relationships between high-level components like JSPs, Servlets, Portlets, and Web Services
and the underlying Java EE components that support those services such as EJBs and JDBC
calls. The diagram below shows invocation count for a servlet and its underlying components
giving an idea of the flow of context for that URI. Within the same screen, administrators can
also check how much time is spent in each of the components via the delay analysis metrics
provided in the associated pie chart and table. Administrators can then drill down deeper into
each class or component to find out how it behaves based on the context from which it was
originally called. This is particularly useful considering that many components in Java EE
applications are considered shared components where context is critical.
11
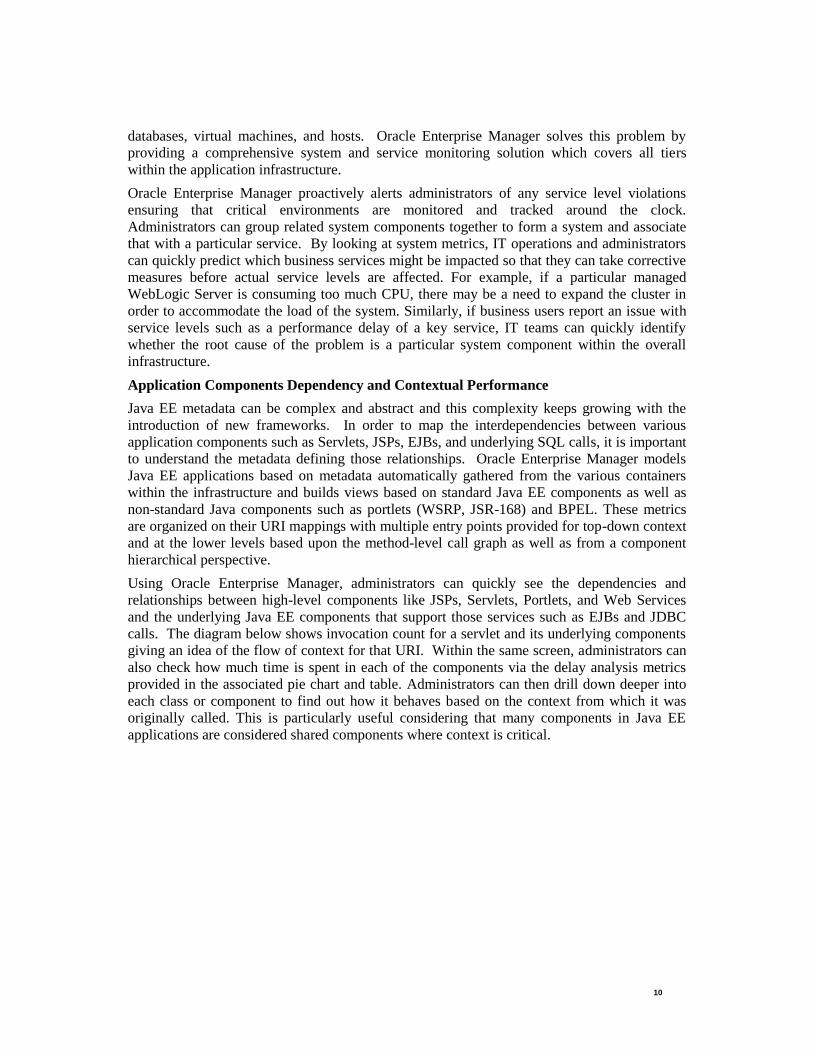
Figure 5 - Analyze component dependency, delay distribution, and SQL performance based on context
Administrators can literally trace down URI requests to SQL and stored procedures being
invoked in context providing true end-to-end visibility from top-level components all the way
down to the database. This performance data is crucial for determining the root cause of
application performance issues by providing administrators with the ability to pinpoint the
class or SQL that is responsible for the URI response time delay over the period of time being
analyzed. This capability to immediately pinpoint a problem anywhere within a Java EE
application can save considerable time in regards to diagnosing issues and resolving problems.
In spite of all the monitoring mechanisms in place there are certain scenarios where
administrators must drill down to the object locks, DB table locks or actual heap usage of
various classes. For example, a user request is getting stuck and tracing tools mentioned above
may indicate that the transaction is getting stuck at a particular class because of a JDBC call.
That routinely is not enough to determine why the thread is getting stuck in the JDBC call in
the first place. Such confusion often leads to finger pointing between application
administrators and database administrators, which may result in increased application down
time and loss of business. In order to resolve this lack of visibility, administrators can dive a
level deeper into JVM diagnostics in context of the component-level models being analyzed
across the application infrastructure. The following section provides the in-context JVM
diagnostics provided by such visibility.
JVM Diagnostics
Oracle Enterprise Manager provides deep diagnostics for any JVM within the application
infrastructure providing immediate insight into actual thread stack or other common JVM
issues. Oracle Enterprise Manager‘s deep diagnostic capability operates at a native level,
which makes it possible to have extremely low performance overhead (<1%) making it
suitable for 24/7 real-time production diagnostics.
12
Cross-tier Diagnostics
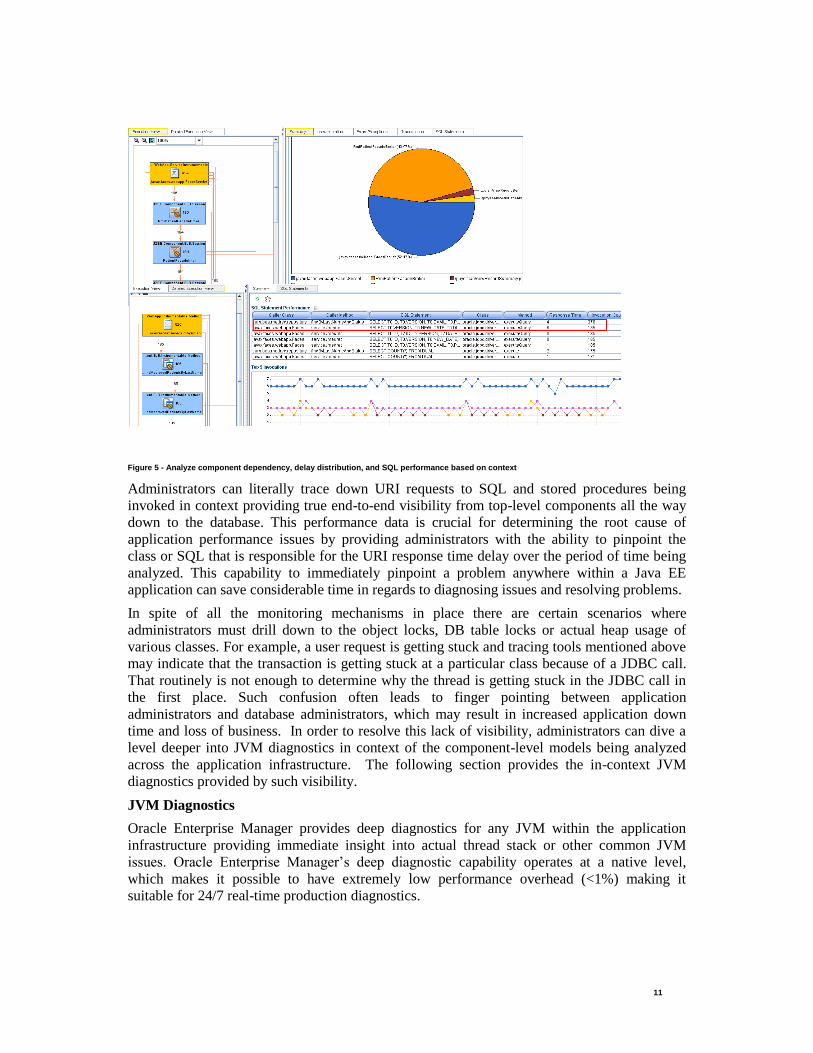
Oracle Enterprise Manager also correlates the Java session to that of a database session making
it possible to do cross-tier analysis. Administrators can find the status and call stack of all
active threads in the JVM. They can also see the threads in context of a user request. If a
particular thread is waiting for a database lock administrators can find the java code line the
thread is stuck in, the SQL the thread is trying to run and the SQL that resulted in the table
lock. Database administrators can take necessary steps to release the table lock and the stuck
thread will continue to run. Without such native monitoring capability, it may take hours or
days to figure out where exactly the problem is and by that time administrators would lose the
execution context.
Figure 6 - Find cross-tier issues using Oracle Enterprise Manager’s JVM diagnostics
Differential Heap Analysis
Using Oracle Enterprise Manager, administrators can take heap dumps and analyze the classes
for memory consumption. Administrators can easily perform differential heap analysis of heap
dumps taken at two different times. Oracle Enterprise Manager quickly pinpoints the cause of
memory leaks by showing the classes and their fields that have grown in size. Without Oracle
Enterprise Manager finding memory leaks could take several man-hours resulting in higher
maintenance costs.
Configuration and Change Management
Most performance degradation issues in production application environments occur due to
unauthorized configuration change. Many organizations using Oracle WebLogic Server
struggle with managing configurations and enforcing compliance standards. Oracle Enterprise
Manager provides comprehensive configuration management capabilities that help customers
13
maximize value of their IT assets, increase the quality of IT services, reduce the cost of
managing IT, and meet IT compliance requirements.
Automating Discovery and Tracking Assets
Traditionally, tracking assets and configuration items across the IT environment relies upon
the knowledge of key individuals, time-consuming ad-hoc processes, and manual, error-prone
spreadsheets. In contrast, Oracle Enterprise Manager automatically collects deep configuration
information about Oracle WebLogic Server as well as its underlying hardware and operating
system. Configuration templates or blueprints specifying what configuration items should be
collected for Oracle WebLogic Server and its underlying operating system are available out-of-
the-box and can be customized to collect only the relevant configuration items that IT
personnel require. Examples of information collected at regular intervals include:
Oracle WebLogic Server software installations, including applied patches
Oracle WebLogic Server configuration parameters (e.g. ports, JVM information,
JDBC and JMS resources, startup and shutdown classes) and configuration files
Operating system patches, kernel parameter settings, and installed packages
Hardware components including CPU, memory, storage, and network devices
Detecting Configuration Changes
Oracle Enterprise Manager also provides the ability to track configuration changes over time
across the stack—from the application down to the hardware—allowing administrators to
easily monitor all changes for a specific configuration between two points in time. This
enables users to quickly see the changes applied to an environment that previously worked
fine, but is suddenly not performing at an acceptable level.
In addition to tracking configuration changes historically, Oracle Enterprise Manager enables
administrators to detect changes in real time as well. By integrating with a change
management system, it can inform you if a configuration change was authorized or
unauthorized. Detection of real-time change automates the audit trail and minimizes the time it
takes to uncover compliance breaches.
Comparing and Provisioning Configurations
By keeping systems configured to a standard baseline and identifying any configuration
changes that occur, Oracle Enterprise Manager helps organizations reduce ―configuration drift‖
and confirm if and when a planned change takes place. Oracle Enterprise Manager provides a
suite of comparison capabilities that allows administrators to quickly and easily pin point any
configuration differences across the application life cycle – from development to test to
production. In addition, administrators can create a baseline from an existing configuration
and use that gold standard configuration or a current system to perform an ad hoc or scheduled,
one-to-one or one-to-many comparison.
When unexpected configuration differences across environments are detected, Oracle
Enterprise Manager can be used to provision the configurations such that the environments are
no longer different. This reduces the amount of time administrators need to devote to
resolving configuration issues.
14
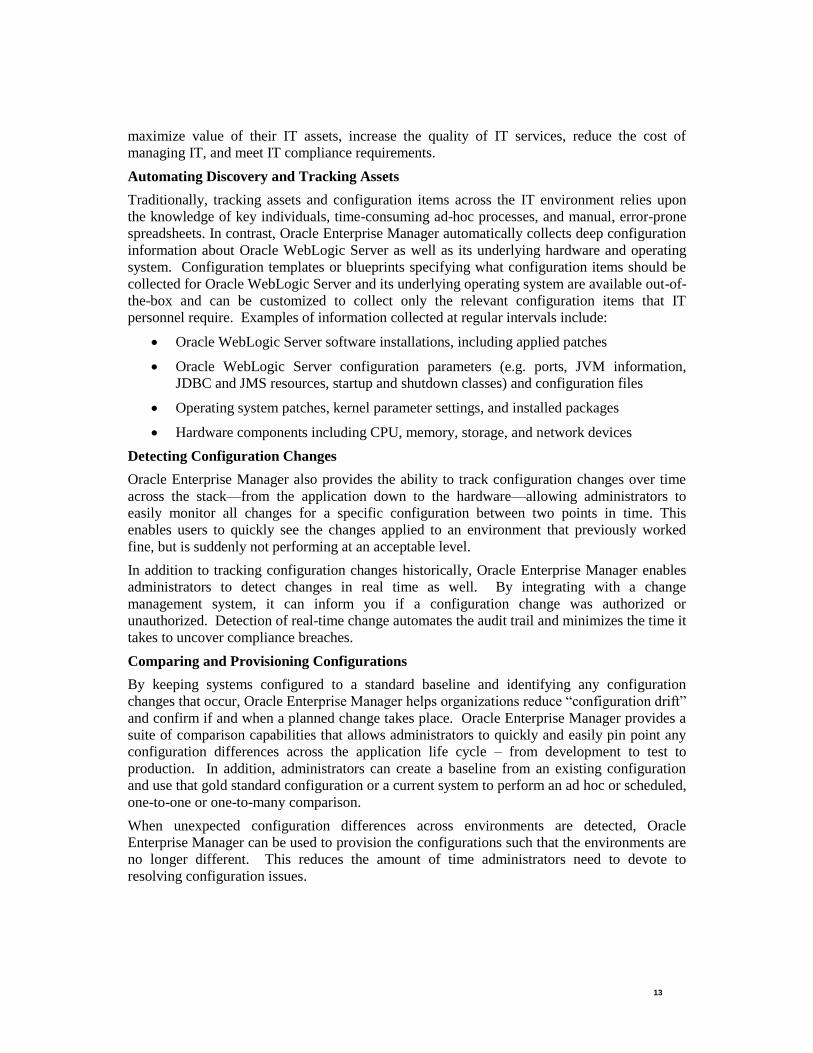
Ensuring Compliance with Standards
Ensuring compliance with standards such as SOX, ITIL, and PCI, as well as with unique
business standards, is a challenge. Oracle Enterprise Manager ships with several predefined
policies for Oracle WebLogic Server and also enables users to define their own specific
policies and groups to quickly demonstrate compliance with various regulations and standards.
Oracle Enterprise Manager tracks violations of these policies in a manner similar to
performance metrics, meaning notification rules can be applied and corrective actions can be
assigned to violations. For example, if an open port is detected, a corrective action could be
defined to automatically close that port.
Figure 7 - Dashboard showing level of compliance to standards
Operations Automation
Rather than spend resources on manually installing and configuring Oracle Fusion Middleware
software, administrators would rather spend time and money on more strategic initiatives. To
help achieve this, Oracle Enterprise Manager has automated common provisioning operations
such as cloning Oracle SOA Suite 11g and scaling out an Oracle WebLogic Domain, making
such critical datacenter operations easy, efficient and scalable results in lower operational risk
and lower cost of ownership.
Clone from Test to Production
Typically, creating a new environment to support SOA applications entails several manual,
error prone installation and configuration steps. With Oracle Enterprise Manager this can be
accomplished with very little effort and time via predefined, customizable deployment
procedures. Such deployment procedures clone an existing SOA Suite environment to a new
set of hardware per a hierarchical series of steps. These predefined steps can be edited or
disabled and new steps or custom scripts can be added to the deployment procedure to satisfy
unique business needs. While running the deployment procedure, administrators can specify
configuration settings such as the domain name, credentials for the administration console, port

15
values, and JDBC data resources. After the cloning operation completes, the newly created
SOA environment is discovered and automatically added to the console for centralized
management and monitoring.
Scale Out the Domain
To address growing business demands, modern data centers must augment and relocate
resources quickly. Using Oracle Enterprise Manager, administrators can rapidly scale out an
Oracle WebLogic Server domain and cluster with additional managed servers to accommodate
an increase in application load.
Support Workbench
When problems arise with Oracle Fusion Middleware that the IT organization cannot resolve
on their own, they must reach out to Oracle Support for assistance. To help Oracle Support
more quickly triage an issue, it is important to provide them with the necessary information to
diagnose the problem. Oracle Enterprise Manager simplifies the process of collecting
diagnostic data by providing the Support Workbench for Oracle Fusion Middleware. This
facility provides a self-service means for administrators to gather first-failure diagnostic data;
obtain a support request number, and upload diagnostic data to Oracle Support with a
minimum amount of effort and in a very short time, thereby reducing time-to-resolution for
Oracle WebLogic Server problems.
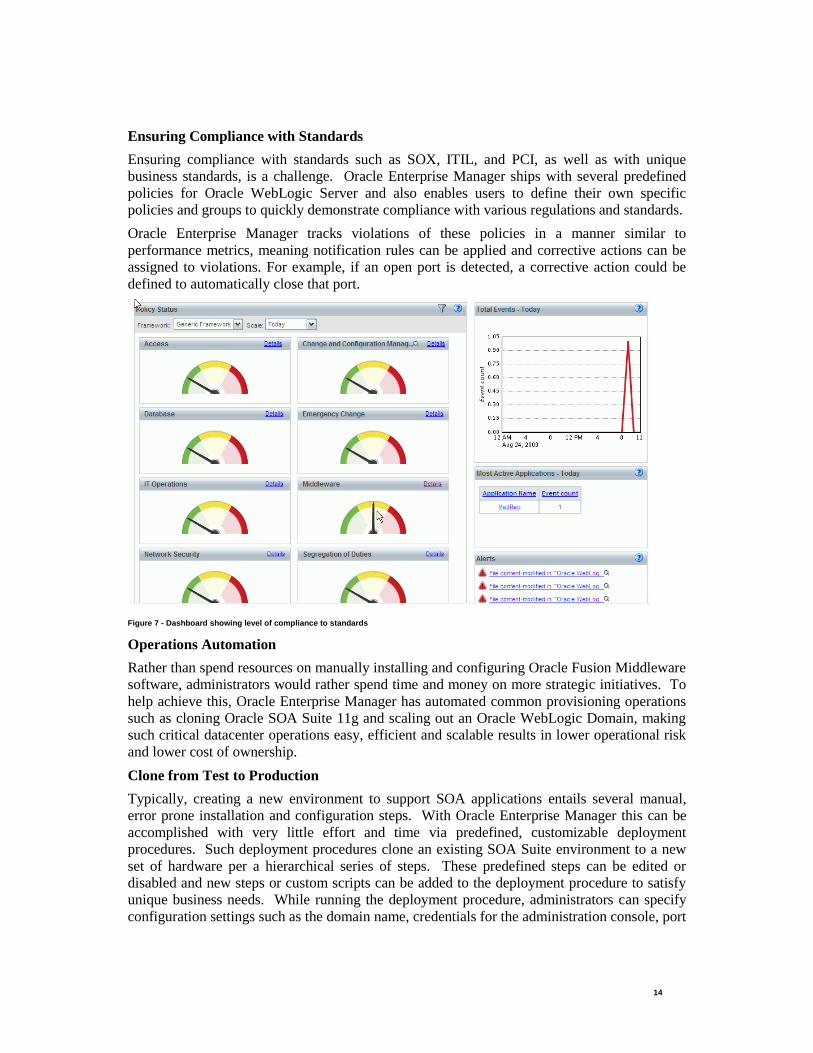
Oracle Coherence Management
Oracle Coherence is an in-memory data-grid that is used by enterprise applications to store
application objects. It helps business critical applications to provide very high throughput,
lower response time, predictable scalability, high availability and information reliability.
Oracle Coherence achieves that by distributing objects to multiple JVMs running on the
network.
While using Oracle Coherence immensely helps overall application performance, availability,
scalability, and reliability, it also may become a point of failure if not managed properly. For
example, application performance will be negatively impacted if the Coherence Caches are not
providing enough throughputs or if Coherence data-grid or portions of the data-grid are down.
Obviously, managing and monitoring Coherence is vital from application monitoring point of
view. Oracle Enterprise Manager is the only tool in the market today that addresses all areas in
this regard including real-time and historical monitoring of Coherence caches, provisioning
Coherence cluster or nodes, events management, life cycle management, and configuration
management.
16
Figure 8- Oracle Coherence dashboard showing potential performance hot spots
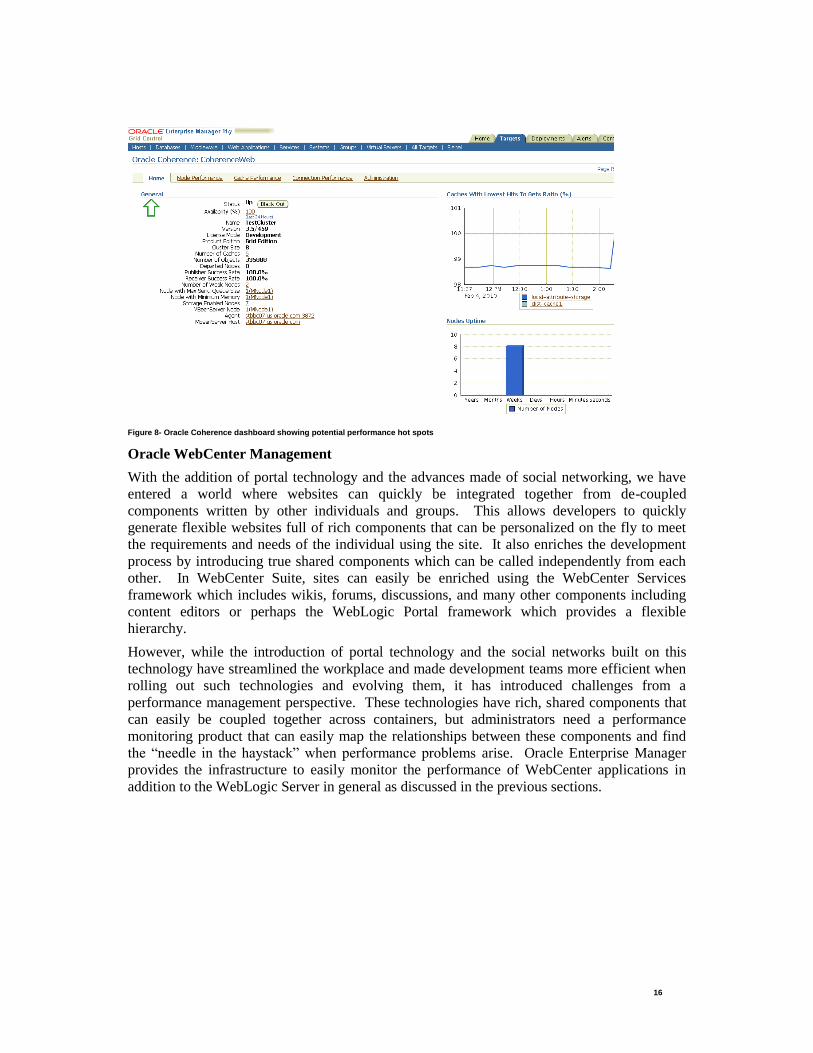
Oracle WebCenter Management
With the addition of portal technology and the advances made of social networking, we have
entered a world where websites can quickly be integrated together from de-coupled
components written by other individuals and groups. This allows developers to quickly
generate flexible websites full of rich components that can be personalized on the fly to meet
the requirements and needs of the individual using the site. It also enriches the development
process by introducing true shared components which can be called independently from each
other. In WebCenter Suite, sites can easily be enriched using the WebCenter Services
framework which includes wikis, forums, discussions, and many other components including
content editors or perhaps the WebLogic Portal framework which provides a flexible
hierarchy.
However, while the introduction of portal technology and the social networks built on this
technology have streamlined the workplace and made development teams more efficient when
rolling out such technologies and evolving them, it has introduced challenges from a
performance management perspective. These technologies have rich, shared components that
can easily be coupled together across containers, but administrators need a performance
monitoring product that can easily map the relationships between these components and find
the ―needle in the haystack‖ when performance problems arise. Oracle Enterprise Manager
provides the infrastructure to easily monitor the performance of WebCenter applications in
addition to the WebLogic Server in general as discussed in the previous sections.
17
Figure 9 - Automatic discovery of WebCenter applications
Dependencies and Contextual Performance Analytics for WebCenter and WebLogic
Portal
Oracle Enterprise Manager automatically discovers WebCenter Services and WebLogic Portal
applications and provides full top-down visibility of the architecture of applications. This
allows administrators to literally drill-down from top-level WebCenter Services and WebLogic
Portal Desktops into the underlying components where bottlenecks usually reside when
present. By providing this high level of visibility into the components that make up
applications built on top of WebCenter Suite, administrators can ensure that they are not
dealing with a ―black box‖ application. They are ensured that any problem that arises can be
resolved in a timely manner and through proactive performance management; they can identify
potential problems before they impact the business.
Oracle Enterprise Manager provides visibility into the following WebCenter components:
WebCenter Services
ADF Task Flows
Portlets
JSF Pages
Group Spaces
WebLogic Portal Desktops, Books, Pages
Underlying Java EE services and components that support your WebCenter
applications such as EJBs and JDBC
Oracle SOA Management
Enterprises have adopted service oriented architectures to speed the time-to-market for new
applications and reduce the cost of development. Use of Oracle SOA infrastructure, such as the
Oracle SOA Suite and the Oracle Service Bus, allows businesses to flexibly create and
compose new capabilities while maximizing the re-use of existing enterprise services. The
18
increasingly powerful orchestrations that Oracle SOA infrastructure enables also bring certain
complexities in the management of these services. Business transactions may now span many
departmental, enterprise, and even 3rd party systems. Orchestration behavior may now be
implemented using dynamic, tool-driven configuration rather than as Java code.
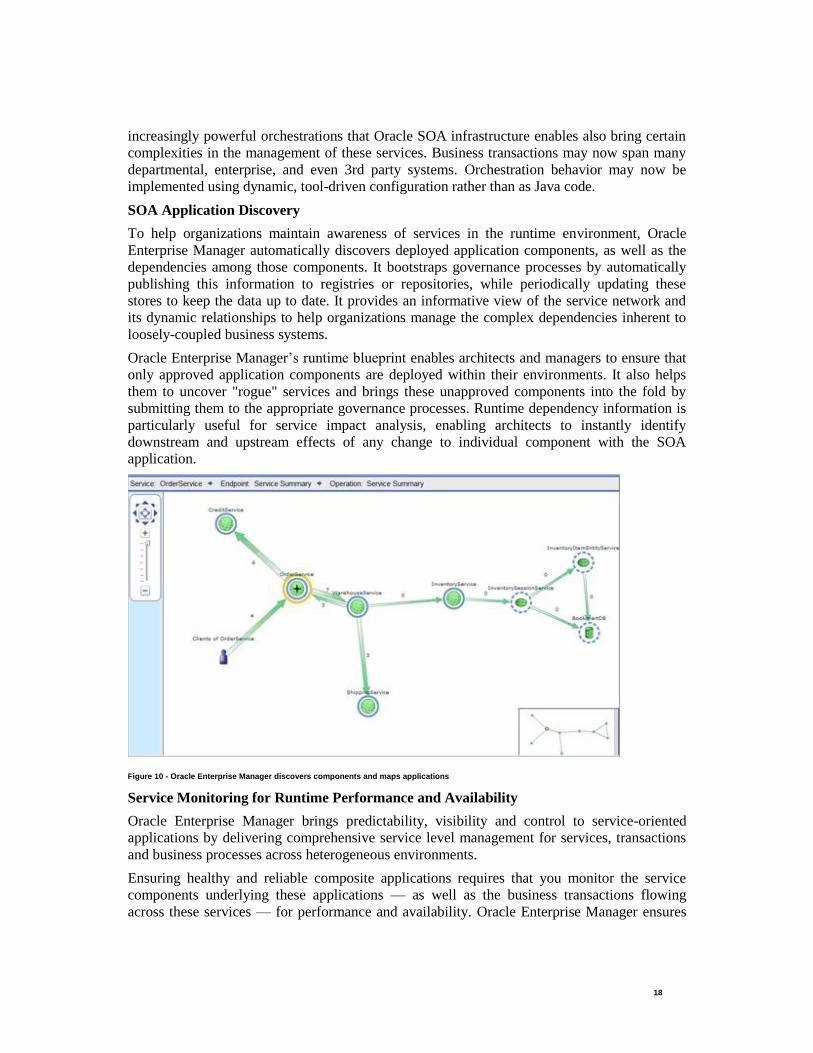
SOA Application Discovery
To help organizations maintain awareness of services in the runtime environment, Oracle
Enterprise Manager automatically discovers deployed application components, as well as the
dependencies among those components. It bootstraps governance processes by automatically
publishing this information to registries or repositories, while periodically updating these
stores to keep the data up to date. It provides an informative view of the service network and
its dynamic relationships to help organizations manage the complex dependencies inherent to
loosely-coupled business systems.
Oracle Enterprise Manager‘s runtime blueprint enables architects and managers to ensure that
only approved application components are deployed within their environments. It also helps
them to uncover "rogue" services and brings these unapproved components into the fold by
submitting them to the appropriate governance processes. Runtime dependency information is
particularly useful for service impact analysis, enabling architects to instantly identify
downstream and upstream effects of any change to individual component with the SOA
application.
Figure 10 - Oracle Enterprise Manager discovers components and maps applications
Service Monitoring for Runtime Performance and Availability
Oracle Enterprise Manager brings predictability, visibility and control to service-oriented
applications by delivering comprehensive service level management for services, transactions
and business processes across heterogeneous environments.
Ensuring healthy and reliable composite applications requires that you monitor the service
components underlying these applications — as well as the business transactions flowing
across these services — for performance and availability. Oracle Enterprise Manager ensures
19
composite application health by providing real-time visibility into key performance indicators
such as throughput, availability and response times.
Oracle Enterprise Manager continuously monitors actual application traffic to collect data on
the operational health of application components and their affiliated business transactions.
Oracle Enterprise Manager extends this visibility to primary application services as well as
their supporting implementation components such as EJBs, JMS services and POJOs on Java.
Oracle SOA Management can monitor services that rely on literally any transport, including
HTTP, JMS, RMI, and JDBC.
Oracle SOA management provides the end-to-end visibility necessary to operate SOA
applications, providing:
Real-time monitoring of individual service components and business transactions
Key performance indicators visualized in charts and graphs for easy analysis
Automated data archiving for historical reporting
Oracle Enterprise Manager generates a bird‘s-eye-view across your network of application
components, making critical operational information available at a glance. It provides live,
color-coded network graphs for rapid identification of operational issues, with rich filtering
capabilities across operational and business information to evaluate specific components of
interest. Once components are identified for analysis, contextual drill downs provide
immediate access to information on specific issues, alerts and faults.
On top of real-time monitoring, Oracle Enterprise Manager enables users to apply service-level
agreements to SOA applications and the business transactions that flow across them. It
aggregates and analyzes performance data from components across the distributed
environment, and enables administrators to define both internal targets as well formal SLA
objectives. Administrators can set multiple thresholds for warnings and failures, and make use
of realistic performance baselines, drawn from runtime data and historical trends. Once SLAs
are have been applied to SOA applications, administrators can make use of detailed service
level views by operations, services, processes/applications, customers or user-defined business
context.
With Oracle Enterprise Manager administrators can target SLAs toward discrete business
segments, such as gold customers, key business partners, or top-tier suppliers. The SLAs
defined can prioritize service use by any business criteria—such as focusing on the most
valuable users (customers, partners.) or providing the best QoS during peak hours. SLAs can
be set and monitored for individual services as well as composites such as processes and
transactions, and they are monitored continuously and in real time. Calendaring capabilities
enable administrators to define when an SLA is and is not in effect, for example, only during
business hours from Monday to Friday, or during scheduled maintenance every Saturday. This
prevents false-positive alerts from being sent to the operations teams.
For each SLA, administrators create a set of service level objectives (SLOs). To determine if
an objective has been met (say, an average response time of less than 8 seconds) the Oracle
Enterprise Manager evaluates the objective based on:
Measurable data about a service — response time, throughput, availability, faults, average response time, etc.
20
Performance during specified times — e.g., Monday through Friday from 8:00 AM to
5 PM
Periodic evaluations — every ten seconds or every eight hours
Consumers of the service – Platinum versus Bronze customers, for example
Ideally, an IT team would like to act before an SLA objective has been violated. Also, IT
should be able to create multiple objectives (potentially for different user roles) for a single
SOA application component. To meet these needs, Oracle Enterprise Manager enables
administrators to set performance ―targets‖ that function as the unofficial thresholds
complementing formal ―objectives‖. The ―tripwires‖ can alert administrators to impending
failures—before customers are impacted or contractual SLA objectives are violated—saving
the enterprise from customer churn as well as penalties imposed for failed SLA compliance.
As the IT team manages their processes over time, historical knowledge will give them added
insight—including the ability to identify bottlenecks, fine-tune service level objectives and
observe changes in system health. Enterprises can build historical insight into these service-
oriented applications and use this insight to clearly understand the business impact of varying
service levels. Oracle Enterprise Manager provides historical reporting that covers all aspects
of SOA application performance monitoring.
Operational availability and service level conformance often extends to periods when, due to
variation in user patterns, there may be inadequate or no load on the particular component in
question. For instance, a back-end service dependency may malfunction at 3AM when there is
no traffic. It would be desirable to detect that the service endpoint is failing prior to the first
traffic at 7AM when users begin to execute transactions. Additional infrastructure
preconditions may exist, such has DNS or network availability that is not specific back-end
service dependencies, but will cause service failures if they break down.
Oracle Enterprise Manager augments transaction and infrastructure monitoring with synthetic
transaction monitoring that can be used to actively determine the functional behavior of a large
variety of services and infrastructure components. Periodic tests can be executed against web
service and HTTP endpoints to verify that they are behaving the way they are supposed to.
ICMP pings and DNS lookups can be run against different network segments or DNS servers
in order to ensure that basic infrastructure is working.
In addition to availability and performance conformance, Oracle Enterprise Manager also
centralizes security policy conformance metrics generated by the Oracle Web Services
Manager to give a view into all aspects of the SOA infrastructure summarized onto a single
page.
Diagnostics and Root-cause Analysis
SOA applications introduce a new order of complexity in tracking down failures. One
challenge for operations trying to identify transaction bottlenecks is that the problem could
originate anywhere in the stack. It could result from components in the implementation layer
of the service, or it might actually be located in one of many replicated services or in the
infrastructure supporting the orchestrated services. Some SOA applications may support long-
running or asynchronous transactions, involving human interaction and spanning multiple
systems and several days. All of this makes it tremendously difficult to pinpoint the source of a
failure.
21
Oracle Enterprise Manager gives administrators the ability to view composite application
dependencies in real-time. Exceptions in SOA applications are often technical (such as invalid
data in requests, transport-level errors, or inaccurate responses) but they can also be business
events (like excessive weight of shipment, a credit rejection for a premier customer, or an
exceptionally large order). Such business exceptions are rarely understood by existing
application monitoring solutions running on an e-commerce website (such as ―Sorry, unable to
process request at this time‖), delayed orders, lost packages, rejected insurance claims, and so
on. However, with Oracle Enterprise Manager, these business exceptions can be brought to
the forefront and analyzed within a business transaction.
When SOA applications are failing, proactive alerting is required to initiate the diagnostic
process before the phone starts ringing. Administrators can configure alerts in Oracle
Enterprise Manager to let them know when:
A SOA application is approaching SLA limits
Transactions fail to complete—e.g. order fallouts, missing packages, missing phone
activations etc.
SOA applications throw technical or business exceptions
Business parameters are violated—for example, a purchase order exceeds a user‘s
purchasing limit
Oracle SOA management offers end-to-end transaction tracking and recording to capture this
context and the tools to sift through these transactions to isolate the problematic ones. Out-of-
the-box search capabilities enable auditing and diagnostics of transactions after-the-fact, and
script-based interfaces provide support for integration log-analysis tools, for highly customized
diagnosis of transactions and application behavior.
Configuration and Lifecycle Management
SOA application environments are often complex with many components working together in
tandem. Behind the scenes of a transaction flow are a complex assortment of configuration
settings and deployment artifacts, whose presence and content are critical to the proper
functioning of a system. By understanding these artifacts natively and automating their
management, Oracle Enterprise Manager enables operators to save significant amounts of time
and effort.
Configuration information about the applications and server infrastructure are continuously
gathered and stored in a repository. Administrators can compare configurations over time and
monitor drift. During critical outages (especially during QA where changes may occur
frequently and costly test resources may sit idle when a system is down), administrators can
compare current configuration settings to a known good set and quickly identify changes that
could be the root cause. SOA application components (e.g. BPEL processes or SOA
composites) can be cloned from staging servers into a software library. These ―gold master‖
components can then be deployed centrally to rapidly scale out an application or quickly revert
that application to a known good state.
Oracle Identity & Access Management
As more and more businesses rely on the Oracle Identity and Access Management Suite to
control access to their mission-critical applications (both packaged applications and custom-
22
built web applications) and to provision resources across their organizations, the need to
achieve predictable performance and availability for Oracle Identity Management systems has
become a top priority for many businesses. An outage or slow performance in access and
identity services, for instance, can have negative impacts on the business bottom-line as end-
users are unable to log in to mission-critical applications. To help administrators maximize the
value of Oracle Identity Management systems, and to deliver a superior ownership experience
while keeping a lid on the systems management costs, Oracle Enterprise Manager an integrated
and top-down solution for your Oracle Identity Management environment.
Single-Step Discovery
A simple target discovery wizard is available for both Identity Management 10g and Identity
Management 11g components. Single-step discovery enables administrators to quickly set up
their monitoring environment. Upon completing target discovery, configuration settings that
are defined in the monitored Oracle Identity Management targets will be automatically
detected and stored in the Management Repository.
Configuration Management
With Oracle Enterprise Manager, administrators can perform key configuration management
tasks like keeping track of configuration changes, taking snapshots to store configurations, and
comparing component configurations. To ensure that the configurations of all critical Oracle
Identity Management components in a production environment are consistent with staging or
test environments, administrators can save working configurations into the Management
Repository or into an external XML file and then compare the configuration in the production
environment against the test or staging environments. Configuration comparison helps
administrators ensure the consistency of configurations in their environment – thus reducing
―configuration drift.‖ To diagnose performance problems that may be related to system
configuration changes, administrators can keep track of all configuration changes to locate the
root cause of performance problems.
Performance Monitoring
With Oracle Enterprise Manager, administrators can proactively monitor their Oracle Identity
Management environment from both systems & end-user perspectives. A wide range of out-of-
box performance metrics are collected for monitored Oracle Identity Management targets
allowing administrators to set up alerts based on warning and critical thresholds, view current
and historical performance information using graphs and reports, and diagnose performance
problems by identifying bottlenecks in any of the monitored Oracle Identity Management
targets.
Using Oracle Enterprise Manager, \ administrators can monitor the health of all critical Identity
Management components – including both Identity Management 10g and Identity
Management 11g components. Thresholds may be defined against server and component
statistics such as CPU utilization, the number of failed and successful
authentications/authorizations, average response time, provisioning metrics (e.g. number of
newly provisioned/created/deleted/disabled/locked users), Identity Provider and Service
Provider metrics, and up/down status of servers and components.
In addition to relying on system performance metrics, administrators can record synthetic web
transactions that include a combination of one or more navigation paths within the application
to be used as the criteria for determining the service‘s availability. For example, Oracle Access
23
Manager requires that a user be successfully authenticated and authorized against a certain
WebGate for the service to be considered available. Oracle Enterprise Manager uses these
logical tasks or ‗transactions‘ to define the availability of the Identity Management
environment. In addition to synthetic web transactions, Oracle Enterprise Manager also
supports LDAP tests that allow administrators to record LDAP operations against a specific
LDAP server (including Oracle Virtual Directory). With the LDAP tests, administrators can
specify the username/password, Search Filter, Search Base, and Compare Attribute
Name/Value. These synthetic web transactions are recorded, and the stored transaction or
‗service test‘ can be launched at a user-defined interval from strategic locations across the
user-base.
Service Level Management
A common dilemma in organizations is balancing business needs with IT spending. Since
Identity Management services address how organizations authenticate people, manage their
access to confidential information, and audit the transactions that flow between the various
systems, Identity Management administrators constantly need to satisfy application owners
while keeping a lid on spending and increasing IT efficiency. Key questions that need to be
answered include:
What is the impact of Identity Management on business applications?
How do we prioritize Identity Management activities according to business needs?
When changes are made to the Identity Management environment, what is the
potential impact on the business?
Some key performance indicators (KPI) needed to answer these questions may be traditional
system-based indicators while others may need to be derived from the business applications
that depend on the Identity Management infrastructure for access control and user
provisioning. Oracle Enterprise Manager‘s service level management capabilities help
administrators define service level objectives (SLO) based on business requirements, model
the end-to-end Identity Management service down to the system components it depends on,
monitor performance against these goals, and report on service level agreement (SLA) (or
operational level agreement (OLA)) to key stakeholders.
With Oracle Enterprise Manager, administrators can model services for Oracle Identity
Management allowing them to view information on the availability of the service based on the
underlying Identity Management components that host the service or based on service tests
that most closely match the critical functionality of your Identity Management process.
Aggregated information on the status of the service and underlying components are
summarized on the Identity Management Service home page allowing you to obtain an overall
perspective on the environment and monitor service level agreements (SLAs) in real-time.
Additionally, administrators can create customized reports to communicate SLA compliance to
the application owners.
24
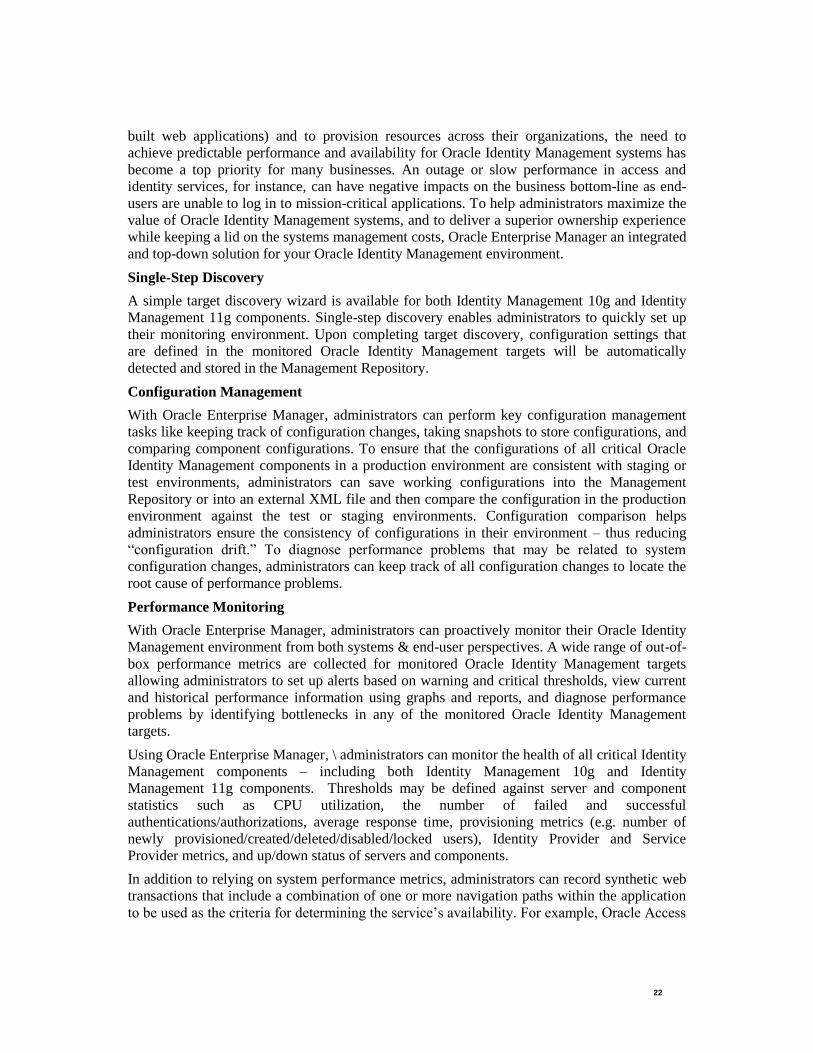
Figure 11 - Oracle Identity Management Services Dashboard
Oracle Business Intelligence Management
A key requirement for managing Oracle BI EE and Oracle BI Applications is the ability to
manage BI-specific components such as Oracle BI Server, Oracle BI Presentation Server,
Oracle BI Scheduler, Oracle BI Cluster Controller and Oracle BI DAC Server, as well as
infrastructure components such as databases and operating systems. All these components
must work optimally together in order to deliver the required availability and performance
targets. Oracle Enterprise Manager‘s capabilities in configuration management, application
performance management, and service level management provide a centralized systems
management solution for Oracle BI EE and Oracle BI Applications. Through the service level
management (SLM) capabilities, administrators can define the availability and performance
requirements of an end-to-end Oracle BI environment, and then monitor the application
environment according to these requirements. This approach helps administrators focus
resources on issues that are truly important – those that actually impact business.
Single-Step Discovery
A simple target discovery wizard for Oracle BI middleware components allows administrators
to quickly set up their monitoring environment. Upon completing target discovery,
configuration settings that are defined in the monitored Oracle BI targets will be automatically
detected and stored in the Management Repository.
Configuration Management
With Oracle Enterprise Manager, administrators can perform key configuration management
tasks like keeping track of configuration changes, taking snapshots to store configurations, and
comparing component configurations. To ensure that the configurations of all critical Oracle
BI components in the production environment are consistent with the staging or test
environments, administrators can save working configurations into the Management
Repository or into an external XML file and then compare the configuration in the production
environment against the test or staging environments. Configuration comparison helps
administrators ensure the consistency of configurations in the application environment – thus
reducing ―configuration drift.‖ Configuration comparisons also simplify investigations into
why components that are presumed to be identical are behaving differently. To diagnose
performance problems that may be related to system configuration changes, administrators can
keep track of all configuration changes to locate the root cause of performance problems.
Administrators may query against Oracle Enterprise Manager‘s Management Repository to
find out whether any Oracle BI component parameter has changed.
25
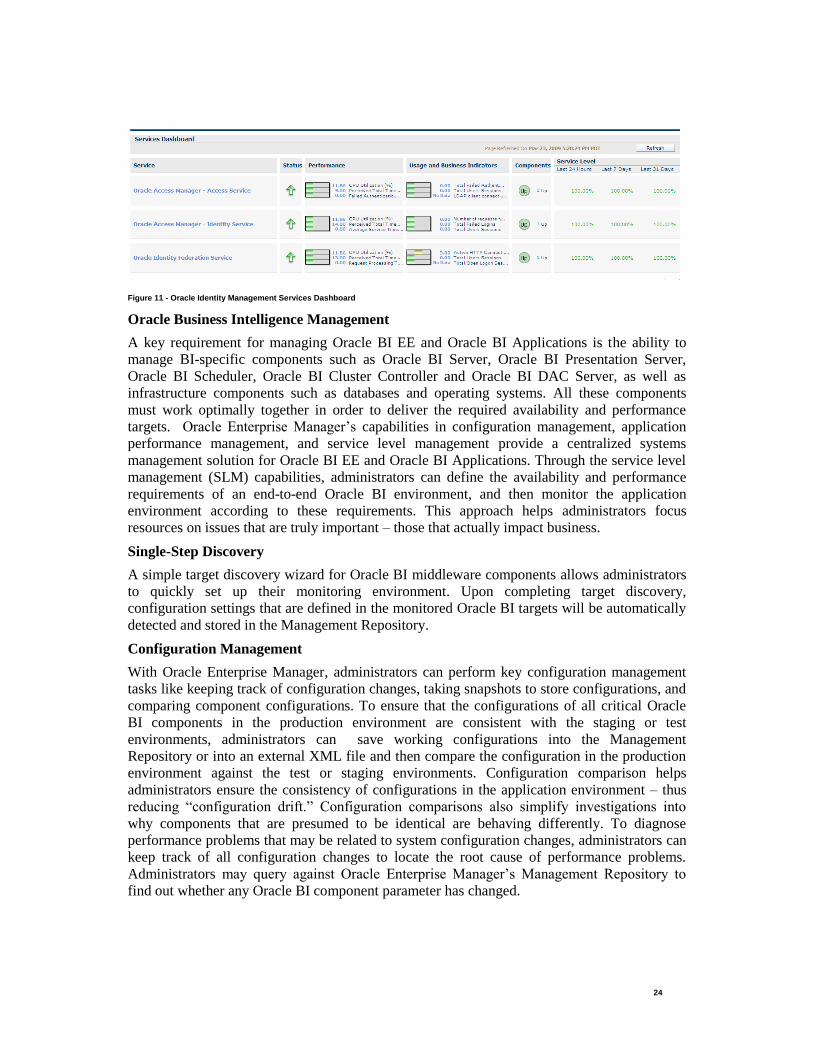
Figure 12 - Configuration Comparison Performance Monitoring
With Oracle Enterprise Manager, administrators can proactively monitor their Oracle BI
environment from both systems & end-user perspectives. A wide range of out-of-box
performance metrics are collected for monitored Oracle BI targets allowing administrators to
set up alerts based on warning and critical thresholds, view current and historical performance
information using graphs and reports, and diagnose performance problems by identifying
bottlenecks in any of the monitored Oracle BI targets.
You can also monitor the Oracle BI environment from an end-user perspective using synthetic
service tests and out-of-box dashboard usage reports. Service tests can be recorded to simulate
key end user activities such as logging in and navigating through critical pages of Oracle BI
Dashboards. The tests are run via beacons from locations within your network to actively
measure the performance and availability of your Oracle BI application. Because these tests
are played back automatically via beacons and do not rely on actual end users being present,
they can be used for accurate performance trending analysis and for proactive monitoring.
In addition to synthetic service tests, you can view detailed information about dashboard usage
through Dashboard Reports that summarize key query statistics. Dashboard Reports enable
administrators to maximize the value of their application by delivering insight into real end
user experiences. They provide key statistics for usage trending analysis – allowing
administrators to view detailed information about the top dashboards by resource usage as well
as top users by resource usage. In addition to usage trending, these reports can help
administrators diagnose performance problems by showing a complete listing of failed
dashboards along with the error code/message and SQL statements associated with the failed
queries and a breakdown of dashboard response time based on database time, compile time and
overall time for end-user queries.
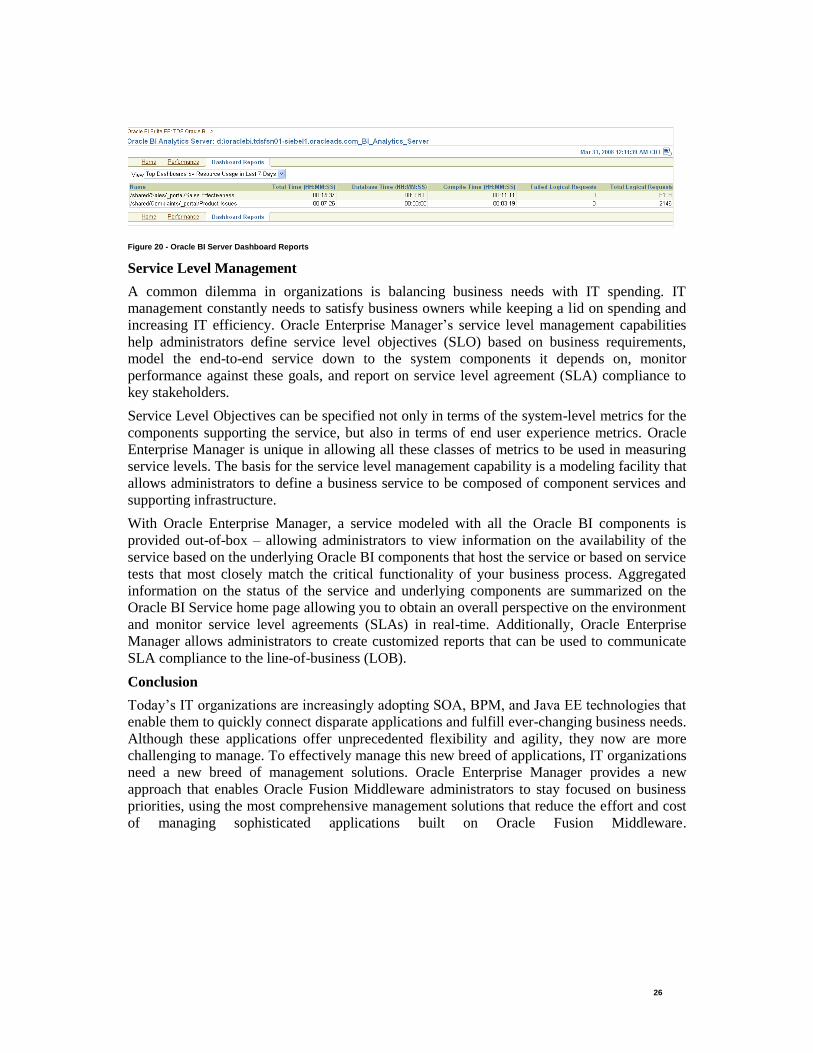
26
Figure 20 - Oracle BI Server Dashboard Reports
Service Level Management
A common dilemma in organizations is balancing business needs with IT spending. IT
management constantly needs to satisfy business owners while keeping a lid on spending and
increasing IT efficiency. Oracle Enterprise Manager‘s service level management capabilities
help administrators define service level objectives (SLO) based on business requirements,
model the end-to-end service down to the system components it depends on, monitor
performance against these goals, and report on service level agreement (SLA) compliance to
key stakeholders.
Service Level Objectives can be specified not only in terms of the system-level metrics for the
components supporting the service, but also in terms of end user experience metrics. Oracle
Enterprise Manager is unique in allowing all these classes of metrics to be used in measuring
service levels. The basis for the service level management capability is a modeling facility that
allows administrators to define a business service to be composed of component services and
supporting infrastructure.
With Oracle Enterprise Manager, a service modeled with all the Oracle BI components is
provided out-of-box – allowing administrators to view information on the availability of the
service based on the underlying Oracle BI components that host the service or based on service
tests that most closely match the critical functionality of your business process. Aggregated
information on the status of the service and underlying components are summarized on the
Oracle BI Service home page allowing you to obtain an overall perspective on the environment
and monitor service level agreements (SLAs) in real-time. Additionally, Oracle Enterprise
Manager allows administrators to create customized reports that can be used to communicate
SLA compliance to the line-of-business (LOB).
Conclusion
Today‘s IT organizations are increasingly adopting SOA, BPM, and Java EE technologies that
enable them to quickly connect disparate applications and fulfill ever-changing business needs.
Although these applications offer unprecedented flexibility and agility, they now are more
challenging to manage. To effectively manage this new breed of applications, IT organizations
need a new breed of management solutions. Oracle Enterprise Manager provides a new
approach that enables Oracle Fusion Middleware administrators to stay focused on business
priorities, using the most comprehensive management solutions that reduce the effort and cost
of managing sophisticated applications built on Oracle Fusion Middleware.
27
Contact address:
Oracle Corporation
500 Oracle Parkway
Redwood City, CA 94065
USA
Phone: +1 650.506.7000
Fax: +1 650.506.7200
oracle.com
![Oracle Fusion Middleware XML Schema Reference for Oracle … · 2015-12-17 · 1[]Oracle® Fusion Middleware XML Schema Reference for Oracle Business Intelligence Enterprise Edition](https://img.dokumen.tips/doc/110x75/5f28ed2f73da546efe3b3c82/oracle-fusion-middleware-xml-schema-reference-for-oracle-2015-12-17-1oracle.jpg)


![[1]Oracle® Fusion Middleware Understanding Oracle ... · [1]Oracle® Fusion Middleware Understanding Oracle Enterprise Data Quality 12c (12.2.1.1.0) E69483-01 June 2016](https://img.dokumen.tips/doc/110x75/60102cb1674d777e9d729999/1oracle-fusion-middleware-understanding-oracle-1oracle-fusion-middleware.jpg)