Embed Size (px)
Citation preview

6/11/2012
1
Managing in a
Managed Care
Environment
Dale Jarvis, CPA
www.djconsult.net
www.djconsult.net
2

6/11/2012
2
Context for My Session
• There’s Mac Truck of
change coming straight
at you in 2014
• For some, the near future
is going to look like you’re
on a foreign planet
3
• One Request
• Keep Breathing
4

6/11/2012
3
Agenda – Four Chapters• The many hats of a County
Financial Manager (and the three I’m asking you to wear today).
• Looking at the numbers: the implications of coverage expansion in 2014 and beyond.
• Deciphering the writing on the wall – moving to a true managed care system.
• So, what does a highly functional, county-level, managed behavioral healthcare system look like?
5
Chapter 1: The many
hats of a County
Financial Manager
(and the three I’m
asking you to wear
today)
6

6/11/2012
4
“Mental Model” for Thinking about the New Role of the County Financial Manager
• The County MH/SU Financial Manager ought to possess five sets of skills, wearing five “hats”:
1. Chief Accounting OfficerResponsible for all aspects of the Financial Accounting System (e.g. AP, payroll, GL).
2. Chief Revenue Cycle OfficerResponsible for the patient Accounting System (e.g. Billing, AR, Collections).
3. Chief Financial PlannerCoordinating the Planning and Performance Management activities including the Annual Budgeting process and ongoing reporting and monitoring of financial and non-financial metrics.
4. Chief Risk OfficerIn charge of Government Reporting, Audits, Internal Controls, etc.
5. Chief Financial AdvisorResponsible for supporting the Board, Management Team and Service Delivery Departments.
Chief Financial Officer “Hats” and
Areas of Responsibility, View 1
Financial
Accting
System Mgmt
Client
Accting/Rev
Cycle Mgmt
Planning &
Performance
Mgmt
Risk &
Compliance
Mgmt
Executive
Management
Chief
Accounting
Officer
Chief
Revenue Cycle
Officer
Chief
Financial
Planner
Chief
Risk
Officer
Chief
Financial Advisor

6/11/2012
5
Chief Financial Officer “Hats” and
Areas of Responsibility, View 2
Chief
Accounting
Officer
Chief
Revenue
Cycle
Officer
Chief
Financial
Planner
Chief Risk
Officer
Chief
Financial
Advisor
A. Financial Accounting System Management
1 Purchasing/AP Cycle
2 Cash and Debt Management
3 Payroll Cycle
4 Fixed Assets and Inventory
5 Grant and Contract Management
6 Cost Allocation Management
7 General Ledger
8 Financial Reporting
B. Client Accounting/Revenue Cycle Management
1 Intake/Appointment Scheduling
2 Client Intake/Registration
3 Visit Data Capture
4 Payment (time of visit)
5 Third Party Billing
6 Client Billing
7 Payment Entry
8 Account Follow-up
9 Account Resolution
10 System Setup/Maintentance
11 Usual and Customary Fee Setting
Chief Financial Officer “Hats” and
Areas of Responsibility, View 2
Chief
Accounting
Officer
Chief
Revenue
Cycle
Officer
Chief
Financial
Planner
Chief Risk
Officer
Chief
Financial
Advisor
C. Planning & Performance Management1 Long Range Planning
2 Annual Planning and Budgeting
3 Performance Standard Setting
4 Reporting System Design and Development
5 Report Production
6 Ongoing Monitoring - Performance Data Analysis
7 Corrective Actions and Process Improvement
D. Risk and Compliance Management
1 Government Reporting
2 Audit Management
3 Internal Controls Management
4 Federal Compliance
5 Insurance Management
E. Executive Management
1 Board Support
2 Management Team Support
3 Service Delivery Support
4 Finance Dept staff supervision/oversight

6/11/2012
6
Chapter 2: Looking
at the numbers;
the implications of
coverage expansion
in 2014 and beyond
11
A bit of context about the numbers
• We are going to look
at data from a soon-
to-be-published CIMH
Policy Brief about the
California Health
Benefits Exchange
• Keep an eye out for an
in-depth CIMH
webinar on this topic
later in June12
Ignore the typoes typos

6/11/2012
7
Tables 1 & 2
13
Table 3
14

6/11/2012
8
15
16
6/11/2012
9
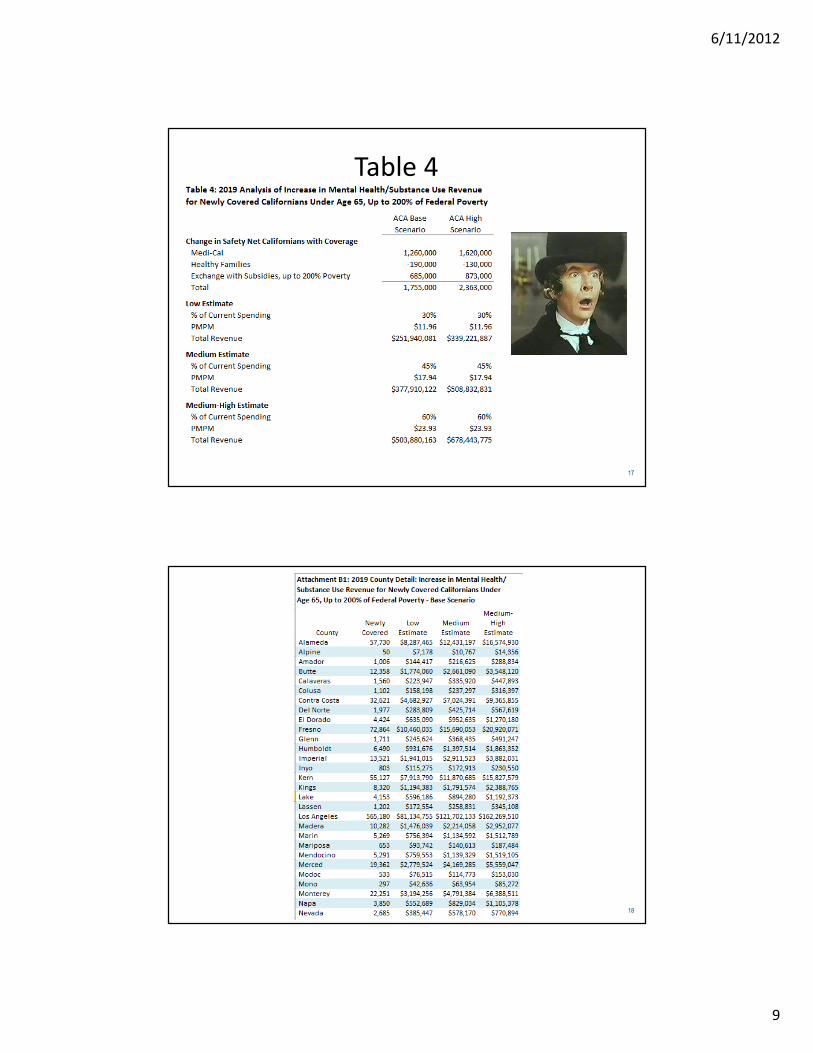
Table 4
17
18

6/11/2012
10
19
Tables 6 & 7
20

6/11/2012
11
The Punch Line…2,000,000 more in the safety net with coverage
+
300,000 – 400,000 more seeking MH/SU service
+
Up to $500,000,000 or more of additional MH/SU revenue
+
6,000 – 8,000 more clinicians needed to meet the demand
=
A description of a system on the brink of major change
21
Chapter 3: Deciphering
the writing on the wall;
moving to a true
managed care
system
22
6/11/2012
12
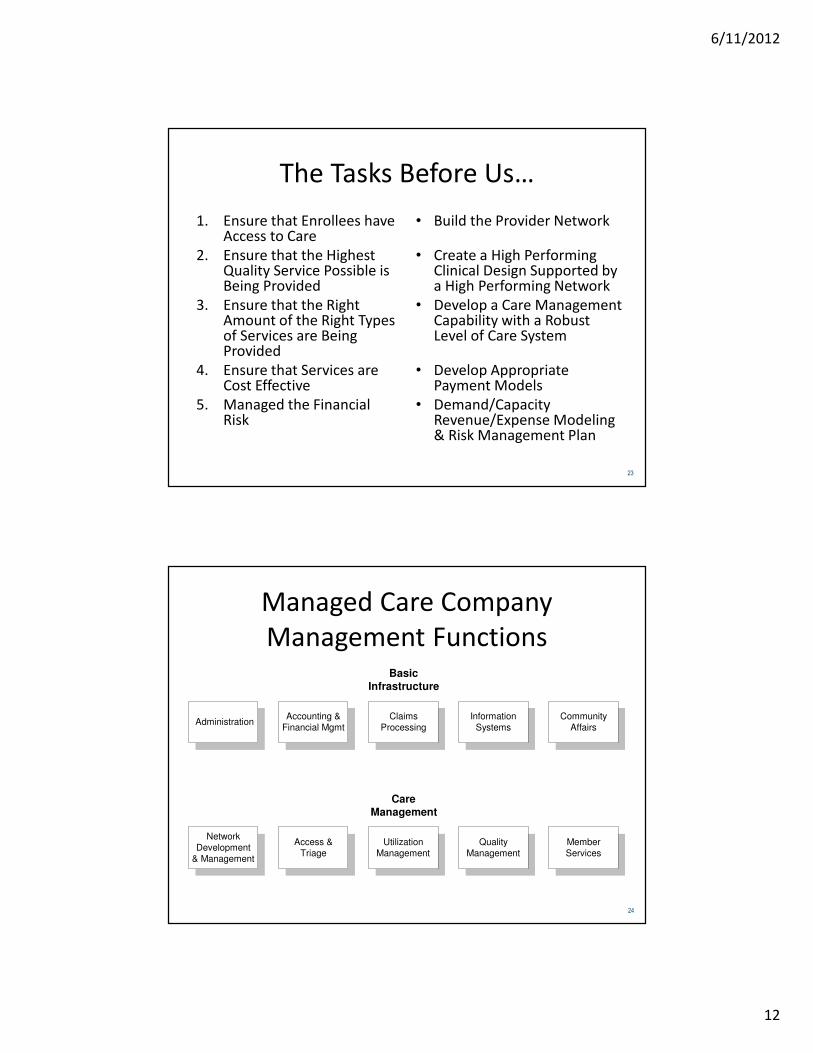
The Tasks Before Us…
1. Ensure that Enrollees have Access to Care
2. Ensure that the Highest Quality Service Possible is Being Provided
3. Ensure that the Right Amount of the Right Types of Services are Being Provided
4. Ensure that Services are Cost Effective
5. Managed the Financial Risk
• Build the Provider Network
• Create a High Performing Clinical Design Supported by a High Performing Network
• Develop a Care Management Capability with a Robust Level of Care System
• Develop Appropriate Payment Models
• Demand/Capacity Revenue/Expense Modeling & Risk Management Plan
23
Managed Care Company
Management Functions
Network
Development
& Management
Claims
Processing
Utilization
Management
Member
Services
Accounting &
Financial Mgmt Administration
Information
Systems
Quality
Management
BasicInfrastructure
Access &
Triage
CareManagement
Community
Affairs
24

6/11/2012
13
In Other Words…• Many California Counties are
going to have to up their
game to become full blown
Medicaid Behavioral Health
Plans (e.g. true managed
care organizations)
• With greater distinction
between the roles of:
– Medicaid Health Plan
– Service Provider
• An build a more robust
provider network and
managed care infrastructure
25
And…The Payment Models
are Going to Change• Fee for Service is going to be
replaced by models that move from paying for volume to paying for value
• This means you, as a payor, will be contracting with your network providers with:
– Modified Fee for Service
– Case Rates
– Sub-Capitation
• As soon as the regulatory structure catches up to support this 26

6/11/2012
14
Chapter 4: So, what does a
highly functional, county-level,
managed behavioral healthcare
organization look like?
27
Chapter 4 Topics
• Clinical/Financial Design Process
• Network Development Process
• Understanding Risk & Payment Models
• Risk Management Planning
• Mini-Tutorial: How to Set Case Rates
28
6/11/2012
15
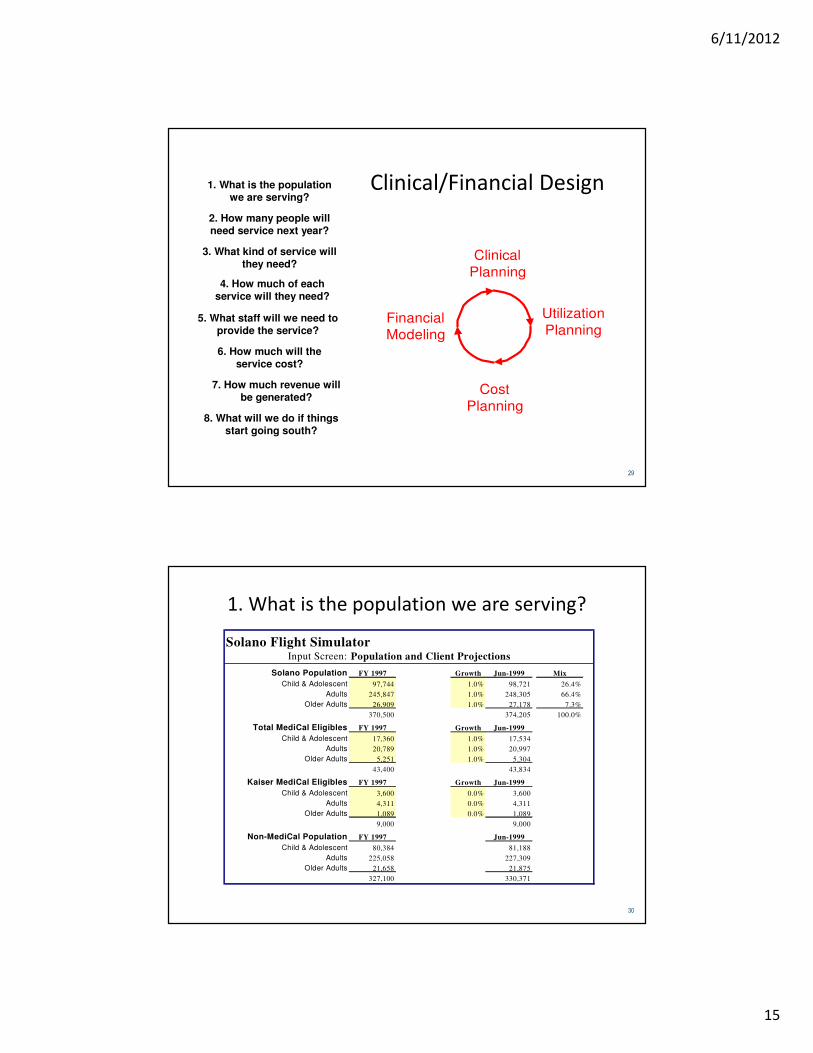
Clinical/Financial Design
Clinical
Planning
Utilization
Planning
Cost
Planning
Financial
Modeling
1. What is the populationwe are serving?
2. How many people willneed service next year?
3. What kind of service willthey need?
4. How much of eachservice will they need?
5. What staff will we need toprovide the service?
6. How much will theservice cost?
7. How much revenue willbe generated?
8. What will we do if thingsstart going south?
29
1. What is the population we are serving?
Solano Flight SimulatorInput Screen: Population and Client Projections
Solano Population FY 1997 Growth Jun-1999 Mix
Child & Adolescent 97,744 1.0% 98,721 26.4%
Adults 245,847 1.0% 248,305 66.4%
Older Adults 26,909 1.0% 27,178 7.3%
370,500 374,205 100.0%
Total MediCal Eligibles FY 1997 Growth Jun-1999
Child & Adolescent 17,360 1.0% 17,534
Adults 20,789 1.0% 20,997
Older Adults 5,251 1.0% 5,304
43,400 43,834
Kaiser MediCal Eligibles FY 1997 Growth Jun-1999
Child & Adolescent 3,600 0.0% 3,600
Adults 4,311 0.0% 4,311
Older Adults 1,089 0.0% 1,089
9,000 9,000
Non-MediCal Population FY 1997 Jun-1999
Child & Adolescent 80,384 81,188
Adults 225,058 227,309
Older Adults 21,658 21,875
327,100 330,371
30

6/11/2012
16
2. How many
people will
need service
next year?
Solano Flight SimulatorInput Screen: Population and Client Projections
Child & Adolescent Cases FY 1997 CY 1997 Growth Jun-1999 Mix
MediCal 1,264 740 0.0% 1,264 80.6%
Medicare & Insurance 5 2 5.0% 5 0.3%
Indigent 285 276 5.0% 299 19.1%
1,554 1,018 0.9% 1,569 100.0%
Adult Cases FY 1997 CY 1997 Growth Jun-1999 Mix
MediCal 2,817 2,100 -25.0% 2,113 58.8%
Medicare & Insurance 292 52 0.0% 292 8.1%
Indigent 763 1,189 56.0% 1,190 33.1%
3,872 3,341 -7.2% 3,595 100.0%
Older Adult Cases FY 1997 CY 1997 Growth Jun-1999 Mix
MediCal 167 147 10.0% 184 77.3%
Medicare & Insurance 16 8 10.0% 18 7.4%
Indigent 33 41 10.0% 36 15.3%
216 196 10.0% 238 100.0%
Cases - All Ages FY 1997 CY 1997 Jun-1999 Mix
MediCal 4,248 2,987 3,560 65.9%
Medicare & Insurance 313 62 315 5.8%
Indigent 1,081 1,506 1,526 28.3%
5,642 4,555 5,401 100.0%
MediCal Penetration FY 1997 CY 1997 Jun-1999
Child & Adolescent 7.3% 4.3% 7.2%
Adults 13.6% 10.1% 10.1%
Older Adults 3.2% 2.8% 3.5%
9.8% 6.9% 8.1%
Overall Penetration FY 1997 CY 1997 Jun-1999
Child & Adolescent 1.6% 1.0% 1.6%
Adults 1.6% 1.4% 1.4%
Older Adults 0.8% 0.7% 0.9%
1.5% 1.2% 1.4%
31
How Many People…
Snoh Skagit San Juan Island Whatcom Total
1. Total PopulationChildren (0-17) 171,939 27,621 2,742 18,322 42,234 262,858
Transition Age (18-20) 25,611 4,574 338 2,807 11,351 44,681
Adults (21-59) 371,198 56,703 8,256 39,651 99,253 575,061
Older Adults (60+) 87,053 22,002 4,163 15,220 28,962 157,400
Total 655,801 110,900 15,499 76,000 181,800 1,040,000
2. Target Population (0-17: < 250%, 18+: <200% of Poverty)Children (0-17) 51,059 13,630 1,214 8,165 17,884 91,952
Transition Age (18-20) 4,229 1,197 86 643 3,591 9,746
Adults (21-59) 61,291 14,835 2,110 9,078 31,396 118,710
Older Adults (60+) 17,943 3,658 330 2,327 5,044 29,302
Total 134,522 33,320 3,740 20,213 57,915 249,710
3. Prevalence/Need & GapChildren (0-17)
Estimated Need 4,408 1,177 105 705 1,544 7,939
Clients Served 2,645 644 55 235 900 4,479
Gap (1,763) (533) (50) (470) (644) (3,460)
Adults (18+)
Estimated Need 6,094 1,438 184 880 2,923 11,519
Clients Served 4,164 881 91 363 1,695 7,194
Gap (1,930) (557) (93) (517) (1,228) (4,325)
NSMHA Utilization/Financial Model
Gap Analysis for a 5-County Region in Northwest Washington State.
32

6/11/2012
17
3. What kind of service will they need?
Solano Flight SimulatorInput Screen:
Service Modality
Unit
Hrs
per Std
Hr
Individual/Family Tx/Rehab Hr 1.0
Group Tx (2:1) Hr 2.0
Group Tx (4:1) Hr 4.0
Group Tx/Rehab Hr 6.0
Dual Dx Support Groups Hr 6.0
Psych Eval & Consultation Hr 1.0
Medication Mgmt/Prescribing Hr 1.0
Intensive Home/Comm Based Svcs Hr 1.0
Part Hosp/Daily Support Hr 3.0
Day Treatment Hr 10.0
Day Treatment/Child Hr 6.0
Rehab Clubhouse Hr 12.0
Vocational Hr 1.0
School Based Consults Hr 1.0
Care Coordination Hr 1.0
Targeted Case Management Hr 1.0
Interdisciplinary Consults Hr 0.5
Solano Flight SimulatorInput Screen: Inpatient and Residential Demand
Jun-1999
Adult Child Older Adult Total
Acute InpatientAdmissions 250 53 11 314
Projected Days 2,525 594 94 3,212
IMDsAdmissions 84 - 13 97
Projected Days 10,164 - 1,573 11,737
Crisis ResidentialAdmissions 115 24 - 139
Projected Days 2,211 336 - 2,547
Adult ResidentialAdmissions - - - -
Projected Days - - - -
Child Intensive Res.Admissions - 18 - 18
Projected Days - 1,800 - 1,800
33
4. How much of each service will clients need?
Solano Flight SimulatorInput Screen: Tx Pkgs - Direct Time Only
Adult Mental Health Services
Service Modality
Unit
Hrs
per Std
Hr
Ad
ult
Lev
el 1
a
Ad
ult
Lev
el 1
b
Ad
ult
Lev
el 2
a
Ad
ult
Lev
el 2
b
Ad
ult
Lev
el 3
a
Ad
ult
Lev
el 3
b
Ex
cep
tio
n t
o
LO
C
Ad
ult
Lev
el 4
Individual/Family Tx/Rehab Hr 1.0 4.0 2.0 4.0 25.0 40.0 - - 6.0
Group Tx (4:1) Hr 4.0 - 28.0 8.0 80.0 - - -
Group Tx/Rehab Hr 6.0 - 24.0 50.0 - - -
Dual Dx Support Groups Hr 6.0 - 24.0 20.0 10.0 80.0 - - -
Psych Eval & Consultation Hr 1.0 0.2 1.0 1.0 1.0 2.0 - - 2.0
Medication Mgmt/Prescribing Hr 1.0 0.4 4.0 6.0 6.0 7.0 - - 12.0
Part Hosp/Daily Support Hr 3.0 - - - 30.0 60.0 - - -
Vocational Hr 1.0 - 2.0 2.0 4.0 6.0 - - -
Care Coordination Hr 1.0 1.0 1.0 2.0 6.0 - - 6.0
Targeted Case Management Hr 1.0 - 2.0 6.0 6.0 12.0 - - 12.0
Interdisciplinary Consults Hr 0.5 - - 6.0 6.0 8.0 - - 6.0
Total Hours (Non-Standardized) 4.6 36.0 74.0 122.0 351.0 0.0 0.0 44.0
Total Hours (Standardized) 4.6 16.0 42.3 73.7 150.7 0.0 0.0 50
Median Standard Service Hours of Range 10.0 25.0 115.5 115.5 290.5 290.5 0.0 50.0
Range of Standard Service Hours - Low End 0 0 51 51 181 181 401 45
Range of Standard Service Hours - High End 20 50 180 180 400 400 9999 250
34

6/11/2012
18
How Much Service…• More and more systems are using the LOCUS to develop Level
of Care Systems.
• It is a national tool developed by the American Association of Community Psychiatrists to guide assessment, level of care placement decisions, continued stay criteria, and quality monitoring.
• It also allows system planners to understand how many low, medium and high need clients are in the system.
LOCUS Score
indicates Level of
Care
Subscale used to
finalize Level of
Care
Services planned from
those listed for the Level
of Care, based on the
expected amount of care
Services delivered based on plan of
care
LOCUS used to reassess at
annual review, or
if there is a
question about
Level of Care
Services adjusted, based on Level of Care,
including step up or step
down, discharge and
aftercare plan
Aggregate data used to assess system wide issues, gaps, under or over service,
workload, program needs, etc.
35
Locus Analysis Example
• How many people at each level?
• How much service provided – expected versus actual?
36

6/11/2012
19
Locus Score Analysis
37
How Much Service…
Multnomah County: Adult System of Care Projections
Jan-Dec 2006 - Oregon Health Plan Enrollees
Screening &
Triage Only Basic Services
Recovery Mainten-
ance
Low Intensity
Community
Based
Services
Locus Level N/A Locus 0 Locus 1 Locus 2
Locus ScoreAvailable to
all Clients< 10 10 to 13 14 to 16
Clients & Case Mix
Case Mix 7.2% 19.9% 21.4% 8.8%
Clients Served 479 1,331 1,433 590
Average Length of Stay and Treatment Slots
ALOS 1 3 6 8
Slots 40 333 717 393
Units of ServiceAvg. Units/Case 1 4 10 15
Unit of Measure Std Hr Std Hr Std Hr Std Hr
Completion Rate 70% 70% 70% 70%
Paid Units/Case 0.70 2.80 7.00 10.50
Services 335 3,727 10,031 6,195
Category IV: General Outpatient Mental Health
Services
38

6/11/2012
20
How Much Service…Multnomah County: Adult System of Care Projections
Jan-Dec 2006 - Oregon Health Plan Enrollees
Category I:
ACT
Category II:
DBT
Assertive
Community
Treatment
Dialectical
Behavioral
Therapy
Screening &
Triage Only
Low Intensity
Community
Based
Services
High Intensity
Community
Based
Services
Medically
Monitored Non-
Residential
Services
Locus Level Locus 4 Locus 4 N/A Locus 2 Locus 3 Locus 4
Locus Score20+
generally 3 to
4 on all scale
20+
generally 3 to
4 on all scale
Available to
all Clients14 to 16 17 to 19 20+
Clients & Case Mix
Case Mix 3.0% 0.4% 4.3% 5.6% 16.6% 12.8%
Clients Served 200 26 286 373 1,113 855
Average Length of Stay and Treatment Slots (the number of persons who will be served at one time)
ALOS 12 12 1 8 11 12
Slots 200 26 24 249 1,020 855
Units of Service
Avg. Units/Case 100 72 1 15 32 72
Unit of Measure Std Hr Std Hr Std Hr Std Hr Std Hr Std Hr
Completion Rate 95% 95% 70% 70% 70% 70%
Paid Units/Case 95.00 68.40 0.70 10.50 22.00 50.40
Services 19,000 1,778 200 3,917 24,486 43,092
Category III: Services for Severely Mentally Ill
39
How Much Service…
This slide projects substance abuse service need for the mid-sized California County.
Solano County Substance Abuse Fiscal and Utilization Model
Service and Cost Projections
High Scenario 9.0% penetration
Complete Partial* Total
Average Number of 40% 60% Service
Svc. Units Users Units Svc Units Svc Units
Entry Services
Detox 5 934 1,868 1,401 3,269
Extended Stabilization 5 234 467 350 817
Pre Treatment 5 584 1,168 876 2,043
Subtotal 1,751 3,503 2,627 6,130
Ongoing Services
Intensive OP/day habilitation 14 304 1,700 1,275 2,975
OP Level1 27 883 9,533 7,150 16,683
OP Level 2 131 1,027 53,840 40,380 94,219
OP Level 3 340 - - - -
Subtotal 1,910 63,373 47,530 110,902
Residential 1 28 117 1,308 981 2,288
Residental 2 178 117 8,313 6,235 14,548
Residential 3 365 - - - -
Residential 1a 90 234 8,407 6,305 14,712
Subtotal 467 18,028 13,521 31,548
Total Ongoing Clients 2,377
Average Intensive OP/day habitation days/client 9.8
Average OP hours/client 58.1
Average Residential days/client 67.6
40

6/11/2012
21
5. What
staff will
we need
to
provide
the
service?
Solano Flight SimulatorInput Screen: Adult Clinician Staffing Projections
Staffing Mix by Modality
MD
RN
Ph
D
Lic
en
sed
No
n-
Lic
en
sed
Co
nsu
mer
MH
Co
un
s
OT
/RT
/FN
P
Oth
er
Oth
er
Oth
er
To
tal
Individual/Family Tx/Rehab - 10% - 70% 10% 10% - - - - 100%
Group Tx (2:1) - 10% - 75% 15% - - - - - 100%
Group Tx (4:1) - 10% - 75% 15% - - - - - 100%
Group Tx/Rehab - - - 50% 20% 30% - - - - 100%
Dual Dx Support Groups - - - 50% 15% 35% - - - - 100%
Psych Eval & Consultation 90% - - - - - 10% - - - 100%
Medication Mgmt/Prescribing 65.0% 20% - - - - 15% - - - 100%
Intensive Home/Comm Based Svcs - 40% - 20% 30% 10% - - - - 100%
Part Hosp/Daily Support 5% 30% - 35% 15% 15% - - - - 100%
Day Treatment - - - 30% 30% 40% - - - - 100%
Vocational - - - 30% 55% - 15% - - - 100%
School Based Consults - - - 90% 10% - - - - - 100%
Care Coordination 15% 15% - 50% 10% 10% - - - - 100%
Targeted Case Management - 10% - 30% 30% 30% - - - - 100%
Interdisciplinary Consults 15% 15% 5% 50% 10% 5% - - - - 100%
Clinician Productivity
Jun-1999 75% 75% 75% 75% 75% 75% 75% 75% 75% 75%
Work Hours per Year 1,800 1,800 1,800 1,800 1,800 1,800 1,800 1,800 1,800 1,800
Outpatient FTE Demand vs. Capacity Jun-1999
FTE Demand 7.41 6.34 0.30 26.07 8.35 6.89 1.72 - - - 57.07
Current County FTE Capacity 8.55 7.00 1.76 12.60 25.34 - 1.00 - - - 56.26
Shift in County FTEs (0.89) (0.44) (1.45) 0.68 (5.81) 7.13 0.78 - - 0.00
Change in County FTEs - - -
Contractor FTEs - - - 13.70 - - - - - - 13.70
Subtotal 7.66 6.56 0.31 26.98 19.53 7.13 1.78 - - - 69.96
Added "Overflow" Network FTEs - - - - - - - - - - -
Excess FTEs 0.26 0.22 0.01 0.91 11.18 0.24 0.06 - - - 12.89
41
Topic 2: Network Development ProcessStep 1: Design Process resulting in Demand Projections
Step 2: RFP soliciting Capacity for specific services
Step 3: Score RPF Responses and match Capacity with Demand (Note: If insufficient capacity, develop Plan to build capacity over time)
Step 4: Announce Agency Contracts and Caps by Service Area; if non-"winning" providers, identify as potential "overflow capacity"
Step 5: Develop Provider Manual with detailed rules; develop Utilization and Utilization Management Systems; develop client Transition Plan
Step 6: Agency Contracting including Performance Measures
Step 7: Extensive Provider Training
Step 8: Begin operating under new system
Step 9: Intensive Concurrent Review of Outpatient Level of Care assignments, checking inter-rate reliability, scoring each agency
Step 10: Provide re-training as needed to agencies not meeting standards
Steps 11: Re-evaluate inter-rate reliability
Step 12: Develop and monitor corrective action plans, as needed
Step 13: If continued problems, no new authorizations; if continued problems, cancel contract
42
6/11/2012
22
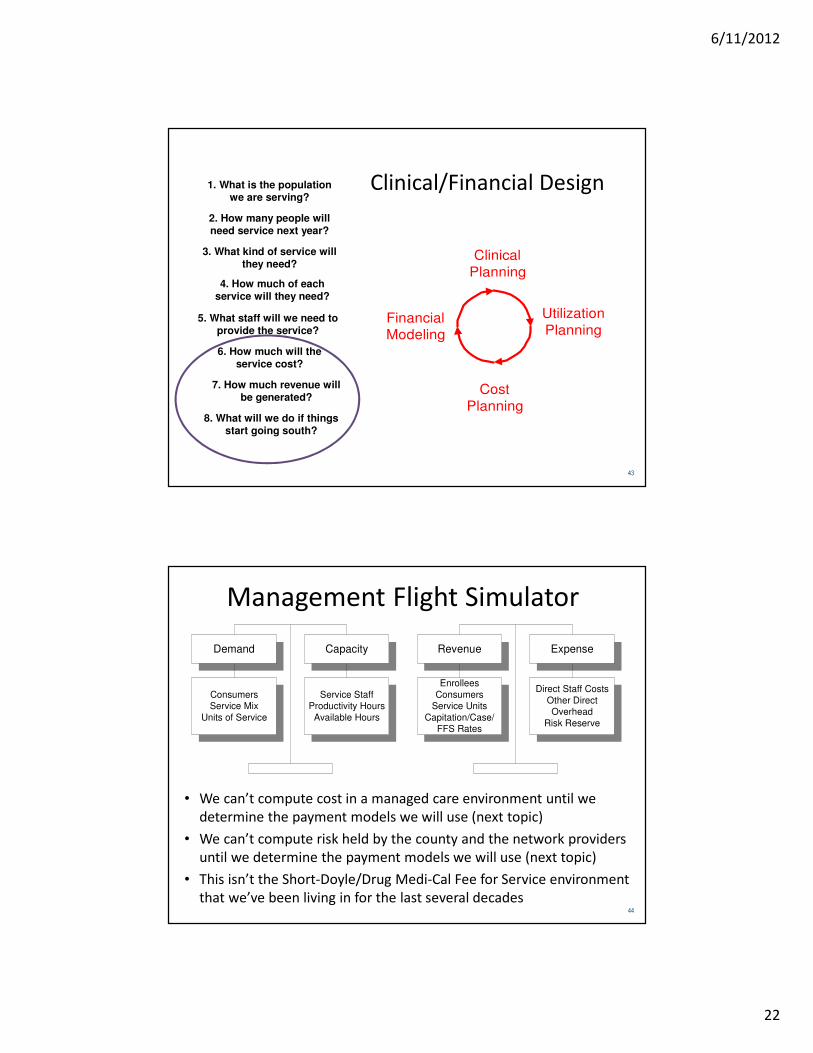
Clinical/Financial Design
Clinical
Planning
Utilization
Planning
Cost
Planning
Financial
Modeling
1. What is the populationwe are serving?
2. How many people willneed service next year?
3. What kind of service willthey need?
4. How much of eachservice will they need?
5. What staff will we need toprovide the service?
6. How much will theservice cost?
7. How much revenue willbe generated?
8. What will we do if thingsstart going south?
43
Management Flight Simulator
• We can’t compute cost in a managed care environment until we
determine the payment models we will use (next topic)
• We can’t compute risk held by the county and the network providers
until we determine the payment models we will use (next topic)
• This isn’t the Short-Doyle/Drug Medi-Cal Fee for Service environment
that we’ve been living in for the last several decades
ConsumersService Mix
Units of Service
Service StaffProductivity Hours
Available Hours
Direct Staff Costs
Other DirectOverhead
Risk Reserve
Enrollees
ConsumersService Units
Capitation/Case/FFS Rates
Demand Capacity Revenue Expense
44

6/11/2012
23
Update the Model Frequently
Model Update
Model Update afterall current
consumers have
been assessed
System in
Balance?
Initial Modeling
Demand/CapacityRevenue/Expense
based on budgets &
historical data
Yes
No
Quarterly Updates
Quarterly Updates tothe model as the
year unfolds
Next Year's Budget
Revise how moneyis programmed to
better follow
consumers
Proceed with
Caution
45
Topic 3: Understanding Risk & Payment Models
(for some, the next section is going to look like I’m on a foreign planet)
46

6/11/2012
24
47
Understanding Risk & Payment Models
• There are multiple levels of financial risk
• The other side of financial risk is reward
• The payment mechanism is the method by which risk is transferred from payer to provider
The Managed Care Risk Triangle
and Payment MechanismsManaged Care Risk/Reward Triangle
How do the risk types correlate
If I bear risk how can I lose money? to managed care funding types?
Costs per unit of service are higher 1.
than the payment rates. Cost
Risk
Individuals require more units of service Discounted
for the condition for which they are being 2. Utilization Fee for
treated than was originally estimated. Risk - Individual Service
The mix of consumers is weighted Case Rate
towards a higher severity level than 3. Utilization
was originally estimated. Risk - Case Mix
The number of individuals using
services is greater than was 4. Penetration
originally estimated. Risk
The population grows Capitation
without additional 5. Population (PMPM)*
capitation payments.** Risk **
48

6/11/2012
25
49
Payment Mechanisms
• Discounted Fee for Service: Payment for all authorized services from a defined fee schedule, minus a per visit co-payment
• Stratified Case Rate: Payment of a flat fee per patient for a predefined episode at a specific level of care, regardless of how much time and money is spent
• Blended Case Rate: Payment of a single flat fee per patient for a predefined episode regardless of how much time and money is spent
• Capitation: Payment of a fixed fee per enrollee (per member per month) to provide all medically necessary services to the covered population
Types of Risk (Example)
50

6/11/2012
26
Topic 4: Two-Part Risk Management PlanPart I: Risk Management System Design and Development
Step 1:Develop a clinical design and corresponding utilization management model that matches the enrollee population, provider network and staffing capacity.
Step 2:Project penetration, utilization, and cost by service area and modality group, updating the Utilization/Financial Model.
Step 3:Identify potential problems that could occur that would result in higher utilization/cost than projected. Develop a set of strategies to use, should these problems occur.
Step 4:Identify priority service enhancement projects, should excess funds accumulate.
Step 5:Develop a Data Tracking and Forecasting Model to monitor authorizations and claims, including an IBNR projection tool and authorization completion estimate algorithm.
51
Two-Part Risk Management PlanPart II: Risk Management System Operation
Step 6: Monitor revenue, clients, authorizations, claims, and other
expenses on a weekly and monthly basis.
Step 7: Update the Data Tracking and Forecasting Model with
information from above, projecting revenues and expenses through
year-end.
Step 8: If “reality” is unfolding as expected, continue monitoring. If
revenues or costs are trending in the wrong direction, go back to Steps
4 and/or 5.
Step 9: Potential for losses: Analyze the contributing factors, match with
the risk management strategies, and “kick in” the best strategy.
Step 10: Potential for excesses: Analyze the contributing factors and
determine if under-service is occurring in a way that requires corrective
action. If yes, work with the appropriate parties to complete a
corrective action plan. If no, consider pursuing service enhancement
projects.52
6/11/2012
27
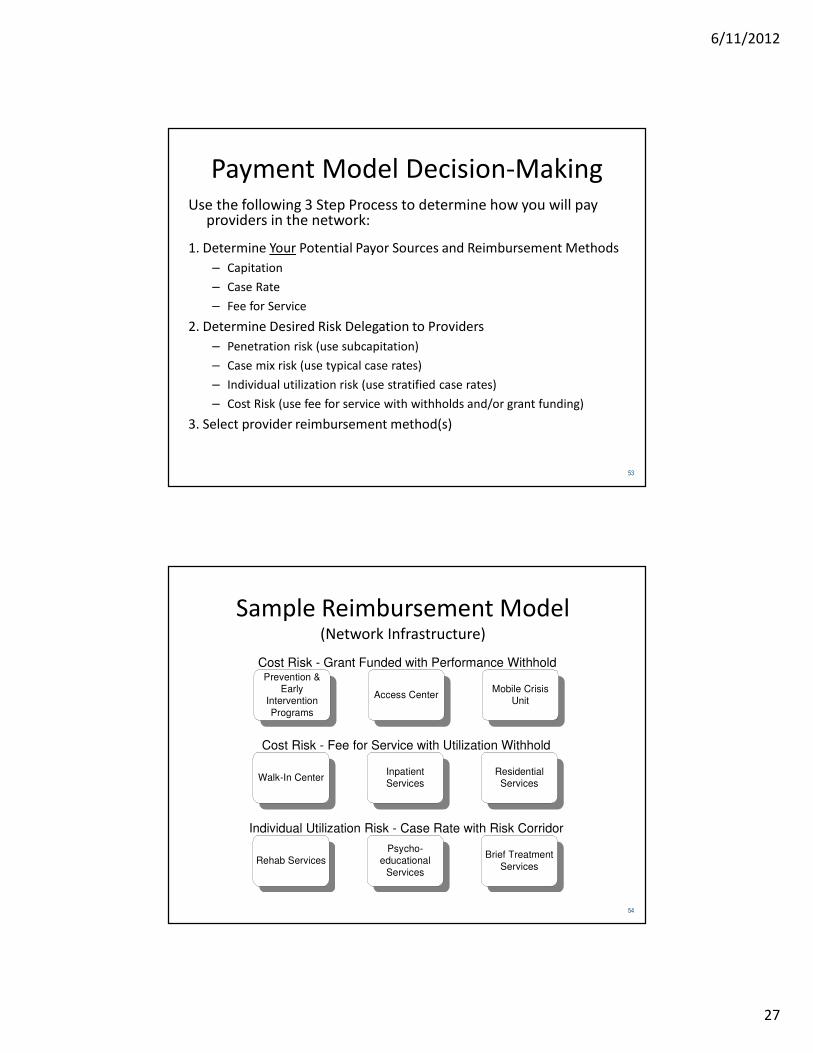
Payment Model Decision-MakingUse the following 3 Step Process to determine how you will pay
providers in the network:
1. Determine Your Potential Payor Sources and Reimbursement Methods
– Capitation
– Case Rate
– Fee for Service
2. Determine Desired Risk Delegation to Providers
– Penetration risk (use subcapitation)
– Case mix risk (use typical case rates)
– Individual utilization risk (use stratified case rates)
– Cost Risk (use fee for service with withholds and/or grant funding)
3. Select provider reimbursement method(s)
53
Sample Reimbursement Model(Network Infrastructure)
Walk-In Center
Access CenterMobile Crisis
Unit
InpatientServices
Prevention &Early
Intervention
Programs
Psycho-educational
Services
Brief Treatment
ServicesRehab Services
ResidentialServices
Cost Risk - Grant Funded with Performance Withhold
Individual Utilization Risk - Case Rate with Risk Corridor
Cost Risk - Fee for Service with Utilization Withhold
54

6/11/2012
28
Topic 5: How to set Case Rate or Capitation Rates
55
For More Information
56

6/11/2012
29
For More Information
57
Finishing with a Familiar Slide• Many California Counties are
going to have to up their
game to become full blown
Medicaid Behavioral Health
Plans (e.g. true managed
care organizations)
• With greater distinction
between the roles of:
– Medicaid Health Plan
– Service Provider
• An build a more robust
provider network and
managed care infrastructure
58