Embed Size (px)
Citation preview

FEDERAL EMERGENCY MANAGEMENT AGENCY FEMA 265/JULY 1995
MANAGING FLOODPLAIN DEVELOPMENT
IN
APPROXIMATE ZONE A AREAS
A GUIDE FOR OBTAINING AND DEVELOPINGBASE (100-YEAR) FLOOD ELEVATIONS
APRIL 1995

FOREWORD
This guide was developed for use by community officials, propertyowners, developers, surveyors, and engineers who may need todetermine Base (100-year) Flood Elevations (BFEs) in special floodhazard areas designated as approximate Zone A on the FederalEmergency Management Agency's Flood Insurance Rate Maps publishedas part of the National Flood Insurance Program. One of theprimary goals of this document is to provide a means of determiningBFEs at a minimal cost.
The guidance provided herein is primarily intended for use inriverine and lake areas where flow conditions are fairly uniform,and do not involve unusual flow regimes (rapidly varying flow, two-dimensional flow, supercritical flow, hydraulic jumps, etc.).
This guide is not to be used for areas that experience alluvial fanflooding or areas that contain characteristics of alluvial fanflooding. In addition, this guide is not to be used in Zone V(velocity) areas or coastal Zone A areas that are subject toflooding due to storm surge from hurricanes and other coastalstorms. Furthermore, guidance on determining regulatory floodwaysis not provided in this guide.
Notes on the .PDF version of the Zone A Manual
Appendices 8 and 9 (hand calculations) were not included in the.PDF (Internet) version of this Manual. The information was not ina text format. The scanned images of Appendices 8 & 9 would havemade the file size of this document much larger. To keep the filesize down they were omitted.
i

TABLE OF CONTENTS
Page
I. INTRODUCTION ..........................................I-1
II. NATIONAL FLOOD INSURANCE PROGRAM BACKGROUND ...........II-1
III. APPLICABLE NATIONAL FLOOD INSURANCE PROGRAM FLOODPLAINMANAGEMENT REQUIREMENTS IN APPROXIMATE ZONE A AREAS ..III-1
Requirements for Obtaining Base (100-year)Flood Elevation Data .............................III-1
Requirements for Developing Base (100-year)Flood Elevation Data .............................III-2
Use of Draft or Preliminary Flood InsuranceStudy Data .......................................III-7
Advantages of Developing Base (100-year)Flood Elevation Data .............................III-8
IV. OBTAINING EXISTING BASE (100-YEAR) FLOOD ELEVATIONS ...IV-1Federal Emergency Management Agency .................IV-1Other Federal Agencies ..............................IV-3Other State and Local Agencies .....................IV-4
V. DEVELOPING BASE (100-YEAR) FLOOD ELEVATIONS ............V-1
Simplified Methods ..................................V-1Contour Interpolation .............................V-2Data Extrapolation ................................V-7
Detailed Methods ...................................V-11Topography .......................................V-11
Existing Topographic Maps ...................V-11Datum Requirements for Field Surveys ........V-12Number of Cross Sections Required ...........V-13Proper Location of Cross Sections ...........V-13
Hydrology .........................................V-15Discharge-Drainage Area Relationships ........V-16Regression Equations .........................V-19TR-55 ........................................V-20Rational Formula .............................V-20Other Hydrograph Methods .....................V-21
Hydraulics .......................................V-22Normal Depth ................................V-23Critical Depth ...............................V-26Step-Backwater Analysis ......................V-28Hydraulic Structures ........................V-28
VI. OBTAINING LETTERS OF MAP CHANGE ........................VI-1
ii

TABLE OF CONTENTS (continued)
Page
FIGURES
Figure 1 - Flood Hazard Boundary Map .......................II-2Figure 2 - Flood Insurance Rate Map ........................II-3Figure 3 - Proposed 76-Lot Subdivision ....................III-2Figure 4 - Proposed 6.7-Acre Subdivision ..................III-3Figure 5 - Proposed 76-Lot Subdivision ....................III-4Figure 6 - Proposed 5.6-Acre Subdivision ..................III-4Figure 7 - Proposed 6.7-Acre Subdivision ..................III-5Figure 8 - Contour Interpolation Method -
Riverine Flooding Example 1 ......................V-4Figure 9 - Contour Interpolation Method -
Riverine Flooding Example 2 ......................V-5Figure 10 - Contour Interpolation Method -
Lacustrine Flooding Example 3 ....................V-6Figure 11 - Data Extrapolation Method - Profile ..............V-8Figure 12 - Data Extrapolation Method - Plan View ............V-8Figure 13 - Data Extrapolation Method - Profile ..............V-9Figure 14 - Data Extrapolation Method - Plan View ............V-9Figure 15 - Data Extrapolation Method - Profile .............V-10Figure 16 - Cross Section Orientation .......................V-14Figure 17 - Locate Cross Sections at Points of Flood
Discharge Changes ...............................V-14Figure 18 - Cross Section Locations at Structures ...........V-15Figure 19 - Wendy Run Drainage Basin ........................V-18Figure 20 - Discharge-Drainage Area Plot ....................V-18Figure 21 - 100-Year Discharge Estimates for Site A
and Site B ......................................V-19Figure 22 - Channel Bank Stations ...........................V-25Figure 23 - Weir Flow - Embankment Profile is Not
Horizontal ......................................V-30Figure 24 - Weir Flow Over Road .............................V-31
iii

TABLE OF CONTENTS (continued)
Page
APPENDICES
Appendix 1 - Glossary of Floodplain Analysis Terms .........A1-1
Appendix 2 - Flood Insurance Study Data Request Form .......A2-1
Appendix 3 - Federal Emergency Management Agency Officesand Other Federal and State Agencies ..........A3-1
Appendix 4 - State Hydrology Reports .......................A4-1
Appendix 5 - Manning's "n" Values ..........................A5-1
Appendix 6 - QUICK-2 Computer Program Manual ...............A6-1
Appendix 7 - Hydraulic Computer Manuals ....................A7-1
Appendix 8 - Normal Depth Hand Calculations ................A8-1
Appendix 9 - Weir Flow Hand Calculations ...................A9-1
Appendix 10 - Worksheet ....................................A10-1
iv

Guide for Approximate Zone A Areas Introduction
I. INTRODUCTION
This guide is primarily intended to assist local communityofficials in administering and enforcing the floodplainmanagement requirements of the National Flood InsuranceProgram (NFIP). This document provides guidance fordetermining Base (100-year) Flood Elevations (BFEs) in specialflood hazard areas that have been identified and designated asapproximate Zone A on a community's NFIP maps. Zone Aidentifies an approximately studied special flood hazard areafor which no BFEs have been provided. Although BFEs are notprovided, the community is still responsible for ensuring thatnew development within approximate Zone A areas is constructedusing methods that will minimize flood damages. This oftenrequires obtaining or calculating BFEs at a development site.
Developers, property owners, engineers, surveyors, and othersat the local level who may be required to develop BFEs for usein approximate Zone A areas should also find this guideuseful. Included in this guide are methodologies that can beused to develop BFEs, which can be used to determine theelevation or floodproofing requirements for buildings. Thedetailed methodologies described in this guide can also beused to develop the BFE information necessary to obtain aLetter of Map Amendment or a Letter of Map Revision Based onFill from the Federal Emergency Management Agency (FEMA) toremove a legally defined property or structure from a specialflood hazard area. In addition, Letter of Map Revisionrequestors may use the detailed methods in this document todevelop the BFE information that must be submitted to FEMA todemonstrate that an area will not be flooded during the 100-year flood.
I-1

Guide For Approximate Zone A Areas NFIP Background
II. NATIONAL FLOOD INSURANCE PROGRAM BACKGROUND
In 1968, the United States Congress passed the National FloodInsurance Act, which created the NFIP. Congress recognizedthat the success of this program required that communityparticipation be widespread, that studies be conducted toaccurately assess the flood risk within each participatingflood-prone community, and that insurance premium rates beestablished based on the risks involved and accepted actuarialprinciples. To meet these objectives, the 1968 Act calledfor: 1) the identification and publication of informationwithin five years for all floodplain areas that have specialflood hazards; and 2) the establishment of flood-risk zones inall such areas to be completed over a 15-year period followingthe passage of the act.
Within the first year of NFIP operation, it became evidentthat the time required to complete the detailed floodinsurance studies would markedly delay implementation in manyflood-prone communities. As a result, an interim means formore rapid community participation in the NFIP had to beprovided. The Housing and Urban Development Act of 1969expanded participation by authorizing an Emergency Programunder which insurance coverage could be provided at non-actuarial, federally-subsidized rates in limited amountsduring the period prior to completion of a community's floodinsurance study.
Until engineering studies could be conducted for thesecommunities, Flood Hazard Boundary Maps, such as the one shownin Figure 1, "Flood Hazard Boundary Map," which delineated theboundaries of the community's special flood hazard areas, wereprepared using available data or approximate methods. TheFlood Hazard Boundary Maps identified, on an approximatebasis, the areas within a community subject to inundation bythe 100-year flood (i.e., Zone A). The 100-year flood has aone-percent chance of being equalled or exceeded in any givenyear. The Flood Hazard Boundary Map was intended to assistcommunities in managing floodplain development, and insuranceagents and property owners in identifying those areas wherethe purchase of flood insurance was advisable.
The Flood Disaster Protection Act of 1973, which also amendedthe 1968 Act, required that flood-prone communities benotified of their flood hazards to encourage programparticipation. This notification was accomplished through thepublication of Flood Hazard Boundary Maps for all communitiesthat were identified as containing flood hazard areas. Inaddition, the 1973 Act required the purchase of floodinsurance by property owners who were being assisted by
II-1

Guide For Approximate Zone A Areas NFIP Background
Figure 1 - Flood Hazard Boundary Map
Federal programs, or by Federally supervised, regulated, orinsured agencies or institutions, in the acquisition orimprovement of land or facilities located, or to be located,in special flood hazard areas. This act also severely limitedFederal financial assistance in the flood hazard areas ofcommunities which did not join the NFIP.
The initial Flood Hazard Boundary Maps for communitiesidentified as having flood hazards were prepared usingavailable floodplain data contained in reports developed by avariety of Federal, State, and local sources. For thosecommunities that had no available flood information,approximate hydrologic and hydraulic methods or historicalflood data were used to determine the extent of the specialflood hazard areas.
Flood Insurance Studies that used detailed hydrologic andhydraulic analyses to develop BFEs and designate floodways andrisk zones were subsequently developed for most NFIPcommunities. The results of a Flood Insurance Study were
II-2

Guide For Approximate Zone A Areas NFIP Background
issued to the community in the form of a Flood Insurance RateMap (FIRM), such as the one shown in Figure 2, "FloodInsurance Rate Map," and, in most cases, a Flood Boundary andFloodway Map and a Flood Insurance Study report. Once moredetailed risk data were provided, the community could enterthe Regular Program whereby more comprehensive floodplainmanagement requirements were imposed and higher amounts ofinsurance could be purchased by owners of structures.
Figure 2 - Flood Insurance Rate Map
As early as 1976, FEMA recognized that some communities didnot require a detailed Flood Insurance Study because therewere few existing buildings in the floodplain and minimaldevelopment pressure. Shortly thereafter, FEMA beganutilizing a special conversion process whereby communities
II-3

Guide For Approximate Zone A Areas NFIP Background
were converted to the Regular Program without a FloodInsurance Study. Consequently, these communities wereconverted using FIRMs in which all of the special flood hazardareas were designated as approximate Zone A, without BFEs.
Although over 10,000 communities have now been provideddetailed Flood Insurance Studies and issued FIRMs that includeBFEs, many floodplains are still designated as approximateZone A without BFEs. Due to the costs of developing detailedrisk data, areas not subject to development pressure arestudied using approximate methodologies and continue to beshown on the FIRM as approximate Zone A areas. FEMA onlyprovides BFEs for the floodplains of those flooding sourcesthat are currently subject to development pressure or areprojected at the initiation of a Flood Insurance Study orFlood Insurance Study restudy to be subject to developmentpressure during the immediate future. Generally, a planningperiod of approximately five years is used. Even in thesecases, BFEs are provided on a priority basis due to fundingconstraints. The community plays a major part in thedetermination of the level of detail required in the study ofselected streams. As a result, most communities will haveFIRMs that include special flood hazard areas for floodingsources that have been studied in detail with BFEs and specialflood hazard areas for flooding sources that have been studiedusing approximate methods, and have been designated asapproximate Zone A.
II-4

Guide For Approximate Zone A Areas Floodplain Management
III.APPLICABLE NATIONAL FLOOD INSURANCE PROGRAMFLOODPLAIN MANAGEMENT REQUIREMENTS IN APPROXIMATEZONE A AREAS
The primary requirement for community participation in theNFIP is the adoption and enforcement of floodplain managementregulations that meet the minimum standards of the NFIPregulations in Title 44 of the Code of Federal Regulations(CFR) Section 60.3. These minimum standards vary depending onthe type of flood risk data provided to the community by FEMA.The intent of floodplain management regulations is to minimizethe potential for flood damages to new construction and toavoid aggravating existing flood hazard conditions that couldincrease potential flood damages to existing structures. Toprotect structures in riverine and lacustrine areas, the NFIPregulations require that the lowest floor (including basement)of all new construction and substantial improvements ofresidential structures be elevated to or above the BFE. Newor substantially improved non-residential structures inriverine areas must either be elevated or floodproofed (madewatertight) to or above the BFE.
Requirements for Obtaining BFE Data
In areas designated as approximate Zone A, where BFEs have notbeen provided by FEMA, communities must apply the provisionsof Paragraph 60.3(b) of the NFIP regulations. Subparagraph60.3(b)(4) requires that communities:
Obtain, review and reasonably utilize anybase flood elevation and floodway dataavailable from a Federal, State, or othersource... [ 44 CFR 60.3 (b)(4) ]
Section IV describes the sources from which BFE data may beobtained. These data are to be used as criteria for requiringthat new construction, substantial improvements, and otherdevelopment within all approximate Zone A areas meet theapplicable requirements in Paragraphs 60.3(c) and (d) of theNFIP regulations, including the requirement that structureshave their lowest floors elevated to or above the BFE (orfloodproofed to or above the BFE for non-residentialstructures). These data should be used as long as theyreasonably reflect flooding conditions expected during thebase (100-year) flood, are not known to be scientifically ortechnically incorrect, and represent the best data available.Communities should consider formally adopting these data byreference as part of their floodplain management regulations.
III-1

Guide For Approximate Zone A Areas Floodplain Management
Requirements for Developing BFE Data
Under Subparagraph 60.3(b)(3) of the NFIP regulations,communities must also:
Require that all new subdivision proposals and other proposed development (including proposals for manufactured home parks and subdivisions) greater than 50 lots or 5 acres, whichever is the lesser, include within such proposals base flood elevation data; [ 44 CFR 60.3 (b)(3) ]
This means that any subdivision which meets this threshold mustbe evaluated to determine if the subdivision proposal isaffected by an approximate Zone A area and whether BFE data arerequired. BFE data are required for the affected lots in thesubdivisions shown in Figure 3, "Proposed 76-Lot Subdivision,"and Figure 4, "Proposed 6.7-Acre Subdivision." Figure 3 clearlyshows a 76-lot subdivision with several lots affected by anapproximate Zone A area. The subdivision depicted in Figure 4is only 12 lots, but because the subdivision is greater than 5acres and clearly shows buildable sites affected by anapproximate Zone A area, BFE data are required.
Figure 3 - Proposed 76-Lot Subdivision
III-2

Guide For Approximate Zone A Areas Floodplain Management
Figure 4 - Proposed 6.7-Acre Subdivision
Communities are encouraged to address the flood hazards at theearliest stages of subdivision planning rather than at theactual placement of individual structures. If a community canwork with the developer and others when land is beingsubdivided, many long-term floodplain management benefits can beachieved, particularly if the floodplain is avoided altogether.
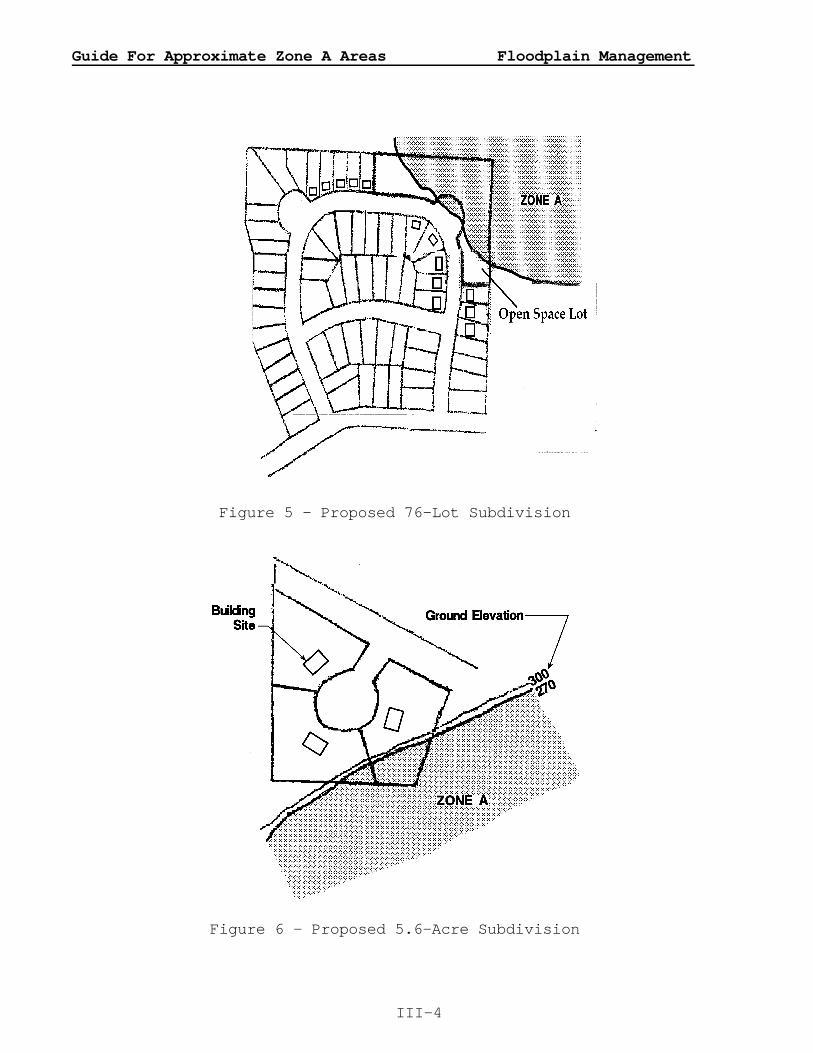
In Figure 5, "Proposed 76-Lot Subdivision," the entireapproximate Zone A area is to be dedicated as open space. Ifthe planned subdivision shows the floodplain is containedentirely within an open space lot, it may not be necessary toconduct a detailed engineering analysis to develop BFE data.
Also, it may not be necessary to develop detailed BFE data inlarge-lot subdivisions or single-lot subdivisions that arewithin the thresholds under Subparagraph 60.3(b)(3) of the NFIPregulations when the actual building sites are clearly outsideof the Zone A area. In Figure 6, "Proposed 5.6-AcreSubdivision," it is evident from the topographic features ofthis 5.6-acre subdivision that the building sites would beclearly out of the floodplain since the proposal indicates asteep grade between the approximate Zone A area and the buildingsites which are located on natural high ground.
III-3
Guide For Approximate Zone A Areas Floodplain Management
Figure 5 - Proposed 76-Lot Subdivision
Figure 6 - Proposed 5.6-Acre Subdivision
III-4

Guide For Approximate Zone A Areas Floodplain Management
If the grade between the actual building sites and theapproximate Zone A area of the proposed subdivision isrelatively gradual, asshown in Figure 7, "Proposed 6.7-AcreSubdivision," the floodplain could extend beyond what is shownon the Flood Insurance Rate Map. It is very likely that floodingcould affect the building sites.In this case, an analysis shouldbe conducted to determine the location of the 100-yearfloodplain and the BFE.
Figure 7 - Proposed 6.7 Acre Subdivision
For developments that exceed the thresholds identified in NFIPregulations Subparagraph 60.3(b)(3), BFEs must be either obtained from other sources or developed using detailedmethodologies comparable to those contained in a Flood InsuranceStudy. Section V describes some of the detailed methodologiesavailable that can be used to develop BFE data when none areavailable from the sources listed in Section IV.
If the size of the new subdivision or other proposed developmentfalls below the thresholds specified in NFIP regulationsSubparagraph 60.3(b)(3) and no BFE data are available from thesources listed in Section IV, the community must still apply, ata minimum, the requirements of Subparagraph 60.3(a)(3) toproposed structures or Subparagraph 60.3(a)(4) to subdivisionsand other developments within approximate Zone A areas. Theseparagraphs require that permit officials:
III-5

Guide For Approximate Zone A Areas Floodplain Management
Review all permit applications to determine whetherproposed building sites will be reasonably safe fromflooding. If a proposed building site is in a flood-prone area, all new construction and substantialimprovements shall (i) be designed (or modified) andadequately anchored to prevent floatation, collapse, orlateral movement..., (ii) be constructed with materialsresistant to flood damage, (iii) be constructed bymethods and practices that minimize flood damages, and(iv) be constructed with electrical, heating,ventilation, plumbing, and other service facilities thatare designed and/or located so as to prevent water from
entering or accumulating within the components duringconditions of flooding. [44 CFR 60.3(a)(3)]
Review subdivision proposals ... including manufacturedhome parks or subdivisions ... to assure that (i) allsuch proposals are consistent with the need to minimize
flood damage within the flood-prone area, (ii) allpublic utilities and facilities ... are located and constructed to minimize or eliminate flood damage, and
(iii) adequate drainage is provided to reduce exposureto flood hazards; [44 CFR 60.3(a)(4)]
One way that communities can ensure that building sites will bereasonably safe from flooding for proposed developments thatfall below the thresholds in Subparagraph 60.3(b)(3) is to usethe simplified methods outlined in Section V for estimating aBFE. Another approach to ensure that a building site isreasonably safe from flooding is to require the structure to beelevated above the highest adjacent grade by a specified numberof feet based on the local official's knowledge of floodconditions in the area. In the absense of available BFE datafrom other sources, the community may require the permitapplicant to elevate the structure two or more feet above thehighest adjacant grade which qualifies the structure for reducedflood insurance rates. Elevation of the structure to four feetabove the highest adjacant grade will enable the structure toqualify for substantially reduced flood insurance rates.
However, some states and communities require that BFE data bedeveloped for all subdivisions and/or floodplain developmentwithin approximate Zone A areas, not just those subdivisions
III-6

Guide For Approximate Zone A Areas Floodplain Management
which meet the 50-lot or 5-acre threshold. A community may, atits discretion, require the use of detailed methods for suchdevelopment. While this requirement is more restrictive thanNFIP minimum requirements, the NFIP regulations specificallyrecognize and encourage states and communities to adopt andenforce more restrictive floodplain management regulations inthose instances where the state or community believes that it isin the best interest of its citizens.
No matter what the size of the subdivision or other developmentproposal, requests to revise or amend effective Flood InsuranceStudy information through the procedures outlined in Part 65 andPart 70 of the NFIP regulations must be based on detailedmethodologies presented in Section V or other methodologiescomparable to those found in a Flood Insurance Study. Theanalysis used to develop the BFEs must be certified by aregistered professional engineer or licensed land surveyor, asappropriate, if the BFEs are to be used to revise or amend anNFIP map.
Use of Draft or Preliminary Flood Insurance Study Data
The data from a draft or preliminary flood insurance studyconstitutes "available data" under Subparagraph 60.3(b)(4). Communities must reasonably utilize the draft or preliminaryflood insurance study data under the section of their ordinancethat requires the use of other base flood data when detailed BFEdata has not been published in a flood insurance study. Communities are given discretion in using draft or preliminaryflood insurance study data only to the extent that the technicalor scientific validity of the proposed flood elevation data isquestioned. If a community decides not to use the draft orpreliminary flood insurance data in a FIS because it isquestioning the data through a valid appeal, the community muststill assure that buildings are constructed using methods andpractices that minimize flood damages in accordance with therequirements under Subparagraphs 60.3(a)(3) and (4).
When all appeals have been resolved and a notice of final floodelevations has been provided by FEMA, communities are requiredto use the data from the flood insurance study for regulatingfloodplain development in accordance with Subparagraph60.3(b)(4) since the data represents the best data available. Communities must regulate floodplain development using the floodinsurance study data under Subparagraph 60.3(b)(4) until suchtime as the community has adopted the effective FIRM and floodinsurance study.
III-7

Guide For Approximate Zone A Areas Floodplain Management
Advantages of Developing BFE Data
While the NFIP regulations do not require that communitiesdevelop BFE data in approximate Zone A areas when proposeddevelopment is below the thresholds in NFIP regulationsSubparagraph 60.3(b)(3), there are significant advantages andfinancial benefits for communities and individual propertyowners that develop BFE data. These advantages and benefitsinclude:
• protecting structures up to the BFE will minimize andreduce future flood losses, resulting in long-termsavings to the individual, the community, and theNational Flood Insurance Fund;
• flood insurance policies in approximate Zone A areasthat are rated using a BFE will often qualify forsignificantly lower insurance rates than policies thatare rated without a BFE. The difference in floodinsurance premiums could be substantial;
• less burden will be placed on the permit officialbecause he or she can require protection to a specifiedelevation. Without a BFE, the permit official must makejudgements as to what constitutes "reasonably safe fromflooding" and "constructed with materials and practicesthat minimize flood damages";
• the NFIP's Community Rating System establishes floodinsurance premium discounts of up to 45 percent forpolicy holders within communities that have afloodplain management program that exceeds NFIP minimumrequirements. Sizable Community Rating System creditsare available for Community Rating System communitiesthat develop BFEs for areas designated as approximateZone A on their Flood Hazard Boundary Map or FIRM, orthat require site-specific engineering analyses fordevelopment proposals; and
• by specifying a BFE in an approximate Zone A area, abuilding or property can, in some circumstances, beremoved from the floodplain by issuance of a Letter ofMap Amendment or Letter of Map Revision in accordancewith Part 65 and Part 70 of the NFIP regulations. Whilethese procedures eliminate the requirement that floodinsurance be purchased as a condition of obtaining aloan from a Federally insured or regulated lender, alending institution may, at its discretion, require thepurchase of flood insurance.
III-8

Guide For Approximate Zone A Areas Obtaining BFEs
IV. OBTAINING EXISTING BASE (100-YEAR) FLOOD ELEVATIONS
The NFIP Regulations at 44 CFR 60.3 require that structures beelevated or floodproofed (non-residential structures only) toprovide protection from flood damage. A BFE must be establishedbefore such flood protection measures can be used. There are avariety of computational methods that can be employed todetermine BFEs. However, these methods can be costly. Beforecomputational methods are used, every attempt should be made toobtain information, in the form of floodplain studies orcomputations, from Federal, State, or local agencies. Dataobtained from these agencies may be adequate to determine BFEswith little or no additional research, computation, or cost.
Local officials who obtain BFE data should maintain theinformation for future reference. Local officials should alsoconsider making a search for BFE data for the entire community.By doing so, the local officials may not have to conduct asearch each time a floodplain development permit is requested. If the data reasonably reflect flooding conditions, a communityshould consider adopting the information into its floodplainmanagement ordinance.
Provided below are a list of agencies that can be contacted todetermine if any BFE data have already been developed. Whenobtained, these data should be evaluated to ensure that theyreasonably reflect flooding conditions expected at the siteduring the 100-year flood, are scientifically or technicallycorrect, and represent the best data available.
Three major sources of existing data are highlighted in thissection: FEMA, other Federal agencies, and State and localagencies.
FEMA
FEMA's technical evaluation contractors maintain libraries thatcontain technical and administrative data developed during thepreparation of Flood Insurance Studies, as well as the resultingFlood Insurance Study reports and NFIP maps. FEMA can becontacted to determine whether or not sufficient informationexists in the back-up data to calculate BFEs. For some floodingsources that are designated as approximate Zone A, FEMA may havedetailed flooding information that has not yet been incorporatedinto the community's Flood Insurance Study. FEMA can becontacted to obtain this information where it exists.
IV-1

Guide For Approximate Zone A Areas Obtaining BFEs
FEMA regularly conducts restudies of flood hazards in an effortto keep Flood Insurance Studies accurate and up-to-date. Aspart of these restudies, detailed BFE data for approximate ZoneA areas may be developed. During the time that elapses betweenFEMA obtaining restudy data and the incorporation of BFE dataareas into a revised Flood Insurance Study, a community mayreasonably use the BFE data from the restudy in approximate ZoneA areas in accordance with Subparagraph 60.3(b)(4).
In addition, flooding sources restudied by FEMA may often impactseveral communities. FEMA may be unable to immediately updatethe Flood Insurance Study for every community impacted due tofunding constraints. Therefore, BFEs may have been developedfor streams within a community that have not yet beenincorporated into the Flood Insurance Study.
It is also possible that a previous request to revise floodhazards along a stream or lake may be on file with FEMA, andthat BFEs, which may be applicable to other areas of the samestream or lake, may have been computed for that request.
FEMA data should be sought when trying to obtain or determineBFEs for an approximate Zone A area, so that if BFEs havealready been determined for an approximate Zone A area, thenother BFE determinations in the same area can be based on thesame methodology. However, if it is determined that a morescientifically or technically accurate determination than thatwhich is available in FEMA's back-up data is warranted, then amore detailed methodology, such as those described in Section V,should be utilized.
Data requests should be directed to the appropriate FEMAtechnical evaluation contractor at the address listed on thefollowing page:
IV-2

Guide For Approximate Zone A Areas Obtaining BFEs
FEMA Regions I-V(States East of the Mississippi
River and Minnesota)
Flood Insurance Information Specialistc/o Dewberry & Davis2953 Prosperity AvenueFairfax, Virginia 22031FAX: (703) 876-0073
Phone: (703) 876-0148
FEMA Regions VI-X(States West of theMississippi River)
FEMA Project Libraryc/o Michael Baker, Jr., Inc.
3601 Eisenhower AvenueSuite 600
Alexandria, Virginia 22304FAX: (703) 960-9125
Phone: (703) 960-8800
An instruction sheet entitled Flood Insurance Study (FIS) DataRequests is provided in Appendix 2. This sheet containspertinent information and instructions for requesting FloodInsurance Study data.
A fee is charged for locating, retrieving, copying, and mailingFlood Insurance Study back-up data based on the cost ofmaterials and a standard hourly rate for time spent to fill therequest. FEMA will inform the requestor if the requested dataare available and of the required fee. The requestor shouldallow two to four weeks for the request to be processed.
Other Federal Agencies
Information regarding BFEs may be obtained from other Federalagencies involved in floodplain management. A fee may berequired to obtain some of the products or services availablethrough these agencies. The following is a list of some of theFederal Agencies involved in floodplain management and theinformation, which may be useful in obtaining and determiningBFEs, that they produce.
IV-3

Guide For Approximate Zone A Areas Obtaining BFEs
AGENCY
U.S. Army Corps of Engineers
U.S. Department of the Interior, Geological Survey
U.S. Department of Agriculture, NaturalResources Conservation Service (NRCS)
U.S. Department of Transportation, Federal Highway Administration
U.S. Department of Commerce National Technical Information, Service
Tennessee Valley Authority
PRODUCT
Floodplain InformationReports
Technical ManualsComputer ProgramsComputational Assistance
Topographic MapsWater Resource
InvestigationsTechnical BulletinsWater Supply PapersComputer Programs
Watershed StudiesTechnical ReleasesComputer Programs
Floodplain StudiesDesign Manuals Computer Programs
Design ManualsComputer Programs
Floodplain Studies
Other State and Local Agencies
If back-up data from Federal agencies are unavailable or are notuseful, information regarding BFEs may be obtained from State orlocal agencies involved in floodplain management. On thefollowing page is a list of State and local agencies involved infloodplain management that may be contacted to obtain BFEinformation. Again, fees may be applicable for thisinformation.
For example, some state agencies, such as a Department ofNatural Resources or a Geological Survey, may conduct floodplainstudies using state funds. In some states, these agencies maymaintain a repository for flood data. The NFIP statecoordinating agency can also be contacted. A list of the Statecoordinating agencies is provided in Appendix 3. Other stateagencies, such as a Department of Transportation, do engineeringfor specific types of projects, such as road and bridgeconstruction, in which BFE data may have been developed forthese projects. In general, when calling these agencies, the
IV-4

Guide For Approximate Zone A Areas Obtaining BFEs
caller should ask for a copy of any back-up data (reports,computations, computer models, maps) associated with aFLOODPLAIN STUDY or DRAINAGE STUDY, for the area of theparticular stream of interest. In addition, some stateagencies, such as a Department of Natural Resources, maymaintain historic lake level data.
The local public works department or the local transportationdepartment may have developed flood data in designing sewer andstorm drainage systems and local roads. For example, plans fora sanitary sewer line which runs parallel to the stream and areaof interest may have 100-year flood elevations on the profile ofthe sanitary sewer. Also, if there are culverts or bridgeswhich cross the same stream within 1,000 feet of the area ofinterest, there may be hydrologic and hydraulic informationpertaining to the 100-year flood discharge and elevation whichmay be pertinent to the site. Finally, if there are any nearbyresidential or commercial developments along the same stream,the development (site) plans for these projects may also includeinformation about the 100-year flood.
Other possible sources of data include regional organizations,such as Flood Control Districts, Levee Improvement Districts,Watershed Districts, or Soil and Water Conservation Districts. These organizations may have developed flood profiles forsmaller streams or for reaches of streams impacted by floodcontrol or drainage projects.
State Agencies:Departments of Environmental ConservationDepartments of Environmental ProtectionDepartments of Floodplain ManagementDepartments of Natural ResourcesDepartments of TransportationDepartments of Water ResourcesGeological Survey
Local or Regional Agencies:Flood Control DistrictsLevee Improvement DistrictsLocal Planning CommissionsLocal Public Works DepartmentsMunicipal Utility DistrictsRiver Basin CommissionsWater Control Boards
A partial list of Federal and State agencies is provided inAppendix 3.
IV-5

Guide For Approximate Zone A Areas Developing BFEs
V. DEVELOPING BASE (100-YEAR) FLOOD ELEVATIONS
If sufficient BFE information cannot be obtained from thesources described in Section IV, then the community shouldconsider conducting, or requiring the applicant to conduct, asite specific engineering analysis to determine a BFE. Thissection describes several simplified and detailed methods forestimating or developing BFE data, and provides guidance forusing them.
As noted in Section III, a detailed method is required underSubparagraph 60.3(b)(3) of the NFIP regulations for proposeddevelopment greater than 50 lots or 5 acres, whichever is thelesser. If the BFEs developed will be used to revise or amendNFIP maps, they must be developed using the detailedmethodologies described in this section or other methodscomparable to those in a Flood Insurance Study.
If no BFE data are available and the proposed development isbelow the thresholds specified in Subparagraph 60.3(b)(3) of theNFIP regulations, the simplified methods for estimating BFEsdescribed in the following section may be used. Simplifiedmethods are less expensive and less time consuming than thedetailed methods described later in this section. However,communities have the discretion to determine which method shouldbe used when a proposed development is below the aforementionedthresholds.
Simplified Methods
There are situations in which a simplified approach forestimating the BFE may yield an acceptable level of accuracy.For simplified methods to be used, very specific conditions mustbe met as discussed below.
Simplified methods are appropriate for floodplain managementpurposes only. These methods may be used for the purpose ofmeeting the requirements of NFIP regulations Subparagraphs60.3(a)(3) and 60.3(a)(4) for developments, such as isolatedsmall subdivisions in rural areas which are below the thresholdin Subparagraph 60.3(b)(3), or single lots. Subparagraphs60.3(a)(3) and 60.3(a)(4) require the community to determinewhether proposed building sites are reasonably safe fromflooding and ensuring that subdivision proposals are consistentwith the need to minimize flood damage within flood-prone areas.
V-1

Guide For Approximate Zone A Areas Developing BFEs
Simplified methods may not be used by the community to completean Elevation Certificate used for flood insurance rating.Communities must use the detailed methodologies described inthis section or other methods comparable to those in a FloodInsurance Study for completing the Elevation Certificate. Aflood insurance policy for a structure for which a simplifiedmethod is used may be rated without an elevation certificate.However, the flood insurance rate may be higher than if thestructure is rated using an Elevation Certificate.
Contour Interpolation
Contour interpolation involves superimposing approximate Zone Aboundaries onto a topographic map in order to estimate a BFE.BFEs obtained by this method can only be assumed to be asaccurate as one-half of the contour interval of the topographicmap that is used. Therefore, the smaller the contour intervalof the topographic map, the higher the accuracy of the BFEdetermined from the map. The procedures for using this methodare outlined below. Steps 1 through 5 are the same for bothriverine and lacustrine (lake) flooding sources.
Step 1 - Obtain a topographic map showing the site beinganalyzed
Step 2 - Reduce or enlarge the FIRM or topographic map asnecessary so that the two are at the same scale
Step 3 - Superimpose the approximate Zone A (100-year)floodplain boundary from the FIRM onto the topographicmap
Step 4 - Determine if this method is within the acceptableaccuracy limits. The floodplain boundary mustgenerally conform with the contour lines along theflooding source in question. The difference betweenthe water-surface elevations determined on the rightoverbank and the left overbank must be within one-halfof the map contour interval. For lacustrine floodingsources, the difference between the highest and lowestdetermined water-surface elevations around theflooding source must be within one-half of the mapcontour interval. Otherwise, this method is notacceptable.
Step 5 - If the method is acceptable, then determine the BFE.Detailed guidance for determining the BFE is providedbelow.
V-2

Guide For Approximate Zone A Areas Developing BFEs
Determining BFEs for Riverine flooding:
On each side of the stream in the vicinity of the site,determine the ground elevation at which the superimposed Zone Aboundary lies by interpolating between two contour lines. Addone-half of the map contour interval to the lower of the twointerpolated elevations. This is the approximate BFE for thesite (be sure to perform this method at each structurelocation).
By adding one-half of the contour interval to the lowestinterpolated water-surface elevation, two things are achieved:1) the final BFE is within one-half of the contour interval ofboth interpolated water-surface elevations and, therefore, isstill within the acceptable tolerance of the topographic map(generally regarded as ± one-half of the map contour interval);2) it is a conservative estimate of the BFE. If the BFEdetermined under this procedure seems too high, then a detailedanalysis may be performed to justify lowering it.
Example 1
Using a county topographic map with a contour interval of 5feet, the approximate Zone A boundary crosses contourelevations on the left and right bank at 323 and 325 feet,respectively, as shown in Figure 8, "Contour InterpolationMethod - Riverine Flooding Example 1." The differencebetween these two water-surface elevations is 2 feet, whichis less than one-half of the contour interval or 2.5 feet.Therefore, this method is acceptable for use on thisportion of the stream. Add 323 feet (lowest interpolatedwater-surface elevation) plus 2.5 feet (one-half of thecontour interval), which yields a BFE of 325.5.
V-3

Guide For Approximate Zone A Areas Developing BFEs
Figure 8 - Contour Interpolation Method -Riverine Flooding Example 1
Example 2
Using a U.S. Geological Survey quadrangle map with acontour interval of 10 feet, the approximate Zone Aboundary crosses contour elevations on the left and rightbank of 422 and 430 feet, respectively, as shown in Figure9, "Contour Interpolation Method - Riverine FloodingExample 2." The difference between these two water-surfaceelevations is 8 feet, which is greater than one-half of thecontour interval or 5 feet. Therefore, this method is notacceptable for use on this portion of the stream, andanother method must be used to determine the BFE.
V-4

Guide For Approximate Zone A Areas Developing BFEs
Figure 9 - Contour Interpolation Method -Riverine Flooding Example 2
Determining BFEs for Lacustrine (Lake) flooding:
Determine the contour elevations that the approximate Zone Aboundary crosses (i.e. the BFE) around the perimeter of the lakeor ponding area. Assuming that the highest and lowestdetermined water-surface elevations are within one-half of themap contour interval of each other, add one-half of the mapcontour interval to the lowest water-surface elevation todetermine the BFE for the site.
Example 3
Using a U.S. Geological Survey quadrangle map with acontour interval of 10 feet, the approximate Zone Aboundary crosses low and high determined water-surfaceelevations along the perimeter of the ponding area of 280and 283 feet, respectively, as shown in Figure 10, "ContourInterpolation Method - Lacustrine Flooding Example 3." Thedifference between these two water-surface elevations is 3feet, which is less than one-half of the contour intervalor 5 feet. Therefore, this method is acceptable for use onthis ponding area. Add 280 feet (lowest water-surfaceelevation) and 5 feet (one-half of the contour interval),which yields a BFE of 285 feet.
V-5

Guide For Approximate Zone A Areas Developing BFEs
Figure 10 - Contour Interpolation Method -Lacustrine Flooding Example 3
V-6

Guide For Approximate Zone A Areas Developing BFEs
Data Extrapolation
If a site is within 500 feet upstream of a stream reach forwhich a 100-year flood profile has been computed by detailedmethods, and the floodplain and channel bottom slopecharacteristics are relatively similar to the downstreamreaches, data extrapolation may be used to determine the BFE.The stream in the vicinity of the site, however, must be freeof backwater effects from downstream hydraulic structures.The procedure for using this method is outlined below.
Step 1 - Determine the location of the site on the floodprofile for the detailed study stream
Step 2 - Extrapolate the last segment of the 100-year floodprofile that has a constant water-surface slope tothe location of the site. The BFE at the site canthen be obtained directly from the profile
Figures 11-12 on the following pages depict situations (i.e.,properties "Y" and "Z"), in which the data extrapolationmethod may and may not be used. Figures 13-14 depict asituation in which the data extrapolation method may not beused because the highway may have an effect on the 100-yearwater-surface elevations. If the 100-year flood profilechanges just prior to the limit of detailed study, as shown inFigure 15, the data extrapolation method should not be used.
V-7

Guide For Approximate Zone A Areas Developing BFEs
Figure 11 - Data Extrapolation Method - Profile
Figure 12 - Data Extrapolation -Property Y is approximately 370’ upstream of the limit of
Method - Plan View detailed study (as measured along the streamline). Using the profile below, we can extrapolate the 100-year flood profile to determine that the BFE for property Y is equal to 33’.
-Property Z is approximately 700’ upstream of the limit of detailed study (as measured along the streamline), and is therefore beyond the limit of data extrapolation.
V-8

Guide For Approximate Zone A Areas Developing BFEs
Figure 13 - Data Extrapolation Method - Profile
Figure 14 - Data Extrapolation Method - Plan View -State Route 27 may have an effect on the 100-year
water-surface elevations. Therefore, data extrapolation should not be used to obtain a BFE for property R.
V-9

Guide For Approximate Zone A Areas Developing BFEs
Figure 15 - Data Extrapolation Method - Profile
V-10

Guide For Approximate Zone A Areas Developing BFEs
Detailed Methods
Three essential factors must be determined either by handcalculations or by computer model to determine a BFE by detailedmethods. These factors are: 1) floodplain geometry(topography); 2) flood discharge and/or volume (hydrology); and3) flood height (hydraulics).
Topography involves the measurement of the geometry of a crosssection(s) of the floodplain, which includes horizontal andvertical coordinates. The vertical coordinate, or elevation, isrelated to a vertical datum, such as the National GeodeticVertical Datum of 1929 or North American Vertical Datum of 1988.The horizontal coordinate, or station, is measured from areference point along the cross section to establish actualground points.
Hydrology for the particular location along a stream involvesthe determination of the peak rate of stream flow [usuallymeasured in cubic feet per second (cfs)] that will occur duringa flood (for purposes of determining the BFE, the 100-yearflood). When determining lake or pond elevations, a 100-yearflood hydrograph is required to determine the BFE.
Hydraulics involves the determination of the water-surfaceelevation that will occur during a flood (for purposes ofdetermining the BFE, the 100-year flood), the selection of amethod to relate the flood discharge to a flood depth, and theselection of Manning's roughness coefficients or "n" values.These "n" values vary depending on the type of materials; degreeof irregularity; variation of shape, obstructions, andvegetation; and degree of meandering related to the channel andthe floodplain of a stream.
The following sections discuss various methods for determiningthe topography, hydrology, and hydraulics for a particularlocation in order to determine a BFE.
Topography
Existing Topographic Maps
Before initiating field surveys, determine if there is existingdetailed topographic mapping that can be used to generate cross-section data. To adequately describe a floodplain and for usewith a hydraulic method to calculate a BFE, topographic mapscales and contour intervals must be the same as, or moredetailed than, those used to prepare the
V-11

Guide For Approximate Zone A Areas Developing BFEs
community's Flood Insurance Study. The greater the level ofdetail on the topographic map, the more accurate the BFEdetermination. If the community does not have a Flood InsuranceStudy, an existing topographic survey should, at a minimum, beas detailed as the U.S. Geological Survey quadrangle map for thearea. Regardless of the level of detail of the existingtopographic map used, it is suggested that the geometry of theactual stream channel be obtained by a site visit if the crosssections are to be used for hydraulic analyses.
Datum Requirements for Field Surveys
If a greater level of detail is desired than is available fromexisting topographic mapping, then a field survey should beperformed. If it is necessary to establish a BFE for insurancepurposes or to meet the requirements of 60.3 of the NFIPRegulations, the survey must be referenced to the same datumthat is used to produce the FIRM, which is usually the NationalGeodetic Vertical Datum of 1929 or the North American VerticalDatum of 1988. Reference marks giving elevations to this datumare given in the published Flood Insurance Studies. If thereference marks cannot be located in the field, or are simplytoo far away, additional reference mark information may beobtained from the State's U.S. Geological Survey orTransportation office. Local surveyors are generally familiarwith nearby reference marks. In approximate Zone A areas, if itis not economically feasible to reference survey information toa known reference mark, an assumed datum may be used, providedthat the BFE, structure, and lot elevations are referenced tothe same assumed datum; however, data developed using such anassumed datum may not be sufficient to revise a FIRM. Allsurveys must be certified by a registered professional engineeror land surveyor.
If the sole purpose of determining relative flood heights is tomeet the requirements set forth in Section 60.3(a) of the NFIPregulations, any assumed datum may be used. In this instance, adepth of flooding can be established at a particular locationwithout having to reference it to a datum (i.e., NationalGeodetic Vertical Datum). However, in order for an insurablestructure to be eligible for a lower insurance rate based on theBFE, the survey may need to be referenced to the same datum thatwas used for the FIRM (i.e., National Geodetic Vertical Datum orNorth American Vertical Datum).
V-12

Guide For Approximate Zone A Areas Developing BFEs
Number of Cross Sections Required
If the determination of the BFE is for only one lot, one crosssection is required across the 100-year floodplain through theproperty in question. For large parcels and multi-lotsubdivisions, at least one cross section is required at each endof the parcel or subdivision. Additional cross sections must beadded if the difference in the computed 100-year water-surfaceelevations at the two cross sections is more than one foot andthe distance between the cross sections is greater than 500feet.
Proper Location of Cross Sections
The following guidelines should be used to determine the properlocation for cross sections:
· Flow Path: Cross sections must be oriented perpendicularto the anticipated flow path of the 100-year flood, asshown in Figure 16, "Cross Section Orientation."
· Channel Characteristics: Cross sections should be locatedwhere changes in channel characteristics, such as slope,shape, and roughness, occur.
· Discharge: Cross sections should be located at pointsalong a stream where changes in flood discharge occur, suchas upstream of tributaries, as shown in Figure 17, "LocateCross Sections at Points of Flood Discharge Changes."
· Structures: A minimum of two cross sections are requiredto compute a BFE at or near a structure, such as a bridgeor dam. If the floodplain configurations upstream anddownstream of the structure are similar, two cross sectionsmay be used. One cross section should represent thestructure profile including the profile of the road orembankment. When obtaining the structure profile in thefield, measurements of the structure opening, if there isone, and any piers should also be obtained. The othercross section should represent the natural valley crosssection downstream of the structure and should not includeany part of the structure or embankment. The naturalvalley cross section should be located at a distance equalto the width of the structure opening, W, measured from thedownstream foot of the embankment or wing walls, as shownin Figure 18, "Cross Section Locations at Structures."
V-13

Guide For Approximate Zone A Areas Developing BFEs
Figure 16 - Cross Section Orientation
Figure 17 - Locate Cross Sections at Points of Flood Discharge Changes
V-14

Guide For Approximate Zone A Areas Developing BFEs
Figure 18 - Cross Section Locations at Structures
If the floodplain configurations upstream and downstream ofthe structure are different and the structure is a bridge,an additional cross section should be used upstream of thestructure. The cross section should be located at adistance equal to the width of the structure openingupstream of the structure as measured from the foot of theembankment or wing walls.
The stations and elevations for cross section ground pointsoutside of the stream channel may be obtained from atopographic map. The size of the structure opening, piers,and channel geometry, however, should be obtained by fieldsurvey.
Hydrology
There are a number of methodologies that may be used to develop flooddischarges for approximate Zone A areas. The methods discussed belowwere selected because they are fairly simple to use, requireinformation that is easily obtainable, and provide reasonabledischarge estimates for streams where more detailed hydrologicanalyses have not been performed. These methods, which have beenordered based on ease of use and expected level of accuracy, includedischarge-drainage area relationships, regression equations, theNRCS TR-55 graphical peak discharge and tabular hydrograph methods,
V-15

Guide For Approximate Zone A Areas Developing BFEs
and the rational formula. Other hydrograph methods will also benoted but not described in detail due to their complexity.
Discharge-Drainage Area Relationships
This method is suggested for approximate Zone A areas because itis straightforward and the only data needed are drainage areasand corresponding 100-year flood discharges. These data can beobtained from the Summary of Discharges table in a FloodInsurance Study report.
The relationship between drainage area and discharge is non-linear in most cases; therefore, the drainage areas andcorresponding 100-year flood discharges from the Flood InsuranceStudy should be plotted on log-log paper as shown in Figure 20from the example which begins on the following page. Thestreams plotted may have varying drainage areas; however, otherwatershed characteristics should be similar. A straight lineshould be drawn through the plotted points as shown in Figure21. The 100-year flood discharge for a particular location canthen be estimated based on the drainage area at the location asshown in Figure 21 from the example.
Limitations - If the relationship of plotted points cannot beapproximated by a straight line, then this method should not beused. In addition, this method is not appropriate when thestream along which the site is located is regulated by dams,detention ponds, canals, or other flow control structures ordiversions.
V-16

Guide For Approximate Zone A Areas Developing BFEs
EXAMPLE: DISCHARGE-DRAINAGE AREA RELATIONSHIPS
The following is a Summary of Discharges table from a FloodInsurance Study report.
TABLE 1 - SUMMARY OF DISCHARGES
FLOODING SOURCE DRAINAGE AREA PEAK DISCHARGES (cfs)AND LOCATION (sq. miles) 10-YEAR 50-YEAR 100-YEAR 500-YEAR
PINE CREEKAt confluence with
Saddle River 20.39 2,220 4,165 5,310 9,010At Calvin Street 16.3 1,907 3,617 4,612 7,300At Caitlin Avenue 14.9 1,860 3,285 4,090 6,570
ROCK RUNDownstream of confluenceof Ramsey Brook 12.6 1,640 2,895 3,605 5,795
Upstream of confluenceof Ramsey Brook 10.1 1,390 2,455 3,055 4,910
GOOSE CREEKDownstream of confluenceof Valentine Brook 9.1 1,285 2,270 2,825 4,540
Upstream of confluenceof Valentine Brook 6.2 965 1,700 2,120 3,405
COON CREEKDownstream of confluenceof Allendale Brook 14.3 1,805 3,185 3,965 6,370
Upstream of confluenceof Allendale Brook 12.9 1,670 2,950 3,670 5,900
Assume that Wendy Run is a stream within the same community asthe streams listed in the table, and that the Wendy Run drainagebasin, shown in Figure 19, has similar characteristics to thestream basins from the table. First, plot the drainage areasand corresponding 100-year discharges on log-log paper as shownin Figure 20 on the following page. Then draw a straight linethrough the plotted points as shown in Figure 21.
At Property A, the drainage area for Wendy Run is 8.5 square miles. Using the drainage area curve created from the Flood Insurance Study Summary of Discharges table, the 100-year discharge at Property A is estimated to be 2,750 cfs, as shown on Figure 21. At Property B, with a drainage area of 12.0 square miles, an estimated 100-year discharge of 3,600 is obtained, as shown on Figure 21.
V-17

Guide For Approximate Zone A Areas Developing BFEs
Figure 19 - Wendy Run Drainage Basin
Figure 20 - Discharge-Drainage Area Plot
V-18

Guide For Approximate Zone A Areas Developing BFEs
Figure 21 - 100-year Discharge Estimates forSite A and Site B
Regression Equations
Another methodology that can be used for determining dischargesfor approximate Zone A areas is the application of theappropriate regression equation found in a U.S. GeologicalSurvey publication (Water Resources Investigation or Open Filereport). A list of these publications applicable to each Stateis in Appendix 4. The U.S. Geological Survey has also releasedVersion 1.1 of the National Flood Frequency Computer Program. The National Flood Frequency Program contains the regressionequations for all of the continental United States. The use of regression equations involves the determination ofspecific variables for a watershed (drainage area, mean annualprecipitation, forest cover, stream slope, etc.). Regressionequations are based on actual stream gage data and are usuallydeveloped to determine discharges for the 2-year event up to the100-year event (for purposes of determining the BFE, determinethe 100-year discharge).
V-19

Guide For Approximate Zone A Areas Developing BFEs
The general form of these regression equations is:
Q = K * Ax * By * Cz
where: Q = discharge (cfs)K = regression equation constantA,B,and C = watershed variablesX,Y,and Z = exponents
Watershed variables may include parameters such as drainage area(in square miles), stream slope (in feet/mile), and imperviousarea (in percent).
Limitations - Care must be taken when using these publicationsbecause restrictions generally apply when the watershed isheavily urbanized (i.e., high percentage of impervious land), orwhere the runoff is regulated by the use of dams, detentionponds, canals and other flow diversions. Other restrictionsbased on the physical parameters of the watershed, such asdrainage area or stream slope, may also apply. Limitations ofthese equations are normally stated in each report and should beexamined closely.
TR-55
The NRCS TR-55 "Urban Hydrology for Small Watersheds" containstwo methods for computing flood discharges: the Graphical PeakDischarge method and the Tabular Hydrograph method. TR-55 isstraightforward in its approach and method of computation. TR-55 takes into account the effects of urbanization, rainfalldistribution, soil types and conditions, ground cover types, andother watershed characteristics. A method for estimating theeffects of storage on peak flood discharges is also included inTR-55.
Limitations - In general, TR-55 should not be used in areaswhere flow is divided between closed storm sewer systems andoverland conveyance areas, or where drainage areas exceed 2,000acres. More specific limitations for using TR-55 are containedin Chapters 2 through 6 of the NRCS TR-55 manual.
Rational Formula
This method estimates peak discharge rates for small watershedareas not covered by regression equations and for areas wherethe NRCS TR-55 method is not applicable. The Rational Formula
V-20

Guide For Approximate Zone A Areas Developing BFEs
is based on the drainage area, rainfall intensity, watershedtime of concentration, and a runoff coefficient. Thegeneralized equation is:
Q = C * I * A
where: Q = discharge (cfs)C = runoff coefficientI = rainfall intensity (inches/hour)A = drainage area (acres)
The runoff coefficient, C, varies with soil type, land use, andterrain slope and can be obtained from text books on hydrology.The intensity of rainfall, I, is determined based on the total
rainfall for a selected exceedence probability and a durationequal to the time of concentration for the watershed. The timeof concentration for the watershed can be computed using themethod described in the NRCS TR-55 manual or methods describedin hydrology text books. For approximate Zone A areas, theexceedence probability is equal to 1 percent (100-year stormfrequency). The 1 percent exceedence probability total rainfall(100-year rainfall) for the computed duration can be obtainedfrom Technical Paper No. 40, Hydro 35, and precipitation-frequency atlases published by the National Weather Service. Dividing the total rainfall by the computed duration will yieldthe intensity of rainfall.
Limitations - This method must not be used where the runoff isregulated by the use of dams, detention ponds, canals and otherflow diversions. Also, this method is not recommended fordrainage areas greater than 200 acres, but can be used withcaution for drainage areas up to 640 acres (one square mile).
Other Hydrograph Methods
There are numerous other methods that can be used to determineflood discharges based on rainfall-runoff relationships. Thefollowing hydrograph methods are described in detail withintheir respective technical reports and, therefore, will not bedescribed in detail within this guide. These methodologies ingeneral are good for any size watershed, and most of the methodsinclude computations that take into consideration areas wherethe runoff is regulated by the use of dams, detention ponds,canals and other flow diversions. These methods are recommendedfor determining BFEs for ponds or lakes that are designated asapproximate Zone A. Besides TR-55, two of the more widely usedhydrograph methods are the NRCS' TR-20 and the U.S. Army Corpsof Engineers' HEC-1 computer programs.
V-21

Guide For Approximate Zone A Areas Developing BFEs
TR-20 and HEC-1 provide a very detailed calculation of dischargethrough the generation, addition, and routing of runoffhydrographs. The effect on peak flood discharges due to dams,road crossings, and large floodplain storage areas is moreaccurately assessed with these programs. These models requireexperience on the part of the user if they are to producerealistic determinations of peak discharge.
Limitations - The limitations of these methods are thoroughlydescribed in their manuals. Because these methods involve manyvariables and assumptions, the potential for error is great. The users of these models must be thoroughly versed in thelimitations and assumptions of the computational methodscontained in these models. As with any synthetic modeldepicting rainfall-runoff relationships, extreme care needs tobe taken to ensure that the results of the model are reasonable.It is highly recommended that the discharges produced by these
hydrograph methods be compared to discharges produced by anotherhydrologic method of equal accuracy or by calibrating the modelto an actual storm event.
Hydraulics
There are various hydraulic methods that may be used todetermine BFEs along riverine flooding sources. The appropriatemethod to use depends on flow conditions and the size of thearea that is being analyzed. For developments of equal to orless than 50 lots or 5 acres, the normal depth method, which isdescribed in greater detail below, is usually adequate fordetermining BFEs. After normal depth has been computed, flowconditions should be analyzed. If flow is classified assubcritical (i.e., normal depth is greater than critical depth),normal depth is used as the BFE. If flow is classified assupercritical (i.e., normal depth is less than critical depth),then critical depth is used as the BFE for natural channels. For engineered channels, supercritical (normal) depth may beused for the BFE, provided that the backwater from the normaldepth of the downstream cross section is considered properly. If more than one cross section is required, step-backwatercomputations should be used to determine BFEs along riverineflooding sources.
The procedures for computing normal depth, critical depth, andstep-backwater by hand are outlined below. As an alternative tohand calculations, the QUICK-2 computer program may be used.
V-22

Guide For Approximate Zone A Areas Developing BFEs
QUICK-2 is a user-friendly computer program developed by FEMAthat may be used for normal depth, critical depth, or step-backwater computations for regular or irregular shaped crosssections. To aid the users of this guide in computing BFEs, theQUICK-2 computer program and user's manual are located inAppendix 6. The user's manual contains a tutorial section whichleads a new user through the calculation process using "reallife" examples. For those not using the QUICK-2 program, thefollowing sections on Normal Depth and Critical Depth illustratehow to compute these depths by hand (see Appendix 8 for anexample of a Normal Depth hand calculation).
Normal Depth
Normal depth is the depth expected for a stream when the flow isuniform, steady, one-dimensional, and is not affected bydownstream obstructions or flow changes. For uniform flow, thechannel bottom slope, water-surface slope, and energy slope areparallel and are, therefore, equal. For normal depthcomputations, the flow is considered steady because thedischarge is assumed to be constant; therefore, the depth offlow does not change during the time interval underconsideration.
Normal depth calculations (also called the "slope/area method")compute BFEs at a cross section. The standard formula fordetermining normal depth at a cross section is Manning'sformula. The standard Manning's equation is:
Q = 1.486 x A x (R.667) x S.5 / n
where: Q = discharge (cfs)A = cross section area (ft2)R = hydraulic radius (ft) = A/WPWP = wetted perimeter (ft)S = energy slope (ft/ft)n = Manning's roughness coefficient
The cross section area refers to the area below the water-surface elevation, and the wetted perimeter refers to the lengthof the ground surface along the cross section below the water-surface elevation. The channel bottom slope is used in lieu ofthe energy slope.
As noted earlier, Manning's "n" values vary depending on thephysical features of the stream channel and the channeloverbanks. The results of normal depth calculations can differ
V-23

Guide For Approximate Zone A Areas Developing BFEs
significantly depending on the Manning's "n" values used;therefore, care should be taken to ensure that the Manning's "n"values selected accurately reflect conditions at the site beinganalyzed. Manning's "n" values should be selected based onfield inspection, field photographs, and topographic mapping. Alist of accepted Manning's "n" values has been included inAppendix 5. Various methods for computing normal depth aredescribed below.
Computer Programs for Computing Normal Depth
In addition to QUICK-2, the following Federal Governmentcomputer programs have the capability to perform normal depthcomputations:
Computer ProgramHEC-2HEC-RASWSPROWSP2SFDPSUPRO
AgencyU.S. Army Corps of EngineersU.S. Army Corps of EngineersU.S. Geological SurveyNRCSFEMAFEMA
Please note that HEC-RAS is still being tested and had not yetbeen released to the general public when this guide waspublished. Furthermore, FEMA has not yet approved the model forrequests to revise NFIP maps. Please contact our Headquartersoffice to determine the current status of HEC-RAS.
In addition to the above-referenced programs, there are otherengineering computer programs and models, which perform normaldepth calculations, that are available through variouscommercial vendors. References for the hydraulic computerprograms listed above are in Appendix 7.
Normal Depth Hand Calculations
If a computer is not available, it is possible to perform handcomputations to calculate normal depth for the 100-year flood ata cross section by following steps 1-11 listed below.
Step 1 - Obtain a topographic map or conduct a field survey toobtain a cross section at the site where normal depthshould be determined. If a topographic map is used,the channel geometry should be obtained frommeasurements taken in the field. The cross sectionshould be oriented perpendicular to the expected 100-year floodplain.
V-24

Guide For Approximate Zone A Areas Developing BFEs
Step 2 - Compute the 100-year discharge by applying one of themethods described in the hydrology section of thisguide.
Step 3 - Plot the cross section on graph paper with thestations and the corresponding elevations. (Thestations and elevations are obtained from thetopographic map and/or from field survey).
Step 4 - Select the left and right channel bank stations. Thechannel bank stations are those stations where theground slope becomes flatter moving away from thechannel bottom as shown in Figure 22, "Channel BankStations." Photographs taken in the field and thecontours on the topographic maps are also helpful whendefining the channel bank stations. Do not place thechannel bank stations at the bottom of the channel.
Figure 22 - Channel Bank Stations
Step 5 - Select appropriate Manning's roughness coefficientsfor the left overbank, channel, and right overbankfrom the "n" values given in Appendix 5. These valuesshould be determined by reviewing the fieldphotographs and visiting the site.
Step 6 - Compute the cross section area, wetted perimeter,hydraulic radius, and conveyance for each segment(i.e., left overbank, channel, and right overbank) forat least three elevations. The conveyance, K, of asegment is given as:
K = (1.486/n) x A x R0.667
where: A = cross section area (ft2)R = hydraulic radius (ft)WP = wetted perimeter (ft)R = A/WP
V-25

Guide For Approximate Zone A Areas Developing BFEs
Step 7 - Compute the channel bottom slope, S, from thetopographic map or from field survey.
Step 8 - Compute the discharge, Q, for each segment of thecross section at each elevation by multiplying K byS0.5.
Step 9 - Add the discharges from each segment at the sameelevation to obtain the total discharge.
Step 10 - Plot the total discharges and the correspondingelevations on graph paper.
Step 11 - The BFE can be determined from this graph for the 100-year flood discharge computed in Step 2.
An example of a normal depth hand calculation is included inAppendix 8.
Critical Depth
After computing normal depth, the type of flow should bechecked. If the velocity head from the normal depth computationis equal to or more than half the hydraulic depth, the flow issupercritical and the critical depth should be used to establishthe BFE. The velocity head, HV, for an irregular cross sectionis computed using the following equation:
HV = V2/2g
where: = velocity coefficient
T / AT (fps)V = mean velocity = QQT = total discharge (cfs)
AT = total flow area (ft2)
g = acceleration due to gravity = 32.2 ft/sec2
The velocity coefficient, , is determined using the followingequation:
[(KL
3/AL
2) + (KC
3/AC
2) + (KR
3/AR
2)]
2KT
3/AT
V-26

Guide For Approximate Zone A Areas Developing BFEs
where: KL, KC, KR, KT = conveyance for left overbank, channel, right overbank, and total conveyance, respectively
AL, AC, AR, AT = flow area for left overbank, channel, right overbank, and total flow area, respectively
Hydraulic depth, h, is computed by using the following relationship:
h = AT / T
where: T = top water-surface width at the normal depthAT = Total Flow Area
If the velocity head is greater than or equal to one-half thehydraulic depth, the flow is supercritical.
For prismatic channels, the following equation can be used todetermine the critical depth:
Q2 = A3 or Q = g T
gA3 / T
For a series (3 or more) of water-surface elevations, computethe corresponding total area, A, water-surface topwidth, T, and
the critical discharge, Q, using Q = gA3 / T. Compute thevalue of right hand side of the above equation. Plot the water-surface elevations and the corresponding discharge values ongraph paper. The critical water-surface elevation and,therefore, critical depth, can be determined from this graph fora range of discharge values.
For rectangular channels, critical depth can be computeddirectly from the above equation and is expressed in thefollowing relationship:
DC = { Q / (5.67 T)}0.667
The energy is minimum at the critical depth. For irregularcross sections, critical depth is determined from therelationship between the water-surface elevation and the energy.The energy is computed by adding the water-surface elevation andthe corresponding velocity head (or energy grade elevation). For irregular cross sections, the velocity coefficient, a( ),must be considered when computing velocity head (HV). Severalwater-surface elevations should be assumed and correspondingenergy grade elevations computed. These values are then plotted
V-27

Guide For Approximate Zone A Areas Developing BFEs
on a graph of water-surface elevation versus energy gradeelevation. The critical water-surface elevation and, therefore,critical depth, can be determined from this graph where theenergy (i.e., energy grade elevation) is minimum.
Step-Backwater Analysis
Step-backwater computations are based on the principle ofconservation of energy, which states that the energy at theupstream cross section is equal to the energy at the downstreamcross section plus the losses between the two cross sections. The losses considered in the step-backwater analysis are thefriction loss and the transition loss.
The equations and the procedure used in the step-backwateranalysis are explained in the QUICK-2 user's manual in Appendix6. Although hand computations can be done to perform the step-backwater analysis, it is advisable to use the QUICK-2 programor other Federally approved programs for ease of computation. The QUICK-2 program currently does not model the effects ofbridges or culverts or supercritical flow.
The QUICK-2 program uses the default friction slope method,which is the average conveyance method, from the HEC-2 programto compute friction losses. For transition losses, acontraction coefficient of 0.1 and an expansion coefficient of0.3 should be used in the computations.
The reach lengths between the two cross sections for the leftoverbank, channel, and right overbank are required for step-backwater computations. The distance for the left overbankshould be measured between the center of the floodplains of theleft overbank at each cross section. The same is true for theright overbank. The channel distance should be measured alongthe streambed, and therefore will account for the meandering ofthe stream channel.
In general, starting water-surface elevations are obtained fromnormal depth computations (slope/area method) at the first crosssection. If there is a structure downstream of the study area,the backwater effects of the structure must be considered indetermining the starting water-surface elevation. If there is aknown 100-year water-surface elevation at the downstream end ofthe study area, that water-surface elevation should be used asthe starting water-surface elevation.
V-28

Guide For Approximate Zone A Areas Developing BFEs
Hydraulic Structures
As stated earlier, normal depth is the depth expected for astream when the flow is uniform, steady, one-dimensional, and isnot affected by downstream obstructions or flow changes. However, there are situations in which a physical structurelocated downstream of a particular site will cause anobstruction or alteration of the flow, resulting in a flooddepth at the site higher than the normal depth. The discussionbelow describes the appropriate methods for determining BFEs forreaches that include hydraulic structures.
Hydraulic structures that are common in approximate Zone A areasinclude road and railroad crossings, including embankments,dams, bridges and culverts, and canal crossings. The flow overthe road, railroad, embankment, dam or canal can be described asweir flow. Weir flow can be calculated by hand or by computerprogram in order to determine the BFE. When flow passes througha bridge or culvert, the BFE can be determined through the useof nomographs or computer programs. The BFE at a structurewhere flow travels through a bridge or culvert and over thecrossing can be determined by nomographs, but is more easilydetermined with a computer program.
Weir Flow
Determination of the water-surface elevation for weir flowrequires at least two cross sections. The first cross sectionrepresents the natural valley section downstream of thestructure, and the second cross section represents the roadprofile and the opening of the structure (refer to Figure 18,"Cross Section Locations at Structures." If the approachvelocity head is to be considered, then a third cross section isrequired that represents the natural valley section upstream ofthe structure. In most situations, however, the velocity headcan be assumed to be negligible, and a third cross section isnot necessary.
The water-surface elevation downstream of the structure shouldbe determined by using normal depth computations at the firstcross section, provided there are no structures furtherdownstream that can create backwater effects (refer to themethods for determining normal depth described previously).
The second cross section, which represents the profile along thetop of the structure including the road or the embankment,should be used to determine the weir length for use in theequation for weir flow, as shown on the following page.
V-29

Guide For Approximate Zone A Areas Developing BFEs
Q = @ x C x L x H3/2
where: Q = discharge (cfs)@ = submergence factorC = weir coefficient, varies from 2.6 to 3.0 and can
be obtained from hydraulic text booksL = weir length (ft)H = available head (ft), measured from top of weir to
the selected energy grade elevation
Several values for H should be selected and the correspondingdischarge computed until the total weir flow is larger than the100-year flood discharge. Plot the discharges and thecorresponding energy grade elevations on graph paper. The 100-year flood energy grade elevation can be determined from thisgraph. For an approximate analysis, the computed energygradient elevation can be considered the BFE.
If the structure profile is not horizontal, as shown in Figure23, "Weir Flow - Embankment Profile is Not Horizontal," severalstructure segments should be used and an average energy depth,H, for that segment should be determined for use in the aboveequation for selected energy grade elevations. The sum of theweir flow from each segment will then be equal to the total weirflow for the selected energy grade elevation.
Q = (@ CL(1) HAVG(1)
3/2) + (@ CL(2) HAVG(2)
3/2)+ (@ CL(3) HAVG(3)
3/2) + (@ CL(4) HAVG(4)
3/2)
Figure 23 - Weir Flow - Embankment Profile is Not Horizontal
V-30

Guide For Approximate Zone A Areas Developing BFEs
If the downstream water-surface elevation is higher than theminimum road elevation, a submergence factor may be consideredin the weir flow computation. The submergence factor isdependent upon the D/H ratio, where D is the downstream depth ofwater above the road and H is the upstream energy grade depthabove the road, as shown in Figure 24, "Weir Flow Over Road." The submergence factor must be considered when the D/H ratio ismore than 0.79. For a non-horizontal road profile, the D/Hratio must be computed for each road segment. The submergencefactor, @, can be determined from the curve in "Hydraulics ofBridge Waterways" (Reference 1, Figure 24) and some typicalvalues are given in the table below.
Figure 24 - Weir Flow Over Road
D/H @ D/H @ 0.998 0.30 0.944 0.80 0.992 0.40 0.932 0.85 0.986 0.50 0.915 0.90 0.976 0.60 0.889 0.95 0.962 0.70 0.700 1.00
Other procedures used in Federal agency backwater computer programscan also be used to determine the submergence factor.
A third cross section may be used to determine a more accurate water-surface elevation upstream of the structure. This may be done byassuming water-surface elevations and calculating the correspondingvelocity heads (HV) until an assumed water-surface elevation plus itsvelocity head at that elevation equal the same energy gradientelevation obtained from the weir flow equation. The velocity head,HV, can be calculated using the following equation:
HV = a (Q/A)2/2g
V-31

Guide For Approximate Zone A Areas Developing BFEs
where: a = velocity coefficient Q = 100-year flood discharge (cfs)A = cross section area (ft2) at the assumed
water-surface elevationg = Acceleration due to gravity = 32.2 ft/sec2
An example of a weir flow computation is included in Appendix 9.
Flow Through Structures
Culverts
At least two cross sections are required to determine the water-surface elevation upstream of a culvert. The first cross sectionshould represent the natural valley cross section downstream of theculvert, and the second cross section should represent the top of theembankment profile and the opening of the structure (refer to Figure13, "Cross Section Locations at Structures"). The size, type,length, and upstream and downstream invert elevations of the culvertshould be obtained by field survey. The wing wall angle and theentrance opening configuration, such as sharp edge or rounded edge,should also be determined from a field survey. The Federal HighwayAdministration publication "Hydraulic Design of Highway Culverts"(Reference 2) should be referenced before going to the field so thatall the necessary information for culvert flow computations can becollected during one field survey. Water-surface elevations upstreamof the culvert can then be computed using the nomographs contained inthe above-mentioned publication and the procedures outlined below.
The first cross section should be used to determine the normal depthdownstream of the culvert, which will be considered as the tailwater(refer to section on normal depth computations).
Two computations are required to determine the headwater when usingFederal Highway Administration nomographs. One computation is forinlet control, and the other computation is for outlet control. Theheadwater elevations from the two computations are then compared. The higher of the two should be selected as the upstream headwaterelevation. If this headwater elevation is higher than the top ofembankment profile, weir flow will occur. Perform at least threeweir flow computations for headwater elevations between the headwaterthat assumes that all the flow is culvert flow (the firstcomputation) and the minimum top of embankment elevation. For eachselected headwater elevation, compute the culvert flow using FederalHighway Administration nomographs. Combine the weir flow and culvertflow for each selected headwater elevation and plot on graph paper. The BFE for the 100-year flood discharge can then be obtained fromthis graph.
V-32

Guide For Approximate Zone A Areas Developing BFEs
If the site in question is not located immediately upstream of astructure, a normal depth should be computed at the site. The 100-year water-surface elevation at the site should be the higher of thetwo elevations from the culvert computation and the normal depthcomputation.
Federal Highway Administration nomographs predict only the energygrade elevation upstream of the culverts. In most applications, thevelocity head is assumed to be negligible and, therefore, the energygrade elevation approximates the actual water-surface elevation. Ifa more accurate water-surface elevation is desired, a hydrauliccomputer model, such as HEC-2, should be used to determine the BFE. The procedure outlined in the weir flow section to compute a water-surface elevation that corresponds to a certain energy gradeelevation may also be used to determine a BFE upstream of a culvert.
Bridges
Although hand computations can be performed by following theprocedures for bridge routines in Federal agency computer models, itis recommended that the water-surface elevation upstream of bridgesbe determined using a computer model. The number of cross sectionsrequired at the structure depends upon the type of bridge routineused. Four cross sections are required if the special bridge routinein the HEC-2 program is used, and six cross sections are required ifthe normal bridge routine in the HEC-2 program is used. Three crosssections are required if the bridge routines in the WSPRO program andthe WSP2 program are used. A step-backwater analysis is alsorequired to compute the water-surface elevations with these bridgeroutines. The following programs are recommended to compute thewater-surface elevation upstream of a bridge:
Computer Program Agency
HEC-2 U.S. Army Corps of Engineers*HEC-RAS U.S. Army Corps of EngineersWSPRO U.S. Geological SurveyWSP2 NRCS
*Not available for general use when this guide was published;please contact our Headquarters office for current status.
V-33

Guide For Approximate Zone A Areas Developing BFEs
REFERENCE
1. U.S. Department of Transportation, Federal HighwayAdministration, Hydraulics of Bridge Waterways, Washington,D.C., March 1978.
2. U.S. Department of Transportation, Federal HighwayAdministration, Hydraulic Design of Highway Culverts,Washington, D.C., September 1985.
V-34

Guide For Approximate Zone A Areas Letters of Map Change
VI. OBTAINING LETTERS OF MAP CHANGE
Once detailed methods have been applied to develop BFE data, thesedata may be suitable for revising an NFIP map via a Letter of MapCorrection. On October 1, 1992, FEMA implemented the use ofdetailed application and certification forms for requestingrevisions to NFIP maps. Therefore, if a map revision is requested,the appropriate forms should be submitted.
FEMA has implemented a procedure to recover costs associated withreviewing and processing requests for modifications to publishedflood information and maps. Specific information about these feesis presented in the application and certification forms.
These forms, along with other useful documents pertaining to theNFIP, may be obtained from our technical evaluation contractors atthe addresses listed below:
FEMA Regions I-V
Dewberry & DavisManagement Engineering andTechnical Services Division8401 Arlington BoulevardFairfax, Virginia 22031FAX: (703) 876-0073
FEMA Regions VI-X
Michael Baker, Jr., Inc.3601 Eisenhower Avenue
Suite 600Alexandria, Virginia 22304
FAX: (703) 960-9125
This information is also available through the FEMA RegionalOffices listed in Appendix 3.
To provide additional assistance to those who develop BFE data, aworksheet that synopsizes the procedures detailed in this guide isfound in Appendix 10.
VI-1
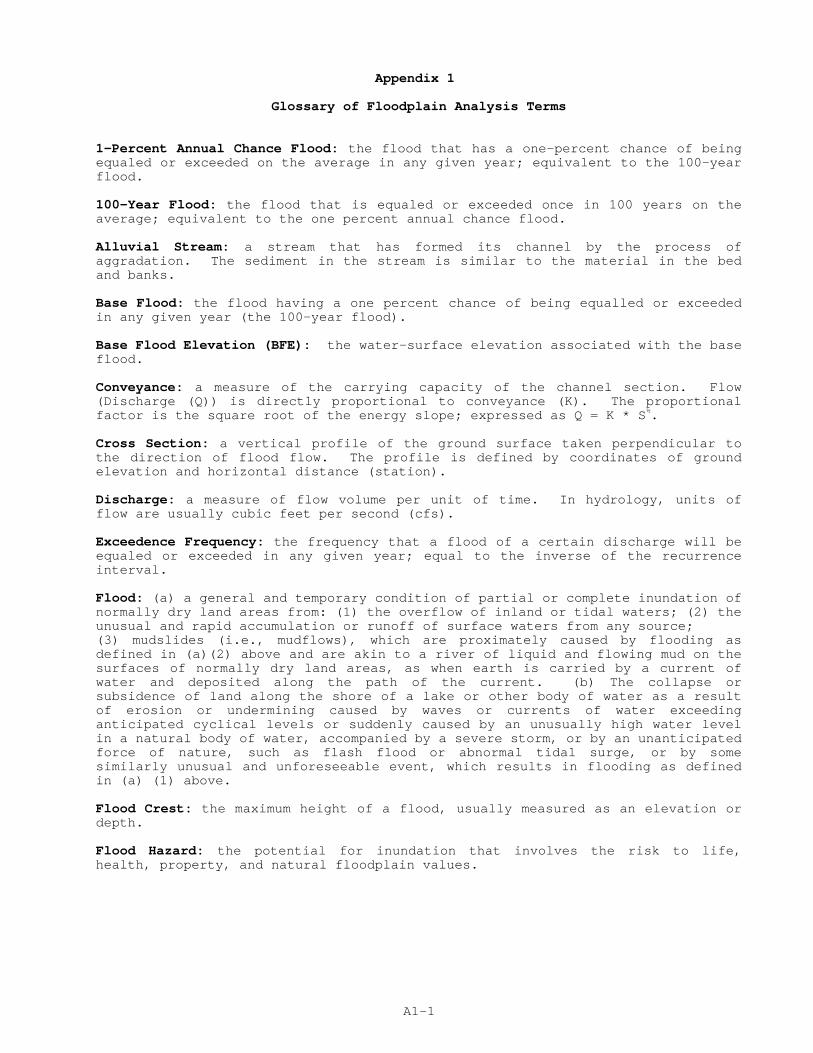
Appendix 1
Glossary of Floodplain Analysis Terms
1-Percent Annual Chance Flood: the flood that has a one-percent chance of beingequaled or exceeded on the average in any given year; equivalent to the 100-yearflood.
100-Year Flood: the flood that is equaled or exceeded once in 100 years on theaverage; equivalent to the one percent annual chance flood.
Alluvial Stream: a stream that has formed its channel by the process ofaggradation. The sediment in the stream is similar to the material in the bedand banks.
Base Flood: the flood having a one percent chance of being equalled or exceededin any given year (the 100-year flood).
Base Flood Elevation (BFE): the water-surface elevation associated with the baseflood.
Conveyance: a measure of the carrying capacity of the channel section. Flow(Discharge (Q)) is directly proportional to conveyance (K). The proportionalfactor is the square root of the energy slope; expressed as Q = K * S½.
Cross Section: a vertical profile of the ground surface taken perpendicular tothe direction of flood flow. The profile is defined by coordinates of groundelevation and horizontal distance (station).
Discharge: a measure of flow volume per unit of time. In hydrology, units offlow are usually cubic feet per second (cfs).
Exceedence Frequency: the frequency that a flood of a certain discharge will beequaled or exceeded in any given year; equal to the inverse of the recurrenceinterval.
Flood: (a) a general and temporary condition of partial or complete inundation ofnormally dry land areas from: (1) the overflow of inland or tidal waters; (2) theunusual and rapid accumulation or runoff of surface waters from any source;(3) mudslides (i.e., mudflows), which are proximately caused by flooding asdefined in (a)(2) above and are akin to a river of liquid and flowing mud on thesurfaces of normally dry land areas, as when earth is carried by a current ofwater and deposited along the path of the current. (b) The collapse orsubsidence of land along the shore of a lake or other body of water as a resultof erosion or undermining caused by waves or currents of water exceedinganticipated cyclical levels or suddenly caused by an unusually high water levelin a natural body of water, accompanied by a severe storm, or by an unanticipatedforce of nature, such as flash flood or abnormal tidal surge, or by somesimilarly unusual and unforeseeable event, which results in flooding as definedin (a) (1) above.
Flood Crest: the maximum height of a flood, usually measured as an elevation ordepth.
Flood Hazard: the potential for inundation that involves the risk to life,health, property, and natural floodplain values.
A1-1

Appendix 1 - continued
Glossary of Floodplain Analysis Terms
Floodplain: any land area, such as the lowland and relatively flat areasadjoining inland and coastal waters, susceptible to being inundated by water fromany source.
Floodway: the channel of a river or other watercourse and the adjacent land areasthat must be reserved in order to discharge the base flood without cumulativelyincreasing the water-surface elevation more than a designated height. The baseflood is defined as the one-percent chance flood and the designated height isusually one foot above the base flood elevation; however, this height may vary(but is not more than one foot) depending on what the State has adopted.
Floodway Fringe: the area between the floodway boundary and the 100-yearfloodplain boundary.
Flow: equivalent to discharge.
Flow Area: the cross section (see discharge) area of the floodplain below a givenwater-surface elevation.
Hazardous Flow: conditions that exist when the product of the depth of flow andits corresponding velocity are greater than ten (10). For example a flow depthof 3 feet and a flow velocity of 4 feet per second (3 x 4 = 12) would beconsidered hazardous flow.
Hydraulic Depth: an average depth computed as the Flow Area divided by the topwidth of the floodplain for a given water-surface elevation.
Lacustrine Flooding: Flooding produced by a lake or pond.
Peak Discharge: the maximum instantaneous discharge of a flood at a givenlocation.
Recurrence Interval: the average interval of time required for a flood of aspecific discharge to occur or be exceeded; equal to the inverse of theexceedence frequency.
Riverine Flooding: Flooding produced by a river or stream.
Shallow Flooding: a designated AO, AH, or VO zone on a community's FloodInsurance Rate Map with a one percent or greater annual chance of flooding to anaverage depth of one to three feet where a clearly defined channel does notexist, the path of flooding is unpredictable, and velocity flow may be evident. Such flooding is characterized by ponding or sheet flow.
Slope (Energy): the rate of energy loss of a watercourse.
Slope (Ground): the change in vertical ground elevation over a horizontaldistance, usually based on the change in the vertical elevation of the streambottom.
Steady Flow: state of flow where the depth of flow does not change with time.
Subcritical Flow: state of flow where the gravitational forces are morepronounced than the inertial forces. The flow tends to have a low velocity. Ingeneral, in this flow regime, the hydraulic depth is more than twice the velocityhead.
Supercritical Flow: state of flow where the inertial forces become dominant. Theflow tends to have a high velocity. In general, in this flow regime, thevelocity head is equal to or more than half the hydraulic depth.
A1-2

Appendix 1 - continued
Glossary of Floodplain Analysis Terms
Unsteady Flow: state of flow where the depth of flow changes with time.
Uniform Flow: depth is constant over channel length, and the channel shape, slopeand boundary roughness are constant over the channel length.
Varied Flow: depth of flow changes along the channel length.
Gradually Varied Flow: depth of flow changes gradually over the channel length.
Rapidly Varied Flow: depth changes abruptly over a short channel length.
Velocity: a rate of movement (i.e., distance divided by time). For water, therate is expressed in feet per second. Because water in a channel does not allmove at the same velocity at every point, an average value is used to describedflow velocity. This average velocity equals the discharge divided by the flowarea (Q/A).
Velocity Head: the kinetic energy term (a V2 / 2g), in the total energy of flow.The velocity coefficient (a) is used to adjust for the distribution of velocity in a cross section of differing roughness.
A1-3

Appendix 2
Flood Insurance Study Data Request Form
FLOOD INSURANCE STUDY (FIS) DATA REQUESTS
Requests for FIS data should be made in writing to:
Regions I-V Regions VI-X
Flood Insurance Information Specialist FEMA Project Libraryc/o Dewberry & Davis c/o Michael Baker, Jr., Inc.2953 Prosperity Avenue 3601 Eisenhower AvenueFairfax, Virginia 22031 Suite 600FAX: (703) 876-0073 Alexandria, Virginia 22304
FAX: (703) 960-9125The following information should be included in your written request:
� Complete community name (including county)
� Community Identification Number
� Name(s) of flooding source(s) and specific location(s) for which data are needed
� Specific data needed:
HEC-2 input and output filesTopographic dataetc.
� Effective date of FIRM/FBFM for which data are requested (enclose an annotated copy of FIRM/FBFM if available identifying area of interest)
� Agreement to pay costs associated with processing the request
� Fee limit after which authorization is needed
� Contact person's name, address, and phone number
The average request takes approximately 2 to 4 weeks to fill and may cost between$100 to $200.
You will be contacted after we have determined if the data are available and thecost to fill the request has been determined.
Do not include payment with your request letter.
Checks or money orders should be made payable to the National Flood InsuranceProgram and sent to:
Federal Emergency Management AgencyFee Collection System
P.O. Box 398Merrifield, Virginia 22116
Data will be released upon receipt of payment.
A2-1

Appendix 3
Federal Emergency Management Agency Officesand Other Federal and State Agencies
Federal Emergency Management Agency Offices
HEADQUARTERS
500 C Street, SWWashington, D.C. 20472(202) 646-3680FAX: (202) 646-4596
REGION I(Connecticut, Maine, Massachusetts, New Hampshire, Rhode Island & Vermont)
J.W. McCormack Post Office & Courthouse Building, Room 462Boston, MA 02109(617) 223-9561FAX: (617) 223-9574
REGION II(New Jersey, New York, Puerto Rico & Virgin Islands)
26 Federal Plaza, Room 1349New York, NY 10278(212) 225-7200FAX: (212) 225-7262
REGION III(Delaware, District of Columbia, Maryland, Pennsylvania, Virginia & WestVirginia)
Liberty Square Building, Second Floor105 South Seventh StreetPhiladelphia, PA 19106(215) 931-5512FAX: (215) 931-5501
REGION IV(Alabama, Florida, Georgia, Kentucky, Mississippi, North Carolina, South Carolina& Tennessee)
1371 Peachtree Street, N.E., Suite 700Atlanta, GA 30309(404) 853-4400FAX: (404) 853-4440
REGION V(Illinois, Indiana, Michigan, Minnesota, Ohio & Wisconsin)
175 West Jackson BoulevardFourth FloorChicago, IL 60604(312) 408-5552FAX: (312) 408-5551
A3-1

Appendix 3 - continued
Federal Emergency Management Agency Officesand Other Federal and State Agencies
Federal Emergency Management Agency Offices (continued)
REGION VI(Arkansas, Louisiana, New Mexico, Oklahoma & Texas)
Federal Regional Center800 North Loop 288Denton, TX 76201-3698(817) 898-5165FAX: (817) 898-5195
REGION VII(Iowa, Kansas, Missouri & Nebraska)
Federal Office Building, Room 300911 Walnut StreetKansas City, MO 64106(816) 283-7002FAX: (816) 283-7018
REGION VIII(Colorado, Montana, North Dakota, South Dakota, Utah & Wyoming)
Denver Federal Center, Bldg. 710P.O. Box 25267Denver, CO 80225-0267(303) 235-4830FAX: (303) 235-4849
REGION IX(Arizona, California, Hawaii & Nevada)
Presidio of San FranciscoBuilding 105San Francisco, CA 94129(415) 923-7100FAX: (415) 923-7147
REGION X(Alaska, Idaho, Oregon & Washington)
Federal Regional Center130 - 228th Street, SWBothell, WA 98021-9796(206) 487-4678FAX: (206) 487-4613
A3-2

Appendix 3 - continued
Federal Emergency Management Agency Officesand Other Federal and State Agencies
Other Federal and State Agencies
ALABAMA
Alabama Department of Economicsand Community Affairs
State Planning Division401 Adams AvenueMontgomery, AL 36103(205) 242-5442
U.S. Geological SurveyDistrict ChiefWater Resources Division520 19th AvenueTuscaloosa, AL 35401(205) 752-8104
U.S. Department of AgricultureNatural Resources ConservationService
665 Opelika Rd.P.O. Box 311Auburn, AL 36830(205) 887-4506
NFIP State Coordinator
Mr. Gene AndersonDirector, Alabama Departmentof Economic and Community Affairs
P.O. Box 5690401 Adams AvenueMontgomery, AL 36103-5690(205) 242-5499
ALASKA
Alaska Department ofCommunity and Regional Affairs
Municipal and RegionalAssistance Division
333 West 4th Avenue, Suite 220Anchorage, AK 99501(907) 269-4500
U.S. Geological SurveyDistrict ChiefWater Resources Division4230 University Drive, Suite 201Anchorage, AK 99508-4138(907) 786-7100
U.S. Department of AgricultureNatural Resources ConservationService
949 East 36th AvenueSuite 400Anchorage, AK 99504(907) 271-2424
NFIP State Coordinator
Mr. Bob WalshMunicipal and RegionalAssistance Division333 West 4th Avenue, Suite 220Anchorage, AK 99501(907) 269-4500
ARIZONA
Arizona Department of Water Resources15 South 15th AvenuePhoenix, AZ 85004(602) 242-1553
U.S. Geological SurveyDistrict ChiefWater Resources Division375 South EuclidTucson, AZ 85719(602) 670-6671
U.S. Department of AgricultureNatural Resources ConservationService
3008 Federal Building230 N. 1st AvenuePhoenix, AZ 85025(602) 261-6711
NFIP State Coordinator
Ms. Elizabeth A. RiekeDirector, Arizona Departmentof Water Resources15 South 15th AvenuePhoenix, AZ 85007(602) 542-1540
ARKANSAS
Arkansas Soil and WaterConservation Commission
1 Capitol Mall, Suite 2DLittle Rock, AR 72201(501) 371-1611
A3-3

Appendix 3 - continued
Federal Emergency Management Agency Officesand Other Federal and State Agencies
Other Federal and State Agencies
U.S. Geological SurveyWater Resources Division401 Hardin RoadLittle Rock, AR 72211(501) 228-3600
U.S. Department of AgricultureNatural Resources ConservationService
Federal Office Bldg.700 West CapitolP.O. Box 2323Little Rock, AR 72203(501) 324-6335
NFIP State Coordinator
Mr. Randy YoungDirectorArkansas Soil & WaterConservation Commission101 East CapitolLittle Rock, AR 72201(501) 682-1611
CALIFORNIA
California Department ofWater Resources
P.O. Box 942836Sacramento, CA 94236-0001(916) 653-5791
U.S. Geological SurveyDistrict ChiefWater Resources DivisionFederal Building, Room W-22332800 Cottage WaySacramento, CA 95825(916) 978-4633
U.S. Department of AgricultureNatural Resources ConservationService
2121 C 2nd StreetDavis, CA 95616(916) 757-8200
NFIP State Coordinator
Mr. David Kennedy, DirectorCalifornia Department ofWater Resources
P.O. Box 942836Sacramento, CA 94236-0001(916) 653-7007
COLORADO
Urban Drainage and Flood ControlDistrict
2480 West 26th AvenueSuite 156BDenver, CO 80211
Colorado Water Conservation BoardState Centennial Building, Room 7211313 Sherman StreetDenver, CO 80203(303) 866-3441
U.S. Geological SurveyDistrict ChiefWater Resources DivisionDenver Federal Center, Building 53Box 25046 (Mail Stop 415)Lakewood, CO 80225-0046(303) 236-4882
U.S. Department of AgricultureNatural Resources ConservationService
655 Parfait StreetRoom E200CLakewood, CO 80215(303) 236-2886
NFIP State Coordinator
Mr. Daries C. Lile, P.E.Director, Colorado WaterConservation Board
State Centennial Building1313 Sherman StreetDenver, CO 80203(303) 866-3441
CONNECTICUT
State Department ofEnvironmental Protection
79 Elm Street, 3rd FloorHartford, CT 06106(203) 424-3706
U.S. Geological SurveyHydrologist-in-ChargeConnecticut OfficeWater Resources DivisionAbraham A. Ribicoff FederalBuilding, Room 525
450 Main StreetHartford, CT 06103(203) 240-3060
A3-4

Appendix 3 - continued
Federal Emergency Management Agency Officesand Other Federal and State Agencies
Other Federal and State Agencies
U.S. Department of AgricultureNatural Resources ConservationService
16 Professional Park RoadStorrs, CT 06268(203) 429-9361
NFIP State Coordinator
Mr. Timothy Keeney, CommissionerState Department of EnvironmentalProtection
165 Capitol AvenueState Office BuildingHartford, CT 06106(203) 566-2110
DELAWARE
Department of Natural Resources andEnvironmental Control
Division of Soil and WaterConservation
P.O. Box 140189 Kings HighwayDover, DE 19903(302) 739-4403
U.S. Geological SurveyHydrologist-in-ChargeDelaware OfficeWater Resources DivisionFederal Building, Room 1201300 South New StreetDover, DE 19904(302) 734-2506
U.S. Department of AgricultureNatural Resources ConservationService
3500 South DuPont HighwayDover, DE 19901(302) 697-6176
NFIP State Coordinator
Mr. John A. Hughes, DirectorDelaware Department of Natural &Environmental Control
Richardson and Robbins BuildingP.O. Box 1401Dover, DE 19903(301) 736-4411
DISTRICT OF COLUMBIA
Department of ConsumerRegulatory Affairs
614 H Street NorthwestWashington, DC 20001(202) 727-7170
U.S. Geological SurveyDistrict ChiefWater Resources Division208 Carroll Building8600 La Salle RoadTowson, MD 21286(410) 828-1535
NFIP State Coordinator
Mr. Donald G. Murray, DirectorDepartment of Consumer RegulatoryAffairs
Office of the Director614 H Street, NW., Suite 1120Washington, D.C. 20001(202) 727-7170
FLORIDA
Department of Community AffairsEast Howard Building2740 Centerview DriveTallahassee, FL 32399-2100(904) 488-8466
U.S. Geological SurveyDistrict ChiefWater Resources Division227 North Bronough Street,Suite 3015
Tallahassee, FL 32301(904) 942-9500
U.S. Department of AgricultureNatural Resources ConservationService
P.O. Box 141510Gainesville, FL 32614(904) 338-9500
NFIP State Coordinator
Ms. Linda Lomis Shelley, SecretaryFlorida Department of CommunityAffairs
2740 Centerview DriveTallahassee, FL 32399-2100(904) 488-8466
A3-5

Appendix 3 - continued
Federal Emergency Management Agency Officesand Other Federal and State Agencies
Other Federal and State Agencies
GEORGIA
Department of Natural ResourcesEnvironmental Protection DivisionFloyd Towers East, Suite 1252205 Butler Street SoutheastAtlanta, GA 30334(404) 656-4713
U.S. Geological SurveyDistrict ChiefWater Resources Division3039 Amwiler Road, Suite 130Atlanta, GA 30360(404) 447-9803
U.S. Department of AgricultureNatural Resources ConservationService
Federal Building355 East Hancock AvenueP.O. Box 832Athens, GA 30613(404) 546-2272
NFIP State Coordinator
Mr. Joe D. Tanner, CommissionerGeorgia Department of NaturalResources
205 Butler Street, S.E.Floyd Towers East, Suite 1252Atlanta, GA 30334(404) 656-3500
HAWAII
Hawaii Board of Land andNatural Resources
1151 Punchbowl Road, Room 220Honolulu, HI 96813(808) 587-0446
U.S. Geological SurveyDistrict ChiefWater Resources Division677 Ala Moana Boulevard, Suite 415Honolulu, HI 96813(808) 522-8290
U.S. Department of AgricultureNatural Resources ConservationService
300 Ala Moana BoulevardP.O. Box 50004Honolulu, HI 96850(808) 546-3165
NFIP State CoordinatorMr. William W. Paty, ChairpersonCommission on Water Resource Management and Board of Land and Natural ResourcesState of HawaiiP.O. Box 621Honolulu, HI 96809(808) 587-0401
IDAHO
Department of Water ResourcesState House1301 North Orchard StreetBoise, ID 83706(208) 327-7900
U.S. Geological SurveyDistrict ChiefWater Resources Division230 Collins RoadBoise, ID 83702(208) 387-1300
U.S. Department of AgricultureNatural Resources ConservationService
3244 Elder StreetRoom 124Boise, ID 83705(208) 334-1601
NFIP State Coordinator
Mr. R. Keith Higginson, DirectorIdaho Department of Water Resources1301 N. OrchardBoise, ID 83706(208) 327-7900
ILLINOIS
Illinois Department of TransportationLocal Flood Plains Programs310 South Michigan, Room 1606Chicago, IL 60604(312) 793-3123
U.S. Geological SurveyDistrict ChiefWater Resources DivisionChampaign County Bank Plaza102 East Main StreetFourth FloorUrbana, IL 61801(217) 398-5353
A3-6

Appendix 3 - continued
Federal Emergency Management Agency Officesand Other Federal and State Agencies
Other Federal and State Agencies
U.S. Department of AgricultureNatural Resources ConservationService
Federal Building2110 West Park CourtSuite CChampaign, IL 61821(217)398-5212
NFIP State Coordinator
Mr. Michael Lene, SecretaryIllinois Department of Transportation2300 S. Dirksen ParkwaySpringfield, IL 62764(217) 728-5597
INDIANA
Department of Natural Resources608 State Office Building W-256402 West Washington StreetIndianapolis, IN 46204-2748(317) 232-4020
U.S. Geological SurveyDistrict ChiefWater Resources Division5957 Lakeside BoulevardIndianapolis, IN 46278(317) 290-3333
U.S. Department of AgricultureNatural Resources ConservationService
6013 Lakeside BoulevardIndianapolis, IN 46275(317) 290-3030
NFIP State Coordinator
Mr. James B. Ridenour, DirectorIndiana Department of NaturalResources
608 State Office BuildingIndianapolis, IN 46204(317) 232-4020
IOWA
Iowa Department of Natural ResourcesWallace State Office BuildingDes Moines, IA 50319-0034(515) 281-5385
U.S. Geological SurveyDistrict ChiefWater Resources DivisionP.O. Box 1230Iowa City, IA 52244-1230
(Street Address:Federal Building, Room 269400 South Clinton Street)(319) 337-4191
U.S. Department of AgricultureNatural Resources ConservationService
Wallace BuildingDes Moines, IA 50319(515) 284-5851
NFIP State Coordinator
Mr. Larry Wilson, DirectorIowa Department of Natural ResourcesWallace State Office BuildingDes Moines, IA 50319(515) 281-5385
KANSAS
Division of Water ResourcesKansas State Board of Agriculture901 South Kansas Avenue, 2nd FloorTopeka, KS 66612-1283(913) 296-3717
U.S. Geological SurveyDistrict ChiefWater Resources Division4821 Quail Crest PlaceLawrence, KS 66049(913) 842-9901
U.S. Department of AgricultureNatural Resources ConservationService
P.O. Box 600760 South BroadwaySalina, KS 67401(913) 823-4500
NFIP State Coordinator
Mr. David L. Pope, P.E.Chief Engineer & DirectorKansas State Board of AgricultureDivision of Water Resources901 S. Kansas, 2nd FloorTopeka, KS 66612-1283(913) 296-3717
A3-7

Appendix 3 - continued
Federal Emergency Management Agency Officesand Other Federal and State Agencies
Other Federal and State Agencies
KENTUCKY
Kentucky Departmentof Natural Resources
Division of WaterFort Boone Plaza14 Reilly RoadFrankfort, KY 40601(502) 564-3410
U.S. Geological SurveyDistrict ChiefWater Resources Division2301 Bradley AvenueLouisville, KY 40217(502) 582-5241
U.S. Department of AgricultureNatural Resources ConservationService
771 Corporate Drive, Suite 110Lexington, KY 40503(606) 224-7350FTS 355-2749
NFIP State Coordinator
Mr. Jack Wilson, DirectorKentucky Division of Water18 Reilly RoadFort Boone PlazaFrankfort, KY 40601(502) 564-3410
LOUISIANA
Louisiana Department ofUrban and Community Affairs
P.O. Box 94455, Capitol StationBaton Rouge, LA 70804(504) 342-9794
U.S. Geological SurveyDistrict ChiefWater Resources DivisionP.O. Box 66492Baton Rouge, LA 70896(Street Address:6554 Florida BoulevardBaton Rouge, LA 70806)(504) 389-0281
U.S. Department of AgricultureNatural Resources ConservationService
3636 Government StreetAlexandria, LA 71301(318) 487-8094
NFIP State Coordinator
General Jude W. P. Patlin, SecretaryLouisiana Department of Transportation & Development
P.O. Box 94245Baton Rouge, LA 70804-9245(504) 379-1200
MAINE
Maine State Planning OfficeState House Station 38184 State StreetAugusta, ME 04333(207) 287-3261
U.S. Geological SurveyHydrologist-in-ChargeMaine OfficeWater Resources Division26 Ganneston DriveAugusta, ME 04330(207) 622-8208
U.S. Department of AgricultureNatural Resources ConservationService
USDA BuildingUniversity of Maine5 Godfrey DriveOrono, ME 04473(207) 866-7241
NFIP State Coordinator
Mr. Michael W. Aube, CommissionerDepartment of Economic andCommunity Development
State House Station 59State StreetAugusta, ME 04333(207) 287-2656
MARYLAND
Maryland State ResourcesAdministration
Tawes State Office Building, D-2501 Taylor AvenueAnnapolis, MD 21401(410) 974-3041
U.S. Geological SurveyDistrict ChiefWater Resources Division208 Carroll Building8600 La Salle RoadTowson, MD 21286(410) 828-1535
A3-8

Appendix 3 - continued
Federal Emergency Management Agency Officesand Other Federal and State Agencies
Other Federal and State Agencies
U.S. Department of AgricultureNatural Resources ConservationService
339 Busch's Frontage RoadSuite 301Annapolis, MD 21401-5534(410) 757-0861
NFIP State Coordinator
Ms. Catherine Pieper StevensonDirector, Maryland Water ResourcesAdministration
Tawes State Office Building D-2Annapolis, MD 21401(301) 974-3896
MASSACHUSETTS
Massachusetts WaterResources Commission
State Office Building100 Cambridge StreetBoston, MA 02202(617) 727-3267
U.S. Geological SurveyDistrict ChiefWater Resources Division28 Lord RoadMarlborough, MA 01752(508) 485-6360
U.S. Department of AgricultureNatural Resources ConservationService
451 West StreetAmherst, MA 01002(413) 253-4350
NFIP State Coordinator
Mr. Peter C. Webber, CommissionerMassachusetts Department ofEnvironmental Management
State Office Building100 Cambridge StreetBoston, MA 02202(617) 727-3180 x600
MICHIGAN
Engineering WaterManagement Commission
Michigan Department ofNatural Resources
P.O. Box 30028Lansing, MI 48909(517) 373-3930
U.S. Geological SurveyDistrict ChiefWater Resources Division6520 Mercantile Way, Suite 5Lansing, MI 48910(517) 887-8903
U.S. Department of AgricultureNatural Resources ConservationService
Room 1011405 S. Harrison RoadEast Lansing, MI 48823(517) 337-6701
NFIP State Coordinator
Mr. Roland Harms, DirectorMichigan Department of NaturalResources
Land and Water Management DivisionP.O. Box 30028Lansing, MI 48909(517) 373-3930
MINNESOTA
Flood Plains/ShorelineManagement Section
Division of WatersDepartment of Natural Resources500 Lafayette Road, Box 30St. Paul, MN 55515-4032(612) 297-2405
U.S. Geological SurveyDistrict ChiefWater Resources Division2280 Woodale RoadMoundsville, MN 55112(612) 783-3100
U.S. Department of AgricultureNatural Resources ConservationService
600 Farm Credit Building375 Jackson StreetSt. Paul, MN 55101(612) 290-3675
NFIP State Coordinator
Mr. Ronald Nargang, DirectorMinnesota Department of NaturalResources
Division of Water500 LaFayette Road, Box 32St. Paul, MN 55515-0432(612) 296-4800
A3-9

Appendix 3 - continued
Federal Emergency Management Agency Officesand Other Federal and State Agencies
Other Federal and State Agencies
MISSISSIPPI
Mississippi Research andDevelopment Center
3825 Ridgewood RoadJackson, MI 39211(601) 982-6376
U.S. Geological SurveyDistrict ChiefWater Resources DivisionFederal Office Building, Suite 710100 West Capitol StreetJackson, MS 39269(601) 965-4600
U.S. Department of AgricultureNatural Resources ConservationService
100 W. CapitolSuite 1321Federal BuildingJackson, MS 39269(601) 969-5205
NFIP State Coordinator
Mr. J. E. Maher, DirectorMississippi Emergency ManagementAgency
1410 Riverside DriveP.O. Box 4501Jackson, MS 39216(601) 352-9100
MISSOURI
Department of Natural ResourcesP.O. Box 176205 Jefferson StreetJefferson City, MO 65102(314) 751-4422
U.S. Geological SurveyDistrict ChiefWater Resources Division1400 Independence Road,(Mail Stop) 200
Rolla, MO 65401(314) 341-0824
U.S. Department of AgricultureNatural Resources ConservationService
601 Business Loop70 West Parkdale Center, Suite 250Columbia, MO 65202(314) 876-0903
NFIP State Coordinator
DirectorMissouri Department of NaturalResources
101 N. Jefferson StreetP.O. Box 176Jefferson City, MO 65102(314) 751-4422
MONTANA
Montana Department of NaturalResources and Conservation
1520 East Sixth AvenueHelena, MT 59620(406) 444-6646
U.S. Geological SurveyFederal Building, Room 428Drawer 10076301 South Park AvenueHelena, MT 59626-0076(406) 449-5302
U.S. Department of AgricultureNatural Resources ConservationService
10 E. BabcockRoom 443Bozeman, MT 59715(406) 587-6811
NFIP State Coordinator
Mr. Mark Simonich, DirectorMontana Department of NaturalResources and Conservation
1520 East 6th Ave.Helena, MT 59620(406) 444-6699
NEBRASKA
Nebraska Natural ResourcesCommission
P.O. Box 94876Lincoln, NE 68509-4876(402) 471-2081
U.S. Geological SurveyDistrict ChiefWater Resources DivisionFederal Building, Room 406100 Centennial Mall NorthLincoln, NE 68508(402) 437-5082
A3-10

Appendix 3 - continued
Federal Emergency Management Agency Officesand Other Federal and State Agencies
Other Federal and State Agencies
U.S. Department of AgricultureNatural Resources ConservationService
Federal Building, Rm. 345U.S. Courthouse100 Centennial Mall, NorthP.O. Box 82502Lincoln, NE 68508-3866(402) 437-5300
NFIP State Coordinator
Mr. Dayle Williamson, DirectorNebraska Natural ResourcesCommission
P.O. Box 94876Lincoln, NE 68509(402) 471-2081
NEVADA
Division of Emergency ManagementState of NevadaCapitol ComplexCarson City, NV 89710(702) 885-4240
U.S. Geological SurveyHydrologist-in-ChargeNevada OfficeWater Resources DivisionFederal Building, Room 224705 North Plaza StreetCarson City, NV 89701(702) 882-1388
U.S. Department of AgricultureNatural Resources ConservationService
5301 Longway LaneBuilding F, Suite 201Reno, NV 89511(702) 784-5863
NFIP State Coordinator
Mr. David McNinchNevada Division of EmergencyManagement
2525 S. CarsonCapitol ComplexCarson City, NV 89710(702) 885-4240
NEW HAMPSHIRE
Office of Emergency ManagementState Office Park South107 Pleasant StreetConcord, NH 03301(603) 271-2231
U.S. Geological SurveyHydrologist-in-ChargeNew Hampshire OfficeWater Resources Division525 Clinton Street, RFD 2Bow, NH 03304(603) 225-4681
U.S. Department of AgricultureNatural Resources ConservationService
Federal Building2 Madbury RoadDurham, NH 03824(603) 868-7581
NFIP State Coordinator
Col. George L. Iverson, DirectorGovernor's Office ofEmergency Management
State Office Park South107 Pleasant StreetConcord, NH 03301(603) 271-2231
NEW JERSEY
New Jersey Department ofEnvironmental Protection and Energy
Flood Plain Management SectionCN 419
Trenton, NJ 08625-0419(609) 292-2296
New Jersey Department ofEnvironmental Protection and Energy
Division of Natural and HistoricResources Engineering andConstructionElement
Floodplain Management SectionStation Plaza 5501 East State Street, 1st FloorTrenton, New Jersey 08625-0419(609) 292-2296
A3-11

Appendix 3 - continued
Federal Emergency Management Agency Officesand Other Federal and State Agencies
Other Federal and State Agencies
U.S. Geological SurveyDistrict ChiefWater Resources DivisionMountain View Office Park,Suite 206
810 Bear Tavern RoadWest Trenton, NJ 08628(609) 771-0065
U.S. Department of AgricultureNatural Resources ConservationService
1370 Hamilton StreetSomerset, NJ 08873(908) 725-3848
NFIP State Coordinator
Mr. Scott A. Weiner, CommissionerNew Jersey Department ofEnvironmental Protection and Energy
CN 402Trenton, NJ 08625(609) 292-2885
NEW MEXICO
New Mexico State Engineer's OfficeBataan Memorial BuildingP.O. Box 25102Santa Fe, NM 87504-5102(505) 827-6091
U.S. Geological SurveyDistrict ChiefWater Resources Division4501 Indian School Road, NESuite 200Albuquerque, NM 87110(505) 262-5300
U.S. Department of AgricultureNatural Resources ConservationService
P.O. Box 2007517 Gold Avenue, SW., Rm. 301Albuquerque, NM 87102(505) 766-3277
NFIP State Coordinator
Mr. Keith LoughOffice of Emergency Planningand CoordinationDepartment of Public SafetyP.O. Box 1628Santa Fe, NM 87503(505) 827-6091
NEW YORK
Flood Protection BureauNew York Department ofEnvironmental Conservation
50 Wolf RoadAlbany, NY 12233-3507(518) 457-3157
U.S. Geological SurveyDistrict ChiefWater Resources Division445 Broadway, Room 343Albany, NY 12201(518) 472-3107
U.S. Department of AgricultureNatural Resources ConservationService
441 South Salina Street5th floor, Suite 354Syracuse, NY 13202(315) 477-6508FTS 950-5521
NFIP State Coordinator
Mr. James F. Kelly, DirectorFlood Protection BureauNew York State Department ofEnvironmental Conservation
50 Wolf Road, Room 330Albany, NY 12233-3507(518) 457-3157
NORTH CAROLINA
North Carolina Department ofCrime Control and Public Safety
Division of Emergency Management116 West Jones StreetRaleigh, NC 27603(919) 733-3867
U.S. Geological SurveyDistrict ChiefWater Resources DivisionP.O. Box 307283916 Sunset Ridge RoadRaleigh, NC 27622(919) 856-4510
U.S. Department of AgricultureNatural Resources ConservationService
4405 Bland AvenueSuite 205Raleigh, NC 27609(919) 790-2888
A3-12
Appendix 3 - continued
Federal Emergency Management Agency Officesand Other Federal and State Agencies
Other Federal and State Agencies
NFIP State Coordinator
Mr. Joseph F. Myers, DirectorNorth Carolina Division ofEmergency Management
116 West Jones StreetRaleigh, NC 27603(919) 733-3867
NORTH DAKOTA
State Water Commission900 East BoulevardBismarck, ND 58505(701) 224-2750
U.S. Geological SurveyDistrict ChiefWater Resources Division821 East Interstate AvenueBismarck, ND 58501(701) 250-4601
U.S. Department of AgricultureNatural Resources ConservationService
Federal Building, Rm. 270Rosser Ave. & Third St.P.O. Box 1458Bismarck, ND 58502(701) 250-4435
NFIP State Coordinator
Mr. David A. SprycnzynatykState EngineerNorth Dakota State Water Commission900 E. BoulevardBismark, ND 58505(701) 224-4940
OHIO
Ohio Department of Natural ResourcesFlood Plain Planning UnitDivision of Water1939 Fountain SquareColumbus, OH 43224(614) 265-6750
U.S. Geological SurveyDistrict ChiefWater Resources Division975 West Third AvenueColumbus, OH 43212(614) 469-5553
U.S. Department of AgricultureNatural Resources ConservationService
Room 522Federal Building200 North High StreetColumbus, OH 43215(614) 469-6962
NFIP State Coordinator
Mrs. Frances S. Buchholzer, DirectorOhio Department of NaturalResources
Fountain SquareColumbus, OH 43224(614) 264-6875
OKLAHOMA
Oklahoma Water Resources Board600 North Harvey AvenueP.O. Box 150Oklahoma City, OK 73101-0150(405) 231-2500
U.S. Geological SurveyDistrict ChiefWater Resources Division202 NW Sixty Sixth, Building 7Oklahoma City, OK 73116(405) 843-7570
U.S. Department of AgricultureNatural Resources ConservationService
100 USDASuite 203Stillwater, OK 74074(405) 742-1200
NFIP State Coordinator
Mrs. Patricia P. EatonExecutive DirectorOklahoma Water Resources Board600 N. HarveyOklahoma City, OK 73101(405) 231-2500
OREGON
Department of Land Conservationand Development
1175 Court Street NortheastSalem, OR 97310(503) 373-0050
A3-13

Appendix 3 - continued
Federal Emergency Management Agency Officesand Other Federal and State Agencies
Other Federal and State Agencies
U.S. Geological SurveyHydrologist-in-ChargeOregon OfficeWater Resources Division847 Northeast 19th Avenue,Suite 300
Portland, OR 97323(503) 251-3200
U.S. Department of AgricultureNatural Resources ConservationService
2115 SE MorrisonPortland, OR 97214(503) 231-2270
NFIP State Coordinator
Mr. Richard BennerOregon Department of LandConservation and Development
1175 Court Street, N.E.Salem, OR 97310(503) 378-4928
PENNSYLVANIA
Department of Community Affairs317 Forum BuildingHarrisburg, PA 17120(717) 787-7160U.S. Geological SurveyDistrict ChiefWater Resources Division840 Market StreetHarrisburg, PA 17043-1586(717) 730-6900
Ms. Karen A. Miller, SecretaryPennsylvania Department ofCommunity Affairs
P.O. Box 155317 Forum BuildingHarrisburg, PA 17120(717) 787-7160
U.S. Department of AgricultureNatural Resources ConservationService
One Credit Union PlaceSuite 340Harrisburg, PA 17110-2993
NFIP State Coordinator
Federal BuildingU.S. Courthouse805 985Federal Square StationHarrisburg, PA 17108
(717) 782-2202FTS 590-2202
PUERTO RICO
Puerto Rico Planning Board1492 Ponce De Leon Avenue, Suite 417Santurce, Puerto Rico 00907(809) 729-6920
U.S. Geological SurveyDistrict ChiefWater Resources DivisionGPO Box 4424San Juan, PR 00936(Street Address:GSA Center, Building 652Highway 28, Pueblo Viejo)(809) 783-4660
U.S. Department of AgricultureNatural Resources ConservationService
Federal Building, Rm. 639Chardon AvenueGPO Box 4868San Juan, PR 00936(809) 753-4206
NFIP State Coordinator
Ms. Norma N. Burgos, PresidentPuerto Rico Planning BoardP.O. Box 41119San Juan, PR 00940-9985(809) 727-4444
RHODE ISLAND
Statewide Planning ProgramRhode Island Office of State Planning1 Capitol HillProvidence, RI 02908(401) 277-2656
U.S. Geological SurveyHydrologist-in-ChargeRhode Island OfficeWater Resources Division275 Promanade Street, Suite 150Providence, RI 02908(401) 331-9050
A3-14

Appendix 3 - continued
Federal Emergency Management Agency Officesand Other Federal and State Agencies
Other Federal and State Agencies
U.S. Department of AgricultureNatural Resources ConservationService
40 Quaker Lane, Suite 46West Warwick, RI 02886(401) 828-1300
NFIP State Coordinator
Mr. Daniel W. VarinAssociate DirectorDepartment of TransportationOffice of Systems Planning1 Capitol HillProvidence, RI 02908-5872(401) 277-6578
SOUTH CAROLINA
South Carolina Water and NaturalResources Commission
1201 Main Street, Suite 1100Columbia, SC 29201(803) 737-0800
U.S. Geological SurveyDistrict ChiefWater Resources DivisionStevenson Center, Suite 129720 Gracern RoadColumbia, SC 29210-7651(803) 750-6100
U.S. Department of AgricultureNatural Resources ConservationService
Federal Bldg., Rm. 9501835 Assembly St.Columbia, SC 29201(803) 765-5681
NFIP State Coordinator
Mr. Danny Johnson, DirectorSurface Water DivisionSouth Carolina Water ResourcesCommission
1201 Main Street, Suite 1100Columbia, SC 29201(803) 737-0800
SOUTH DAKOTA
Disaster Assistance ProgramsEmergency and Management Services500 East CapitolPierre, SD 57501(605) 773-3231
U.S. Geological SurveyDistrict ChiefWater Resources DivisionFederal Building, Room 317200 Fourth Street SouthwestHuron, SD 57350-2469(605) 353-7176
U.S. Department of AgricultureNatural Resources ConservationService
Federal Building, Rm. 203200 4th Street, SWHuron, SD 57350(605) 353-1092
NFIP State Coordinator
Mr. Gary N. Whitney, DirectorSouth Dakota Department ofMilitary and Veteran Affairs
Division of Emergency andDisaster Services
500 E. CapitolPierre, SD 57501(605) 773-3231
TENNESSEE
Tennessee Department of Economicand Community Development
Division of Community Development320 Sixth Avenue North, Sixth FloorNashville, TN 37243-0405(615) 741-1888
U.S. Geological SurveyDistrict ChiefWater Resources Division810 Broadway, Suite 500Nashville, TN 37203(615) 736-5424
U.S. Department of AgricultureNatural Resources ConservationService
U.S. Courthouse, Rm. 675801 Broadway StreetNashville, TN 37203(615) 736-5471FTS 852-5471
A3-15

Appendix 3 - continued
Federal Emergency Management Agency Officesand Other Federal and State Agencies
Other Federal and State Agencies
NFIP State Coordinator
Mr. Michael McGuireAssistant CommissionerTennessee Department of Economic andCommunity Development
320 Sixth AvenueNorth Nashville, TN 37219-5408(615) 741-2211
TEXAS
Texas Natural ResourceConservation Commission
P.O. Box 13087Capitol StationAustin, TX 78711-3087(512) 239-1000
U.S. Geological SurveyDistrict ChiefWater Resources Division8011 Cameron RoadAustin, TX 78754(512) 873-3000
U.S. Department of AgricultureNatural Resources ConservationService
Federal Bldg.101 S. Main StreetTemple, TX 76501(817) 774-1214
NFIP State Coordinator
Mr. Jesus GalzaExecutive DirectorTexas Water CommissionP.O. Box 13087Capitol StationAustin, TX 78711-3087(512) 463-7791
UTAH
Office of ComprehensiveEmergency Management
State Office Building, Room 1110Salt Lake City, UT 84114(801) 538-3400
U.S. Geological SurveyDistrict ChiefWater Resources Division2363 Foothill DriveSalt Lake City, UT 84109(801) 467-7970
U.S. Department of AgricultureNatural Resources ConservationService
Federal Building125 S. State StreetP.O. Box 11350Salt Lake City, UT 84147(801) 524-5068
NFIP State Coordinator
Ms. Lorayne Frank, DirectorDepartment of Public SafetyDivision of Comprehensive EmergencyManagement
State Office Building, Room 1110450 North MainSalt Lake City, UT 84114(801) 538-3400
VERMONT
Agency of Natural ResourcesDepartment of EnvironmentalConservation
Water Quality Division103 South Main Street - 10NWaterbury, VT 05671-0408(802) 241-3777
U.S. Geological SurveyDistrict ChiefWater Resources DivisionP.O. Box 628Montpelier, VT 05602(802) 828-4479
U.S. Department of AgricultureNatural Resources ConservationService
69 Union StreetWinooski, VT 05404(802) 951-6795
NFIP State Coordinator
Mr. Chuck Clarde, SecretaryAgency of Natural ResourcesCenter Building103 South Main StreetWaterbury, VT 05671-0301(802) 244-7347
A3-16

Appendix 3 - continued
Federal Emergency Management Agency Officesand Other Federal and State Agencies
Other Federal and State Agencies
VIRGIN ISLANDS
Virgin Islands of the U.S.Virgin Islands Planning Departmentand Natural Resources
Charlotte AmalieNisky Center, Suite 231St. Thomas, VI 00802(809) 774-3320
U.S. Geological SurveyDistrict ChiefWater Resources DivisionGPO Box 4424San Juan, PR 00936(Street Address:GSA Center, Building 652Highway 28, Pueblo Viejo)(809) 783-4660
NFIP State Coordinator
Mr. Roy E. Adams, CommissionerVirgin Islands Department ofPlanning and Natural Resources
Suite 231, Nisky CenterCharlotte AmalieSt. Thomas, VI 00802(809) 774-3320
VIRGINIA
Virginia State Department ofEnvironmental Quality
4900 Cot RoadGlen Allen, VA 23060(804) 527-5000
U.S. Geological SurveyHydrologist-in-ChargeVirginia OfficeWater Resources Division3600 West Broad StreetRoom 606Richmond, VA 23230(804) 771-2427
U.S. Department of AgricultureNatural Resources ConservationService
1606 Santa Rosa RoadSuite 209Richmond, VA 23229(804) 287-1689
NFIP State Coordinator
Mr. Roland B. Geddes, DirectorDepartment of Conservation andHistoric Resources
203 Governor Street, Suite 206Richmond, VA 23219(804) 786-4356
WASHINGTON
Department of EcologyP.O. Box 47600Olympia, WA 98504-7600(206) 407-6000
U.S. Geological SurveyDistrict ChiefWater Resources Division1201 Pacific Avenue, Suite 600Tacoma, WA 98402(206) 593-6510
U.S. Department of AgricultureNatural Resources ConservationService
316 Boone AvenueSuite 456Spokane, WA 99201(5O9) 353-2336
NFIP State Coordinator
Mr. Chuck ClarkWashington Department of EcologyP.O. Box 47600Olympia, WA 98504-7600(206) 459-6168
WEST VIRGINIA
West Virginia Office ofEmergency ServicesRoom EB-80, Capitol BuildingCharleston, WV 25305(304) 348-5380
U.S. Geological SurveyDistrict ChiefWater Resources Division11 Dunbar StreetCharleston, WV 25301(304) 347-5130
U.S. Department of AgricultureNatural Resources ConservationService
75 High Street, Rm. 301Morgantown, WV 26505(304) 291-4151
A3-17

Appendix 3 - continued
Federal Emergency Management Agency Officesand Other Federal and State Agencies
Other Federal and State Agencies
NFIP State Coordinator
Mr. Carl Bradford, DirectorWest Virginia Office ofEmergency Services
Room EBI-80Capitol BuildingCharleston, WV 25305(304) 348-5380
WISCONSIN
Department of Natural ResourcesDam Safety/FloodplainManagement Section
P.O. Box 7921Madison, WI 53707(608) 266-2621
U.S. Geological SurveyDistrict ChiefWater Resources CenterUniversity of Wisconsin/Madison1975 Willard DriveMadison, WI 53706-4042(608) 262-3577
U.S. Department of AgricultureNatural Resources ConservationService
6515 Watts RoadSuite 200Madison, WI 53719(608) 264-5341
NFIP State Coordinator
Mr. Carroll D. Besandy, SecretaryWisconsin Department of NaturalResources
P.O. Box 7921Madison, WI 53707(608) 266-2121
WYOMING
Wyoming Emergency Management AgencyP.O. Box 1709Cheyenne, WY 82003-1709(307) 777-4900
U.S. Geological SurveyDistrict ChiefWater Resources DivisionP.O. Box 1125Cheyenne, WY 82003(Street Address:2617 East Lincoln WayCheyenne, WY 82001(307) 772-2153
U.S. Department of AgricultureNatural Resources ConservationService
Federal Office Building100 East "B" StreetCasper, WY 82601(307) 261-5231
NFIP State Coordinator
Mr. Joe Daly, CoordinatorWyoming Emergency ManagementAgency
P.O. Box 1709Cheyenne, WY 82003(307) 777-7566
A3-18

Appendix 3 - continued
Federal Emergency Management Agency Officesand Other Federal and State Agencies
U.S. Army Corps of Engineers
U.S. Army Corps of EngineersHeadquarters20 Massachusetts Ave., NWWashington, D.C. 20314-1000Attn: CECW-PF202/272-0169
U.S. Army Corps of EngineersLower Miss. Valley DivisionP.O. Box 80Vicksburg, MS 39181-0080Attn: CELMV-PD-CM601/634-5827
U.S. Army Corps of EngineersMemphis District167 North Main Street, B-202Memphis, TN 38103-1894Attn: CELMM-PD-M901/544-3968
U.S. Army Corps of EngineersNew Orleans DistrictP.O. Box 60267New Orleans, LA 70160-0267Attn: CELMN-PD-FG504/865-1121
U.S. Army Corps of EngineersSt. Louis District1222 Spruce StreetSt. Louis, MO63103-2833Attn: CELMS-PD-M314/331-8483
U.S. Army Corps of EngineersVicksburg District2101 North Frontage RoadVicksburg, MS 39180-0060Attn: CELMK-PD-FS601/631-5416
U.S. Army Corps of EngineersMissouri River Division12565 West Center RoadOmaha, NE 68104-3869Attn: CEMRD-PD-F402/221-7273
U.S. Army Corps of EngineersKansas City District700 Federal Building KansasCity, MO 64106-2896Attn: CEMRK-PD-P816/426-3674
U.S. Army Corps of EngineersOmaha District215 North 17th StreetOmaha, NE 68102-4978Attn: CEMRO-PD-F402/221-4596
U.S. Army Corps of EngineersNorth Atlantic Division90 Church StreetNew York, NY 10007-2979Attn: CENAD-PL-FP212/264-7482
U.S. Army Corps ot EngineersBaltimore DistrictSupervisor of Baltimore HarborP.O. Box 1715Baltimore, MD 21201-1715Attn: CENAB-PL-B410/962-7608
U.S. Army Corps of EngineersNew York District, Planning Division,Floodplain Management Section26 Federal PlazaNew York, NY 10278Attn: CENAN-PL-FP212/264-8870
U.S. Army Corps of EngineersNorfolk DistrictSupervisor of Norfolk Harbor803 Front StreetNorfolk, VA 23510-1096Attn: CENAO-PL-FP804/441-7779
U.S. Army Corps of EngineersPhiladelphia DistrictU.S. Customs House2nd & Chestnut StreetsPhiladelphia, PA 19106-2991Attn: CENAP-PL-F215/656-6516
U.S. Army Corps of EngineersNorth Central Division111 North Canal Street, 14th FloorChicago, IL 60606Attn: CENCD-PD-FP312/353-1279
A3-19

Appendix 3 - continued
Federal Emergency Management Agency Officesand Other Federal and State Agencies
U.S. Army Corps of Engineers
U.S. Army Corps of Engineers U.S. Army Corps of EngineersBuffalo District, Planning Division, Portland DistrictFloodplain Management Section1776 Niagara StreetBuffalo, NY 14207-3199Attn: CENCB-PD-FP716/879-4104
U.S. Army Corps of EngineersChicago District111 North Canal Street14th FloorChicago, IL 60606Attn: CENCC-PD-R312/353-6400
U.S. Army Corps of EngineersDetroit District477 Michigan AvenueDetroit, MI 48226Attn: CENCE-PD-PF313/226-6773
U.S. Army Corps of EngineersRock Island DistrictP.O. Box 2004Clock Tower BuildingRock Island, IL 61204-2004Attn: CENCR-PD-F309/788-4750
U.S. Army Corps of EngineersSt. Paul District190 Phipps Street EastSt. Paul, MN 55101-1638Attn: CENCS-PD-FS612/290-5200
U.S. Army Corps of EngineersNew England Division424 Trapelo RoadWaltham, MA 02254-9149Attn: CENED-PL-B617/647-8111
U.S. Army Corps of EngineersNorth Pacific Division333 Southwest 1st AvenuePortland, OR 97204Attn: CENPD-PL-FS5O3/326-6021
U.S. Army Corps of EngineersAlaska DistrictP.O. Box 898Anchorage, AK 99506-0898Attn: CENPA-EN-PL-FP907/753-2504
P.O. Box 2946Portland, OR 97208-2946Attn: CENPP-PL-CF503/326-6411
U.S. Army Corps of EngineersSeattle DistrictP.O. Box 3755Seattle, WA 98124-2255Attn: CENPS-EN-HH206/764-3660
U.S. Army Corps of EngineersWalla Walla DistrictBldg. 602 City-County AirportWalla Walla, WA 99362-9265Attn: CENPW-PL-FP509/522-6589
U.S. Army Corps of EngineersOhio River DivisionP.O. Box 59Louisville, KY 40201-0059Attn: CEORD-PD-J502/582-5782
U.S. Army Corps of EngineersHuntington District502 8th StreetHuntington,WV 25701-2070Attn: CEORH-PD-S304/529-5644
U.S. Army Corps of EngineersLouisville DistrictP.O. Box 59Louisville, KY 40201-0059Attn: CEORL-PD-S502/582-5742
U.S. Army Corps of EngineersNashville DistrictP.O. Box 1070Nashville, TN 37202-1070Attn: CEORN-ED-P615/736-5055
U.S. Army Corps of EngineersPittsburgh DistrictWilliam S. Moorehead Fed. Bldg.1000 Liberty AvenuePittsburgh, PA 15222-4186Attn: CEORP-PD-J412/644-6924
A3-20

Appendix 3 - continued
Federal Emergency Management Agency Officesand Other Federal and State Agencies
U.S. Army Corps of Engineers
U.S. Army Corps of EngineersPacific Ocean DivisionFt. Shafter, HI 96858-5440Attn: CEPOD-ED-PH808/438-7009
U.S. Army Corps of EngineersCharleston District, P.O. Box 919Charleston, SC 29402-0919Attn: CESAC-EN-PH803/727-4263
U.S. Army Corps of EngineersSouth Atlantic Division611 South Cobb DriveMarietta, GA 30060Attn: CESAD-PD-A404/421-5296
U.S. Army Corps of EngineersJacksonville DistrictP.O. Box 4970Jacksonville, FL 32232-0019Attn: CESAJ-PD-FP904/232-2234
U.S. Army Corps of EngineersMobile DistrictP.O. Box 2288Mobile, AL 36628-0001Attn: CESAM-PD-P205/694-3879
U.S. Army Corps of EngineersSavannah DistrictP.O. Box 889Savannah, GA 31402-0889Attn: CESAS-PD-F912/652-5822
U.S. Army Corps of EngineersWilmington DistrictP.O. Box 1890Wilmington, NC 28402-1890Attn: CESAW-PD-F910/251-4822
U.S. Army Corps of EngineersSouth Pacific Division, Room 720630 Sansome StreetSan Francisco, CA 94111-2206Attn: CESPD-PD-P415/705-2427
U.S. Army Corps of EngineersLos Angeles DistrictP.O. Box 2711Los Angeles, CA 90053-2325Attn: CESPL-PD-WF213/894-5450
U.S. Army Corps of EngineersSacramento District1325 G StreetSacramento, CA 95814-4794Attn: CESPK-PD-F916/557-6700
U.S. Army Corps of EngineersSan Francisco District211 Main StreetSan Francisco, CA 9410S-1905Attn: CESPN-PE-W415/744-3029
U.S. Army Corps of EngineersSouthwestern Division1114 Commerce StreetDallas, TX 75242-0216Attn: CESWD-PL-M214/767-2310
U.S. Army Corps of EngineersAlbuquerque DistrictP.O. Box 1580Albuquerque, NM 87103-1580Attn: CESWA-ED-PH505/766-2635
U.S. Army Corps of EngineersFort Worth DistrictP.O. Box 17300Fort Worth, TX 76102-0300Attn: CESWF-PL-F817/334-3207
U.S. Army Corps of EngineersGalveston DistrictP.O. Box 1229Galveston, TX 77553-1229Attn: CESWG-PL-P409/766-3023
U.S. Army Corps of EngineersLittle Rock DistrictP.O. Box 867Little Rock, AR 72203-0867Attn: CESWL-PL-F501/378-5611
U.S. Army Corps of EngineersTulsa DistrictP.O. Box 61Tulsa, OK 74121 0061Attn: CESWT-PL-GF918/581-7896
A3-21

Appendix 3 - continued
Federal Emergency Management Agency Officesand Other Federal and State Agencies
River Basin Commissions
Delaware River Basin Commission25 State Police DriveBox 7360West Trenton, NJ 08628609/883-9500
Susquehanna River Basin Commission1721 North Front StreetHarrisburg, PA717/238-0422
A3-22

Appendix 4
State Hydrology Reports
ALABAMA
Olin, D.A. and Bingham, R.H., 1982, Synthesized flood frequency of urban streamsin Alabama: U.S. Geological Survey Water-Resources Investigations 82-683.
Olin, D.A., 1984, Magnitude and frequency of floods in Alabama: U.S. GeologicalSurvey Water-Resources Investigations 84-4191.
ALASKA
Lamke, R.D., 1978, Flood characteristics of Alaskan streams: U.S. GeologicalSurvey Water-Resources Investigations 78-129.
ARIZONA
Eychaner, J.H., 1984, Estimation of magnitude and frequency of floods in PimaCounty, Arizona, with comparisons of alternative methods: U.S. Geological SurveyWater-Resources Investigations 84-4142.
ARKANSAS
Neely, B.L., Jr., 1986, Magnitude and frequency of floods in Arkansas: U.S.Geological Survey Water-Resources Investigations 86-4335.
CALIFORNIA
Waananen, A.O., and Crippen, J.R., 1977, Magnitude and frequency of floods inCalifornia: U.S. Geological Survey Water-Resources Investigations 77-21 (PB-272510/AS).
COLORADO
Hedman, E.R., Moore, D.O. and Livingston, R.K., 1972, Selected streamflowcharacteristics as related to channel geometry of perennial streams in Colorado:U.S. Geological Survey Open-File Report.
Kircher, J.E., Choquette, A.F., and Richter, B.D., 1985, Estimation of naturalstreamflow characteristics in Western Colorado: U.S. Geological Survey Water-Resources Investigations 85-4086.
Livingston, R.K., 1980, Rainfall-runoff modeling and preliminary regional floodcharacteristics of small rural watersheds in the Arkansas River Basin inColorado: U.S. Geological Survey Water-Resources Investigations 80-112 (NTIS).
Livingston, R.K., and Minges, D.R., 1987, Techniques for estimating regionalflood characteristics of small rural watersheds in the plains regions of easternColorado: U.S. Geological Survey Water-Resources Investigations 87-4094.
McCain, J.R., and Jarrett, R.D., 1976, Manual for estimating floodcharacteristics of natural flow streams in Colorado: Colorado Water ConservationBoard, Technical Manual No. 1.
A4-1

Appendix 4 - continuedState Hydrology Reports
CONNECTICUT
Weiss, L.A., 1975, Flood flow formula for urbanized and non-urbanized areas ofConnecticut: Watershed Management Symposium of ASCE Irrigation and DrainageDivision, August 11-13, 1975, pp. 658-675.
DELAWARE
Simmons, R.H., and Carpenter, D.H., 1978, Technique for estimating the magnitudeand frequency of floods in Delaware: U.S. Geological Survey Water-ResourcesInvestigations Open-File Report 78-93.
DISTRICT OF COLUMBIA
None listed
FLORIDA
Bridges, W.C., 1982, Technique for estimating the magnitude and frequency offloods on natural-flow streams in Florida: U.S. Geological Survey Water-ResourcesInvestigations Open-File Report 82-4012.
Franklin, M.A., 1984, Magnitude and frequency of floods from urban streams inLeon County, Florida: U.S. Geological Survey Water-Resources Investigations84-4004.
Lopez, M.A., and Woodham, W.M., 1982, Magnitude and frequency of floods on smallurban watersheds in the Tampa Bay area, west-central Florida: U.S. GeologicalSurvey Water-Resources Investigations 82-42.
GEORGIA
Inman, E.J., 1983, Flood-frequency relations for urban streams in metropolitanAtlanta, Georgia: U.S. Geological Survey Water-Resources Investigations83-4203.
Price, M., 1979, Floods in Georgia, magnitude and frequency: U.S. GeologicalSurvey Water-Resources Investigations 78-137 (PB-80 146 244).
HAWAII
Matsuoka, I., 1978, Flow characteristics of streams in Tutuila, American Somoa:U.S. Geological Survey Open-File Report 78-103.
Nakahara, R.H., 1980, An analysis of the magnitude and frequency of floods onOahu, Hawaii: U.S. Geological Survey Water-Resources Investigations 80-45(PB-81 109 902).
A4-2

Appendix 4 - continuedState Hydrology Reports
IDAHO
Harenberg, W.A., 1980, Using channel geometry to estimate flood flows at ungagedsites in Idaho: U.S. Geological Survey Water-Resources Investigations 80-32(PB-81 153 736).
Kjelstrom, L.C., and Moffatt, R.L., 1981, Method of estimating flood-frequencyparameters for streams in Idaho: U.S. Geological Survey Open-File Report 81-909.
Thomas, C.A., Harenburg, W.A., and Anderson, J.M., 1973, Magnitude and frequencyof floods in small drainage basins in Idaho: U.S. Geological Survey Water-Resources Investigations 7-73 (PB-222 409).
ILLINOIS
Allen, H.E., Jr., and Bejcek, R.M., 1979, Effects of urbanization on themagnitude and frequency of floods in northeastern Illinois: U.S. GeologicalSurvey Water-Resources Investigations 79-36 (PB-299 065/AS).
Curtis, G.W., 1987, Technique for estimating flood-peak discharges andfrequencies on rural streams in Illinois: U.S. Geological Survey Water-ResourcesInvestigations 87-4207.
INDIANA
Glatfelter, D.R., 1984, Technique for estimating the magnitude and frequency offloods in Indiana: U.S. Geological Survey Water-Resources Investigations 84-4134.
IOWA
Lara, O., 1978, Effects of urban development on the flood flow characteristics ofWalnut Creek basin, Des Moines metropolitan area, Iowa: U.S. Geological SurveyWater-Resources Investigations 78-11 (PB-284 093/AS).
KANSAS
Clement, R.W., 1987, Floods in Kansas and techniques for estimating theirmagnitude and frequency: U.S. Geological Survey Water-Resources Investigations87-4008.
Hedman, E.R., Kastner, W.M., and Hejl, H.R., 1974, Selected streamflowcharacteristics as related to active-channel geometry of streams in Kansas:Kansas Water Resources Board Technical Report No. 10.
Peek, C.O., and Jordan, P.R., 1978, Determination of peak discharge from rainfallrelations for urbanized basins, Wichita, Kansas: U.S. Geological Survey Open-FileReport 78-974.
KENTUCKY
Choquette, A.F., 1987, Regionalization of peak discharges for streams inKentucky: U.S. Geological Survey Water-Resources Investigations 87-4029.
A4-3

Appendix 4 - continuedState Hydrology Reports
LOUISIANA
Lee, F.N., 1985, Floods in Louisiana, Magnitude and Frequency, Fourth Edition:Department of Transportation and Development, Water Resources Technical ReportNo. 36.
Lowe, A.S., 1979, Magnitude and frequency of floods in small watersheds inLouisiana: Louisiana Department of Transportation and Development, Office ofHighways, Research Study No. 65-2H.
MAINE
Morrill, R.A., 1975, A technique for estimating the magnitude and frequency offloods in Maine: U.S. Geological Survey Open-File Report.
MARYLAND
Carpenter, D.H., 1980, Technique for estimating magnitude and frequency of floodsin Maryland: U.S. Geological Survey Water-Resources Investigations Open-FileReport 80-1016.
MASSACHUSETTS
Wandle, S.W., 1983, Estimating peak discharges and frequencies of small ruralstreams in Massachusetts: U.S. Geological Survey Water-Supply Paper 2214.
MICHIGAN
Holtschlag, D.J., and Croskey, H.M., 1984, Statistical models for estimating flowcharacteristics of Michigan streams: U.S. Geological Survey Water-ResourcesInvestigations 84-4270.
MINNESOTA
Jacques, J.E., and Lorenz, D.L., 1987, Techniques for estimating the magnitudeand frequency of floods in Minnesota: U.S. Geological Survey Water-ResourcesInvestigations 87-4170.
MISSISSIPPI
Colson, B.E., and Hudson, J.W., 1976, Flood frequency of Mississippi streams:Mississippi State Highway Department.
MISSOURI
Becker, L.D., 1986, Techniques for estimating flood-peak discharges for urbanstreams in Missouri: U.S. Geological Survey Water-Resources Investigations Report86-4322.
Hauth, L.D., 1974, A technique for estimating the magnitude and frequency ofMissouri floods: U.S. Geological Survey Open-File Report.
A4-4

Appendix 4 - continuedState Hydrology Reports
MISSOURI continued
Spencer, D.W., and Alexander, T.W., 1978, Techniques for estimating the magnitudeand frequency of floods in St. Louis County, Missouri: U.S. Geological SurveyWater-Resources Investigations 78-139 (PB-298 245/AS).
MONTANA
Omang, R.J., 1983, Mean annual runoff and peak flow estimates based on channelgeometry of streams in southeastern Montana: U.S. Geological Survey Water-Resources Investigations Report 82-4092.
Omang, R.J., Parrett, C., and Hull, J.A., 1986, Methods of estimating magnitudeand frequency of floods in Montana based on data through 1983: U.S. GeologicalSurvey Water-Resources Investigations Report 86-4027.
Parrett, C., 1983, Mean annual runoff and peak flow estimates based on channelgeometry of streams in northeastern and western Montana: U.S. Geological SurveyWater-Resources Investigations Report 83-4046.
Parrett, C., Hull, J.A., and Omang, R.J., 1987, Revised techniques for estimatingpeak discharges from channel width in Montana: U.S. Geological Survey Water-Resources Investigations 87-4121.
NEBRASKA
Beckman, E.W., 1976, Magnitude and frequency of floods in Nebraska: U.S.Geological Survey Water-Resources Investigations 76-109 (PB-260 842/AS).
NEVADA
Moore, D.O., 1974, Estimating flood discharges in Nevada using channel-geometrymeasurements: Nevada State Highway Department Hydrologic Report No. 1.
Moore, D.O., 1976, Estimating peak discharges from small drainages in Nevadaaccording to basin areas within elevation zones: Nevada State Highway DepartmentHydrologic Report No. 3.
NEW HAMPSHIRE
LeBlanc, D.R., 1978, Progress report on hydrologic investigations of smalldrainage areas in New Hampshire--Preliminary relations for estimating peakdischarges on rural, unregulated streams: U.S. Geological Survey Water-ResourcesInvestigations 78-47 (PB-284 127/AS).
NEW JERSEY
Stankowski, S.J., 1974, Magnitude and frequency of floods in New Jersey witheffects of urbanization: New Jersey Department of Environmental ProtectionSpecial Report 38.
Velnick, Anthony J. and Laskowski, Stanley L., 1979, Technique for estimatingdepth of 100-year flood in New Jersey: Open-File Report 79-419.
A4-5

Appendix 4 - continuedState Hydrology Reports
NEW MEXICO
Hejl, H.R., Jr., 1984, Use of selected basin characteristics to estimate meanannual runoff and peak discharges for ungaged streams in drainage basinscontaining strippable coal resources, northwestern New Mexico: U.S. GeologicalSurvey Water-Resources Investigations 84-4264.
Scott, A.G., and Kunkler, J.L., 1976, Flood discharges of streams in New Mexicoas related to channel geometry: U.S. Geological Survey Open-File Report.
Waltmeyer, S.D., 1986, Techniques for estimating flood-flow frequency forunregulated streams in New Mexico: U.S. Geological Survey Water-ResourcesInvestigations 86-4104.
NEW YORK
Lomia, Richard, 1991, Regionalization of flood discharges for rural, unregulatedstreams in New York, excluding Long Island: U.S. Geological Survey Water-Resources Investigations Report 90-4197.
NORTH CAROLINA
Gunter, H.C., Mason, R.R., and Stamey, T.C., 1987, Magnitude and frequency offloods in rural and urban basins of North Carolina: U.S. Geological Survey Water-Resources Investigations 87-4096.
Martens, L.S., 1968, Flood inundation and effects of urbanization in metropolitanCharlotte, North Carolina: U.S. Geological Survey Water-Supply Paper 1591-C.
Putnam, A.L., 1972, Effect of urban development on floods in the Piedmontprovince of North Carolina: U.S. Geological Survey Open-File Report.
NORTH DAKOTA
Crosby, O.A., 1975, Magnitude and frequency of floods in small drainage basins ofNorth Dakota: U.S. Geological Survey Water-Resources Investigations 19-75(PB-248 480/AS).
OHIO
Roth, D.K., 1985, Estimation of flood peaks from channel characteristics in Ohio:U.S. Geological Survey Water-Resources Investigations Report 85-4175.
Sherwood, J.M., 1986, Estimating peak discharges, flood volumes, and hydrographstages of small urban streams in Ohio: U.S. Geological Survey Water-ResourcesInvestigations Report 86-4197.
Webber, E.E., and Bartlett, W.P., Jr., 1977, Floods in Ohio magnitude andfrequency: State of Ohio, Department of Natural Resources, Division of Water,Bulletin 45.
Webber, E.E., and Roberts, J.W., 1981, Floodflow characteristics related tochannel geometry in Ohio: U.S. Geological Survey Open-File Report 81-1105.
A4-6

Appendix 4 - continuedState Hydrology Reports
OKLAHOMA
Sauer, V.B., 1974, An approach to estimating flood frequency for urban areas inOklahoma: U.S. Geological Survey Water-Resources Investigations 23-74(PB-235 307/AS).
Tortorelli, R.L., and Bergman, D.L., 1984, Techniques for estimating flood peakdischarge for unregulated streams and streams regulated by small floodwaterretarding structures in Oklahoma: U.S. Geological Survey Water-ResourcesInvestigations 84-4358.
OREGON
Harris, D.D., and Hubbard, L.E., 1982, Magnitude and frequency of floods in eastern Oregon: U.S. Geological Survey Water-Resources Investigations 82-4078.
Harris, D.D., Hubbard, L.E., and Hubbard, L.L., 1979, Magnitude and frequency offloods in western Oregon: U.S. Geological Survey Open-File Report 79-553.
Laenen, Antonius, 1980, Storm runoff as related to urbanization in the Portland,Oregon-Vancouver, Washington, area: U.S. Geological Survey Water-ResourcesInvestigations Open-File Report 80-689.
PENNSYLVANIA
Bailey, J.F., Thomas, W.O., Jr., Wetzel, K.L., and Ross, T.J., 1987, Estimationof flood-frequency characteristics and the effects of urbanization for streams inthe Philadelphia, Pennsylvania, area: U.S. Geological Survey Water-ResourcesInvestigations 87-4194.
Flippo, H.N., Jr., 1977, Floods in Pennsylvania: A manual for estimation of theirmagnitude and frequency: Pennsylvania Department of Environmental ResourcesBulletin No. 13.
PUERTO RICO
Lopez, M.A., Colon-Dieppa, E., and Cobb, E.D., 1978, Floods in Puerto Rico:magnitude and frequency: U.S. Geological Survey Water-Resources Investigations78-141 (PB-300 855/AS).
RHODE ISLAND
Johnson, C.G., and Laraway, G.A., 1976, Flood magnitude and frequency of smallRhode Island streams--Preliminary estimating relations: U.S. Geological SurveyOpen-File Report.
SOUTH CAROLINA
Whetstone, B.H., 1982, Floods in South Carolina--Techniques for estimating magnitude and frequency of floods with compilation of flood data: U.S. GeologicalSurvey Water-Resources Investigations 82-1.
A4-7

Appendix 4 - continuedState Hydrology Reports
SOUTH DAKOTA
Becker, L.D., 1974, A method for estimating the magnitude and frequency of floodsin South Dakota: U.S. Geological Survey Water-Resources Investigations 35-74(PB-239 831/AS).
Becker, L.D., 1980, Techniques for estimating flood peaks, volumes, andhydrographs on small streams in South Dakota: U.S. Geological Survey Water-Resources Investigations 80-80 (PB-81 136 145).
TENNESSEE
Neely, B.L., Jr., 1984, Flood frequency and storm runoff of urban areas ofMemphis and Shelby County, Tennessee: U.S. Geological Survey Water-ResourcesInvestigations 84-4110.
Randolph, W.J., and Gamble, C.R., 1976, A technique for estimating magnitude andfrequency of floods in Tennessee: Tennessee Department of Transportation.
Robbins, C.H., 1984, Synthesized flood frequency of small urban streams inTennessee: U.S. Geological Survey Water-Resources Investigations 84-4182.
Wibben, H.C., 1976, Effects of urbanization on flood characteristics inNashville-Davidson County, Tennessee: U.S. Geological Survey Water-ResourcesInvestigations 76-121 (PB-266 654/AS).
TEXAS
Land, L.F., Schroeder, E.E., and Hampton, B.B., 1982, Techniques for estimatingthe magnitude and frequency of floods in the Dallas-Fort Worth Metropolitan Area,Texas: U.S. Geological Survey Water-Resources Investigations 82-18.
Liscum, F., and Massey, B.C., 1980, Techniques for estimating the magnitude andfrequency of floods in the Houston, Texas metropolitan area: U.S. GeologicalSurvey Water-Resources Investigations 80-17 (ADA-089 495).
Schroeder, E.E., and Massey, B.C., 1977, Techniques for estimating the magnitudeand frequency of floods in Texas: U.S. Geological Survey Water-ResourcesInvestigations Open-File Report 77-110.
Veenhuis, J.E., and Garrett, D.G., 1986, The effects of urbanization on floods inthe Austin metropolitan area, Texas: U.S. Geological Survey Water-ResourcesInvestigations 86-4069.
UTAH
Fields, F.K., 1974, Estimating streamflow characteristics for streams in Utahusing selected channel-geometry parameters: U.S. Geological Survey Water-Resources Investigations 34-74 (PB-241 541/AS).
Thomas, B.E., and Lindskov, K.L., 1983, Methods for estimating peak dischargesand flood boundaries of streams in Utah: U.S. Geological Survey Water-ResourcesInvestigations 83-4129.
A4-8

Appendix 4 - continuedState Hydrology Reports
VERMONT
Johnson, C.G., and Tasker, G.D., 1974, Flood magnitude and frequency of VermontStreams: U.S. Geological Survey Open-File Report 74-130.
VIRGIN ISLANDS
None listed
VIRGINIA
Anderson, D.G., 1970, Effects of urban development on floods in NorthernVirginia: U.S. Geological Survey Water-Supply Paper 2001-C.
Miller, E.M., 1978, Technique for estimating the magnitude and frequency offloods in Virginia: U.S. Geological Survey Water-Resources Investigations Open-File Report 78-5.
WASHINGTON
Cummans, J.E., Collins, M.R., and Nassar, E.G., 1974, Magnitude and frequency offloods in Washington: U.S. Geological Survey Open-File Report 74-336.
Haushild, W.L., 1978, Estimation of floods of various frequencies for the smallephemeral streams in eastern Washington: U.S. Geological Survey Water-ResourcesInvestigations 79-81.
WEST VIRGINIA
Runner, G.S., 1980, Technique for estimating the magnitude and frequency offloods in West Virginia: U.S. Geological Survey Open-File Report 80-1218.
WISCONSIN
Conger, D.H., 1980, Techniques for estimating magnitude and frequency of floodsfor Wisconsin streams: U.S. Geological Survey Water-Resources InvestigationsOpen-File Report 80-1214.
Conger, D.H., 1986, Estimating magnitude and frequency of floods for ungagedurban streams in Wisconsin: U.S. Geological Survey Water-Resources InvestigationsReport 86-4005.
WYOMING
Craig, G.S., Jr., and Rankl, J.G., 1977, Analysis of runoff from small drainagebasins in Wyoming: U.S. Geological Survey Water-Supply Paper 2056.
Lowham, H.W., 1976, Techniques for estimating flow characteristics of Wyomingstreams: U.S. Geological Survey Water-Resources Investigations 76-112(PB-264 224/AS).
A4-9

Appendix 5
Manning’s “n” Values
The value of “n” may be computed by
n = (n0 + n1 + n2 + n3 + n4)m5
where: n0 = basic “n” value for a straight, uniform, smooth channel n1 = value added to correct for the effect of surface irregularities n2 = value added for variation in the shape and size of the channel
cross section n3 = value added for obstructions n4 = value added for vegetation and flow conditions m5 = correction factor for meandering of the channel
Proper values of n0 to n4 and m5 may be selected from the following table according to the given conditions:
Channel Conditions Values Earth 0.020
Material Rock cut 0.025 involved Fine gravel n0 0.024
Coarse gravel 0.028 Smooth 0.000
Degree of Minor 0.005 irregularity Moderate n1 0.010
Severe 0.020 Variations of Gradual 0.000 channel cross Alternating occasionally n2 0.005
section Alternating frequently 0.010-0.015 Negligible 0.000
Relative Minor 0.010-0.015 effect of Appreciable n3 0.020-0.030
obstructions Severe 0.040-0.060 Low 0.005-0.010
Vegetation Medium 0.010-0.025 High n4 0.025-0.050 Very High 0.050-0.100 Minor 1.000
Degree of Appreciable m5 1.150 meandering Severe 1.300
REFERENCE 1. Chow, Ven Te, Ph.D.: “Open-Channel Hydraulics,” McGraw-Hill Book Company,
New York, 1959, pp. 106-114.
The computed “n” values should be compared with the typical “n” values from the following pages, or with those in the U.S. Geological Survey Report (Reference 2) or the Federal Highway Administration Report (Reference 3).
A5-1

Appendix 5 - continued Manning’s “n” Values
Type of channel and description Minimum Normal Maximum A.
A-1. a. 0.009 0.010 0.013 b. Steel
1. 0.010 0.012 0.014 2. Riveted and spiral 0.013 0.016 0.017
c. Cast iron 1. Coated 0.010 0.013 0.014 2. Uncoated 0.011 0.014 0.016
d. Wrought iron 1. Black 0.012 0.014 0.015 2. Galvanized 0.013 0.016 0.017
e. Corrugated metal 1. Subdrain 0.017 0.019 0.021 2. Storm drain 0.021 0.024 0.030
A-2. Nonmetal a. Lucite 0.008 0.009 0.010 b. Glass 0.009 0.010 0.013 c. Cement
1. Neat, surface 0.010 0.011 0.013 2. Mortar 0.011 0.013 0.015
d. Concrete 1. Culvert, straight and free of
debris 0.010 0.011 0.013
2. Culvert with bends, connections, and some debris
0.011 0.013 0.014
3. Finished 0.011 0.012 0.014 4. Sewer with manholes, inlet, etc.,
straight 0.013 0.015 0.017
5. Unfinished, steel form 0.012 0.013 0.014 6. Unfinished, smooth wood form 0.012 0.014 0.016 7. Unfinished, rough wood form 0.015 0.017 0.020
e. Wood 1. Stave 0.010 0.012 0.014 2. Laminated, treated 0.015 0.017 0.020
f. Clay 1. Common drainage tile 0.011 0.013 0.017 2. Vitrified sewer 0.011 0.014 0.017 3. Vitrified sewer with
inlet, etc. 0.013 0.015 0.017
4. Vitrified subdrain with open joint 0.014 0.016 0.018 g. Brickwork
1. Glazed 0.011 0.013 0.015 2. Lined with cement mortar 0.012 0.015 0.017
h. Sanitary sewers coated with sewage slimes, with bends and connections
0.012 0.013 0.016
i. Paved invert, sewer, smooth bottom 0.016 0.019 0.020 j. Rubble masonry, cemented 0.018 0.025 0.030
Closed Conduits Flowing Partly Full Metal
Brass, smooth
Lockbar and welded
manholes,
A5-2

Appendix 5 - continued Manning’s “n” Values
Type of channel and description Minimum Normal Maximum B. Lined or Built-up Channels
B-1. Metal a. Smooth steel surface
1. Unpainted 0.011 0.012 0.014 2. Painted 0.012 0.013 0.017
b. Corrugated 0.021 0.025 0.030 B-2. Nonmetal
a. Cement 1. Neat, surface 0.010 0.011 0.013 2. Mortar 0.011 0.013 0.015
b. Wood 1. Planed, untreated 0.010 0.012 0.014 2. Planed, creosoted 0.011 0.012 0.015 3. Unplaned 0.011 0.013 0.015 4. Plank with battens 0.012 0.015 0.018 5. Lined with roofing paper 0.010 0.014 0.017
c. Concrete 1. Trowel finish 0.011 0.013 0.015 2. Float finish 0.013 0.015 0.016 3. Finished, with gravel on bottom 0.015 0.017 0.020 4. Unfinished 0.014 0.017 0.020 5. Gunite, good section 0.016 0.019 0.023 6. Gunite, wavy section 0.018 0.022 0.025 7. On good excavated rock 0.017 0.020 8. On irregular excavated rock 0.022 0.027
d. Concrete bottom float finished with sides of 1. Dressed stone in mortar 0.015 0.017 0.020 2. Random stone in mortar 0.017 0.020 0.024 3. Cement rubble masonry, plastered 0.016 0.020 0.024 4. Cement rubble masonry 0.020 0.025 0.030 5. Dry rubble or riprap 0.020 0.030 0.035
e. Gravel bottom with sides of 1. Formed concrete 0.017 0.020 0.025 2. Random stone in mortar 0.020 0.023 0.026 3. Dry rubble or riprap 0.023 0.033 0.036
f. Brick 1. Glazed 0.011 0.013 0.015 2. In cement mortar 0.012 0.015 0.018
g. Masonry 1. Cemented rubble 0.017 0.025 0.030 2. Dry rubble 0.023 0.032 0.035
h. Dressed ashlar 0.013 0.015 0.017 i. Asphalt
1. Smooth 0.013 0.013 2. Rough 0.016 0.016
j. Vegetal lining 0.030 . . . . . 0.500
A5-3

Appendix 5 - continued Manning’s “n” Values
Type of channel and description Minimum Normal Maximum C. Excavated or Dredged
a. Earth, straight and uniform 1. Clean, recently completed 0.016 0.018 0.020 2. Clean, after weathering 0.018 0.022 0.025 3. Gravel, uniform section, clean 0.022 0.025 0.030 4. With short grass, few weeds 0.022 0.027 0.033
b. Earth, winding and sluggish 1. No vegetation 0.023 0.025 0.030 2. Grass, some weeds 0.025 0.030 0.033 3. Dense weeds or aquatic plants in
deep channels 0.030 0.035 0.040
4. Earth bottom and rubble sides 0.028 0.030 0.035 5. Stony bottom and weedy banks 0.025 0.035 0.040 6. Cobble bottom and clean sides 0.030 0.040 0.050
c. Dragline-excavated or dredged 1. No vegetation 0.025 0.028 0.033 2. Light brush on banks 0.035 0.050 0.060
d. Rock cuts 1. Smooth and uniform 0.025 0.035 0.040 2. Jagged and irregular 0.035 0.040 0.050
e. Channels not maintained, weeds and brush uncut 1. Dense weeds, high as flow depth 0.050 0.080 0.120 2. Clean bottom, brush on sides 0.040 0.050 0.080 3. Same, highest stage of flow 0.045 0.070 0.110 4. Dense brush, high stage 0.080 0.100 0.140
D. Natural Streams D-1. Minor streams (top width at flood stage
<100 ft) a. Streams on plain
1. Clean, straight, full stage, no rifts or deep pods
0.025 0.030 0.033
2. Same as above, but more stones and weeds
0.030 0.035 0.040
3. Clean, winding, some pools and shoals
0.033 0.040 0.045
4. Same as above, but some weeds and stones
0.035 0.045 0.050
5. Same as above, lower stages, more ineffective slopes and sections
0.040 0.048 0.055
6. Same as 4, but more stones 0.045 0.050 0.060 7. Sluggish reaches, weedy, deep
pools 0.050 0.070 0.080
8. Very weedy reaches, deep pools, or floodways with heavy stand of timber and underbrush
0.075 0.100 0.150
A5-4

Appendix 5 - continued Manning’s “n” Values
Type of channel and description Minimum Normal Maximum b. Mountain streams, no vegetation in
channel, banks usually steep, trees and brush along banks submerged at high stages 1. Bottom:
few boulders 0.030 0.040 0.050
2. Bottom: boulders
0.040 0.050 0.070
D-2. Floodplains a. Pasture, no brush
1. Short grass 0.025 0.030 0.035 2. High grass 0.030 0.035 0.050
b. Cultivated areas 1. No crop 0.020 0.030 0.040 2. Mature row crops 0.025 0.035 0.045 3. Mature field crops 0.030 0.040 0.050
c. Brush 1. Scattered brush, heavy weeds 0.035 0.050 0.070 2. Light brush and trees, in winter 0.035 0.050 0.060 3. Light brush and trees, in summer 0.040 0.060 0.080 4. Medium to dense brush, in winter 0.045 0.070 0.110 5. Medium to dense brush, in
summer 0.070 0.100 0.160
d. Trees 1. Dense willows, summer, straight 0.110 0.150 0.200 2. Cleared land with tree stumps, no
sprouts 0.030 0.040 0.050
3. Same as above, but with heavy growth of sprouts
0.050 0.060 0.080
4. Heavy stand of timber, a few down trees, little undergrowth, flood stage below branches
0.080 0.100 0.120
5. Same as above, but with flood stage below branches
0.100 0.120 0.160
D-3. Major streams (top width at flood stage >100 ft). for minor streams of similar description, because banks offer less effective resistance. a. Regular section with no boulders or
brush 0.025 . . . . . 0.060
b. Irregular and rough section 0.035 . . . . . 0.100
gravels, cobbles, and
cobbles with large
The n value is less than that
REFERENCES
1. Chow, Ven Te, Ph.D.: “Open-Channel Hydraulics,” McGraw-Hill Book Company, New York, 1959, pp. 106-114.
2. Geological Survey, Roughness Characteristics of Natural Channels, Water-Supply Paper 1849, Washington, D.C., 1967.
3. Department of Transportation, Federal Highway Administration, Guide for Selecting Manning’s Roughness Coefficients for Natural Channels and Floodplains, Report No. FHWA-TS-84-204, McLean, Virginia, April 1984.
A5-5

Appendix 6
QUICK-2 Computer Program Manual
A6-1

Q U I C K - 2Computer Program
COMPUTATION OF WATER SURFACEELEVATIONS IN OPEN
CHANNELS
VERSION 1.0
JANUARY 1995

QUICK-2
Computation of Water Surface Elevations in Open Channels
User's Guide
Federal Emergency Management Agency
1995

TABLE OF CONTENTS
Page
Chapter 1: INTRODUCTION . . . . . . . . . . . . . . . . . 1- 1
Chapter 2: OVERVIEW . . .. . . . . . . . . . . . . . . . . 2- 1
Chapter 3: GETTING STARTED . . . . . . . . . . . . . . . . 3- 1
Chapter 4: TUTORIALS . . . . . . . . . . . . . . . . . . .4- 1Normal Depth . . . . . . . . . . . . . . . . . . 4- 2
Changing Variables . . . . . .. . . . . . 4- 6Step-Backwater . . . . . . . . . . . . . .. . . 4- 9
Running HEC-2 with QUICK-2 Files . . .. . 4-18Rerunning Using Saved Cross-Section Files 4-19
Channel Capacity . . . . . . . . . . . .. . . . 4-21Rating Curve Plot . . . . . . . . . . . . 4-22
PLOT-2 . . . . . . . . . . . .. . . . . . . . . 4-23Profile Plot . . . . . . . . . . . . . . 4-23Cross-Section Plot . . . . . . . . . . . 4-24
Chapter 5: FORMULAS . . . . . . . . . . . . . . . . . . . . 5- 1
Critical Depth . . . . . . . . . . . . . . . . . 5- 2Channel Capacity . . . . . . . . . . . . . . . . 5- 4Normal Depth . . . . . . . . . . . . . . . . . 5- 5Step-Backwater . . . . . . . . . . . . . . . . . 5- 6
Appendix 1: DEFINITION OF VARIABLES . . . . . . . . . . . . A- 1

QUICK-2 User's Guide Introduction
Chapter 1: Introduction
QUICK-2 is a user friendly program that assists in the computation of floodWater Surface Elevations (WSEs) in open channels of all types. It is mucheasier to use than the United States Army Corps of Engineers (USACE) HEC-2program. However, a QUICK-2 step-backwater file can also be used, as is,with the HEC-2 program, which is also included in the QUICK-2 package ofprograms. Therefore a HEC-2 output file can be generated with a QUICK-2 inputdata file, without ever leaving the QUICK-2 environment; and, without havingto know how to set-up and run the HEC-2 program. This version of QUICK-2(Version 1.0) however, does not perform hydraulic calculations throughbridges or culverts.
QUICK-2 was primarily developed to accompany the FEMA technical guidancemanual titled, "MANAGING FLOODPLAIN DEVELOPMENT IN ZONE A AREAS - A GUIDE FOROBTAINING AND DEVELOPING BASE FLOOD ELEVATIONS." That manual is intended toassist local community officials who are responsible for administering andenforcing the floodplain management requirements of the National FloodInsurance Program (NFIP). The purpose of that manual is to provide guidancefor obtaining and developing base flood (100-year) elevations (BFEs) whereSpecial Flood Hazard Areas (SFHAs) on a community's Flood Hazard Boundary Map(FHBM) or Flood Insurance Rate Map (FIRM) have been identified and designatedas Zone A.
QUICK-2 will also be useful to community engineers, architect/engineer firms,developers, builders and others at the local level who may be required todevelop BFEs for use in Special Flood Hazard Areas.
This manual includes four other chapters: Overview, Getting Started,Tutorials and Formulas. The Formulas section describes the "complex"equations and methodologies used in the development of the program. AnAppendix is also included that contains a list of Definitions of thevariables shown on the screen and on the printouts.
To get started as quickly as possible in using QUICK-2 we recommend that the user read the Overview and GettingStarted chapters; and then work through the Tutorials.
MINIMUM SYSTEM REQUIREMENTS
Random Access Memory (RAM) - 512KHard disk storage - 800KMonitor - Color or MonotonePrinter (prints to LPT1) - Dot-matrix to LaserJetDisk Operating System (DOS) - Version 3.0 or higher
1-1

�
�
QUICK-2 User's Guide Overview
Chapter 2: Overview
� FOUR OPTIONS This user friendly program computes:
• Critical Depth,
• Cross Section Capacity (Rating Curves),
• Normal Depth, and
• Step-Backwater Analysis (similar to the USACE HEC-2 program)
CRITICAL DEPTH: This option should be used to determine a Base FloodElevation (BFE) if a previous calculation using the Normal Depth optioncomputed a depth that was determined to be SUPERCRITICAL. Super Criticaldepths are generally not accepted for use as BFEs.
CHANNEL CAPACITY: This option is used to determine a rating curve for a crosssection. The program computes a discharge based on the entered depth.Repeating with other depths produces a rating curve. A BFE may be determinedby interpolation with the correct discharge.
NORMAL DEPTH: This is the usual option to use in determining BFEs. The usershould watch the "Flow Type" message to make sure that the calculation isCRITICAL or SUBCRITICAL. Use Option 1 if SUPERCRITICAL.
STEP-BACKWATER: This option should be used to calculate BFEs if more than onecross-section is warranted to cover the extent of the property. Generally ifthe property parallels more than 500 feet of a flooding source this optionshould be used.
� HANDLES "REGULAR" AND "IRREGULAR" SHAPED CROSS SECTIONS The REGULAR shape cross-sections include:
• V-shape,
• Trapezoidal,
• Rectangular, and
• Circular2-1

�
�
�
QUICK-2 User's Guide Overview
For IRREGULAR cross-sections:
- up to 40 points can be input to describe the ground points
- Ground points are easily modified using the Insert or Delete Keys
- Encroachments or other changes in the floodplain are easily modeled
- An unlimited number of cross sections may be modeled
In addition, ground points and other input variables for the irregular shapecross-sections can be saved to a file, for later use.
� SINGLE SCREEN DATA INPUT, COMPUTATION AND OUTPUT One of the most user-friendly aspects of this program that sets it apart frommany other computational programs is that all of the data input, thecomputation, and the printing or plotting, is performed from the same screen.You will not get lost in a maze of menus.
� GRAPHICS
• Cross-Section Plots,
• Water Surface Elevation Profiles, and
• Rating Curve Plots
Cross section plots and water surface elevation profiles from QUICK-2's step-backwater analysis can be viewed on the screen using the USACE PLOT-2 programthat comes with the QUICK-2 package of programs. The channel capacity optionof QUICK-2 can be used to generate rating curve plots of individual crosssections that can be viewed on screen and printed.
� AUTOMATIC ERROR CHECKING This software is designed to virtually eliminate the need for user's manuals.The program incorporates error-checking routines and warning messages toalert the user to incorrect input data or potentially incorrect output data.The program prompts the user for the required input data so that there is noneed to worry about which columns to put data in; whether or not it needs tobe left-justified, or right- justified, etc.
2-2

QUICK-2 User's Guide Overview
SPECIAL FEATURES OF QUICK-2
»» Critical Depth, Channel Capacity, and Normal Depth Options ««
EASY VIEW: All of the input data is viewed on the same screen (and changescan be made) before starting the computations
EASY CHANGE: After an initial calculation, the following parameters can bechanged, and the above options can be re-calculated in seconds:
Discharge Channel Slope Manning's N Base width or Diameter Channel Side Slope Ground Points Channel Stations
AUTO-SAVE: For irregular channels the program automatically stores all theinput variables to a file designated as "TEMP.XSC", which is stored in theC:\QUICK2\DATA Directory.
RATING CURVES: A special feature of the Channel Capacity Option for irregularchannels is the Rating Curve Print Option. A rating curve plot can beautomatically generated with 20 computations of water surface elevationversus discharge. The maximum elevation of the rating curve will be justlower than the channel depth specified by the user. The rating curve can beviewed on the screen and/or printed.
»» Step-Backwater Option ««
EASY VIEW: All of the input data is viewed on the same screen (and changescan be made) before starting the computations
PRECISE: Balances the energy equation to within .01 foot.
COMPUTES CRITICAL DEPTH AUTOMATICALLY: After up to 40 energy balance trials(without a balance) the program automatically computes critical depth.
OUTPUT OPTIONS: Detailed and Summary printouts are available
AUTO-SAVE: The program automatically saves the first cross-section into afile designated as T0.XSC, and subsequent cross-sections are saved adding theChannel distance (XLCH) to the previous cross-section's file name.Therefore, if we run 3 cross-sections that are 200 feet apart theirfilenames will be: T0.XSC, T200.XSC, and T400.XSC. These files areautomatically stored in a directory named C:\QUICK2\DATA.
HEC-2 RUNS WITH QUICK-2 FILES: The backwater option also automatically savesall of the cross-sections into a HEC-2 compatible file called HEC2.DAT, whichis stored in the C:\QUICK2 Directory. The QUICK-2 program is linked with theUSACE HEC-2 program such that any backwater computation that is run usingQUICK-2 can also be run using the HEC-2 program within the QUICK-2environment. The user does not need to have any previous experience inrunning the HEC-2 model.
2-3

QUICK-2 User's Guide Overview
AUTOMATIC ERROR CHECKS AND WARNING MESSAGES
ERROR CHECKS
Error checks prevent the user from continuing by re-prompting the user forcorrect input data. The following are error checks performed automatically bythe program:
- Ground Point (GR) stations should be increasing
- Stations of the left and right bank should match a GR point
WARNING MESSAGES
Warning messages instruct the user that the program has had to modify theinput data in order to complete a calculation, or that the completedcalculation may not be valid. The following are warning messages performed bythe program:
Extended Cross SectionThe computed water surface elevation is higher than one or both ends of thecross-section, and the program automatically extended the end(s) of thecross-section vertically to complete the computation.
Divided FlowThere is a ground point(s) within the cross-section which is higher than thecomputed water surface elevation which is dividing the flow within the cross-section.
No Energy Balance ... Computing Critical Depth The program attempted up to 40 trial computations and could not arrive at anenergy balance; and therefore, critical depth is assumed to occur at thiscross-section.
Computing Critical Depth ... Critical Depth Assumed Either the initial Starting Water Surface Elevation or an energy balancebetween two cross sections occurred at an elevation for which the froudenumber or the index froude number was equal to or greater than 1. Thus, thecomputed water surface elevation is suspected of being below the criticaldepth. Therefore the critical depth is computed and compared to the previouscalculated water surface elevation. In this case the critical depth elevationwas higher, and thus Critical Depth is Assumed.
Computing Critical Depth ... Critical Depth Not Assumed Same as above except, the critical depth is computed and compared to theprevious calculated water surface elevation; and, in this case the criticaldepth elevation was lower, and thus Critical Depth is Not Assumed.
2-4

QUICK-2 User's Guide Getting Started
Chapter 3: Getting Started
This section provides you withconvenient installation and runprocedures that will enable youto run the program from the harddisk drive or the floppy disk drive.
HARD DISK INSTALLATION AND RUN PROCEDURE
To install and run QUICK-2 simply place the floppy disk in either your "A"disk drive or your "B" disk drive.
For "A" Drive users: Type A:\AQ2 and Press <Enter>
For "B" Drive users: Type B:\BQ2 and Press <Enter>
Follow the screen message to start the program. That's it!
The program resides in a C:\QUICK2 directory. To run the program in thefuture, just change to that directory and type Q2 and press <Enter>.
FLOPPY DISK INSTALLATION AND RUN PROCEDURE
To install and run QUICK-2 from the floppy disk drive simply place the floppydisk in either your "A" disk drive or your "B" disk drive.
For "A" Drive users: Type A:\FAQ2 and Press <Enter>For "B" Drive users: Type B:\FBQ2 and Press <Enter>
Follow the screen message to start the program. That's it!
To run the program in the future, just place the disk in your floppy drive,change to that directory and type Q2 and press <Enter>. Although theprogram will run from the floppy disk drive it will run much faster ifinstalled and run on the hard disk drive.
REMINDER:
Entering and editing data, as well as moving around within the input screensis performed using the Function keys, the Backspace Key and the Enter Key. DONOT USE THE CURSOR CONTROL KEYS (ARROW KEYS) FOR ENTERING, DELETING, OREDITING DATA.
3-1

Chapter 4: TUTORIALS
Normal Depth
Step-Backwater
Channel Capacity
PLOT - 2
{TIME REQUIRED TO COMPLETE ALL THE TUTORIALS IS ABOUT ONE HOUR}4-1

-----
QUICK-2 User's Guide
NORMAL DEPTH {Tutorial Time: 5 to 10 minutes}
After pressing Q2 and <Enter> to start the program you will come to Main Menu screen of QUICK-2 as shown below.
QUICK - 2 MAIN
Press -----
Critical Depth Channel Capacity Normal Depth Step-Backwater
QUIT
<F1> - Help
1. Press 3 and then press <Enter> to start the Normal Depth Option.
Next you will see the Shape of Cross Section screen:
SHAPE OF CROSS SECTION Press
V - Ditch Rectangular Channel Trapezoidal Channel Circular
Irregular
<F7> - Main Menu
Let's try the Trapezoidal Channel option.
2. Press T and then press <Enter> to perform a Normal Depth calculation for a trapezoidal channel.
4-2
Normal Depth Tutorial
the
MENU
1 2 3 4
<F10>
V R T C Channel
I Channel

QUICK-2 User's Guide
The next screen you will see is the Input / Output screen:
NORMAL TRAPEZOIDAL CHANNEL
INPUT VARIABLES
L Side Slope (H:V) Bottom Width (ft) Discharge (cfs) Slope (ft/ft)
OUTPUT VARIABLES
Area (sq ft) Velocity (ft/s) Top Width (ft)
Flow Type
Enter Left Side Slope
<- Back Tab
The program is currently prompting you to enter the Left Side Slope (in terms of the Number of Horizontal feet (H) to every 1 foot Vertical (H : 1). Let's say our left side slope is 3 to 1 (3:1).
3. Enter 3 and then Press <Enter>.
The next screen you will see is the Input / Output screen with a new prompt:
NORMAL Notice that the TRAPEZOIDAL CHANNEL 3 has been entered
to the right of INPUT VARIABLES "L Side Slope (H:V)"
L Side Slope (H:V) 3.0:1 Bottom Width (ft) Discharge (cfs) Slope (ft/ft)
Normal Depth Tutorial
DEPTH
:1 R Side Slope (H:V) :1 Manning's n Depth (ft)
Wet Perimeter (ft) Hyd Radius Froude #
:1 <Enter> and Press
<F7> Main Menu <F2>
DEPTH
:1 R Side Slope (H:V) Manning's n Depth (ft)
OUTPUT VARIABLES
Area (sq ft) Wet Perimeter (ft) Velocity (ft/s) Hyd Radius Top Width (ft) Froude #
Flow Type
Enter Right Side Slope
<- Back Tab
The program is currently prompting you to enter the Right Side Slope (in terms of the Number of Horizontal feet (H) to every 1 foot Vertical (H : 1). Let's say our right side slope is 2 to 1 (2:1).
4. Enter 2 and then Press <Enter>.
4-3
:1 <Enter> and Press
<F7> Main Menu <F2>

QUICK-2 User's Guide
NORMAL TRAPEZOIDAL CHANNEL
INPUT VARIABLES
L Side Slope (H:V) 3.0:1 2.0:1 Bottom Width (ft) Discharge (cfs) Slope (ft/ft)
OUTPUT VARIABLES
Area (sq ft) Velocity (ft/s) Top Width (ft)
Flow Type
Enter ".............."
<- Back Tab
The program will continue to prompt you for input data.
Let's say our channel is 10 feet wide, with a Manning's n value of 0.035, the discharge is 300 cfs, and the channel slope is .005 ft/ft.
SCREEN PROMPT - "Enter Bottom Width 5. Enter 10 and then Press <Enter>.
SCREEN PROMPT - "Enter Manning's n 6. Enter .035 and then Press <Enter>.
SCREEN PROMPT - "Enter Discharge
Normal Depth Tutorial
DEPTH
R Side Slope (H:V) Manning's n Depth (ft)
Wet Perimeter (ft) Hyd Radius Froude #
<Enter> and Press
<F7> Main Menu <F2>
<Enter>" and Press
<Enter>" and Press
<Enter>" and Press 7. Enter 300 and then Press <Enter>.
SCREEN PROMPT - "Enter Slope 8. Enter .005 and then Press <Enter>.
NORMAL
TRAPEZOIDAL CHANNEL
INPUT VARIABLES
L Side Slope (H:V) 3.0:1 2.0:1 Bottom Width (ft) 10.0 Manning's n 0.0350 Discharge (cfs) 300 Depth (ft) 0.00 Slope (ft/ft) 0.0050
OUTPUT VARIABLES
Area (sq ft) Velocity (ft/s) Top Width (ft)
Flow Type
Begin Calculations
<- Back Tab
and Press
DEPTH
R Side Slope (H:V)
Wet Perimeter (ft) Hyd Radius Froude #
<Enter>
<F7> Main Menu <F2>
<Enter>"
After all the datais input your screenshould look like this
4-4

QUICK-2 User's Guide
To begin the calculation simply ...
9. Press <Enter>.
After a split second the screen should look like this:
NORMAL TRAPEZOIDAL CHANNEL
INPUT VARIABLES
L Side Slope (H:V) 3.0:1 2.0:1 Bottom Width (ft) 10.0 Manning's n 0.0350 Discharge (cfs) 300 Depth (ft) 3.27 Slope (ft/ft) 0.0050
OUTPUT VARIABLES
Area (sq ft) 59.6 Wet Perimeter (ft) 27.7 Velocity (ft/s) 5.0 Hyd Radius 2.2 Top Width (ft) 26.4 Froude # 0.6
Flow Type SUBCRITICAL
Begin Calculations Print <- Back Tab
Notice that the Depth is no longer 0.00, but equals 3.27 feet, which is the Normal Depth for this particular Trapezoidal cross-section. If 300 cfs represents the 100-year discharge, then the 100-year flood depth would equal 3.27 feet. All of the output variables have also been computed and listed.
10. To print the output simply Press the <F5> Function key.
The printed output is shown below.
QUICK -NORMAL DEPTH Trapezoidal Channel
INPUT ___ ^ |
Depth |
_v_ Base Width = Slope
4-5
Normal Depth Tutorial
DEPTH
R Side Slope (H:V)
<Enter> <F5>
Main Menu <F7> <F2>
2
OUTPUT VARIABLES VARIABLES
3.27 Depth (ft) / \ 300.0 Discharge (cfs) |1 / n = 0.035 \ 1|
5.04 Velocity (ft/s) / ____| |____ \ 26.4 Top Width (ft) 2.0 / \ 3.0 0.59 Froude No. \____________/
SUBCRITICAL Flow Type: 10.0 = 0.0050

QUICK-2 User's Guide
CHANGING THE VARIABLES
NORMAL TRAPEZOIDAL CHANNEL
INPUT VARIABLES
L Side Slope (H:V) 3.0:1 2.0:1 Bottom Width (ft) 10.0 Manning's n 0.0350 Discharge (cfs) 300 Depth (ft) 3.27 Slope (ft/ft) 0.0050
OUTPUT VARIABLES
Normal Depth Tutorial
DEPTH
R Side Slope (H:V)
Area (sq ft) Velocity (ft/s) Top Width (ft)
59.6 Wet Perimeter (ft) 27.75.0 Hyd Radius 2.226.4 Froude # 0.6
Flow Type SUBCRITICAL
Begin Calculations Print <- Back Tab
Let's say we want to run this calculation again but with a discharge of 500 cfs instead of 300 cfs.
1. Press the Function Key <F2>
NORMAL TRAPEZOIDAL CHANNEL
INPUT VARIABLES
L Side Slope (H:V) 3.0:1 2.0:1 Bottom Width (ft) 10.0 Manning's n 0.0350 Discharge (cfs) 300 Depth (ft) 3.27 Slope (ft/ft) 0.0050
OUTPUT VARIABLES
Area (sq ft) 59.6 Wet Perimeter (ft) 27.7 Velocity (ft/s) 5.0 Hyd Radius 2.2 Top Width (ft) 26.4 Froude # 0.6
Flow Type SUBCRITICAL
Enter Slope
<- Back Tab
The above screen is what you should be looking at. The <F2> key will move the prompt backwards through all the variables. Note that since we want to change the Discharge (from 300 to 500), we will need to Press <F2> again to come to the Enter Discharge prompt. Follow the steps as shown on the following page to rerun this calculation with a new discharge.
4-6
<Enter> <F5>
Main Menu <F7> <F2>
DEPTH
R Side Slope (H:V)
<Enter> and Press
<F7> Main Menu <F2>

QUICK-2 User's Guide
SCREEN PROMPT - "Enter Slope
2. Press <F2>.
SCREEN PROMPT - "Enter Discharge
3. Enter 500 and then Press <Enter>.
SCREEN PROMPT - "Enter Slope
4. Press <Enter>.
After all of the data is input your screen should look like this:
NORMAL TRAPEZOIDAL CHANNEL
INPUT VARIABLES
L Side Slope (H:V) 3.0:1 2.0:1 Bottom Width (ft) 10.0 Manning's n 0.0350 Discharge (cfs) 500 Depth (ft) 3.27 Slope (ft/ft) 0.0050
OUTPUT VARIABLES
Area (sq ft) 59.6 Wet Perimeter (ft) 27.7 Velocity (ft/s) 5.0 Hyd Radius 2.2 Top Width (ft) 26.4 Froude # 0.6
Flow Type SUBCRITICAL
Begin Calculations
<- Back Tab
Normal Depth Tutorial
<Enter>" and Press
<Enter>" and Press
<Enter>" and Press
DEPTH
R Side Slope (H:V)
<Enter>
<F7> Main Menu <F2>
4-7

QUICK-2 User's Guide
5. Press <Enter> to begin the calculation.
After a split second the screen should look like this:
NORMAL TRAPEZOIDAL CHANNEL
INPUT VARIABLES
L Side Slope (H:V) 3.0:1 2.0:1 Bottom Width (ft) 10.0 Manning's n 0.0350 Discharge (cfs) 500 Depth (ft) 4.22 Slope (ft/ft) 0.0050
OUTPUT VARIABLES
Normal Depth Tutorial
DEPTH
R Side Slope (H:V)
Area (sq ft) Velocity (ft/s) Top Width (ft)
86.7 Wet Perimeter (ft) 32.85.8 Hyd Radius 2.631.1 Froude # 0.6
Flow Type SUBCRITICAL
Begin Calculations Print <- Back Tab
Let's return to the Main Menu... Just Press the <F7> Function Key
QUICK - 2 MAIN
Press -----
Critical Depth Channel Capacity Normal Depth Step-Backwater 4
QUIT
<Enter> <F5>
Main Menu <F7> <F2>
MENU
1 2 3
<F10>
<F1> - Help
If you want to continue and to perform the Step-Backwater
Tutorial, then turn to the next page.
If you want to exit out of the program for now, Press <F10>.
4-8

-----------------
QUICK-2 User's Guide
STEP-BACKWATER {Tutorial Time: 20 to 25 minutes}
Let's say that we have a piece of property located in an unnumbered Zone A, and we need to determine if our property is really in or out of the floodplain. We will be referring to Figure 1 on the next page which represents a plan view of our proposed floodplain study (step-backwater analysis). We have field surveyed 3 cross-sections to use in the step-backwater analysis. The next page lists all of the data from the field surveyed cross-sections.
If you have continued from the previous Normal Depth Tutorial you should see the screen below. If you are just starting the program, you will see the screen below after pressing Q2 and <Enter>.
QUICK - 2 MAIN
Press -----
Critical Depth Channel Capacity Normal Depth Step-Backwater
QUIT
<F1> - Help
1. Press 4 and then press <Enter> to start the Step-Backwater Option.
Next you will see the Starting Water Surface Elevation Method screen:
Starting Water Surface Elevation Method
Input
NORMAL DEPTH (Slope-Area) Enter the Slope in Ft/Ft
OR
KNOWN WATER SURFACE ELEVATION Enter the known WS Elevation
Enter a Slope or an Elevation:
Let's say that we do not have any previous information about flood elevations for our sample stream. Thus we need to start the step-backwater analysis assuming that the flow in our first cross-section is at Normal Depth. (This assumes that the channel slope downstream of our first cross-section will approximate the slope of the energy grade at the first cross-section of our study.) Let's assume that our calculated downstream channel slope is .0029 ft/ft.
2. Type .0029 and then press <Enter>.
4-9
Step-Backwater Tutorial
MENU
1 2 3 4
<F10>
.0025) (for ex.
656.78) (for ex.

QUICK-2 User's Guide Step-Backwater Tutorial
CROSS SECTION INFORMATION
Cross-Section 1
GROUND POINTS
Station Elevation 362 505.0 425 499.1 509 498.0 512 496.9 602 496.9 605 498.2 732 500.1 1020 504.7
CHANNEL BANK STATIONS
Left 509 Right 605
MANNING'S N VALUES
Left .065 Channel .040 Right .060
CHANNEL REACH LENGTHS
Left ---Channel ---Right ---
LOSS COEFFICIENTS
Cont --- Expan ---
100-YEAR DISCHARGE
3000
Cross-Section 2
Station Elevation 0 510.0
150 504.8 233 502.2 236 500.9 331 500.9 334 501.8 402 505.5 591 510.1
Left 233 Right 334
Left .055 Channel .040 Right .060
Left 450 Channel 450 Right 450
Cont 0.1 Expan 0.3
3000
Cross-Section 3
Station Elevation0 515.0
433 510.1 600 506.3 614 504.9 701 504.8 725 506.5 866 511.11240 514.6
Left 600 Right 725
Left .065Channel .040Right .060
Left 490Channel 490Right 490
Cont 0.1 Expan 0.3
3000
FIGURE 1
4-10

QUICK-2 User's Guide
The next screen you will see is the Input / Output screen as shown:
XSEC ID: - BACKWATER << STAT
CHANNEL BANK STATIONS: MANNING'S CHANNEL REACH LENGTHS: LOSS WS ELEV EG ELEV
F2}<-Back Tab F5}List Files F6}Retrieve File F7}Main Menu F10}Ed/Ex GrPt F3}Insert GrPt F4}Delete GrPt F1 }HELP
Before we go on let's read about how data is to be input for this screen.
3. Press <F1> to access the Help screen.
4. When you are finished reading the Help screen just Press <Enter>.
If you refer to the previous page, you will see a tabulation of the Ground Points for the first field surveyed cross-section listed by Station and Elevation. You will also see the Channel Bank Stations, Manning's N values, and Discharge.
5. Following the method explained in the Help Screen, enter the Ground Points one at a time, by their respective Station and Elevation. Be sure to Press <Enter> after you have typed in each correct number.
Once you have entered all of the Ground Points correctly ...
6. Press <F10> to Exit from entering Ground Point data
NOTE: The <F10> Key will EXIT you from the top of the screen, or it will RETURN you to the top of the screen if you need to go back to EDIT the Ground Points.
Step-Backwater Tutorial
>> STEP 0 POINTS GROUND ELEV STAT ELEV STAT ELEV STAT ELEV
Right Left Right Channel Left VALUES: N Right Channel Left :Dschrg Expansn COEFFICIENTS: Contractn Kratio Top Wid Depth Froud# ChanVel Flow Regime
4-11

QUICK-2 User's Guide
Your screen should now look like this:
XSEC ID: - BACKWATER << STAT 362 602
CHANNEL BANK STATIONS: MANNING'S CHANNEL REACH LENGTHS: LOSS WS ELEV EG ELEV
F2}<- Back Tab F5}PRINT F6}SAVE F7}Main Menu F8}New XSEC F10}Ed/Ex GrPt Enter
The program is currently prompting you to enter the Left Channel Bank Station. Using the information contained on the previous page, we know that our Left Channel Bank Station is 509. Therefore ...
7. Enter 509 and then Press <Enter>. (Notice that the 509 has been entered to the right of "CHANNEL BANK STATIONS:
Next you will see the Input / Output screen with a new prompt: SCREEN PROMPT - "Enter RIGHT Channel Bank Station and Press <Enter>"
Using the information for Cross-section 1, simply follow the screen prompts to input the required data, as follows:
SCREEN PROMPT - "Enter RIGHT Channel Bank Station and Press <Enter>" 8. Type 605 and then Press <Enter>.
SCREEN PROMPT - "Enter 9. Type .065 and then Press <Enter>.
SCREEN PROMPT - "Enter CHANNEL Manning's n Value and Press <Enter>" 10. Type .040 and then Press <Enter>.
SCREEN PROMPT - "Enter 11. Type .060 and then Press <Enter>.
SCREEN PROMPT - "Enter Discharge 12. Type 3000 and then Press <Enter>.
4-12
Step-Backwater Tutorial
>> STEP 0 POINTS GROUND ELEV STAT ELEV STAT ELEV STAT ELEV 496.9 512 498.0 509 499.1 425 505.0 504.7 1020 500.1 732 498.2 605 496.9
Right Left Right Channel Left VALUES: N Right Channel Left :Dschrg Expansn COEFFICIENTS: Contractn Kratio Top Wid Depth Froud# ChanVel Flow Regime
<Enter> and Press Channel Bank Station LEFT
Left".)
<Enter>" and Press LEFT Manning's n Value
<Enter>" and Press RIGHT Manning's n Value
<Enter>" and Press

QUICK-2 User's Guide
Your screen should now look like this:
XSEC ID: - BACKWATER << STAT 362 602
CHANNEL BANK STATIONS: 509.0 Right 605.0 MANNING'S 0.0650 Channel 0.0400 Right 0.0600 CHANNEL REACH LENGTHS: LOSS 3000 WS ELEV EG ELEV
F2}<- Back Tab F5}PRINT F6}SAVE F7}Main Menu F8}New XSEC F10}Ed/Ex GrPt TO BEGIN CALCULATIONS
The program is now ready to begin the calculations since all of the required data has been entered for the 1st cross-section of our step-backwater analysis. Note that even at this point, if any of the data on the screen has been typed in incorrectly, the user can simply press the <F2> key to toggle backwards through all of the input data, even back to the Ground Points. Remember that you can instantly go back to the Ground Points by pressing <F10>, also.
13. Press <Enter> to Begin the Calculations.
Your screen should now look like this:
XSEC ID: - BACKWATER << STAT 362 602
CHANNEL BANK STATIONS: 509.0 Right 605.0 MANNING'S 0.0650 Channel 0.0400 Right 0.0600 CHANNEL REACH LENGTHS: LOSS 3000 WS ELEV 501.03 Depth 4.13 Top Wid 385 Kratio 1.00 EG ELEV 501.32 Flow Regime M-1 ChanVel 5.10 Froud# 0.50
F2}<- Back Tab F5}PRINT F6}SAVE F7}Main Menu F8}New XSEC F10}Ed/Ex GrPt
As you can see from the screen, the (100-year) Water Surface Elevation (WS ELEV) has been computed (501.03), with other variables.
4-13
Step-Backwater Tutorial
>> STEP 0 POINTS GROUND ELEV STAT ELEV STAT ELEV STAT ELEV 496.9 512 498.0 509 499.1 425 505.0 504.7 1020 500.1 732 498.2 605 496.9
Left Left VALUES: N
Right Channel Left :Dschrg Expansn COEFFICIENTS: Contractn Kratio Top Wid Depth Froud# ChanVel Flow Regime
<Enter> Press
>> STEP 0 POINTS GROUND ELEV STAT ELEV STAT ELEV STAT ELEV 496.9 512 498.0 509 499.1 425 505.0 504.7 1020 500.1 732 498.2 605 496.9
Left Left VALUES: N
Right Channel Left :Dschrg Expansn COEFFICIENTS: Contractn

QUICK-2 User's Guide
Before we move on to enter the data for the next cross-section let's obtaina printout of this first calculation._ Press <F5>.
The screen prompt will be ...PRINT: Summary or Detailed?
Let's obtain a Detailed Printout ... Therefore ..._ Press D and then <Enter>.
Assuming your printer is turned on, the detailed printout will look this:
Cross Section: XLOB: 0
NLOB:
STAT 362.00 602.00
CWSEL Chan Vel Depth Discharge 501.03 5.10 4.13 3000
If any of the above variables are unfamiliar, a description of each isprovided in Appendix 1.
If you want to save the cross-section data to a different name and/ordirectory, before pressing <F8>, you can Press <F6>, F6}SAVE) toperform this.
Now we need to enter the data for the 2nd cross-section. Since we areentering a new cross-section (New XSEC), we need to ..._ Press <F8>.
Before the Screen changes you will notice that at the bottom of the screena message will briefly appear ...
SAVING TEMPORARY FILE This alerts you that your cross-section data has been saved to a filecalled T0.XSC, which is located in your C:\QUICK2\DATA directory.
4-14
Step-Backwater Tutorial
and <Enter>D or S Press
Press
like
0CE: 0CC: 0 XROB: 0 XLCH: 0
.06NROB: 605 STCHR: .04 NCHL: 509 STCHL: .065
ELEVSTAT ELEV STAT ELEV STAT ELEV 512.00 496.90498.00 509.00 499.10 425.00 505.00
1020.00 504.70500.10 732.00 498.20 605.00 496.90
QROBQCH QLOB ELMIN EG AROBACH ALOB KRATIO HV STAT-RST-MIDCH STAT-L Top Width HL
FlowRegimEG-Slope CH-Slope Froude # OL 5052003 493 496.90 501.317 265392 228 1.00 0.29
789.9557.0 404.4 385 0.00 ---0.0029 0.0000 0.50 0.00
( ,
C:\QUICK2\DATA\T0.XSC

QUICK-2 User's Guide Step-Backwater Tutorial
Your screen should be blank again as shown below:
XSEC ID: 0 >> STEP - BACKWATER << GROUND POINTS STAT ELEV STAT ELEV STAT ELEV STAT ELEV
CHANNEL BANK STATIONS: MANNING'S CHANNEL REACH LENGTHS: LOSS WS ELEV EG ELEV
F2}<-Back Tab F5}List Files F6}Retrieve File F7}Main Menu F10}Ed/Ex GrPt F3}Insert GrPt F4}Delete GrPt F1 }HELP
_ Following the method used before, for the 1st cross-section, enter the Ground Points one at a time, by their respective Station and Elevation for the 2nd cross-section using the data provided. Be sure to Press <Enter> after you have typed in each correct number.
_ Once you have entered all of the Ground Points correctly, remember to Press <F10> to Exit from entering Ground Point data .
_ Follow the on screen prompts to enter all of the other data.
Remember that if any of the data on the screen has been typed in incorrectly, the user can simply press the <F2> key to toggle backwards through all of the input data, even back to the Ground Points. (You can also Press <F10> to go back to the Ground Points immediately for editing).
After entering all the data your screen should now look like this:
XSEC ID: - BACKWATER << STAT 0
331
CHANNEL BANK STATIONS: 233.0 Right 334.0 MANNING'S 0.0550 Channel 0.0400 Right 0.0600 CHANNEL REACH LENGTHS: 450 Channel 450 Right 450 LOSS 0.1 Expansn 0.3 :Dschrg 3000 WS ELEV EG ELEV
F2}<- Back Tab F5}PRINT F6}SAVE F7}Main Menu F8}New XSEC F10}Ed/Ex GrPt TO BEGIN CALCULATIONS
Right Left Right Channel Left VALUES: N Right Channel Left :Dschrg Expansn COEFFICIENTS: Contractn Kratio Top Wid Depth Froud# ChanVel Flow Regime
>> STEP 450 POINTS GROUND ELEV STAT ELEV STAT ELEV STAT ELEV 500.9 236 502.2 233 504.8 150 510.0 510.1 591 505.5 402 501.8 334 500.9
Left Left VALUES: N Left
COEFFICIENTS: Contractn Kratio Top Wid Depth Froud# ChanVel Flow Regime
<Enter> Press
4-15

QUICK-2 User's Guide Step-Backwater Tutorial
The program is now ready to begin the calculations since all of therequired data has been entered for the 2nd cross-section of our step-backwater analysis._ Press <Enter> to Begin the Calculations.
Once the calculation is finished you may ..._Press <F5> to obtain a printout
Press <F6> to save the data to another name and/or directory_
Finally, to finish our analysis we need to enter in the data for the 3rdcross-section._ Press <F8>
Before the Screen changes you will notice that at the bottom of the screena message will briefly appear ...
SAVING TEMPORARY FILE C:QUICK2\DATA\T450.XSC
This alerts you that your 2nd cross-section data has been saved to a filecalled T450.XSC, which is located in your C:\QUICK2\DATA directory. Noticethat the 450, represents the channel distance between the 1st and 2ndcross-sections.
_ Following the method used before for the other cross-sections, enter theGround Points one at a time, by their respective Station and Elevation forthe 3rd cross-section using the data provided. Be sure to Press <Enter>after you have typed in each correct number.
_ Once you have entered all of the Ground Points correctly, remember toPress <F10> to Exit from entering Ground Point data .
_ Follow the on screen prompts to enter all of the other data.
After entering all the data for the 3rd cross-section ...
_Press <Enter> to Begin the Calculations.
Once the calculation is finished you may ...
_Press <F5> to obtain a printout
Press <F6> to save the data to another name and/or directory_
TO EXIT OUT OF THIS SCREEN NOW THAT OUR ANALYSIS IS COMPLETED ...
_ Press <F7>4-16

QUICK-2 User's Guide Step-Backwater Tutorial
You will see a screen prompt at the bottom ...
SUMMARY PRINTOUT: Press <F5>, otherwise Press <Enter>
To print a summary of the output for all 3 cross-sections then ...
_ Press <F5>, otherwise just Press <Enter>
The on screen Summary or the printed summary will look like this:
SECNO Q XLCH CWSEL FR# ELMIN AVG.VEL. AREA TOPWID 0 3000.0 0 501.03 0.50 496.90 3.39 885.0 385.5
450 3000.0 450 503.96 1.06 500.90 7.54 398.1 196.9 940 3000.0 490 508.54 0.71 504.80 4.95 606.5 286.2
If we carefully compare the Computed Water Surface Elevations (CWSELs) at each cross-section, to the topographic contours on Figure 1, we will see that the property is clearly higher than the CWSEL at every cross-section. Therefore this analysis with more detailed cross-section data has proven that the property has been inadvertently included in an unnumbered Zone A Special Flood Hazard Area.
Turn to the next page to continue
4-17

-----
QUICK-2 User's Guide Step-Backwater Tutorial
RUNNING HEC-2 USING QUICK-2 FILES {Tutorial Time: 5 minutes}
_ You will be prompted one more time to Press <Enter>. The next prompt willask you a question concerning running the HEC-2 or PLOT-2 programs.
Press Y and <Enter> to rerun w/HEC-2 or PLOT-2: If NO Press <Enter>
_ For purposes of this tutorial let's answer "Y" , (and Press <Enter>) torun the HEC-2 program. The next screen that will appear will include thefollowing:
To Run ---------QUICK-2 HEC-2 AUTOHEC-2 PLOT-2 VIEW/PRINT
_ Type AH2 and Press <Enter>.
Type
Q2H2
AH2P2
LIST
Once the HEC-2 run is complete it will return you to the above-mentioned screen.
NOTE: Typing AH2 runs the HEC-2 program automatically using the QUICK-2 generated HEC2.DAT, HEC-2 data file.
If you are using a HEC-2 data file other than HEC2.DAT, then Type H2 and Press <Enter>. Follow the directions on the screen for naming the Input, Output
_ Type LIST and Press <Enter>, and then enter your output filename, (Default is HEC2.OUT), to view the results. Note that you move up, down and across the screen using the <Page UP>,<Page Down>, the cursor keys, etc.
_ To Print the data that appears on the screen simply Press P.
_ To Exit from the screen simply Press X or the Escape key.
If you would like to complete the next tutorial example, then
Type Q2 and Press <Enter>; and, turn to the next page.
4-18
and Tape95 files; pressing <Enter> after each filename is typed in.

QUICK-2 User's Guide Step-Backwater Tutorial
RERUNNING USING SAVED CROSS-SECTION FILES{Tutorial Time: 5 minutes}
Let's say that in the analysis that was performed in the previous tutorial,we want to change the discharge from 3000 to 5000, and run the step-backwater option again with the same cross-sections. This is quite easilydone. Just follow the steps as shown below.
1. At the Main Menu Screen Type 4 and Press <Enter>
2. At the Starting Water Surface Elevation Method ScreenType .0029 and Press <Enter>
3. At the Input/Output Screen Press <F6> to retrieve a saved cross-section file
Assuming your 1st cross-section file is stored as C:\QUICK2\DATA\T0.XSC
Type C and Press <Enter> when prompted for the directoryType QUICK2\DATA & Press <Enter> when prompted for the subdirectoryType T0 and Press <Enter> when prompted for the filename
4. Press <F2> to toggle back to the "Enter Discharge" prompt
5. Type 5000 and Press <Enter> to enter the new discharge
6. Press <Enter> to Begin the Calculations
7. Press <F8> to input another cross-sectionPress <F6> to retrieve a saved cross-section file
Assuming your 2nd cross-section file is stored as C:\QUICK2\DATA\T450.XSC
Type C and Press <Enter> when prompted for the directoryType QUICK2\DATA & Press <Enter> when prompted for the subdirectoryType T450 and Press <Enter> when prompted for the filename
8. Press <F2> to toggle back to the "Enter Discharge" prompt
9. Type 5000 and Press <Enter> to enter the new discharge
10. Press <Enter> to Begin the Calculations
4-19

QUICK-2 User's Guide Step-Backwater Tutorial
11. Press <F8> to input another cross-section
Press <F6> to retrieve a saved cross-section file
Assuming your 3rd cross-section file is stored as C:\QUICK2\DATA\T940.XSCType C and Press <Enter> when prompted for the directoryType QUICK2\DATA & Press <Enter> when prompted for the subdirectoryType T940 and Press <Enter> when prompted for the filename
12. Press <F2> to toggle back to the "Enter Discharge" prompt
13. Type 5000 and Press <Enter> to enter the new discharge
14. Press <Enter> to Begin the Calculations
_ Press <F7> to Exit out of the screen
_ Press <F5> to obtain a summary printout
_ Press <Enter> twice to get back to the main menu
_ Press <F10> to leave the program
Q.E.D.
4-20

QUICK-2 User's Guide
CHANNEL CAPACITY OPTION WITH THE RATING CURVE PLOT{Tutorial Time: 5 to 10 minutes}
Let's say that we need to determine a Base Flood Elevation (BFE) for theproperty shown in Figure 1. We do not want to exempt the entire propertyfrom the flood plain, only a structure which is located in the middle ofthe property. Therefore, we can use one cross-section (the 2nd cross-section (T450.XSC) from our previous tutorial and shown on Figure 1), tocompute a BFE.
Let's assume that we know the discharge is between 3000 cfs and 4000 cfsbased on our best estimates.
Let's assume our structure does not have a basement; the lowest adjacentgrade (LAG) to the house is at elevation 510 NGVD; and the first floorelevation (FFE) is 510.5 NGVD.
Let's determine the maximum carrying capacity of the floodplain using adepth equal to the lowest adjacent grade (510.0) minus the minimum streamelevation (500.9). For purposes of this example we'll use a depth of 9 feet(510-501).
To perform a channel capacity calculation we also need to know thedownstream information on page 15. Slope = 500.9 - 496.9 / 450 = .0089.
The graphic below sums up our situation so far:
”””””””””””””””””” | |____ ‹ FFE = 510.5 \ % ‹ LAG = 510.0 \____ WSE = ? / › \ / \ Q=3000 - 4000 / 9.1' \ / \ /___________fl____Stream Invert = 500.9 Slope = .0089
Follow the steps as shown on the next page to compute the rating curve
...
4-21
Channel Capacity Tutorial
thefrom compute to easy is case this in which slope,
____\/

QUICK-2 User's Guide
1. At the Main Menu Screen Type 2 and Press <Enter>
2. At the Shape of Cross Section Screen Type I and Press <Enter>
3. At the Input/Output Screen Press <F6>
We are using the 2nd cross-section file stored as C:\QUICK2\DATA\T450.XSC
Type C and Press <Enter> when prompted for the directory Type QUICK2\DATA & Press <Enter> when prompted for the subdirectory Type T450 and Press <Enter> when prompted for the filename
4. Type .0089 and Press <Enter> to enter the slope
5. Type 9 and Press <Enter> to enter the depth
6. Press <Enter> to Begin the Calculations
7. Press <F4> to Plot to screen .... Press <F5> to Print
Looking at the rating curve plot we can see that for a discharge range ofbetween 3000cfs - 4000cfs the BFE ranges from about 504.3 to 504.8. Sinceour lowest adjacent grade and first floor elevation are at or above 510, itis clear that this structure is above the BFE.
”””””””””””””””””” | |____ ‹ FFE = 510.5 \ ‹ LAG = 510.0 \____ WSE = 504.3-504.8 / › \ / \ Q=3000 - 4000 / \ / \ /___________fl____Stream Invert = 500.9 Slope = .0089
8. Press <Enter> to continue
9. Press <F7> to go back to the Main Menu
10. Press <F10> to Exit the program4-22
Channel Capacity Tutorial
____%
9.1'

QUICK-2 User's Guide PLOT-2 Tutorial
PLOT-2
In general PLOT-2 will only work on QUICK-2 files that have been converted into HEC-2format using QUICK-2's Step-Backwater option.
Profile plots from PLOT-2 will work only if the QUICK-2 generated data file (HEC2.DAT) isalso run using the HEC-2 program (see Running HEC-2 Using QUICK-2 Files, page 4-18), sincea HEC2.T95 file needs to be generated by the HEC-2 program for use by PLOT-2.
PLOT-2 Cross-section plots can be generated using the QUICK-2 generated data file(HEC2.DAT) even if it is not run with HEC-2. However, the Cross-section plot will not showthe computed water surface elevation (CWSEL) unless the QUICK-2 HEC2.DAT file is run withHEC-2, since the CWSEL is found on the HEC2.T95 file.
Note that the user can compute a normal depth elevation for only one cross-section andhave that cross-section plotted by choosing the Step-Backwater option and the Normal Depthstarting water surface elevation method. Once the computation is finished, the user simplyexits (Presses <F7>), and the QUICK-2 program automatically creates the HEC2.DAT file forthat one cross-section, which can be used by the PLOT-2 program.
Let's say that we want to view the water surface elevation profile and thecross-section plots from our previous tutorial on the Step-Backwateroption.
_ From the QUICK-2 Title screen Press P2
_ You are now into the PLOT-2 program, Press <Enter> to continue
PROFILE PLOT {Tutorial Time: 5 to 10 minutes}
1. Let's view the profile first. Press 1 from the PLOT-2 main menu selection
2. Cursor to the HEC2 Tape95 file name entry and Type ?
This will list all of the data files in the QUICK-2 directory. T95 filesare designated with the 3 letter extension .T95 . Therefore cursor over tohighlight that file (HEC2.T95) and Press <Enter>.
3. Move up to highlight the Plot profiles entry and Press <Enter>.
4. Your profile is now plotted. Pressing <Enter> moves you back to theProfile plots main menu screen. You can explore the different Profile andPlotting options and replot the profile if you wish.
5. When you are finished plotting, highlight the Return to main menumessage and Press <Enter>
4-23
QUICK-2 User's Guide PLOT-2 Tutorial
CROSS-SECTION PLOT {Tutorial Time: 5 to 10 minutes}
1. From the PLOT-2 main menu Press 2 from the menu selection.
2. Cursor down to the HEC2 input file name entry and Type ?
This will list all of the data files in the QUICK-2 directory. Input filesare designated with the 3 letter extension .DAT . Therefore cursor over tohighlight that file (HEC2.DAT) and Press <Enter>. If we want to view adifferent data file than that of the profile we previously viewed, we wouldhave to specify a different file here before proceeding.
3. Cursor down to the HEC2 Tape95 file name entry
Note that we do not have to re-enter this file since we have alreadyentered it previously. If we want to view a different Tape95 file than thatof the profile we previously viewed, we would have to Type ?, and thenspecify a different file here before proceeding.
4. Move up to highlight the Plot cross sections entry and Press <Enter>.
5. You now have the option of printing all or selected cross sections fromyour data file. Press Y for plotting all, or N for plotting selected crosssections.
Your first cross-section is now plotted. Pressing <Enter> moves you back tothe Cross-section plots main menu screen or plots additional cross-sectionsdepending on how many cross-section plots you have. You can explore thedifferent Cross-section and Plotting options if you wish.
6. Highlight the Return to main menu message and Press <Enter>
Pressing 4 at the PLOT-2 main menu exits you from PLOT-2 and back to theQUICK-2 title screen.
Note: To use PLOT-2 and to access data files that are in another directory(i.e., they are not in the C:\QUICK2 directory), just change to that datadirectory (i.e., CD\dirname) and access PLOT-2 by typing C:\QUICK2\PLOT2(or A:\PLOT2 if using the program from the floppy drive) from that datadirectory.
4-24

Chapter 5: FORMULAS
Critical Depth
Channel Capacity
Normal Depth
Step-Backwater
5-1

QUICK-2 User's Guide Critical Depth Formulas
1. CRITICAL DEPTH
In every cross-section for a given discharge there exists a critical depth, where theenergy grade (depth of water plus velocity head - V2/2G) is at a minimum. Increasing thedischarge above this given discharge will force the flow into the super-critical regime.Discharges below the given discharge will remain in the sub-critical regime.Super-critical depths will be lower than the critical depth, and sub-critical depths willbe above the critical depth. Super-critical flow is characterized by small water depthswith large velocity heads; while, sub-critical flow is characterized by large water depthswith small velocity heads. A rule of thumb used to determine critical depth is that whenthe Velocity Head equals 1/2 the hydraulic depth (Area/Topwidth) critical flow isprobable.
A formula which can be used to approximate critical depth (Dc) isgiven below.
Qc2 / g = A3 / T
Where Qc is the discharge (in cfs) based on critical depth, g is the gravitationalconstant (32.15 feet/second squared), A is the cross-section area (in square feet), and Tis the top width of the water surface (in feet). Note: for rectangular channels the aboveequation can be reduced so that
D = (Qc/5.67 T).667.c
The more exact way to compute critical depth (minimum specific energy) is to find aspecific depth of water within a cross-section for a given discharge which produces thelowest energy grade. The following represents the process that the Critical Depth optionof QUICK-2 goes through to calculate critical depth.
After the cross-section information (ground points, channel stations, etc.) has been inputthe program starts computing the water surface elevation (WSE) and corresponding energygrade elevation (EG) at a depth of 0.1 foot above the lowest elevation in thecross-section. It continues to calculate WSE and EG at intervals of 0.5 foot. As the depthof water in the cross-section increases the EG will decrease. At one point the EG willbegin to increase. This means that between the last 0.5 foot interval there exists aminimum energy grade. Once this has occurred the program decreases the WSE in intervals of.02 foot. As the depth of water decreases in the cross-section the EG will also decreaseas it approaches the minimum specific energy. At one point the EG will begin to increaseagain.
This means that between the last .02 foot interval critical depth exists. At this pointthe screen will display the actual critical water surface elevation (along with othervariables) by assuming that the next to the last iteration was the critical depth.
The calculations performed by the program for a given cross-section are listed on the nextpage. The calculations include the iterations that the program goes through to arrive atcritical depth.
5-2

QUICK-2 User's Guide Critical Depth Formulas
ELMIN = 92.5 WSE = 92.6 Qc= 6.026845E-02 Q= 260 EG=466080.8 EG Decreasing
WSE= 93.1 Qc= 5.314738 Q= 260 EG=452.6406 - | WSE= 93.6 Qc= 24.18726 Q= 260 EG=125.4259 - | WSE= 94.1 Qc= 61.71717 Q= 260 EG=101.21 - | WSE= 94.6 Qc= 121.451 Q= 260 EG=96.99928 - | WSE= 95.1 Qc= 204.4488 Q= 260 EG=96.14474 - v WSE= 95.6 Qc= 311.15 Q= 260 EG=96.14897 + EG Increasing
Therefore Minimum Specific Energy is between WSE's of 95.1 and 95.6. Note also that theDischarge (Q = 260) is also within the computed Critical Discharge (Qc) range of 204 -311.
WSE= 95.58 Qc= 306.5006 Q= 260 EG=96.14179 - EG Decreasing WSE= 95.56 Qc= 301.8821 Q= 260 EG=96.13499 - | WSE= 95.54 Qc= 297.2962 Q= 260 EG=96.12863 - | WSE= 95.52 Qc= 292.7447 Q= 260 EG=96.12271 - | WSE= 95.50 Qc= 288.2256 Q= 260 EG=96.11724 - | WSE= 95.48 Qc= 283.737 Q= 260 EG=96.11225 - | WSE= 95.46 Qc= 279.2825 Q= 260 EG=96.10776 - | WSE= 95.44 Qc= 274.8583 Q= 260 EG=96.1038 - v WSE= 95.42 Qc= 270.4678 Q= 260 EG=96.10038 - | WSE= 95.40 Qc= 266.1075 Q= 260 EG=96.09752 - | WSE= 95.38 Qc= 261.7806 Q= 260 EG=96.09525 - | WSE= 95.36 Qc= 257.4854 Q= 260 EG=96.09361 - | WSE= 95.34 Qc= 253.22 Q= 260 EG=96.09262 - | WSE= 95.32 Qc= 248.986 Q= 260 EG=96.09199 minimum v
WSE= 95.30 Qc= 244.76 Q= 260 EG=96.09271 + EG Increasing
We assume that ... Critical Depth = 95.32', Minimum Specific Energy = 96.09199'
The Froude number would be, Q / Qc, or 260 / 248.986 = 1.04.
It is not unusual for the Froude number to not equal exactly 1.0, since the calculation ofcritical discharge using the formula Qc2 / g = A3
is exactly at the True minimum specific energy. / T, does not always yield a WSE that
You should notice from the above tabulation, that as you approach critical depth (minimumspecific energy), for very small changes in EG there are large jumps in the water surfaceelevation. The EG is only changing by .001' to .003' while the WSE changes by .02'. A0.01' difference in EG can cause a 0.10' change in WSE.
5-3

QUICK-2 User's Guide Channel Capacity Formulas
2. CHANNEL CAPACITY
In this option, a Normal Depth elevation (see 3. NORMAL DEPTH) is input and the programcomputes the corresponding discharge. (In the Normal Depth option, the discharge is inputand the program computes a normal depth elevation). The Manning's equation is used as theformula for determining the (normal) discharge.
Q = 1.486 A (R.667) S.5 / N
Where Q is the discharge (in cfs), A is the cross-section area (in square feet), R is thehydraulic radius (in feet), S is the energy slope (in feet/feet), and N is the Manning'sroughness value.
After the cross-section information (ground points, channel stations, streambed slope,normal depth elevation(s), etc.) has been input, the program simply solves for the area(A) and hydraulic radius (R) below the normal depth elevation (specified by the user) andcomputes the (normal) discharge directly using the Manning's equation. This is not aniterative process. The screen will display the (normal) discharge (which represents thechannel capacity) along with other variables.
5-4

QUICK-2 User's Guide Normal Depth Formulas
3. NORMAL DEPTH
The standard formula for determining normal depth in a cross-section is the Manning'sformula. Water is flowing at normal depth when the energy grade and the hydraulic grade(water surface) slopes are the same as the stream bed slope. Normal depth profiles occur,in general, when the flow is uniform, steady, one-dimensional, and is not affected bydownstream obstructions or flow changes. The standard Manning's equation is:
Q = 1.486 A (R.667) S.5 /N
Where Q is the discharge (in cfs), A is the cross-section area (in square feet), R is thehydraulic radius (in feet), S is the energy slope (in feet/feet), and N is the Manning'sroughness value.
The exact method for computing normal depth for a given discharge at a particularcross-section, is to assume that S is equal to the downstream streambed slope and to solveiteratively for the depth (this obviously assumes N is known). The following representsthe process that the Normal Depth option of QUICK-2 goes through to calculate normaldepth.
After the cross-section information (ground points, channel stations, discharge, streambedslope, etc.) has been input, the program starts computing discharge using the Manning'sequation at an initial depth of 0.1 foot above the lowest point in the cross-section, andfrom that point in 0.5 foot intervals. At some point, the computed discharge will exceedthe given target discharge. The program then uses a converging technique to compute adischarge (with a corresponding normal depth) that is within 1% of the given discharge. Atthis point the screen will display the actual normal depth water surface elevation (alongwith other variables).
The calculations performed by the program for a given cross-section are listed below. Thecalculations include the iterations that the program goes through to arrive at normaldepth.
ELMIN= 92.5 WSE = 92.6 Q= 260 Computed Q= .023579
WSE= 93.1 Q= 260 Computed Q= 2.803083 WSE= 93.6 Q= 260 Computed Q= 14.11313 WSE= 94.1 Q= 260 Computed Q= 38.33264 WSE= 94.6 Q= 260 Computed Q= 80.01045 WSE= 95.1 Q= 260 Computed Q= 146.9773 WSE= 95.6 Q= 260 Computed Q= 245.9516
WSE= 96.1 Q= 260 Computed Q= 369.2461
WSE= 95.65697 Q= 260 Computed Q= 258.7531
below target Q
belowbelowbelowbelowbelowbelow
above target Q
within 1%
We assume that ... Normal depth = 95.66 for a Discharge (Q) of 260 cfs
5-5

a
a ----
QUICK-2 User's Guide Step-Backwater Formulas
4. STEP-BACKWATER
The Energy Equation which represents one-dimensional, uniform, and steady flow in openchannels is shown below.
(1) WSEd + HVd = WSEu + HVu + HL + OL
Where WSEd is the water surface elevation at the downstream cross-section, HVd is thevelocity head at the downstream cross-section, WSEu is the water surface elevation at theupstream cross-section, HVu is the velocity head at the upstream cross-section, HL is thefriction loss between the two cross-sections, and OL is the eddy (contraction orexpansion) loss between the two cross-sections.
Velocity Head, HV, is calculated as follows:
HV = (a) V2 / 2g
Where (a) is alpha the velocity coefficient, V is velocity (Q/A), and g is the gravitational constant. Alpha (a) is calculated as follows:
(A2) |Kl3 Kc3 Kr3 | (a) = |--- + --- + --- |
(K3) |Al2 Ac2 Ar2 |
Where A and K are the total area and conveyance below the water surface, respectively; andKl, Kc, Kr and Al, Ac, Ar, are the conveyance and area in the left overbank, channel, andright overbank, respectively.
Friction Loss, HL, is calculated as follows:
HL = Lw ( Qd + Qu )2 / ( Kd + Ku )2
Where Lw is the discharge weighted reach length between cross- sections, Qd is thedischarge at the downstream cross-section, Qu is the discharge at the upstream crosssection, Kd is the conveyance at the downstream cross-section, and Ku is the conveyanceat the upstream cross-section. This is derived from the Average Conveyance Friction slopeequation.
The Discharge Weighted Reach Length, Lw, is calculated as follows:
Lw = {(Ll * Ql) + (Lc * Qc) + (Lr * Qr)} / Qa
Where Qa is the average total discharge between cross-sections; and, Ll, Lc, Lr, and Ql,Qc, Qr, represent the reach length and average discharge between cross-sections for theleft overbank, channel, and right overbank, respectively.
Eddy Loss, OL, is calculated as follows:
OL = (Ce or Cc) * ABS |HVd - HVu|
Where Ce is the expansion coefficient, Cc is the contraction coefficient, HVd is thevelocity head at the downstream cross-section, and HVu is the velocity head at theupstream cross-section. When HVu is greater than HVd Ce is utilized. When HVu is greaterthan or equal to HVd Cc is utilized.
5-6

QUICK-2 User's Guide Step-Backwater Formulas
After the cross-section information for the first cross-section has been input, either aknown water surface elevation is input to start the calculations or the water surfaceelevation could have been determined by the Normal or Critical Depth options or by anothersource or method. The program then computes all pertinent variables for the firstcross-section that will be needed for an energy balance with the next upstreamcross-section. After this the user must put in the appropriate information for the nextcross-section (i.e., ground points, channel stations, reach lengths, contraction andexpansion coefficients, etc.). Once this is done the program performs a series of trialiterations to make sure that the Energy Equation (1) listed previously will balance towithin .014 foot. The sequence of trial elevations is listed below.
1ST TRIAL:
Uses the depth of water (DP) of the previous cross-section added to the lowest elevation(ELMIN) within the current cross-section. If DP + ELMIN is less than the previous WSE(i.e., adverse slope condition) then the program uses the previous WSE for the 1st trialat the current cross-section.
2ND TRIAL:
Uses the average of the computed WSE and the WSE assumed in Trial number 1.
3RD TRIAL AND ON ...:
Uses a formula designed to help converge quickly to balance the energy equation as shownbelow:
Trial WSE = WSE-(WSE+HV-DG-HL-OL)/(1-((Q/QC)2)+((1.5*HL)/(A/W)))
Where WSE, HV, HL, OL, QC, A, and W are the latest computations of water surfaceelevation, velocity head, friction loss, eddy loss, critical discharge, total area, andtotal wetted perimeter, respectively; and, DG is the computed energy grade elevation fromthe previous cross-section; and, Q is the discharge at the current cross-section.
For most energy balances between cross-sections that are not at or near critical flow, theprogram will balance the energy equation within 5 trials.
The calculations performed by the program for an energy balance between two cross-sectionsare listed below. The calculations include the iterations that the program goes through toarrive at the energy balance.
WSE WSEAssumed Calculated Difference Trial #98.75 98.32489 +.4251099 198.53744 98.32472 +.2127228 298.32476 98.32513 -.00037 3
We assume that the correct WSE = 98.32
Note: Energy balance in this case was accurate to .00037 foot.
5-7

QUICK-2 User's Guide Definition of Variables
Appendix 1: Definition of Variables
ACH - Area within the specified channel below the water surface elevation
ALOB - Area within the specified left overbank below the water surface elevation
AROB - Area within the specified right overbank below the water surface elevation
ALPHA - Velocity head coefficient
AREA or Area - Total area within the cross-section below the water surface elevation
AVG.VEL or Velocity - Average Velocity within the entire cross-section
Base Width - Channel bottom width of a trapezoidal or rectangular cross-section
Bottom Width - Channel bottom width of a trapezoidal or rectangular cross-section
CC - Contraction Coefficient
CE - Expansion Coefficient
CH-SLOPE - Slope of the streambed, Channel Slope
CHAN-VEL or ChanVel - Velocity within the main channel of cross-section
Critical Slope - Slope of the Energy Grade line at Critical Flow
CWSEL - Computed water surface elevation within a cross-section
Depth - Max depth of water in the cross-sect as measured below the water surface elevation
Diameter - Width or Height of a circular pipe
Discharge - The rate of the flow of a volume of water within a cross-section, usuallyexpressed in cubic feet per second (cfs)
EG or EG ELEV - Energy grade elevation, expressed as, WSE + HV
EG-Slope - Energy grade slope
ELEV - Elev of a ground pt of a cross-sect, as ref to some datum (i.e., NGVD, NAVD, etc.)
ELMIN - Lowest elevation in a cross section
Flow Regime - Type of water surface profile (Supercritical regimes are not computed)M1: EG-Slope <= Ch-Slope and FR# < .8 M2: EG-Slope > Ch-Slope and FR# < .8C1: EG-Slope <= Ch-Slope and FR# >= .8 C3: EG-Slope > Ch-Slope and FR# >= .8
Flow Type - either, Supercritical, Critical or Subcritical
Froude#, Froude No., Froud# or FR# - Froude number, used to determine the flow type(i.e., sub- (FR# < 1), critical (FR# = 1) or super-critical (FR# > 1) flow)
HL - Friction loss between cross sections
HV - Velocity head
Hyd Radius or Hyd R - Hydraulic Radius: equal to (Area / Wet Perimeter)
A-1

QUICK-2 User's Guide Definition of VariablesKRATIO - Ratio of upstream total conveyance to downstream total conveyance
L Side Slope - Ratio of the slope of the left side of a channel in terms of Horizontaldistance in feet to 1 foot Vertical.
Manning's n - Coefficient used to account for the friction caused by earthen, vegetative,and/or man-made surfaces within a floodplain cross-section.
Max Discharge - The maximum flow possible within a circular pipe, (usually occurring at.94 * Diameter).
NCHL, NLOB, NROB - Manning's "N" value for the specified channel, left overbank, and rightoverbank, respectively.
OL - Expansion/contraction loss
Q - Total discharge in the cross-section
QC - Critical discharge within entire cross-section for a specific water surface elevation
QCH - Discharge within the specified channel of a cross-section
QIC - Critical discharge within the entire cross-section for a specific water surfaceelevation, assuming that critical flow is limited to the channel, even if flow isoccurring in the overbanks
QLOB, QROB - Discharge within the specified left overbank, and right overbank,respectively, of a cross-section
R Side Slope - Ratio of the slope of the right side of a channel in terms of Horizontaldistance in feet to 1 foot Vertical.
SECNO - Cross section number or identifier
Slope or EG-Slope - Energy grade slope
STAT-L, STAT-R - Station, within a cross-section, of the left edge, and right edge,respectively, of the water surface
STAT - Station of a ground point of a cross-section
STCHL, STCHR, ST-MIDCH - Station of the left bank, right bank, and mid-point,respectively, of a cross-section
Top Width or Top Wid - Top width of the water surface within a cross-section
Velocity - Average Velocity within the entire cross-section
Wet Perimeter or Wet Per - actual width of ground within a cross-section below the watersurface elevation.
WS ELEV or CWSEL - Water surface elevation within a cross-section
XLCH, XLOB, XROB - Distance between cross-sections as measured along the channel, leftoverbank, and right overbank, respectively.
A-2

NOTES

Appendix 7
Hydraulic Computer Manuals
HEC-2
U.S. Army Corps of Engineers, Hydrologic Engineering Center (HEC), "Water Surface Profiles, HEC-2, User's Manual," Davis, California, 1991.
HEC-RAS
U.S. Army Corps of Engineers, Hydraulic Engineering Center (HEC), "HEC-RAS, River Analysis System, User's Manual - Draft," BETA 2 Test Version, Davis, California, February 1995.
PSUPRO
Federal Emergency Management Agency, "PSUPRO Encroachment Analysis User's Manual", Washington, D.C., 1989.
SFD
Federal Emergency Management Agency, "Simplified Floodway Determination Computer Program User's Manual", Washington, D.C., 1989.
WSPRO
U.S. Geological Survey, "Water Surface PROfiles, WSPRO, User's Manual, Reston, Virginia, 1990.
WSP2
U.S. Department of Agriculture, Natural Resources Conservation Service, "WSP2 Computer Program User's Manual", Technical Release No. 61, Washington, D.C., 1976.
A7-1

Appendix 8
Normal Depth Hand Calculation
A8-1

Appendix 8 - continued
Normal Depth Hand Calculation
A8-2

Appendix 8 - continued
Normal Depth Hand Calculation
A8-3

Appendix 9
Weir Flow Hand Calculations
A9-1

Appendix 9 - continued
Weir Flow Hand Calculations
A9-2

Appendix 9 - continued
Weir Flow Hand Calculations
A9-3

Appendix 9 - continued
Weir Flow Hand Calculations
A9-4

Appendix 10Worksheet
Base Flood Elevations in Zone A Areas
Community Name:__________________________________________
Community ID# :__________________Panel #:_________ FIRM Date:_________________
Project Identifier :__________________________________________________________
This request is for: Existing Single Lot [ ]
Other ___________________________________________________
-----------------------APPROACH USED TO DEVELOP THE BASE FLOOD ELEVATION (BFE)-----------------
EXISTING DATA Available
FEMA Federal Other
SIMPLIFIED
DETAILED Hydraulics Normal Depth [ ]
Other_______________________________________________________
Hydrology Regression Equations [ ] Discharge-Drainage
Other_______________________________________________________
Topography Topographic Map [ ]
Map Scale: 1" = ________'
Field Survey tied to Datum?
Datum:
# Cross-Sections
------------------------------------------RESULTS-------------------------------------------
BFE
First Floor Elevation
Lowest Adjacent Grade to Structure
Lowest Grade N/A
State:__________
>5 acres [ ] <5 acres [ ] [ ] Proposed [ ] >50 lots [ ] <50 lots [ ] Multi-Lot [ ]
Did Not Check Not Available [ ] [ ] [ ] [ ] [ ] [ ] [ ] [ ] [ ]
[ ] Data Extrapolation Contour Interpolation [ ]
Culvert Flow [ ] Weir Flow [ ]
Rational Formula [ ] [ ] TR-55 [ ]
Field Survey [ ] or
Contour Interval: _______'
N/A NO YES
Other___________________________ NGVD 1929 [ ]
Length of Stream _______________ ft. ] [
__________ Depth of 100-year Flood or
__________ Depth or
__________
__________ entire Property on
A10-1