Embed Size (px)
Citation preview

Managing Brand
Communication in the “Push and Pull” Marketplace
Managing Brand Communication in the
“Push and Pull” Marketplace Don Schultz and Martin Block
Northwestern University At
Third EFCCE Conference Vienna
15 May, 2009

Brand Comm Models Have Been Based on Traditional, Outbound,
Marketer-Controlled Systems
Brand Comm Models Have Been Based on Traditional, Outbound,
Marketer-Controlled Systems
All Outbound and All Marketer Controlled All Outbound and All Marketer Controlled
Research → Media → Sales Force
Marketer Consumer/ Prospect
Messages and Incentives
Products/Services

In the 1990s Technology Changed Brand Communication…Forever
In the 1990s Technology Changed Brand Communication…Forever
Internet – WiFi
Mobile Telephony
iPods/MP3 -- podcasts
Search Engines
Cable/satellite
Blocking systems - TIVO/DVRs/ Filters/Pop-up Blockers/etc.

Today, We Live in a “Push-and-Pull” System Today, We Live in a
“Push-and-Pull” System
Word-of-Mouth New Media Forms
Web Search
Em
plo
yees
/Rec
om
men
der
s/F
rien
ds/
Infl
uen
cers
Competitors
Competitors
Competitors
Competitors
Research → Media → Sales Force
Marketer Customers/Prospects
Messages and Incentives
Products/Services

In a “Push and Pull” System, Consumption Is More Critical Than
Distribution
In a “Push and Pull” System, Consumption Is More Critical Than
Distribution

Response
Media Exposure
Media Exposure
Media Exposure
MediaConsumer
Potential SynergyVia Simultaneous Media Usage
(Messages Reinforced)
Potential Fragmentation Of Attention
(Message Impact Diluted)
Foreground/Background Media
Time Allocated To Each Media Form
Estimating Media Consumption Estimating Media Consumption
SIMM - Simultaneous Media Consumption Studies
SIMM - Simultaneous Media Consumption Studies
A method of understanding how consumers use and consume media today
Methodology Conducted twice per year in the U.S. since 2002. In China
quarterly since 2006 14 separate waves in the U.S. (15th in field now) 200,000+ individual responses (17,000 more in Wave 15) Drawn from on-line interactive base of 60 million individuals in U.S. Double opt-in methodology Captures media usage, retailer preference, influence of media, past
and future purchases, etc. Includes 31 media forms – both online and offline Accuracy at .01 level Benchmarked to non-online studies Weighting and balancing of 14 Census 2000 age-sex cells
Being developed and implemented in Mexico, Australia, etc.
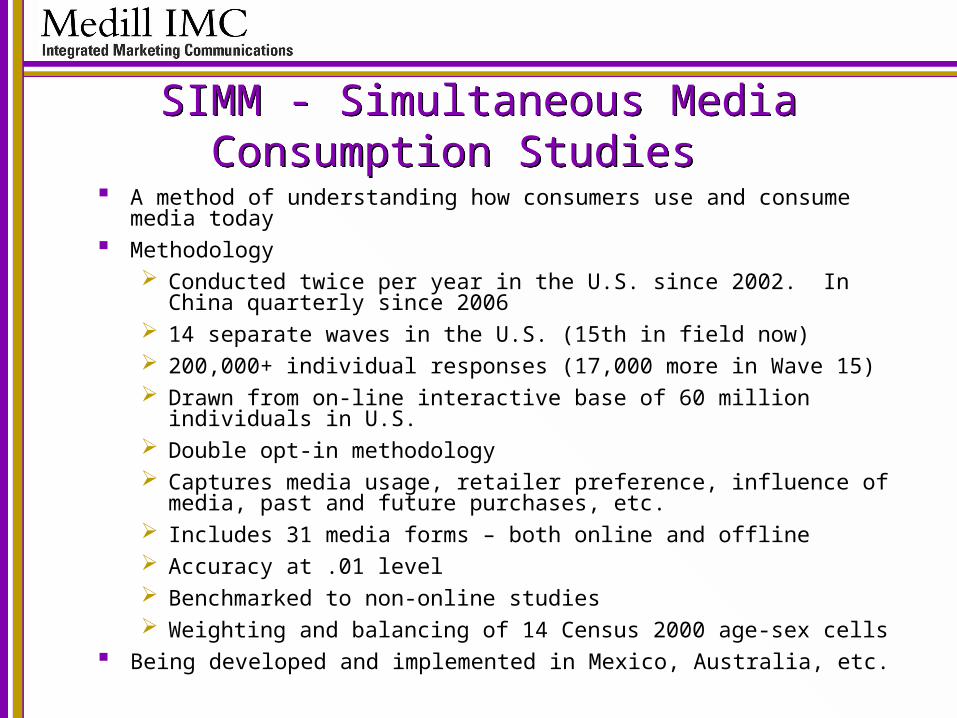
U.S. Average Personal Media Consumption
First Half 2008 – BIGresearch, Inc.
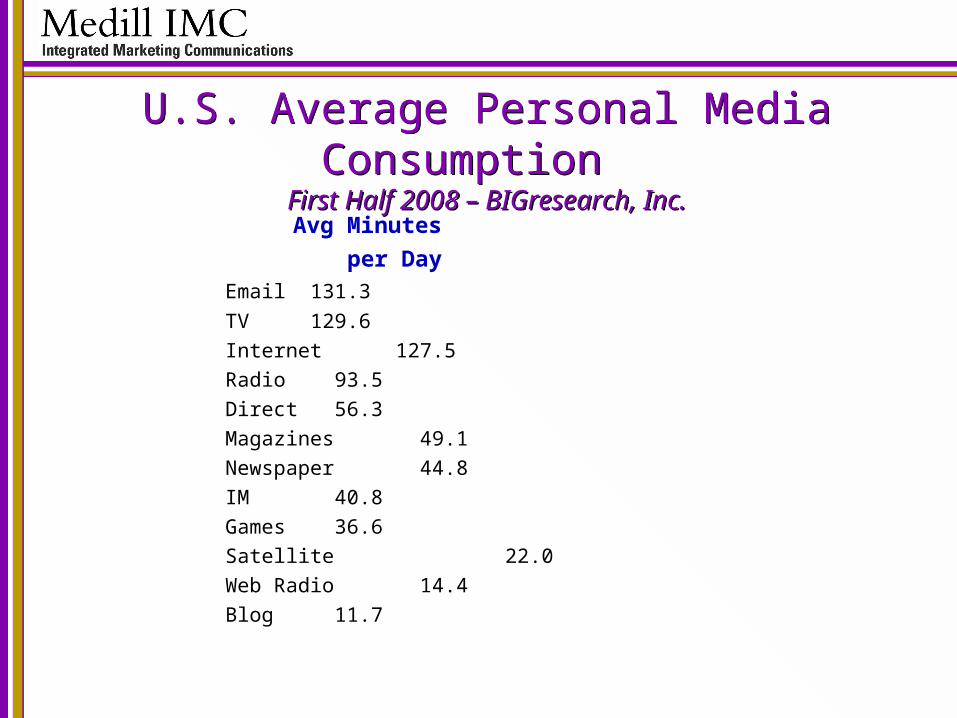
U.S. Average Personal Media Consumption
First Half 2008 – BIGresearch, Inc. Avg Minutes
per Day
Email 131.3
TV 129.6
Internet 127.5
Radio 93.5
Direct 56.3
Magazines 49.1
Newspaper 44.8
IM 40.8
Games 36.6
Satellite 22.0
Web Radio 14.4
Blog 11.7

US Media Combinations US Media Combinations Primary Medium (When …,do you simultaneously ….)
(Regularly only)
Source: 1st Quarter, 2008 – BIGresearch, Inc.
Online TV Maga-zines
News-papers
Direct Mail
Cell Phone
Radio
Online 26.2 6.1 8.1 9.9 13.9 17.1
TV 37.5 20.2 24.1 21.4 14.9 8.0
Magazines 7.0 10.3 5.0 8.3
Newspaper 10.3 11.6 4.7 11.3
Direct Mail 21.0 14.2 6.7 10.7
Radio 21.7 3.8 11.8 12.6 12.2 11.7

Purchase Intent and Media Influence Purchase Intent and Media Influence Do you plan to make a computer purchase within the next 6 months by Media Influence - Yes – 84.81 No – 15.19
No Yes Total
Coupons 26.8 31.0 27.4
Inserts 20.6 25.0 21.3
Newspapers 19.8 24.7 20.5
TV 19.2 26.8 20.3
In-Store 18.3 23.3 19.1
Direct 18.2 23.1 18.9
Magazines 15.6 22.7 16.7
Cable 12.3 19.3 13.3
Radio 11.7 18.5 12.7
Internet 10.6 19.3 11.9
Email 10.4 16.8 11.4
Yellow Pages 6.5 10.5 7.1
Outdoor 6.3 11.0 7.0

Pruned CHAID TreePlan to Buy a Computer by Categories of Media
Influence
Pruned CHAID TreePlan to Buy a Computer by Categories of Media
Influence
14.9%(100.0%)
11.2%(60.9%)
17.6%(18.8%)
23.3%(21.1%)
14.9%(17.9%)
17.7%(6.4%)
19.6%(12.6%)
15.2%(4.7%)
22.2%(7.9%)
20.9%(12.1%)
26.6%(9.0%)
20.6%(3.0%)
29.5%(6.05)
No Internet Low Internet High Internet
Some Radio
Some Email
Some Email
No Cable Some Cable
Low Magazine High Magazine
Low Email High Email
Total Plan to Buy Computer
More Details in This New Book More Details in This New Book

Don E. Schultz, [email protected]