Embed Size (px)
Citation preview
1
Managing and optimizing midstream gross margin positions using a fully
integrated, predictive business model
Mike Merritt and Steve Hendon
eSimulation, Inc.
Houston, Texas U.S.A
Mike Cutson and Bob Milam
Southern Union Gas Services
Fort Worth, Texas U.S.A
ABSTRACT
In early 2008, Southern Union Gas Services (SUGS) commissioned eSimulation to build a predictive
business model to help SUGS accurately manage and forecast plant gross margins. The business model
encompasses SUGS‟s fully integrated gathering and processing assets located in the Permian Basin
region of west Texas and southeast New Mexico (5 plant gathering and processing/treating
supersystem).
SUGS chose eSimulation‟s midstream business modeling platform eSimEvaluatorTM
because of its
ability to integrate both the commercial and physical interactions inherent in midstream businesses.
eSimEvaluator is a predictive model-based planning, forecasting, and business optimization solution.
The model is used for monthly plant margin estimates, annual forecasting / budgeting, sensitivity
analyses in support of the financial reporting process, and operations for margin improvement
simulations.
The project scope included modeling all physical and commercial aspects of the gathering and
processing systems, including almost 2,000 wellhead meters, over 500 complex producer contracts,
treating and processing facilities, compression fuel consumption, interplant transfers, and residue and
NGL sales points. Wellhead and non-wellhead volume and composition data from the measurement
system are captured through an integrated semi-automated interface.
The authors discuss the project objectives, the project implementation process, project benefits, and the
lessons learned from applying the integrated solution to the SUGS gathering and processing systems.
2
Objectives
Most organizations function as a series of dynamic, interconnected groups where what happens in one
department affects other departments. Many companies aren‟t able to see „cause and effect‟
relationships between departments, because use of disconnected spreadsheets does not facilitate
smooth information flows. Southern Union Gas Services (SUGS) management recognized a need for a
tool that would allow users in all areas of the company to build business models that drive and help
manage day-to-day operations.
What SUGS especially wanted was forward-looking analytics. The retrospective, historical analytics of
the past doesn't meet their needs. They want to answer 'what if' questions with modeling and
simulation.
In early 2008, SUGS commissioned eSimulation to develop a business modeling solution, specific to
the mid-stream gas processing industry that would improve SUGS Commercial Business Processes.
The important characteristics and capabilities would include:
Visual and intuitive in nature
Common business modeling platform that can be utilized for multiple purposes
Combines physical field and plant interactions with commercial aspects
Accurately assess current business performance (Accruals)
Run “what-if” scenarios to predict impacts of both economic and operational
fluctuations (Forecasts, Budgets)
Utilize PGAS actual volume and composition data
Implementation Process
The scope of the project included modeling of 5 processing/treating plants with their respective
gathering systems. This system encompasses more than 2,000 wellhead meters and over 500 complex
producer contracts. Producer contracts ran the gamut including POP, Equity or Wellhead, KeepWhole,
Fixed Recovery, Allocated Recovery, Conditioning Fee, MMBTU settlement, and MCF settlement,.
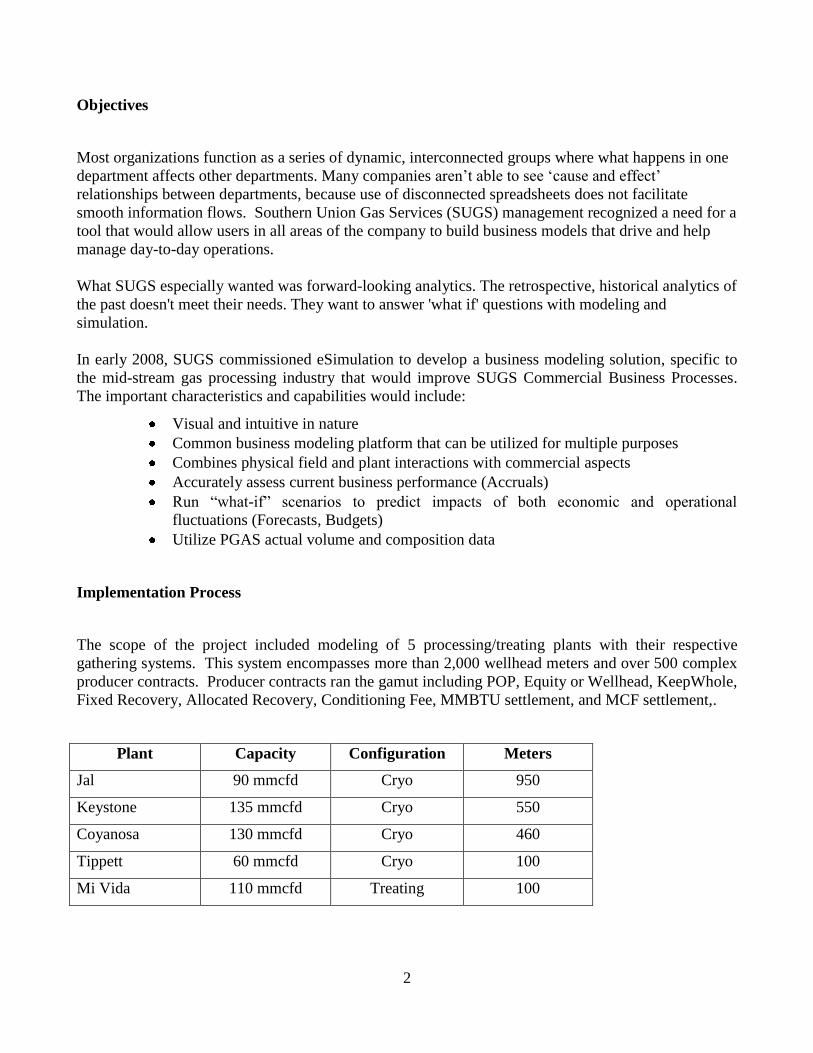
Plant Capacity Configuration Meters
Jal 90 mmcfd Cryo 950
Keystone 135 mmcfd Cryo 550
Coyanosa 130 mmcfd Cryo 460
Tippett 60 mmcfd Cryo 100
Mi Vida 110 mmcfd Treating 100
3
Jal Gathering
Keystone Gathering
Gathering
Gathering
Jal
Keystone
Mi Vida
Coyanosa
Tippett
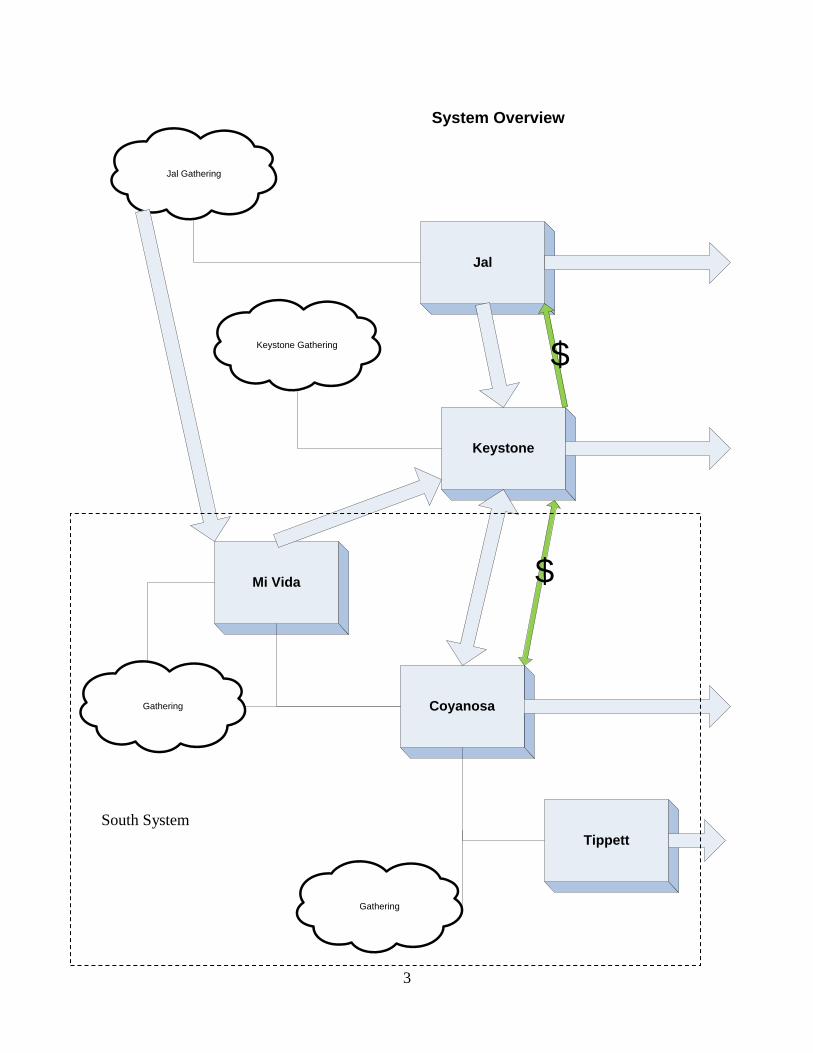
System Overview
$
$
South System

4
The initial approach was to model the Jal and Keystone plants separately, and the Coyanosa, Tippett,
and Mi Vida plants as a system. Later, the Jal and Keystone plants would be integrated into a joint
system.
The project began by assembling the necessary supporting documentation for each plant. This
included Producer Contract Briefs, Plant I&D (Intake & Disposition) Reports, Settlement Detail
Reports, Settlement Summary Reports, and Margin Summary Reports.
Models of each plant‟s gathering and processing systems were then built using the flowsheeting tool of
the eSimEvaluatorTM
software. The eSimEvaluator software allows the user to construct the business
model in a visually intuitive manner, with each flowsheet following the flow of gas from the Producer,
through the gathering system, to the processing plant, ending with the flow of product and residue
streams to their respective sales points.
The models can be as simple or complex as is necessary to achieve the desired results. In our case, the
models are fairly complex. They include every wellhead meter, configured to accurately portray the
respective plant‟s I&D Report, Producer Contract details for settlement calculation, field and plant
compression, field and plant flares, condensate removal points, treating and processing, and multiple
gas and NGL sales points.
One of the aspects of the eSimEvaluator software that we felt made it particularly unique was that it
maintains a strict mass balance by component across each model. There is a mole balance from
wellhead to tailgate. It calculates an unaccountable based on wellhead and product volumes. Simply,
the sum of the ins equals the sum of the outs!
While a great deal of emphasis is placed on the physical modeling, which is very visual in nature, the
model also connects the physical with the commercial relationships. Sales revenues, gas costs
(producer contracts), and interplant transfers are accurately reflected.
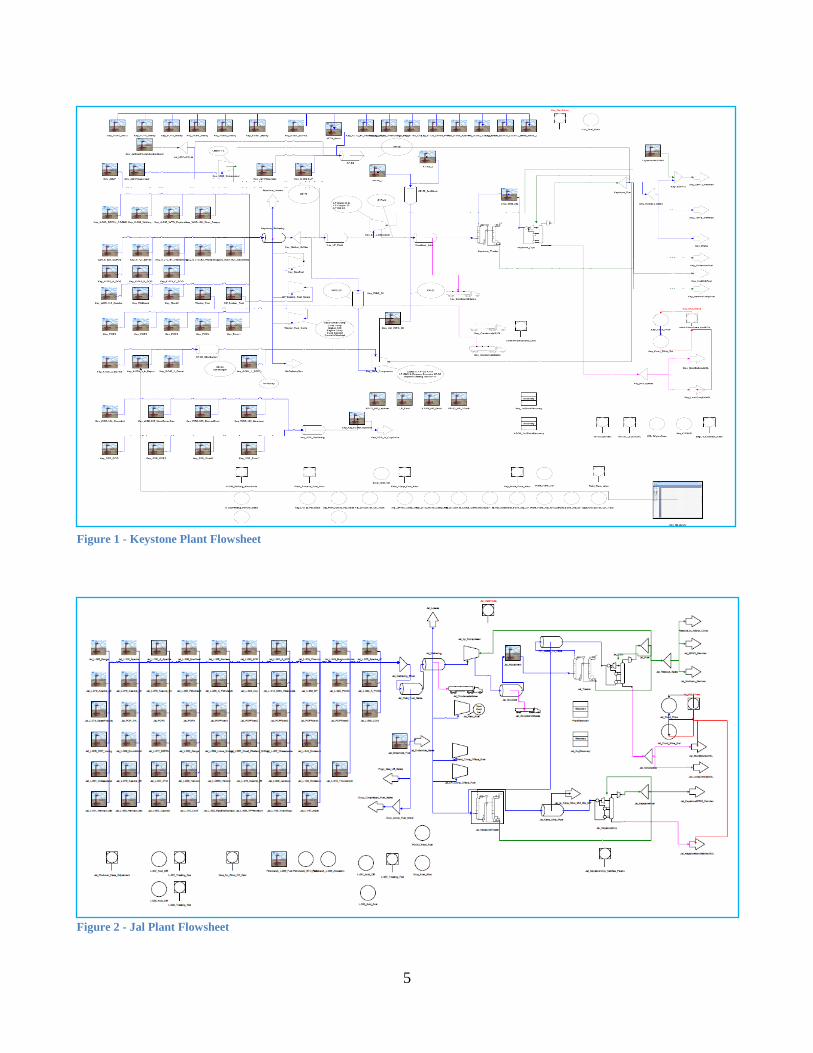
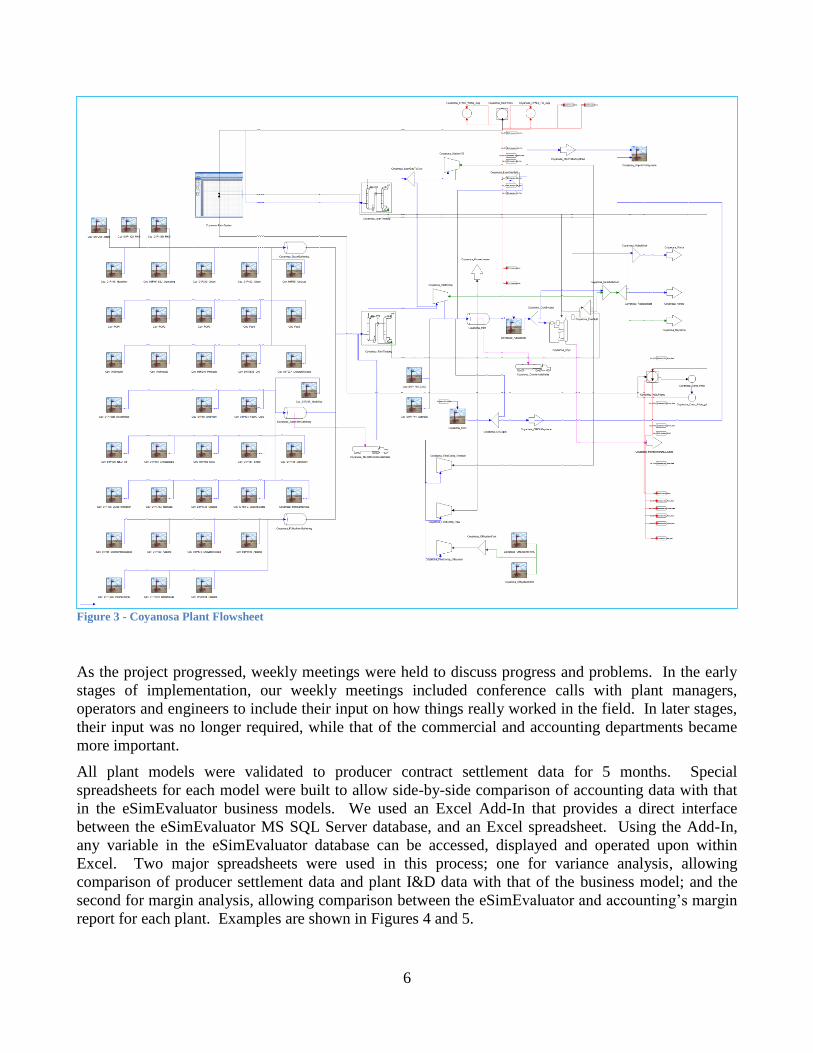
To save development time, all Producer Contracts were not explicitly modeled. Those Producer
Contracts that would represent at least 80% of the total flow were modeled explicitly, with the
remaining contracts grouped into aggregates of similar contract terms. Figures 1-3 show the
flowsheets for the Keystone, Jal and Coyanosa business models respectively.
5
Figure 2 - Jal Plant Flowsheet
Figure 1 - Keystone Plant Flowsheet
6
Figure 3 - Coyanosa Plant Flowsheet
As the project progressed, weekly meetings were held to discuss progress and problems. In the early
stages of implementation, our weekly meetings included conference calls with plant managers,
operators and engineers to include their input on how things really worked in the field. In later stages,
their input was no longer required, while that of the commercial and accounting departments became
more important.
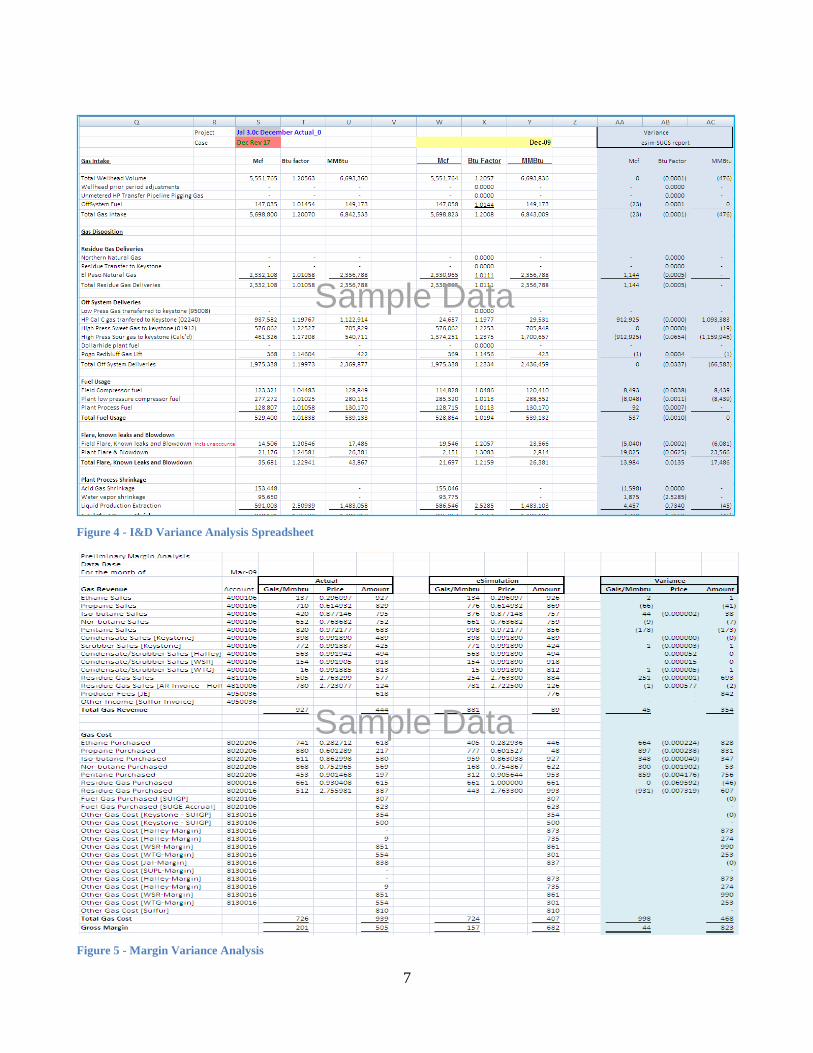
All plant models were validated to producer contract settlement data for 5 months. Special
spreadsheets for each model were built to allow side-by-side comparison of accounting data with that
in the eSimEvaluator business models. We used an Excel Add-In that provides a direct interface
between the eSimEvaluator MS SQL Server database, and an Excel spreadsheet. Using the Add-In,
any variable in the eSimEvaluator database can be accessed, displayed and operated upon within
Excel. Two major spreadsheets were used in this process; one for variance analysis, allowing
comparison of producer settlement data and plant I&D data with that of the business model; and the
second for margin analysis, allowing comparison between the eSimEvaluator and accounting‟s margin
report for each plant. Examples are shown in Figures 4 and 5.
7
Figure 4 - I&D Variance Analysis Spreadsheet
Figure 5 - Margin Variance Analysis
Sample Data
Sample Data
8
An interface between the SUGS measurement data system (PGAS) and the eSimEvaluator database
was developed, which provides fast and accurate updating of wellhead meter volumes and
compositions. Other data, such as, plant meter volumes and compositions are also available through
this interface. For this project, we were focused on monthly data, however, any timeframe in which
measurement system data is updated could be used for forecasting activities.
Using the Models
The eSimEvaluator business model runs in any one of 4 different Solution Case Modes: Parameter,
Simulate, Reconcile, and Optimize. These Solution Case Modes allow the easy automatic conversion
of variable specifications between the different cases. For instance, the Parameter case mode is used to
run accrual cases where the production variables are fixed and the recovery variables are calculated to
match the production. The Simulate case mode is used when running forecast cases where the
production rate is calculated but the recoveries are constant. Using the correct Variable specification
makes the change from accrual case to forecast case very easy.
In performing an Accrual with the eSimEvaluator business model, data that reflects what has already
happened is loaded into the model. In our project, the data input included meter volumes and
compositions from the measurement system (PGAS), various pieces of data from I&D reports
including production volumes, and pricing data.
After input of this data, the eSimEvaluator is run in “Parameter” solution mode. In this mode the
eSimEvaluator solves for a set of parameters which would produce the input values provided.
For example, NGL production volumes and Residue composition are entered as input or Measured
values, and the corresponding Cryo Recovery Percentages are calculated as Parameters. When the
model is then run in Simulation solution mode, the Parameters become fixed values, and the Measured
variables are then calculated.
On a routine basis, the model must be kept current with field and commercial changes. New producer
contracts, contract revisions and amendments, new well connects and disconnects, changes to field
piping and compression must be updated in the models each month.
Price Sensitivities
One of the first uses of the eSimEvaluator models was to provide management with Price Sensitivity
analysis. We ran case studies on each of the plants to examine the sensitivity to an increase in NGL
prices of one cent ($0.01), an increase in gas price of ten cents ($0.10), and an increase of two cents
($0.02) in the T&F costs that SUGS incurs.
After the base case selection and modification of the required model variables, the sensitivity cases are
automatically generated and run.
9
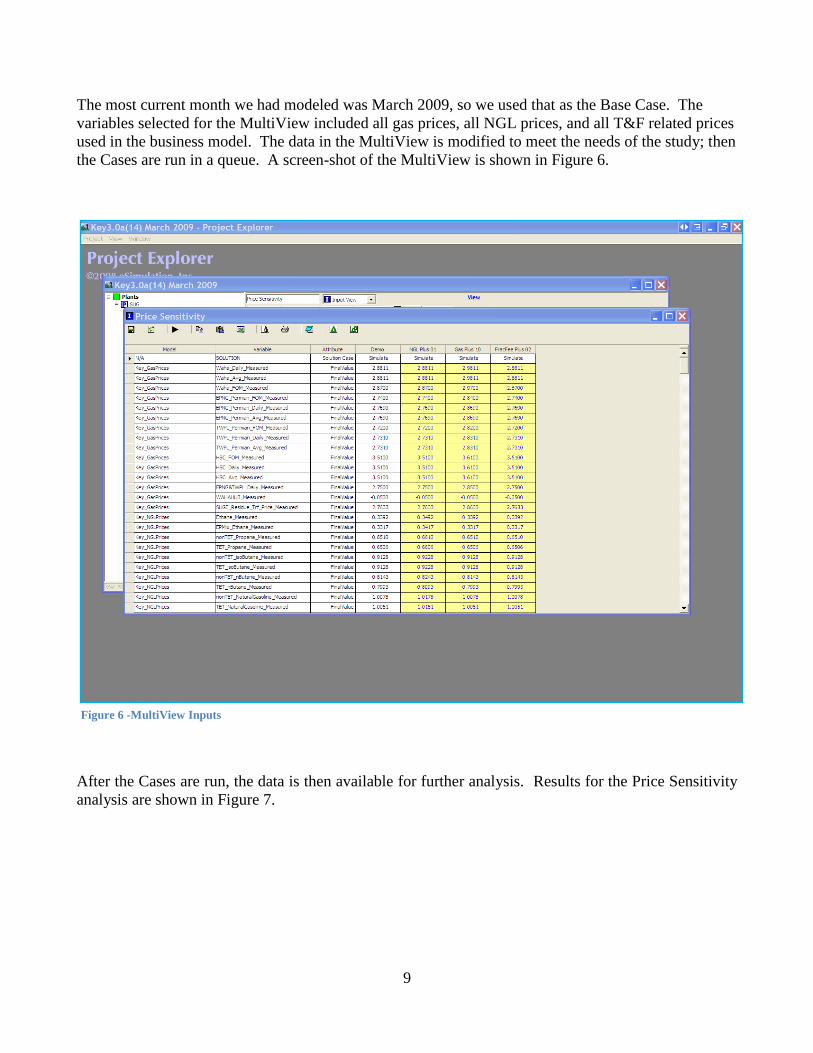
The most current month we had modeled was March 2009, so we used that as the Base Case. The
variables selected for the MultiView included all gas prices, all NGL prices, and all T&F related prices
used in the business model. The data in the MultiView is modified to meet the needs of the study; then
the Cases are run in a queue. A screen-shot of the MultiView is shown in Figure 6.
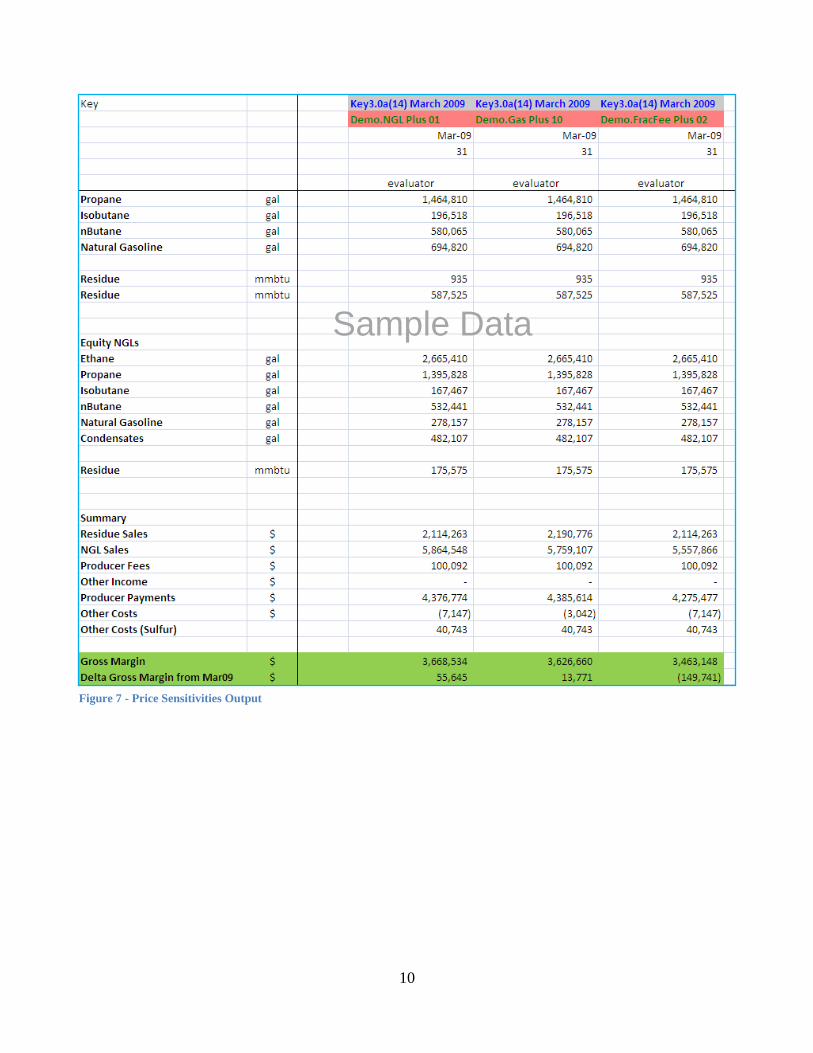
After the Cases are run, the data is then available for further analysis. Results for the Price Sensitivity
analysis are shown in Figure 7.
Figure 6 -MultiView Inputs
10
Figure 7 - Price Sensitivities Output
Sample Data
11
When running and comparing Case results it is advantageous to display the data in single columns as
shown. The data in each column references the Project and Case names shown at the top of each
column. Each Case is saved independently in the eSimEvaluator database. The significance of this is
that any variable in the Case can be changed, the Case can then be re-run and the new results will be
displayed when the spreadsheet is refreshed. Also, since each case results are stored in the database, if
additional analysis is required, new case calculations can be added without rerunning and changing the
existing cases.
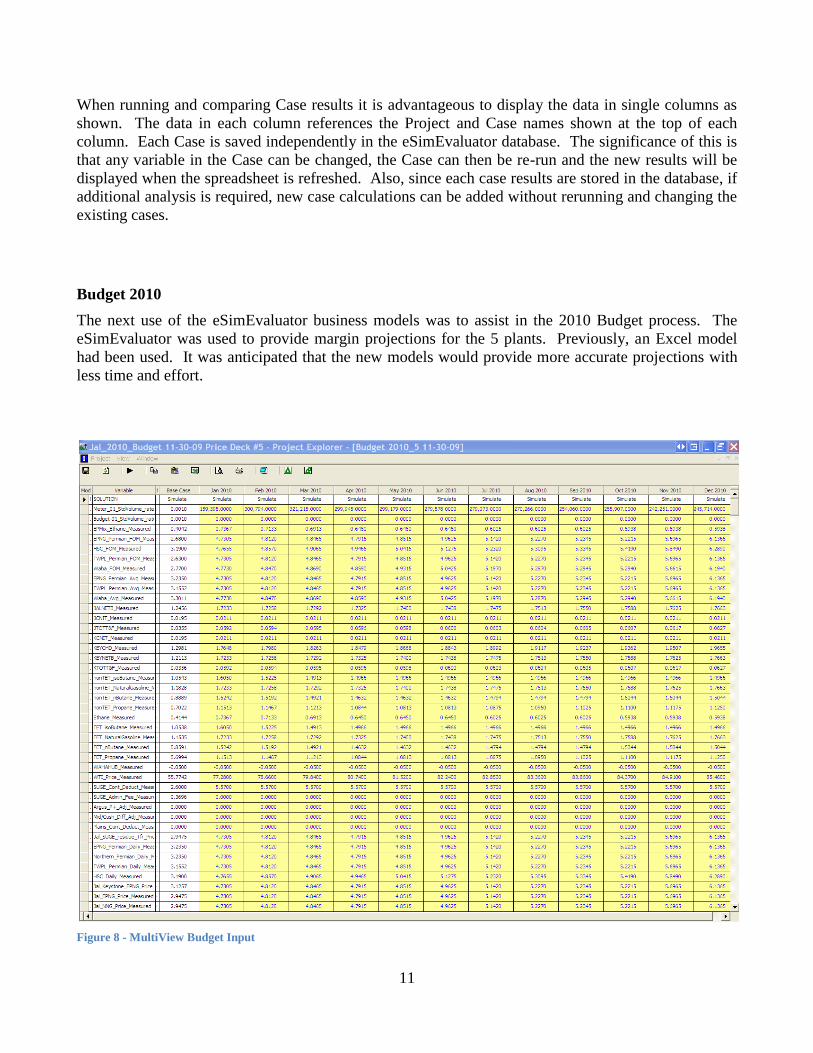
Budget 2010
The next use of the eSimEvaluator business models was to assist in the 2010 Budget process. The
eSimEvaluator was used to provide margin projections for the 5 plants. Previously, an Excel model
had been used. It was anticipated that the new models would provide more accurate projections with
less time and effort.
Figure 8 - MultiView Budget Input
12
The model variables we wanted to change for each case were:
Meter volumes including new wellhead volumes and field decline assumptions
Prices
Volume information and assumptions were provided by Gas Supply, and pricing was developed by
Marketing.
The Base Case we chose to start from was May 2009. The model Parameters for each plant were
thoroughly examined to make sure they were reasonable. Small changes were made as deemed
necessary. In one instance, there was by-pass around one of the plants in May, but for the budget
projection, it was decided that there would be no by-pass.
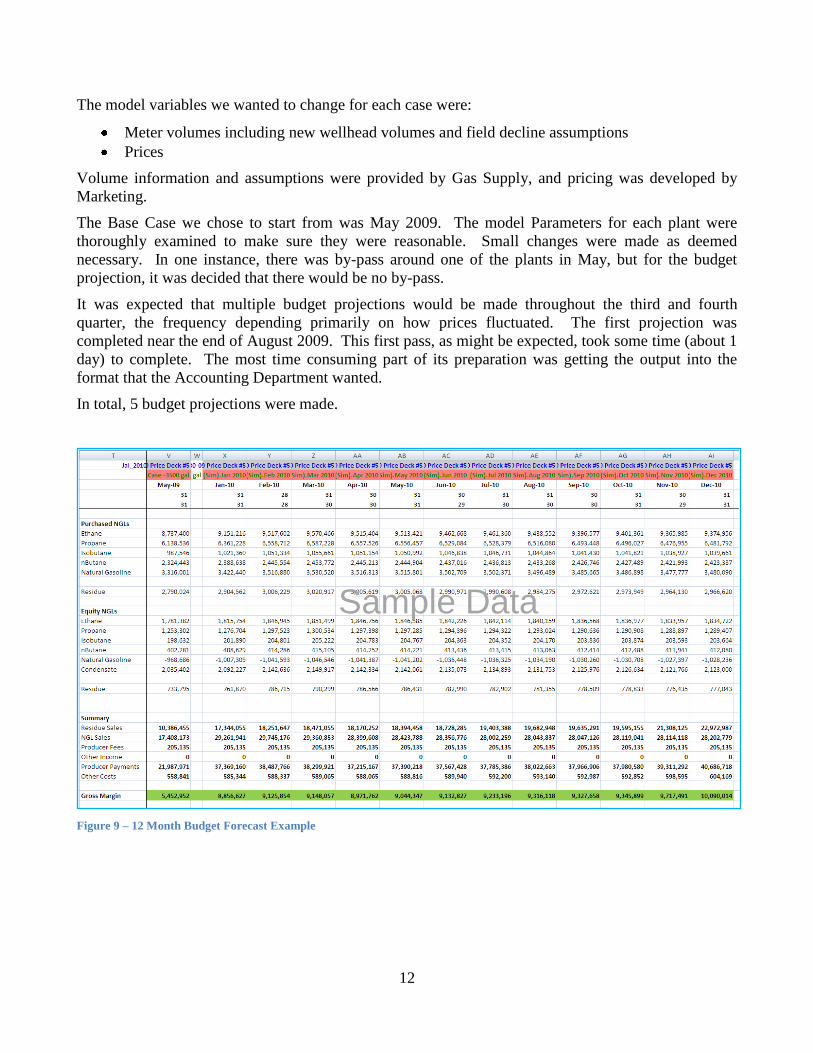
It was expected that multiple budget projections would be made throughout the third and fourth
quarter, the frequency depending primarily on how prices fluctuated. The first projection was
completed near the end of August 2009. This first pass, as might be expected, took some time (about 1
day) to complete. The most time consuming part of its preparation was getting the output into the
format that the Accounting Department wanted.
In total, 5 budget projections were made.
Figure 9 – 12 Month Budget Forecast Example
Sample Data
13
Recovery Sensitivity Analysis
A Recovery Sensitivity Analysis was requested to determine the effect on gross margin of a +5% or -
5% change in Ethane recovery for each of the plants. In particular, we wanted to examine how Equity
NGL‟s would change with a change in recovery percentages.
On the surface, this seems like a simple request that could be calculated on the back of an envelope.
What is difficult to see is the complexity of the interactions created by the contract mix. Both the Jal
and Keystone plants have a group of allocated contracts, there are inter-plant transfers, and one plant is
settled on an mmbtu basis, while the other is settled on an mcf basis.
In concept, there were three cases to be run for each plant or system:
1. Base Case
2. +5% Ethane Recovery
3. -5% Ethane Recovery
In the case of the Jal plant, a sizeable stream of gas is sent to the Keystone plant for processing each
month. The resultant quantities of residue and NGL‟s from this stream is then allocated back to the Jal
plant and its producers. For this reason, the overall effect on gross margin at the Jal plant is also
dependent upon the operating results at the Keystone plant. For the Jal plant, the cases to be run for
this study became the following matrix:
Base Case Delta Case 1 Delta Case 2
Jal Base / Key Base Jal +5pct / Key Base Jal -5pct / Key Base
Jal Base / Key +5pct Jal +5pct / Key +5pct Jal -5pct / Key +5pct
Jal Base / Key -5pct Jal +5pct / Key -5pct Jal -5pct / Key -5pct
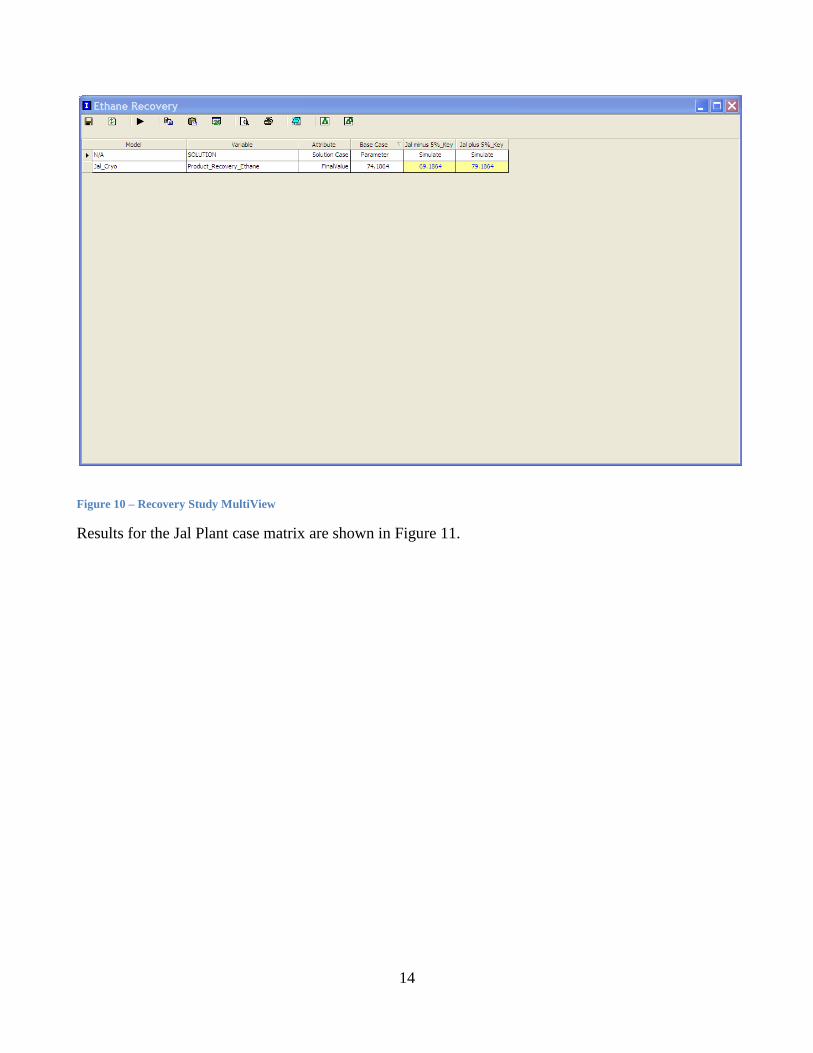
The MultiView was fairly simple for this study, as the only variable to be changed was the Ethane
Product Recovery Percentage, shown in Figure 10.
14
Figure 10 – Recovery Study MultiView
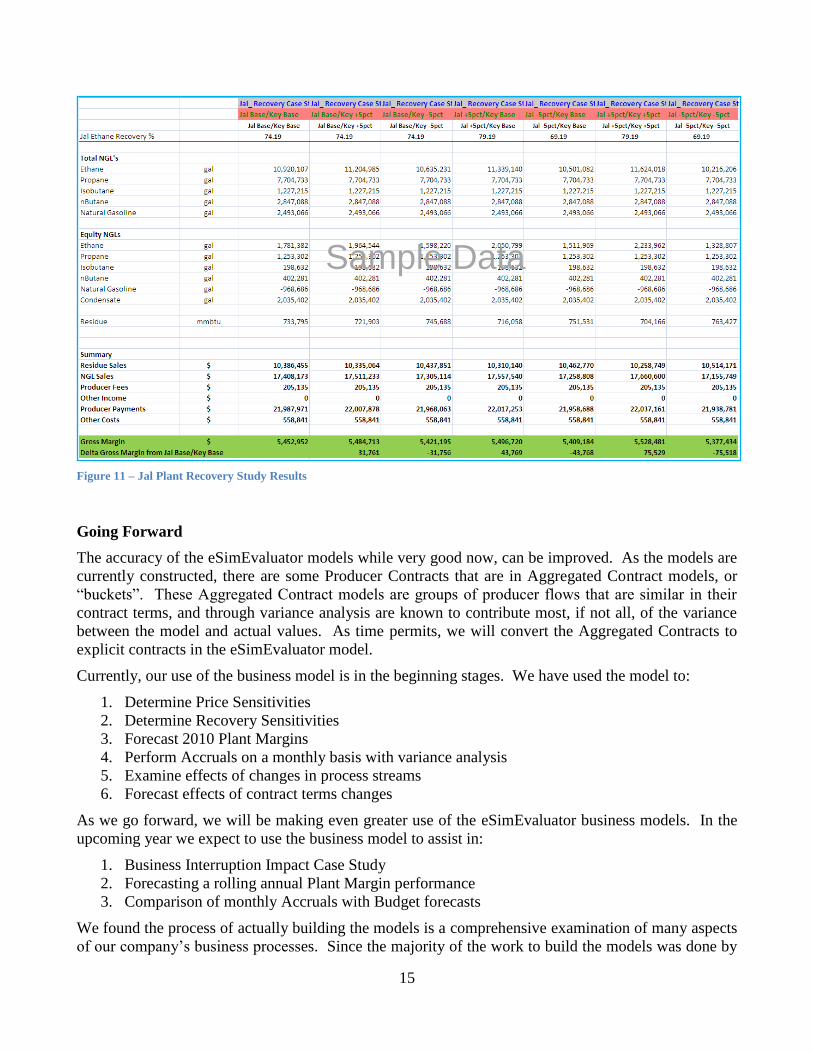
Results for the Jal Plant case matrix are shown in Figure 11.
15
Figure 11 – Jal Plant Recovery Study Results
Going Forward
The accuracy of the eSimEvaluator models while very good now, can be improved. As the models are
currently constructed, there are some Producer Contracts that are in Aggregated Contract models, or
“buckets”. These Aggregated Contract models are groups of producer flows that are similar in their
contract terms, and through variance analysis are known to contribute most, if not all, of the variance
between the model and actual values. As time permits, we will convert the Aggregated Contracts to
explicit contracts in the eSimEvaluator model.
Currently, our use of the business model is in the beginning stages. We have used the model to:
1. Determine Price Sensitivities
2. Determine Recovery Sensitivities
3. Forecast 2010 Plant Margins
4. Perform Accruals on a monthly basis with variance analysis
5. Examine effects of changes in process streams
6. Forecast effects of contract terms changes
As we go forward, we will be making even greater use of the eSimEvaluator business models. In the
upcoming year we expect to use the business model to assist in:
1. Business Interruption Impact Case Study
2. Forecasting a rolling annual Plant Margin performance
3. Comparison of monthly Accruals with Budget forecasts
We found the process of actually building the models is a comprehensive examination of many aspects
of our company‟s business processes. Since the majority of the work to build the models was done by
Sample Data

16
eSimulation employees, it afforded an opportunity to have a third party eye to look at how well we
agree between our physical data and business processes and our commercial and accounting processes.
In most cases it confirmed that our existing methods made sense and were accurate. In a few cases, it
caused us to rethink our processes and even make changes.
We expect the models may be utilized by other Departments within the company, and we expect to see
some creative new ways to use the eSimEvaluator will emerge.