Embed Size (px)
Citation preview

Managing 2009 Crop MarginsNovember 2008
Fundamentals: Supply & Demand
Commodity Funds & Chart Technicals
Outside Commodity Markets
Steven D. JohnsonFarm & Ag Business Management Specialist
(515) [email protected]
www.extension.iastate.edu/polk/farmmanagement.htm

Presentation Objectives• Highlight Crop Supply/Demand and
Seasonal Price Trends• Forecast 2009 Crop Corn & Soybean
Prices• Forecast 2009 Cost of Production and
Net Revenue per Acre• Highlight the New SURE and ACRE
Programs available in 2009 through 2012 • Provide 5 Strategies and 5 Web Sites for
Managing Crop Risks

Corn Production, Usage and Ending Carryover
0
2,000
4,000
6,000
8,000
10,000
12,000
14,000
2004-05 2005-06 2006-07 2007-08 Projected 2008-2009
Projected 2009-2010
Projected 2010-2011
Bu
sh
els
(m
il.)
Production Total Usage Ending Carryover
Source: Wisner, ISU Biofuels Economist, October 2008.

U.S. Planted Acreage Trend
◊ - Estimated * - Forecast
Source: USDA WAOB and Johnson, ISU Ext. Economics, November 2008.

Corn Usage (feed, ethanol, exports and other)
0
2,000
4,000
6,000
8,000
10,000
12,000
14,000
16,000
2004-05 2005-06 2006-07 2007-08 Low Med. High Low Med. High Low Med. High
Historic Proj. Projected 2008-2009 Projected 2009-2010 Projected 2010-2011
Bu
sh
els
(m
il.)
Feed & residual Ethanol Food, ind. & seed Exports
Source: Wisner, ISU Biofuels Economist, October 2008.

Ending Carryover and the U.S. Weighted Average Farm Price
0
500
1,000
1,500
2,000
2,500
2004-05 2005-062006-07 2007-08 Low Med. High Low Med. High Low Med. High
Historic Proj. Projected 2008-2009 Projected 2009-2010 Projected 2010-2011
Bu
sh
els
(m
il.)
$0.00
$1.00
$2.00
$3.00
$4.00
$5.00
$6.00
Pri
ce
Ending Carryover U.S. weighted avg. farm price
Source: Wisner, ISU Biofuels Economist, October 2008.

$5.60/bu 18%
$4.35/bu 65%
$4.20/bu 17%
Corn Cash Price & Probability Forecast
’09-’10 Marketing Year
Source: Wisner, ISU Biofuels Economist, October 2008.

New Crop Corn Seasonal Trend
Source: CBOT data compiled by the U of MN, CFFM, 2008.
Chicago December Corn Futures, 1990-2008 average1-
Jan 1-
Feb
1-M
ar
1-Ap
r
1-M
ay
1-Ju
n
1-Ju
l
1-Au
g
1-Se
p
1-O
ct
1-N
ov
1-D
ec
250
255
260
265
270
275
280
285
290
295
approximate dates
cent
s pe
r bu
shel

2009 New Crop Corn Chart
Source: jim.wyckoff.com, November 6th, 2008.

2009 New Crop Soybean Chart
Source: jim.wyckoff.com, November 6th, 2008.

Soybean Production, Usage, and Carryover
0
500
1,000
1,500
2,000
2,500
3,000
3,500
2004-05 2005-06 2006-07 2007-08 Projected 2008-2009
Projected 2009-2010
Projected 2010-2011
Bu
shel
s (m
il.)
Production Total Usage Ending Carryover
Source: Wisner, ISU Biofuels Economist, October 2008.

Ending Carryover and the U.S. Weighted Average Farm Price
0
100
200
300
400
500
600
700
2004-05 2005-06 2006-07 2007-08 Low Med. High Low Med. High Low Med. High
Historic Projected 2008-2009 Projected 2009-2010 Projected 2010-2011
Bu
sh
els
(m
il.)
$0.00
$2.00
$4.00
$6.00
$8.00
$10.00
$12.00
$14.00
Pri
ce
Ending Soybean Carryover: (mil. bu.) U.S. weighted avg. farm price
Source: Wisner, ISU Biofuels Economist, October 2008.

$11.50/bu 18%
$10.00/bu 65%
$9.80/bu 17%
Soybean Cash Price & Probability Forecast
’09-’10 Marketing Year
Source: Wisner, ISU Biofuels Economist, October 2008.

New Crop Soybeans Seasonal Trend
Chicago November Soybean Futures, 1990-2008 average1-
Jan 1-Fe
b
1-M
ar
1-Ap
r
1-M
ay
1-Ju
n
1-Ju
l
1-Au
g
1-Se
p
1-O
ct
1-N
ov
605
615
625
635
645
655
665
approximate dates
cent
s pe
r bu
shel
Source: CBOT data compiled by the U of MN, CFFM, 2008.

Source: Schnitkey, U of IL Ext. Economics, Oct. 2008.
Direct Costs of Crop Production ($/A)
Historical vs. 2009 Forecast

Non-Land Costs vs. Gross Revenue ($/A)Historical vs. 2009 Forecast
Source: Schnitkey, U of IL Ext. Economics, Oct. 2008.

SURE - SUpplemental REvenuePermanent Disaster Program
• Provides “supplemental” revenue coverage to existing crop insurance policies
• Insured must cover all crops, not individual crops• Program offered 2009 through 2012• Annually, land must be in a “disaster county”
(U.S. Secretary of Ag designation)– or a contiguous county– or crop revenue loss on all crops on all farms must
exceed 50%• All crops on all farms must be insured• Administered by Farm Service Agency (FSA)
Source: ISU Extension Economics, November 2008.

Crop Insurance plus SURE Payment
$-
$50
$100
$150
$200
$250
$300
80 85 90 95 100 105 110 115 120 125 130 135 140 145 150 155 160
Corn Yield-bu/acre
$ per acre
SURE pmt.
Crop Ins. Pmt
Source: ISU Extension Economics, November 2008.
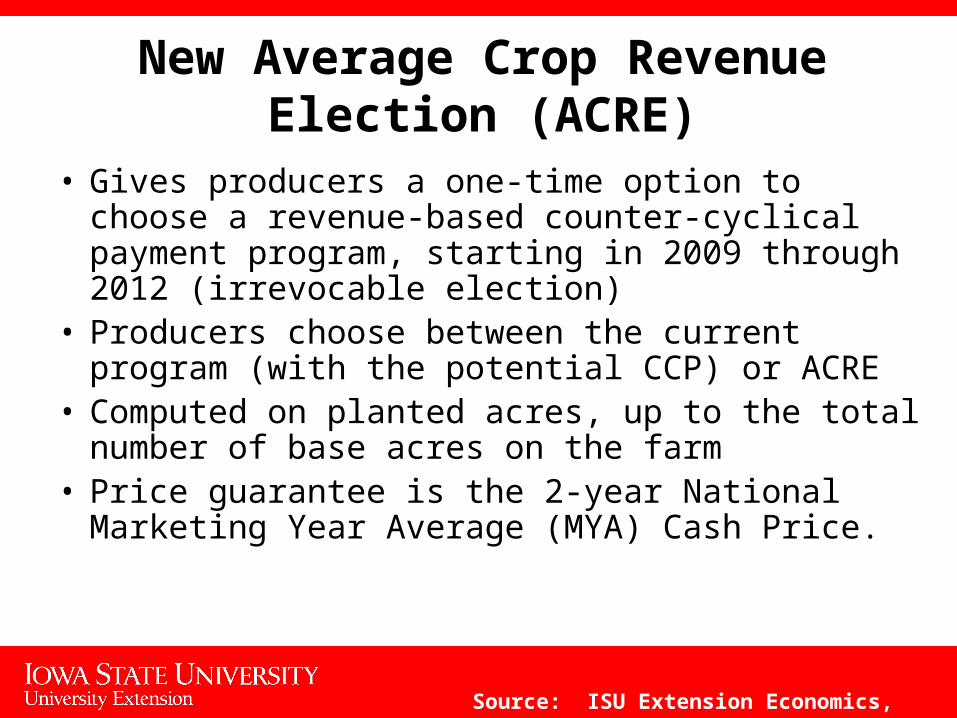
New Average Crop Revenue Election (ACRE)
• Gives producers a one-time option to choose a revenue-based counter-cyclical payment program, starting in 2009 through 2012 (irrevocable election)
• Producers choose between the current program (with the potential CCP) or ACRE
• Computed on planted acres, up to the total number of base acres on the farm
• Price guarantee is the 2-year National Marketing Year Average (MYA) Cash Price.
Source: ISU Extension Economics, November 2008.

ACRE Decisions
• Producers choosing ACRE agree to a 20% decline in direct payments and a 30% decline in loan rates
• Program has state and farm trigger levels, both must be met before payments are made
• Expected state and farm yields based on 5-year Olympic average yields per planted acre
• Revenue Guarantee = 2-year National MYA cash price X 5-year state Olympic average yield X 90%
• Actual Revenue = National MYA cash price X Actual state yield per planted acre (that year).
Source: ISU Extension Economics, November 2008.

ACRE vs. CCP
ACRE pays out
No ACRE payments
CCP pays out
No CCP payments
Source: ISU Extension Economics, November 2008.

ACRE Set-up for Iowa Corn2009 Sign-up Decision
Year Yield per Planted Acre(bu./acre)
2004 176.7
2005 168.9
2006 162.7
2007 166.8
2008 161.9*
Olympic Average 166.1
Year National Average Price ($/bu.)
2007-08 4.20
2008-09 4.40*
Average $ 4.30 *
*The 2008 yield and price are forecasts. Prices are as of Nov. 10th.
So the expected state yield would be 166.1 bushels per acre and the ACRE price guarantee would be $4.30 per bushel.
Source: ISU Extension Economics, November 2008.

• State Revenue Guarantee– 166.1 bu/A (most recent 5 years – Olympic Average)– X $4.30 /bu (forecast)– = $714/A Gross Revenue (estimated)– X 90%– = $643/A State Revenue Guarantee for 2009
(estimated)
• Farm Revenue Guarantee– 170 bu/A (example only) Last 5-year Olympic Average – by FSA
Farm Serial Number)– X $4.30 /bu (forecast)– = $731/A Gross Revenue (estimated)– + $24/A Crop Insurance Premium Paid (estimated)– = $755/A Farm Revenue Guarantee for 2009
(estimated)
State & Farm Revenue Guarantees
Source: ISU Extension Economics, November 2008.

Determining 2009 ACRE Payment(Considers Both Triggers are Met)
Lesser ofState ACRE
Revenue Guarantee
MinusActual State
Revenue
orState ACRE
Revenue Guarantee
Times 25%
ACRE Payments are issued after October 1st of the year following harvest.
ACRE Participant Payment Limits are $40,000 on Direct Payments (DPs) and reduced by the 20% DP. If enrolled in ACRE, then an Individual’s Payment Limits are $32,000 for DPs and $73,000 for ACRE Payments or $105,000 total.
Source: ISU Extension Economics, November 2008.

Potential 2009 Iowa ACRE PaymentAssumptions: 5-yr. State Olympic Yield = 166.1 bu/A
5-yr. Farm Olympic Yield = 170 bu/A 2-yr. National Avg. Cash Price = $4.30 /bu
2009 State Revenue Guarantee = $643/A (estimates)2009 Farm Revenue Guarantee = $755/A (estimates)
In 2009, State Yield = 150 bu/A and Farm Yield = 160 bu/AThe 2009-10 National Avg. Cash Price = $4.00/bu
2009 Actual State Revenue = 150 bu/A X $4.00/bu = $600 (forecast)2009 Actual Farm Revenue = 160 bu/A X $4.00/bu = $640 (forecast)
Example OnlySince both 2009 the State and Farm Actual Revenue are below the Guarantees, an ACRE Payment is made.
$643/A State Guarantee - $600/A Actual State Revenue = $43/A X (170 bu/A /166.1 bu/A) X 83.3% = $37/A Payment
Source: ISU Extension Economics, November 2008.

ACRE Beyond 2009 Revenue Guarantee is updated each year through
2012 using the same rules:• 5-year Olympic Average Yields (most recent
years)• 2-years of National (MYA) Cash Prices
Revenue Guarantees can not change by more than 10% (up or down) from year to year:• So for example the 2009 State Revenue
Guarantee is $643 , then the 2010 ACRE Revenue Guarantee must be between $579 and $707.
Source: ISU Extension Economics, November 2008.

Source: Johnson, ISU Ext. Economics, November 2008.
5 Strategies for Managing Crop Risks
Limit Major Capital
Expenditures
Conduct Fall Soil Tests:
Improve FertilizerEfficiency
Maximize Fuel: Harvest, Drying and Tillage
Consider Early and Volume
Seed Discounts
Negotiate 2009 Cash Rent: Use
$4.50 Corn & $10
Soybeans

5 Crop Risk Management Web Sites
• Ag Decision Maker – ISU Extension Economics(Spreadsheets - Decision Tools)www.extension.iastate.edu/agdm
• Farm Doc – U of IL Extension Economicswww.farmdoc.uiuc.edu
• Center for Farm Financial Management – U of MNwww.cffm.umn.edu
• Corn Nitrogen Rate Calculator Calculatorhttp://extension.agron.iastate.edu/soilfertility/nrate.aspx
• Crop Risk Management – ISU Polk County(Marketing, Farm Program & Crop Insurance:
Updates/Newsletters/Webcastswww.extension.iastate.edu/polk/farmmanagement
Source: Johnson, ISU Ext. Economics, November 2008.