Embed Size (px)
Citation preview
Managerial Accounting – Chapter 5

It’s really Economics
Except we analyze entries to do the calculations
Cost Behavior Analysis The study of how specific costs respond to changes
in the level of business activity
Helps us plan operations, decide which course of action is better
We Measure Key Business Activities
Can use more than one measurement (machine hours for manufacturing; sales revenue for selling expenses)
Activity Index identifies what causes changes in the behavior of costs
Use activity index to classify costs as variable, fixed, or mixed

Variable Costs Vary in total, directly and proportionately, with
changes in activity level
Also remain the same PER UNIT at every level of activity
If activity level goes up 10%, total variable costs go up 10%
Ex: items direct materials and direct labor; COGS; sales commission
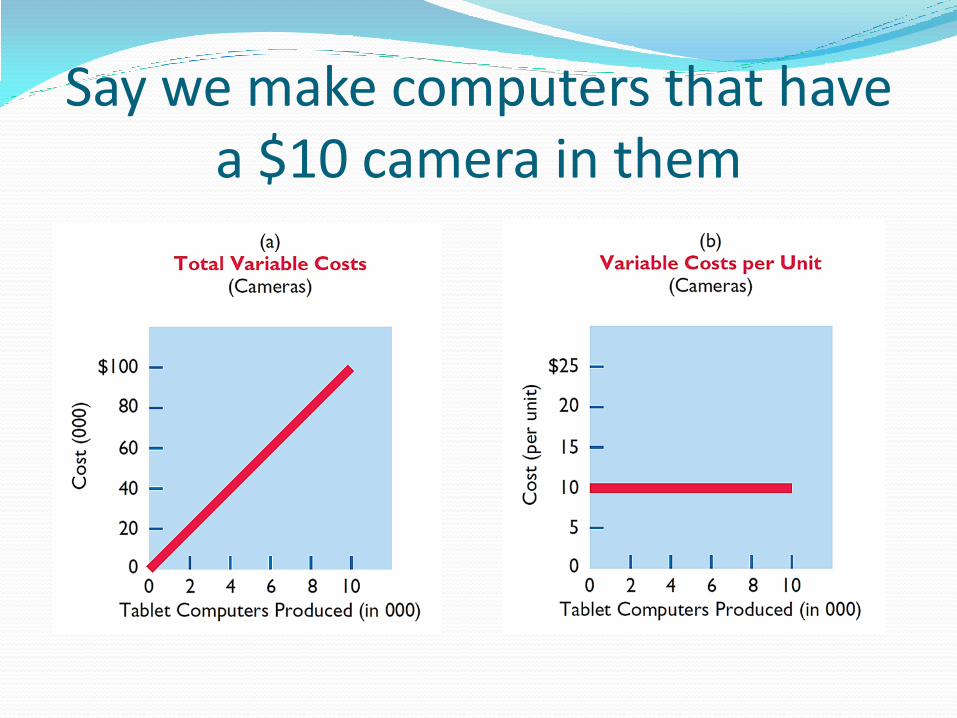
Say we make computers that have a $10 camera in them
Fixed Costs Stay the same in total regardless of changes in activity
level
Things like rent, property tax, depreciation, supervisor’s salaries
Fixed costs, in total, stay the same so fixed costs on a per-unit basis change inversely with activity
The more we make, the less in fixed costs per unit; the fewer we make, the more in fixed costs per unit
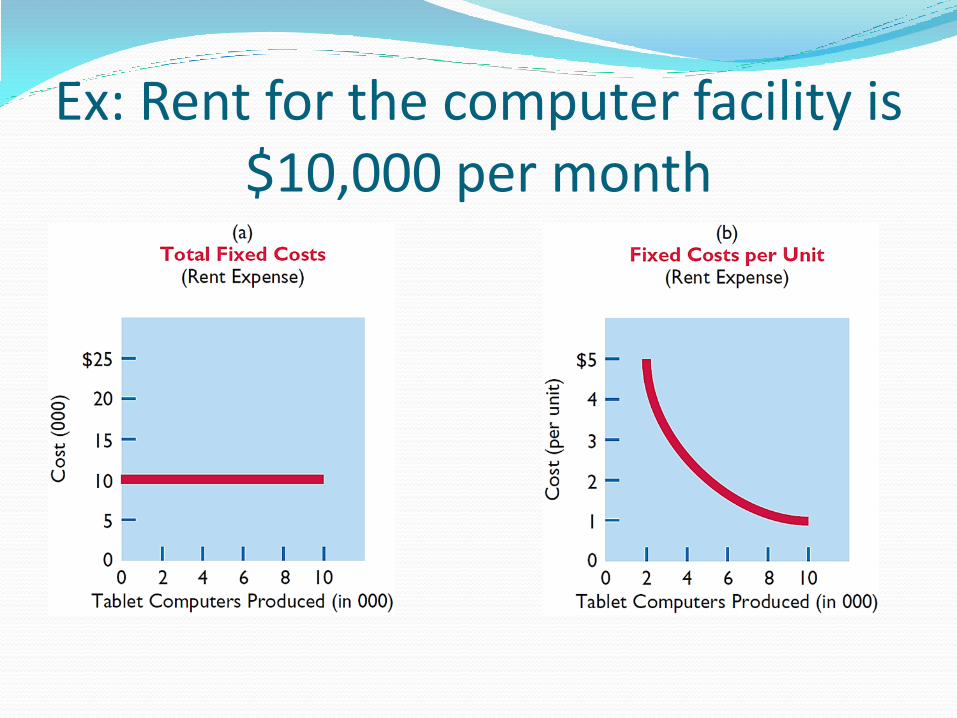
Ex: Rent for the computer facility is $10,000 per month
As we automate more, fixed costs increase
Depreciation; lease charges on manufacturing equipment are both fixed costs
Factory manufacturing labor is a variable cost
Relevant Range The range over which a company expects to operate
during the year
Unrealistic to expect to operate at 1% capacity for the entire year, or 100% capacity for the entire year
Relevant range is usually between 40-80%
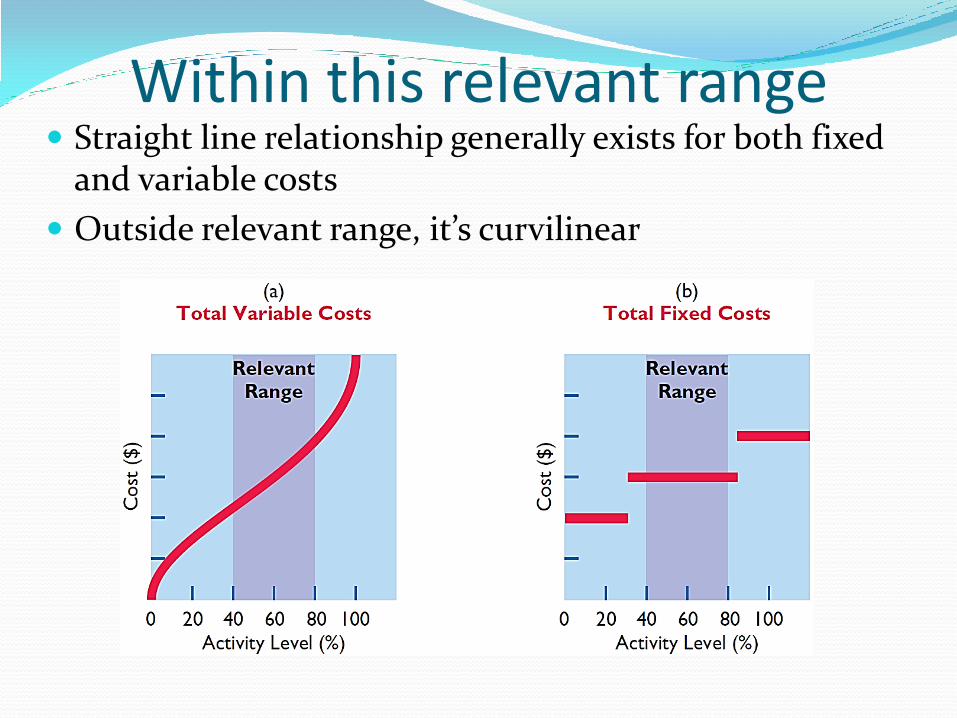
Within this relevant range Straight line relationship generally exists for both fixed
and variable costs
Outside relevant range, it’s curvilinear

Mixed Costs Contain both variable and fixed cost element
Change in total but not proportionately with changes in activity level
Ex renting a u-haul truck: cost is $50 per day plus $1 per mile
Daily cost is fixed; mileage cost is variable

So what do we do with these mixed costs?
We could figure out variable and fixed components each and every time a mixed cost is incurred
Very time consuming
Not cost effective
Instead…
We gather info on the behavior of mixed costs at different activity levels
Analyze this info to separate into fixed and variable cost components
We’ll learn the High-Low method
High-Low Method Look at total costs at high and low activity levels
Use data to classify fixed and variable components
Difference between high and low level = variable costs since only variable costs can change as activity levels change
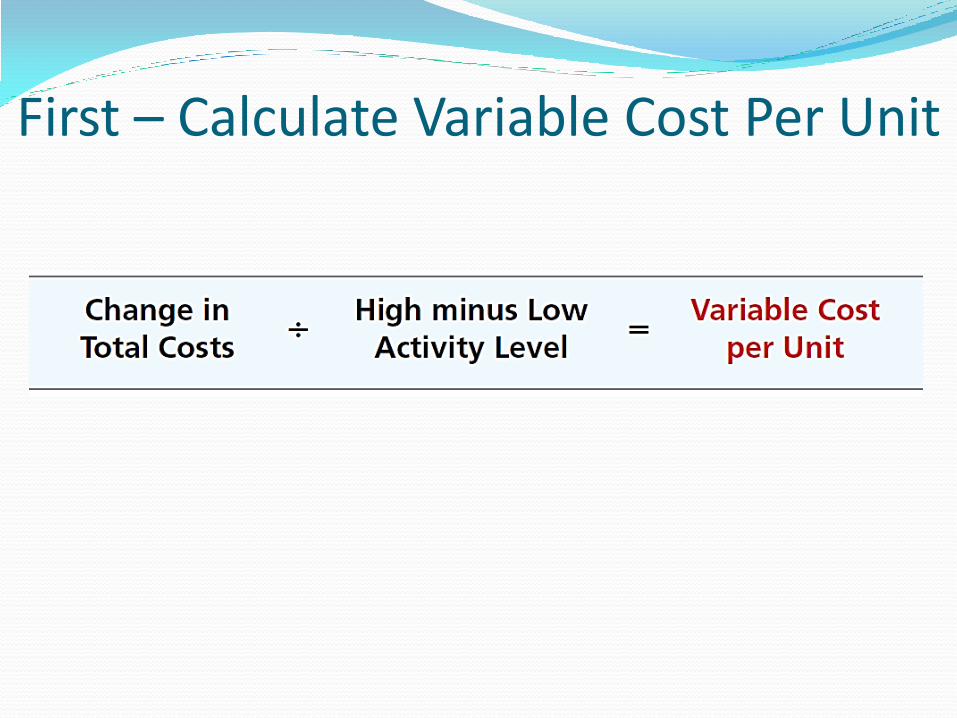
First – Calculate Variable Cost Per Unit
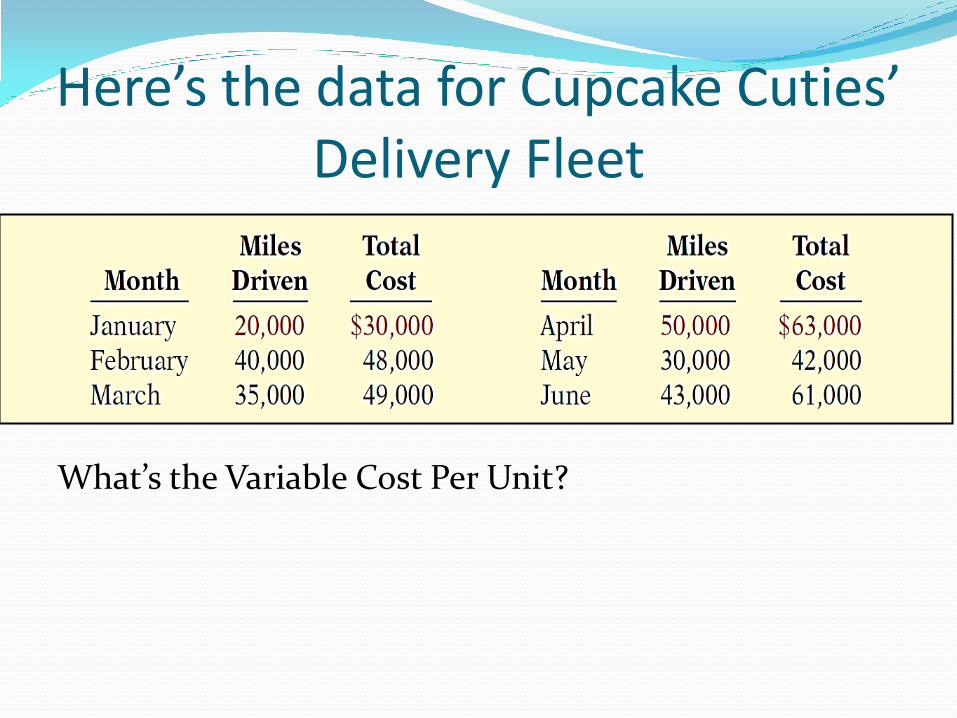
Here’s the data for Cupcake Cuties’ Delivery Fleet
What’s the Variable Cost Per Unit?
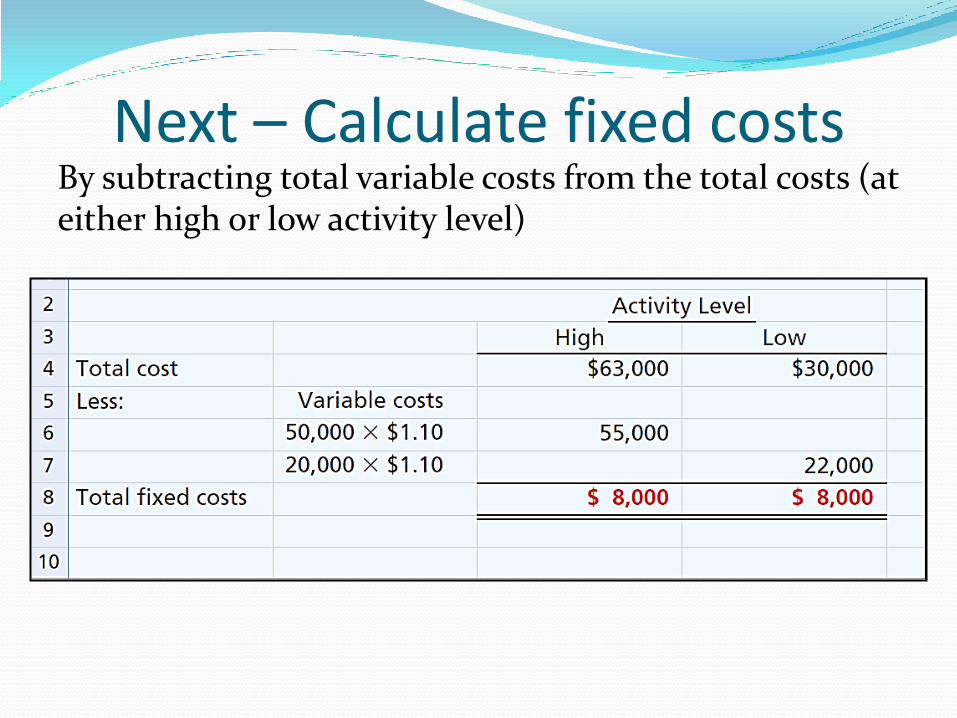
Next – Calculate fixed costs By subtracting total variable costs from the total costs (at either high or low activity level)
We use this analysis to answer these types of questions
Ford Motor Co wants to pay its workers more. What impact will this have on profit levels? What can Ford do to maintain current profit levels?
Higher wages = higher variable costs so in order to maintain present profit levels Ford will have to cut other variable costs or increase the price of its cars
United Steel Corp will modernize its plant by purchasing a significant amount of equipment. The equipment will replace 50% of the human labor force. What will be the effect on the cost of producing one ton of steel?
This changes the proportion of fixed and variable costs. Fixed costs go up because of higher depreciation costs; variable costs go down due to reduction in the number of steelworkers
Kellog’s increases its advertising expenses for Frosted Flakes (They’re Grrrreat!) but can’t raise its prices because of competitive pressure. How can Kellogg’s cover these extra fixed costs?
CVP Analysis Cost-Volume-Profit Analysis: the study of effects of
changes in costs and volume on a company’s profits
Used to make decisions like setting selling prices, determining the product mix, and maximizing production facilities

CVP looks at:
The relationship between volume or level of activity; unit selling price; variable costs per unit; total fixed costs; and sales mix.

We have to make assumptions
Behavior of both costs and revenues is linear throughout relevant range
Costs can be accurately classified as variable or fixed
Changes in activity are the only factors that affect costs
All units produced are sold
Sales mix remains constant (10% cakes and 90% cupcakes)
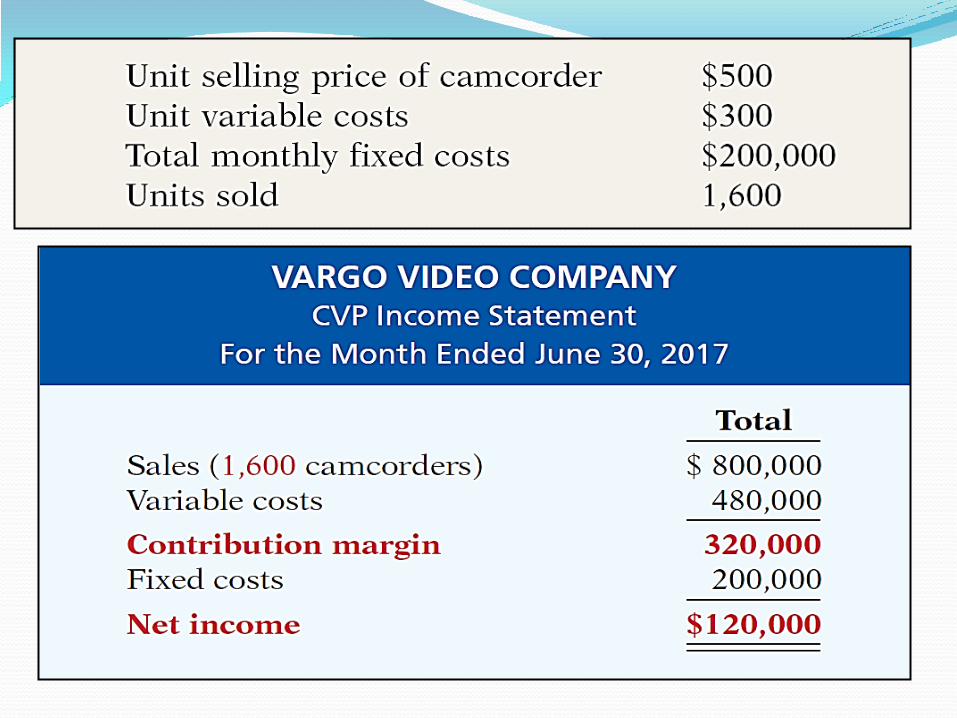
CVP Income Statement Used to calculate a contribution margin – amount of
revenue remaining after deducting variable costs
Usually stated as a total and also on a per-unit basis

Unit Contribution Margin Contribution Margin is available to cover fixed costs
and contribute to income
Another way of putting it: For every sale, how much of the sale price goes towards fixed costs (or income, once fixed costs are covered)
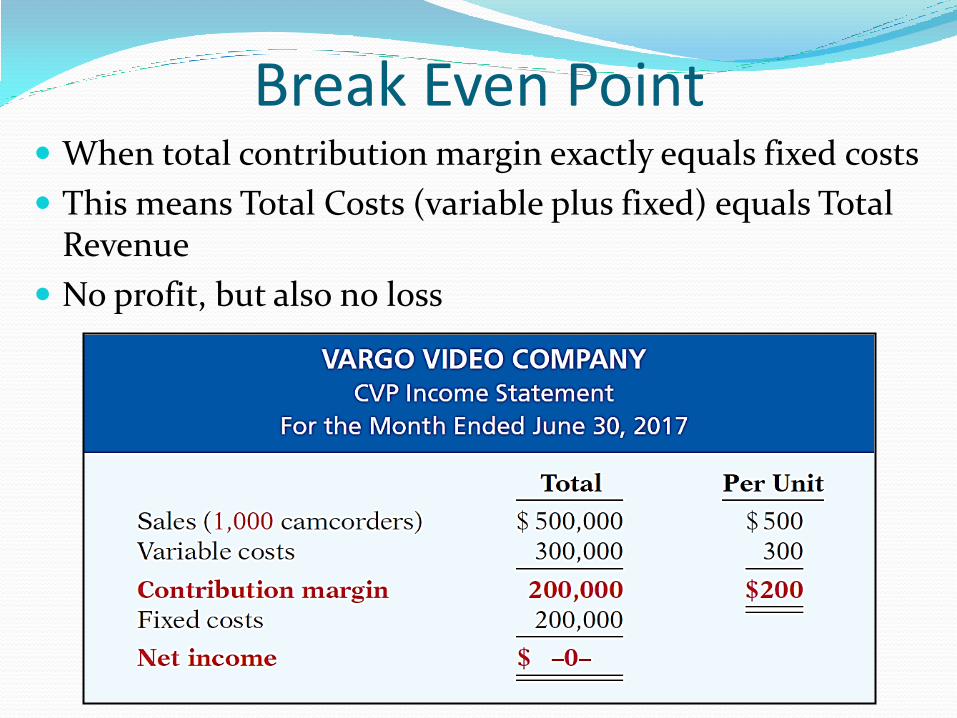
Break Even Point When total contribution margin exactly equals fixed costs
This means Total Costs (variable plus fixed) equals Total Revenue
No profit, but also no loss
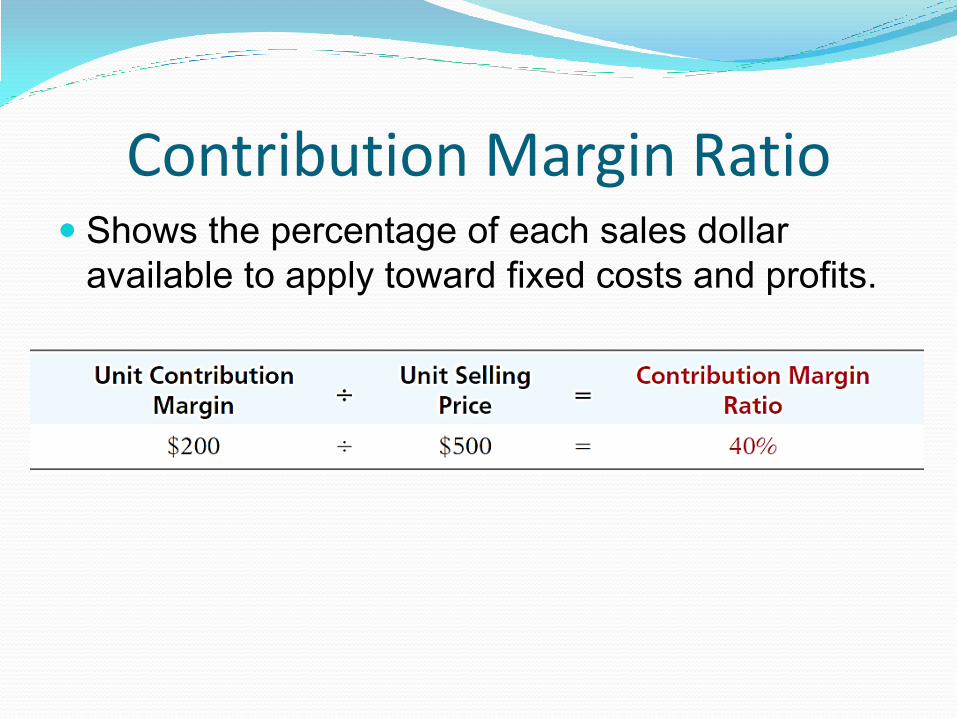
Contribution Margin Ratio Shows the percentage of each sales dollar
available to apply toward fixed costs and profits.
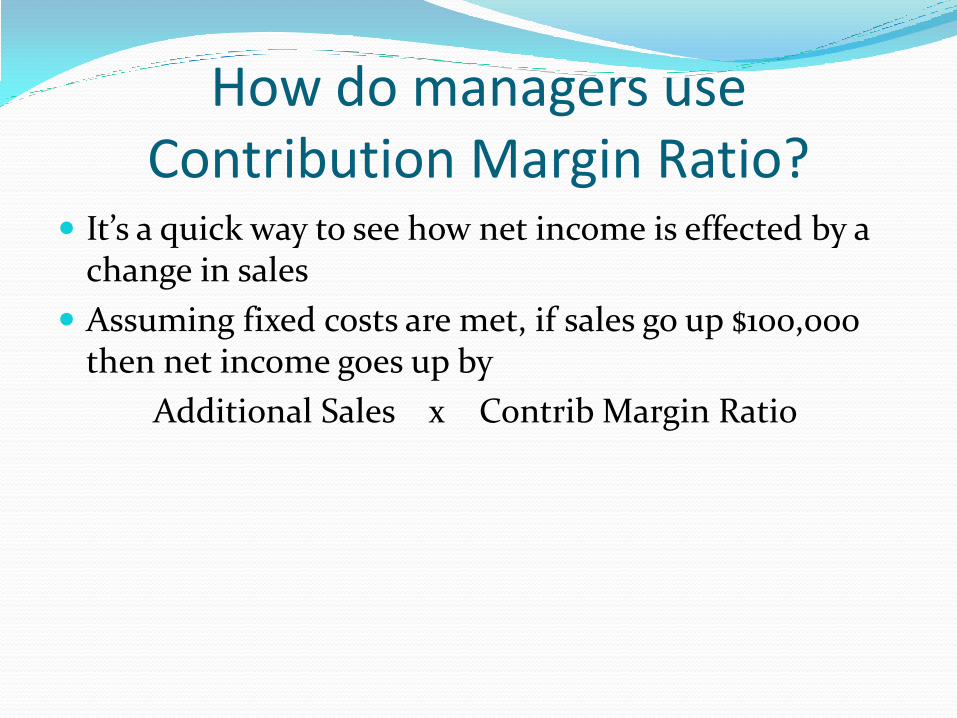
How do managers use Contribution Margin Ratio?
It’s a quick way to see how net income is effected by a change in sales
Assuming fixed costs are met, if sales go up $100,000 then net income goes up by
Additional Sales x Contrib Margin Ratio

Break Even Analysis Calculating the Break Even Point
Can be done three ways:
Mathematical Equation
Contribution Margin Technique
Graphic Presentation
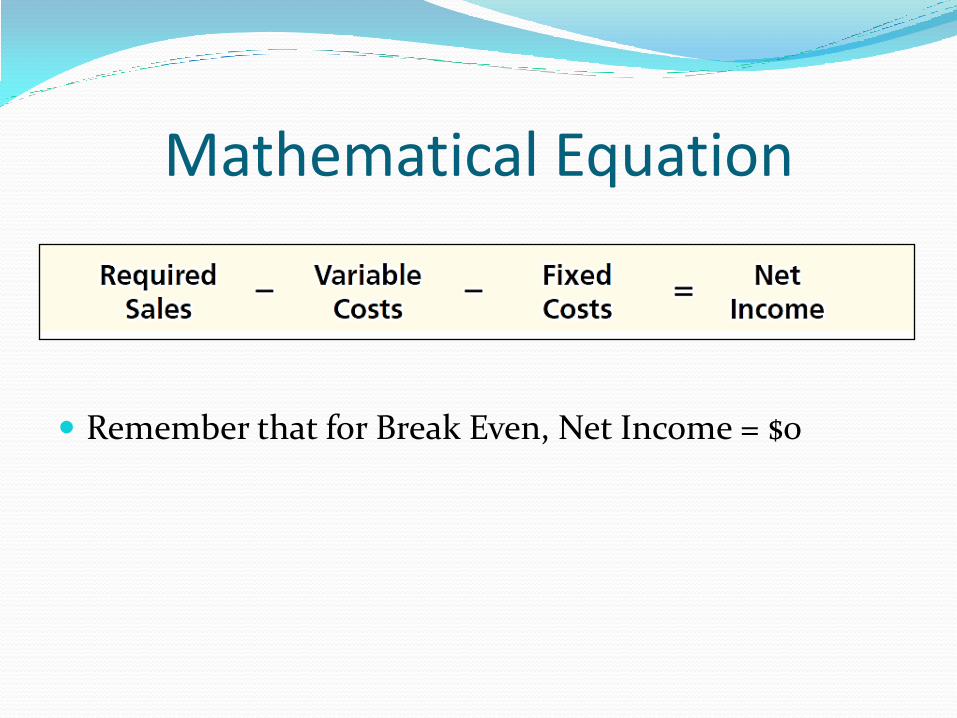
Mathematical Equation
Remember that for Break Even, Net Income = $0
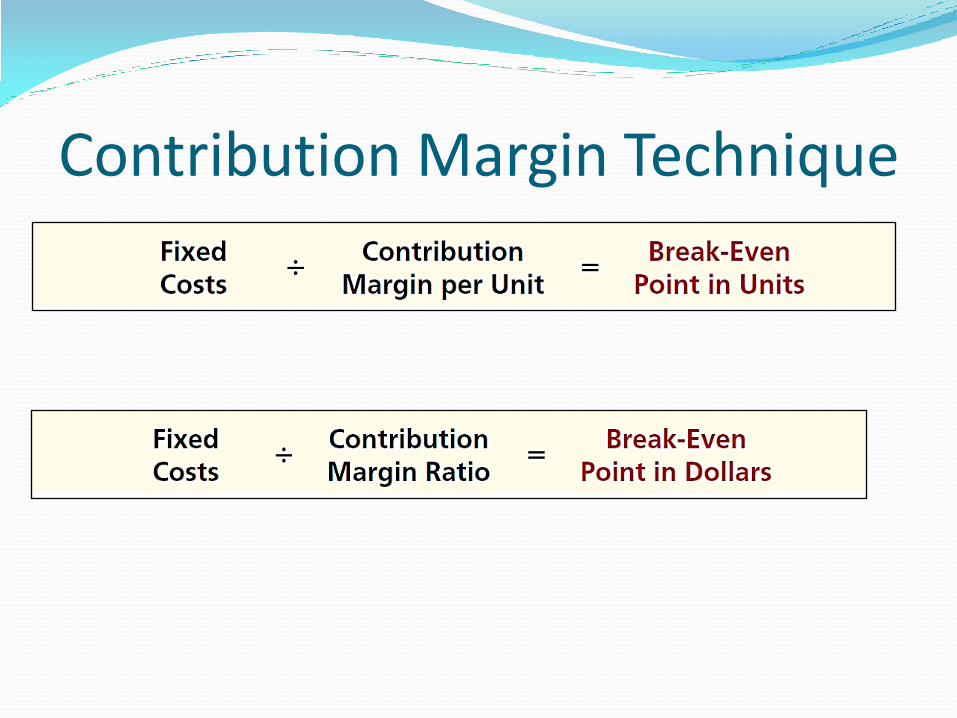
Contribution Margin Technique
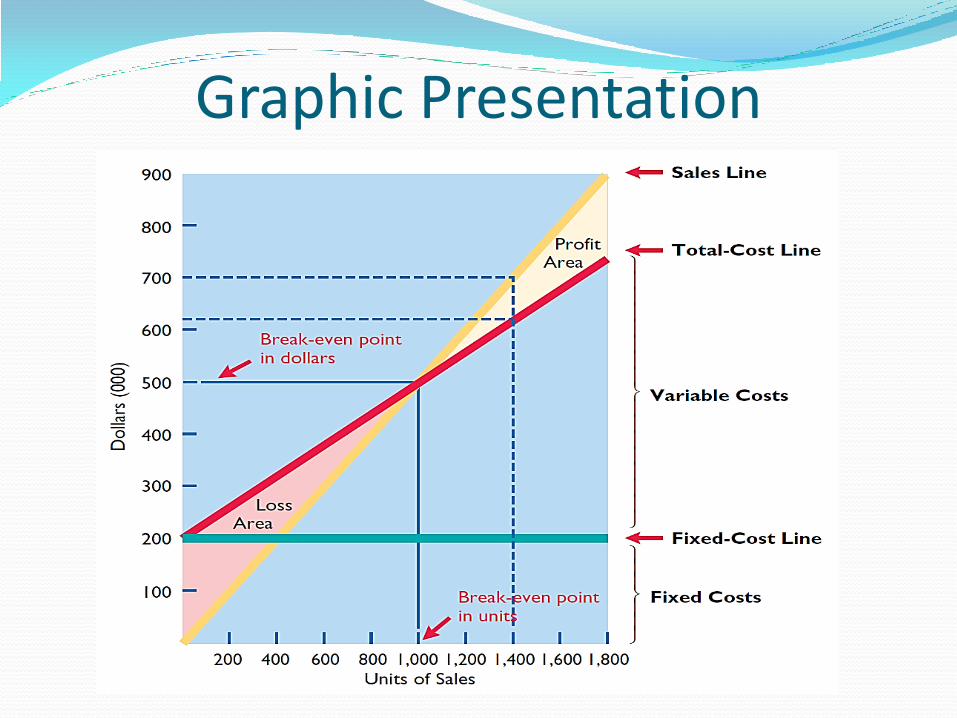
Graphic Presentation

Managers Don’t Want To “Just Break Even”
They usually set a target net income that they’d like to achieve
Then calculate the sales necessary to achieve this income
Use either Mathematical Equation, Contribution Margin Technique, or Graphic Presentation to calculate this
If using Mathematical Equation, Substitute Target Net Income for Break Even $0
If using Contribution Margin Technique, add Target Net Income to Fixed Costs in each equation
On the graph just find the point where Net Income is the desired amount, and trace it to the appropriate number of units or total sales
Safety Margin – a Financial Cushion
The difference between actual or expected sales and sales at the break even point
Tells how far sales could fall before company begins operating at a loss.
Can be in $$$ or a %
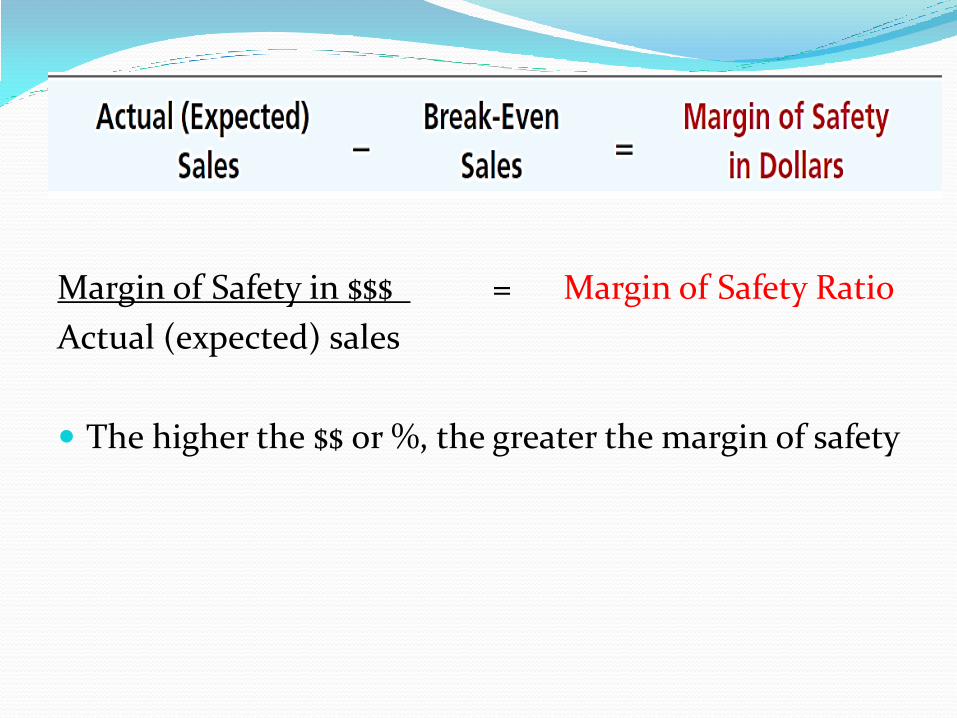
Margin of Safety in $$$ = Margin of Safety Ratio
Actual (expected) sales
The higher the $$ or %, the greater the margin of safety