Embed Size (px)
Citation preview

Managerial Accounting2nd Edition
J. O'Callaghan

Managerial Accounting
by:J. O'Callaghan
Copyright © 2002 John Wiley & Sons, Inc. All rights reserved.
John Wiley & Sons, Inc.New York
0471413658
Due to electronic permissions issues, some material may have been removed from this chapter,though reference to it may occur in the text. The University of Phoenix has determined that thecontent presented herein satisfies the requirements for this course.
ii

Table of Contents
CHAPTER 1MANAGERIAL ACCOUNTING BASICS............................................................................. 5
COMPARING MANAGERIAL AND FINANCIAL ACCOUNTING........................... 6ETHICAL STANDARDS FOR MANAGERIAL ACCOUNTANTS............................... 7MANAGEMENT FUNCTIONS........................................................................................... 7
MANAGERIAL COST CONCEPTS....................................................................................... 9MANUFACTURING COSTS............................................................................................... 9PRODUCT VERSUS PERIOD COSTS............................................................................... 11
MANUFACTURING COSTS IN FINANCIAL STATEMENTS..................................... 13INCOME STATEMENT...................................................................................................... 13BALANCE SHEET............................................................................................................... 16COST CONCEPTS‐A REVIEW.......................................................................................... 18
CONTEMPORARY DEVELOPMENTS IN MANAGERIAL ACCOUNTING............. 20SERVICE INDUSTRY TRENDS......................................................................................... 20VALUE CHAIN MANAGEMENT.................................................................................... 22
APPENDIX 1A ACCOUNTING CYCLE FOR A MANUFACTURING COMPANY... 27WORK SHEET........................................................................................................................... 28CLOSING ENTRIES................................................................................................................ 30SUMMARY OF STUDY OBJECTIVE FOR APPENDIX 1A............................................. 32GLOSSARYū 67
CHAPTER 2COST ACCOUNTING SYSTEMS......................................................................................... 72
JOB ORDER COST SYSTEM.............................................................................................. 73PROCESS COST SYSTEM................................................................................................... 73
JOB ORDER COST FLOW...................................................................................................... 75ACCUMULATING MANUFACTURING COSTS.......................................................... 76ASSIGNING MANUFACTURING COSTS TO WORK IN PROCESS......................... 78ASSIGNING COSTS TO FINISHED GOODS.................................................................. 89ASSIGNING COSTS TO COST OF GOODS SOLD........................................................ 90SUMMARY OF JOB ORDER COST FLOWS.................................................................... 90
REPORTING JOB COST DATA............................................................................................ 92UNDER‐ OR OVERAPPLIED MANUFACTURING OVERHEAD................................ 93
INTERIM BALANCES........................................................................................................ 93YEAR‐END BALANCE....................................................................................................... 94
GLOSSARY.............................................................................................................................. 130CHAPTER 3
THE NATURE OF PROCESS COST SYSTEMS............................................................... 136USES OF PROCESS COST SYSTEMS............................................................................. 136
Managerial AccountingTable of Contents
iii

SIMILARITIES AND DIFFERENCES BETWEEN JOB ORDER COST AND PROCESSCOST SYSTEMS................................................................................................................. 138PROCESS COST FLOW.................................................................................................... 140ASSIGNMENT OF MANUFACTURING COSTS—JOURNAL ENTRIES................ 140
EQUIVALENT UNITS........................................................................................................... 145WEIGHTED‐AVERAGE METHOD................................................................................ 145REFINEMENTS ON THE WEIGHTED‐AVERAGE METHOD.................................. 146PRODUCTION COST REPORT....................................................................................... 148
COMPREHENSIVE EXAMPLE OF PROCESS COSTING............................................. 149COMPUTE THE PHYSICAL UNIT FLOW (STEP 1).................................................... 149COMPUTE EQUIVALENT UNITS OF PRODUCTION (STEP 2).............................. 150COMPUTE UNIT PRODUCTION COSTS (STEP 3)..................................................... 151PREPARE A COST RECONCILIATION SCHEDULE (STEP 4)................................. 152PREPARING THE PRODUCTION COST REPORT..................................................... 153
FINAL COMMENTS.............................................................................................................. 155APPENDIX 3A FIFO METHOD........................................................................................... 162EQUIVALENT UNITS UNDERFIFO................................................................................. 162
ILLUSTRATION................................................................................................................. 163COMPREHENSIVE EXAMPLE........................................................................................... 164
COMPUTE THE PHYSICAL UNIT FLOW (STEP 1).................................................... 165COMPUTE EQUIVALENT UNITS OF PRODUCTION (STEP 2).............................. 166COMPUTE UNIT PRODUCTION COSTS (STEP 3)..................................................... 167PREPARE A COST RECONCILIATION SCHEDULE (STEP 4)................................. 168PREPARING THE PRODUCTION COST REPORT..................................................... 169
FIFO AND WEIGHTED‐AVERAGE................................................................................... 171SUMMARY OF STUDY OBJECTIVE FOR APPENDIX 3A........................................... 171GLOSSARY.............................................................................................................................. 207
CHAPTER 4ACTIVITY‐BASED COSTING VERSUS TRADITIONAL COSTING........................ 213
TRADITIONAL COSTING SYSTEMS............................................................................ 213THE NEED FOR A NEW COSTING SYSTEM.............................................................. 214ACTIVITY‐BASED COSTING.......................................................................................... 215
ILLUSTRATION OF TRADITIONAL COSTING VERSUS ABC................................ 217UNIT COSTS UNDER TRADITIONAL COSTING...................................................... 217UNIT COSTS UNDER ABC.............................................................................................. 217COMPARING UNIT COSTS............................................................................................ 221
ACTIVITY‐BASED COSTING: A CLOSER LOOK......................................................... 224BENEFITS OF ABC............................................................................................................ 224LIMITATIONS OF ABC.................................................................................................... 225WHEN TO SWITCH TO ABC.......................................................................................... 226VALUE‐ADDED VERSUS NONVALUE‐ADDED ACTIVITIES................................ 226
ACTIVITY‐BASED COSTING IN SERVICE INDUSTRIES......................................... 228
Managerial AccountingTable of Contents
iv

TRADITIONAL COSTING EXAMPLE.......................................................................... 229ACTIVITY‐BASED COSTING EXAMPLE..................................................................... 230
JUST‐IN‐TIME PROCESSING............................................................................................ 232OBJECTIVE OF JIT PROCESSING.................................................................................. 233ELEMENTS OF JIT PROCESSING.................................................................................. 233BENEFITS OF JIT PROCESSING..................................................................................... 234
APPENDIX 4A HIERARCHY OF ACTIVITY LEVELS................................................... 238SUMMARY OF STUDY OBJECTIVE FOR APPENDIX 4A........................................... 241GLOSSARY.............................................................................................................................. 280
CHAPTER 5COST BEHAVIOR ANALYSIS............................................................................................ 287
VARIABLE COSTS............................................................................................................ 288FIXED COSTS..................................................................................................................... 289RELEVANT RANGE......................................................................................................... 290MIXED COSTS.................................................................................................................... 292IMPORTANCE OF IDENTIFYING VARIABLE AND FIXED COSTS....................... 295
COST‐VOLUME‐PROFIT ANALYSIS............................................................................... 296BASIC COMPONENTS..................................................................................................... 297CVP INCOME STATEMENT........................................................................................... 297BREAK‐EVEN ANALYSIS............................................................................................... 301MARGIN OF SAFETY....................................................................................................... 307TARGET NET INCOME................................................................................................... 308CVP AND CHANGES IN THE BUSINESS ENVIRONMENT.................................... 310CVP INCOME STATEMENT REVISITED..................................................................... 313
APPENDIX 5A VARIABLE COSTING.............................................................................. 317EFFECTS OF VARIABLE COSTING ON INCOME........................................................ 318RATIONALE FOR VARIABLE COSTING....................................................................... 320SUMMARY OF STUDY OBJECTIVE FOR APPENDIX 5A........................................... 321GLOSSARY.............................................................................................................................. 344
CHAPTER 6BUDGETING BASICS........................................................................................................... 350
BUDGETING AND ACCOUNTING.............................................................................. 351THE BENEFITS OF BUDGETING................................................................................... 351ESSENTIALS OF EFFECTIVE BUDGETING................................................................. 352LENGTH OF THE BUDGET PERIOD............................................................................ 352THE BUDGETING PROCESS.......................................................................................... 352BUDGETING AND HUMAN BEHAVIOR.................................................................... 353BUDGETING AND LONG‐RANGE PLANNING....................................................... 354THE MASTER BUDGET................................................................................................... 355
PREPARING THE OPERATING BUDGETS.................................................................... 356SALES BUDGET................................................................................................................. 356PRODUCTION BUDGET................................................................................................. 357
Managerial AccountingTable of Contents
v

DIRECT MATERIALS BUDGET...................................................................................... 358DIRECT LABOR BUDGET............................................................................................... 360MANUFACTURING OVERHEAD BUDGET............................................................... 360SELLING AND ADMINISTRATIVE EXPENSE BUDGET.......................................... 361BUDGETED INCOME STATEMENT............................................................................. 363
PREPARING THE FINANCIAL BUDGETS..................................................................... 364CASH BUDGET.................................................................................................................. 364BUDGETED BALANCE SHEET...................................................................................... 368
BUDGETING IN NONMANUFACTURING COMPANIES......................................... 370MERCHANDISERS........................................................................................................... 370SERVICE ENTERPRISES.................................................................................................. 372NOT‐FOR‐PROFIT ORGANIZATIONS......................................................................... 373
GLOSSARY.............................................................................................................................. 407CHAPTER 7
CONCEPT OF BUDGETARY CONTROL......................................................................... 413STATIC BUDGET REPORTS............................................................................................... 414
ILLUSTRATIONS.............................................................................................................. 415USES AND LIMITATIONS.............................................................................................. 416
FLEXIBLE BUDGETS............................................................................................................. 417WHY FLEXIBLE BUDGETS?............................................................................................ 418DEVELOPING THE FLEXIBLE BUDGET...................................................................... 421FLEXIBLE BUDGET—A CASE STUDY......................................................................... 421FLEXIBLE BUDGET REPORTS........................................................................................ 424MANAGEMENT BY EXCEPTION................................................................................. 425
THE CONCEPT OF RESPONSIBILITY ACCOUNTING............................................... 427CONTROLLABLE VERSUS NONCONTROLLABLE REVENUES AND COSTS.... 429RESPONSIBILITY REPORTING SYSTEM..................................................................... 430
TYPES OF RESPONSIBILITY CENTERS.......................................................................... 432RESPONSIBILITY ACCOUNTING FOR COST CENTERS......................................... 433RESPONSIBILITY ACCOUNTING FOR PROFIT CENTERS..................................... 434RESPONSIBILITY ACCOUNTING FOR INVESTMENT CENTERS......................... 437PRINCIPLES OF PERFORMANCE EVALUATION.................................................... 440
APPENDIX 7A RESIDUAL INCOME—ANOTHER PERFORMANCEMEASUREMENT.................................................................................................................... 446RESIDUAL INCOME COMPARED TOROI..................................................................... 447RESIDUAL INCOME WEAKNESS.................................................................................... 448SUMMARY OF STUDY OBJECTIVE FOR APPENDIX 7A........................................... 449GLOSSARY.............................................................................................................................. 485
CHAPTER 8THE NEED FOR STANDARDS........................................................................................... 490
DISTINGUISHING BETWEEN STANDARDS AND BUDGETS............................... 491WHY STANDARD COSTS?............................................................................................. 491
Managerial AccountingTable of Contents
vi

SETTING STANDARD COSTS—A DIFFICULT TASK................................................ 492IDEAL VERSUS NORMAL STANDARDS.................................................................... 493A CASE STUDY................................................................................................................. 493
VARIANCES FROM STANDARDS................................................................................... 498ANALYZING VARIANCES............................................................................................. 499REPORTING VARIANCES.............................................................................................. 513STATEMENT PRESENTATION OF VARIANCES....................................................... 514
APPENDIX 8A STANDARD COST ACCOUNTING SYSTEM................................... 519JOURNAL ENTRIES.............................................................................................................. 520LEDGER ACCOUNTS........................................................................................................... 522SUMMARY OF STUDY OBJECTIVE FOR APPENDIX 8A........................................... 523GLOSSARY.............................................................................................................................. 551
CHAPTER 9MANAGEMENT'S DECISION‐MAKING PROCESS.................................................... 557
INCREMENTAL ANALYSIS APPROACH................................................................... 557HOW INCREMENTAL ANALYSIS WORKS................................................................ 558
TYPES OF INCREMENTAL ANALYSIS........................................................................... 559ACCEPT AN ORDER AT A SPECIAL PRICE............................................................... 560MAKE OR BUY.................................................................................................................. 560SELL OR PROCESS FURTHER........................................................................................ 563RETAIN OR REPLACE EQUIPMENT........................................................................... 566ELIMINATE AN UNPROFITABLE SEGMENT............................................................ 567
SALES MIX.............................................................................................................................. 570BREAK‐EVEN SALES....................................................................................................... 570LIMITED RESOURCES..................................................................................................... 572
OTHER CONSIDERATIONS IN DECISION MAKING............................................... 574QUALITATIVE FACTORS............................................................................................... 574RELATIONSHIP OF INCREMENTAL ANALYSIS AND ACTIVITY‐BASED COSTING.5 7 5
GLOSSARY.............................................................................................................................. 604CHAPTER 10
THE CAPITAL BUDGETING EVALUATION PROCESS............................................. 611CASH FLOW INFORMATION....................................................................................... 612ILLUSTRATIVE DATA..................................................................................................... 613
CASH PAYBACK.................................................................................................................... 614NET PRESENT VALUE METHOD..................................................................................... 615
EQUAL ANNUAL CASH FLOWS.................................................................................. 616UNEQUAL ANNUAL CASH FLOWS........................................................................... 617CHOOSING A DISCOUNT RATE.................................................................................. 618SIMPLIFYING ASSUMPTIONS...................................................................................... 619COMPREHENSIVE EXAMPLE....................................................................................... 621
ADDITIONAL CONSIDERATIONS................................................................................. 622
Managerial AccountingTable of Contents
vii

INTANGIBLE BENEFITS................................................................................................. 622MUTUALLY EXCLUSIVE PROJECTS............................................................................ 624RISK ANALYSIS................................................................................................................ 626POST‐AUDIT OF INVESTMENT PROJECTS................................................................ 627
OTHER CAPITAL BUDGETING TECHNIQUES........................................................... 628INTERNAL RATE OF RETURN METHOD.................................................................. 628COMPARING DISCOUNTED CASH FLOW METHODS.......................................... 630ANNUAL RATE OF RETURN METHOD..................................................................... 631
GLOSSARY.............................................................................................................................. 660CHAPTER 11
SECTION 1 EXTERNAL SALES.......................................................................................... 666PRICING IN A COMPETITIVE MARKET....................................................................... 668COST‐PLUS PRICING.......................................................................................................... 669
LIMITATIONS OF COST‐PLUS PRICING.................................................................... 671TIME AND MATERIAL PRICING..................................................................................... 674SECTION 2 INTERNAL SALES.......................................................................................... 678NEGOTIATED TRANSFER PRICES.................................................................................. 680
NO EXCESS CAPACITY................................................................................................... 680EXCESS CAPACITY.......................................................................................................... 681VARIABLE COSTS............................................................................................................ 682SPECIAL ORDER............................................................................................................... 683SUMMARY OF NEGOTIATED TRANSFER PRICING APPROACH....................... 683
COST‐BASED TRANSFER PRICES................................................................................... 684MARKET‐BASED TRANSFER PRICES............................................................................. 685EFFECT OF OUTSOURCING ON TRANSFER PRICING............................................. 686TRANSFERS BETWEEN DIVISIONS IN DIFFERENT COUNTRIES........................ 686APPENDIX 11A OTHER COST APPROACHES TO PRICING.................................... 691ABSORPTION COST APPROACH.................................................................................... 691CONTRIBUTION (VARIABLE COST) APPROACH..................................................... 694SUMMARY OF STUDY OBJECTIVE FOR APPENDIX 11A......................................... 696COMPREHENSIVE PROBLEM: CHAPTERS 1–11.......................................................... 723GLOSSARY.............................................................................................................................. 730
CHAPTER 12THE STATEMENT OF CASH FLOWS: PURPOSE AND FORMAT............................ 735
PURPOSE OF THE STATEMENT OF CASH FLOWS................................................. 736MEANING OF “CASH FLOWS”.................................................................................... 736CLASSIFICATION OF CASH FLOWS........................................................................... 737SIGNIFICANT NONCASH ACTIVITIES....................................................................... 738FORMAT OF THE STATEMENT OF CASH FLOWS.................................................. 740THE CORPORATE LIFE CYCLE..................................................................................... 741USEFULNESS OF THE STATEMENT OF CASH FLOWS.......................................... 743PREPARING THE STATEMENT OF CASH FLOWS................................................... 744
Managerial AccountingTable of Contents
viii

INDIRECT AND DIRECT METHODS........................................................................... 745SECTION 1 STATEMENT OF CASH FLOWS—INDIRECT METHOD..................... 747FIRST YEAR OF OPERATIONS—2002.............................................................................. 747
STEP 1: DETERMINE THE NET INCREASE/DECREASE IN CASH........................ 748STEP 2: DETERMINE NET CASH PROVIDED/USED BY OPERATINGACTIVITIES........................................................................................................................ 749STEP 3: DETERMINE NET CASH PROVIDED/USED BY INVESTING ANDFINANCING ACTIVITIES............................................................................................... 751STATEMENT OF CASH FLOWS—2002........................................................................ 752
SECOND YEAR OF OPERATIONS—2003........................................................................ 753STEP 1: DETERMINE THE NET INCREASE/DECREASE IN CASH........................ 754STEP 2: DETERMINE NET CASH PROVIDED/USED BY OPERATINGACTIVITIES........................................................................................................................ 754STEP 3: DETERMINE NET CASH PROVIDED/USED BY INVESTING ANDFINANCING ACTIVITIES............................................................................................... 756STATEMENT OF CASH FLOWS—2003........................................................................ 758SUMMARY OF CONVERSION TO NET CASH PROVIDED BY OPERATINGACTIVITIES—INDIRECT METHOD............................................................................. 758
SECTION 1 STATEMENT OF CASH FLOWS—DIRECT METHOD.......................... 762FIRST YEAR OF OPERATIONS—2002.............................................................................. 762
STEP 1: DETERMINE THE NET INCREASE/DECREASE IN CASH........................ 764STEP 2: DETERMINE NET CASH PROVIDED/USED BY OPERATINGACTIVITIES........................................................................................................................ 764STEP 3: DETERMINE NET CASH PROVIDED/USED BY INVESTING ANDFINANCING ACTIVITIES............................................................................................... 769STATEMENT OF CASH FLOWS—2002........................................................................ 770
SECOND YEAR OF OPERATIONS—2003........................................................................ 771STEP 1: DETERMINE THE NET INCREASE/DECREASE IN CASH........................ 772STEP 2: DETERMINE NET CASH PROVIDED/USED BY OPERATINGACTIVITIES........................................................................................................................ 772STEP 3: DETERMINE NET CASH PROVIDED/USED BY INVESTING ANDFINANCING ACTIVITIES............................................................................................... 775STATEMENT OF CASH FLOWS—2003........................................................................ 776
USING CASH FLOWS TO EVALUATE A COMPANY................................................. 779FREE CASH FLOW............................................................................................................ 779CAPITAL EXPENDITURE RATIO.................................................................................. 781ASSESSING LIQUIDITY, SOLVENCY, AND PROFITABILITY USINGCASH FLOWS.................................................................................................................... 782
GLOSSARY.............................................................................................................................. 836CHAPTER 13
EARNING POWER AND IRREGULAR ITEMS.............................................................. 842DISCONTINUED OPERATIONS.................................................................................... 843
Managerial AccountingTable of Contents
ix

EXTRAORDINARY ITEMS.............................................................................................. 844CHANGES IN ACCOUNTING PRINCIPLE................................................................. 847COMPREHENSIVE INCOME......................................................................................... 849
COMPARATIVE ANALYSIS............................................................................................... 849HORIZONTAL ANALYSIS.............................................................................................. 851VERTICAL ANALYSIS..................................................................................................... 855
RATIO ANALYSIS................................................................................................................. 859LIQUIDITY RATIOS.......................................................................................................... 862SOLVENCY RATIOS......................................................................................................... 867PROFITABILITY RATIOS................................................................................................. 870
LIMITATIONS OF FINANCIAL ANALYSIS................................................................... 878ESTIMATES........................................................................................................................ 878COST....ū 878ALTERNATIVE ACCOUNTING METHODS............................................................... 879ATYPICAL DATA............................................................................................................. 879DIVERSIFICATION........................................................................................................... 879
GLOSSARY.............................................................................................................................. 931APPENDIX A
THE ANNUAL REPORT....................................................................................................... 935FINANCIAL HIGHLIGHTS................................................................................................. 936
Corporate Principles ......................................................................................................... 936Corporate Profile ............................................................................................................... 937
LETTER TO THE STOCKHOLDERS................................................................................. 937To Our Shareholders ........................................................................................................ 937Operating Report .............................................................................................................. 939
MANAGEMENT DISCUSSION AND ANALYSIS........................................................ 942Management's Discussion and Analysis of Financial Condition and Results ofOperations .......................................................................................................................... 942
FINANCIAL STATEMENTS AND ACCOMPANYING NOTES................................. 948Notes to Consolidated Financial Statements ................................................................ 953
AUDITOR'S REPORT............................................................................................................ 966Report of Independent Accountants .............................................................................. 967
SUPPLEMENTARY FINANCIAL INFORMATION....................................................... 967APPENDIX BAPPENDIX C
NATURE OF INTEREST....................................................................................................... 977SIMPLE INTEREST............................................................................................................ 978COMPOUND INTEREST................................................................................................. 978
SECTION 1 FUTURE VALUE CONCEPTS....................................................................... 979FUTURE VALUE OF A SINGLE AMOUNT..................................................................... 979FUTURE VALUE OF AN ANNUITY.................................................................................. 982SECTION 2 PRESENT VALUE CONCEPTS..................................................................... 985
Managerial AccountingTable of Contents
x

PRESENT VALUE VARIABLES.......................................................................................... 985PRESENT VALUE OF A SINGLE AMOUNT................................................................... 985PRESENT VALUE OF AN ANNUITY................................................................................ 988TIME PERIODS AND DISCOUNTING............................................................................ 991COMPUTING THE PRESENT VALUES IN A CAPITAL BUDGETINGDECISIONū 991GLOSSARY............................................................................................................................ 1000
APPENDIX DETHICAL BEHAVIOR FOR PRACTITIONERS OF MANAGEMENT ACCOUNTINGAND FINANCIAL MANAGEMENT............................................................................... 1001STANDARDS OF ETHICAL CONDUCT FOR PRACTITIONERS OF MANAGEMENTACCOUNTING AND FINANCIAL MANAGEMENT................................................. 1002
COMPETENCE................................................................................................................ 1002CONFIDENTIALITY....................................................................................................... 1002INTEGRITY....................................................................................................................... 1003OBJECTIVITY................................................................................................................... 1003RESOLUTION OF ETHICAL CONFLICT................................................................... 1003
AFTERWORDCASE‐1....ū 1007CARD‐MART SWIMS IN THE DOT‐COM SEA: JOB ORDER COSTING............. 1007
THE BUSINESS SITUATION......................................................................................... 1007CASE‐2....ū 1010CARD‐MART SWIMS IN THE DOT‐COM SEA: ACTIVITY‐BASED COSTING.. 1010
THE BUSINESS SITUATION......................................................................................... 1011CASE‐3....ū 1016CARD‐MART SWIMS IN THE DOT‐COM SEA: CAPITAL BUDGETING............ 1016
THE BUSINESS SITUATION......................................................................................... 1016CASE‐4....ū 1019CARD‐MART SWIMS IN THE DOT‐COM SEA: TRANSFER PRICING ISSUES. 1019
THE BUSINESS SITUATION......................................................................................... 1019CASE‐5....ū 1022RICHLAND CIRCULAR CLUB PRO RODEO ROUNDUP......................................... 1022
THE BUSINESS SITUATION......................................................................................... 1022
Managerial AccountingTable of Contents
xi

Managerial AccountingTable of Contents
xii

Chapter 6
Budgetary Planning
Navigator
• Scan Study Objectives
• Read Feature Story
• Read Preview
• Read text and answer Before You Go On
p.235 □ p.246 □ p.249 □
• Work Using the Decision Toolkit
• Review Summary of Study Objectives
• Work Demonstration Problem
• Answer Self‐Study Questions
• Complete Assignments
Managerial AccountingChapter 6
Page 347

STUDY OBJECTIVES
After studying this chapter, you should be able to:
1. Indicate the benefits of budgeting.
2. State the essentials of effective budgeting.
3. Identify the budgets that comprise the master budget.
4. Describe the sources for preparing the budgeted income statement.
5. Explain the principal sections of a cash budget.
6. Indicate the applicability of budgeting in nonmanufacturing companies.
Managerial AccountingChapter 6
Page 348

Feature Story
THE NEXT AMAZON.COM? WELL, ALMOST
The bursting of the dot‐com bubble resulted in countless stories of dot‐com failures. Manyof these ventures were half‐baked, get‐rich‐quick schemes, rarely based on sound businesspractices. Initially they saw money flowing in faster than they knew what to do with—whichwas precisely the problem. Without proper planning and budgeting, much of the moneywent to waste. In some cases, failure was actually brought on by rapid, uncontrolled growth.
One such example was the Web site www. Positively‐You.com, an online discount bookseller.One of the co‐founders, Lyle Bowline, had never run a business. However, his experienceas an assistant director of an entrepreneurial center had provided him with knowledge aboutthe do's and don'ts of small business. To minimize costs, he started the company off smalland simple. He invested $5,000 in computer equipment and ran the business out of hisbasement. In the early months, even though sales were only about $2,000 a month, thecompany actually made a profit because it kept its costs low (a feat few other dot‐coms couldboast of).
Things changed dramatically when the company received national publicity in the financialpress. Suddenly the company's sales increased to $50,000 a month—fully 25 times the previouslevel. The “simple” little business suddenly needed a business plan, a strategic plan, and abudget. It needed to rent office space and to hire employees. Initially, members of a localbook club donated time to help meet the sudden demand. But quickly the number of paid
Managerial AccountingChapter 6
Page 349
employees ballooned. The sudden growth necessitated detailed planning and budgeting.The need for a proper budget was accentuated by the fact that the company's gross profitwas only 16 cents on each dollar of goods sold. This meant that after paying for its inventory,the company had only 16 cents of every dollar to cover its remaining operating costs.
Unfortunately, the company never got things under control. Within a few months, sales hadplummeted to $12,000 per month. At this level of sales the company could not meet themountain of monthly expenses that it had accumulated in trying to grow. Ironically, thecompany's sudden success, and the turmoil it created, appears to have been what eventuallycaused the company to fail.
PREVIEW OF CHAPTER 6
As the Feature Story about the Positively‐You.com indicates, budgeting is critical to financialwell‐being. As a student, you budget your study time and your money. Families budgetincome and expenses. Governmental agencies budget revenues and expenditures. Businessenterprises use budgets in planning and controlling their operations.
Our primary focus in this chapter is budgeting—specifically, how budgeting is used as aplanning tool by management. Through budgeting, it should be possible for managementto maintain enough cash to pay creditors, to have sufficient raw materials to meet productionrequirements, and to have adequate finished goods to meet expected sales.
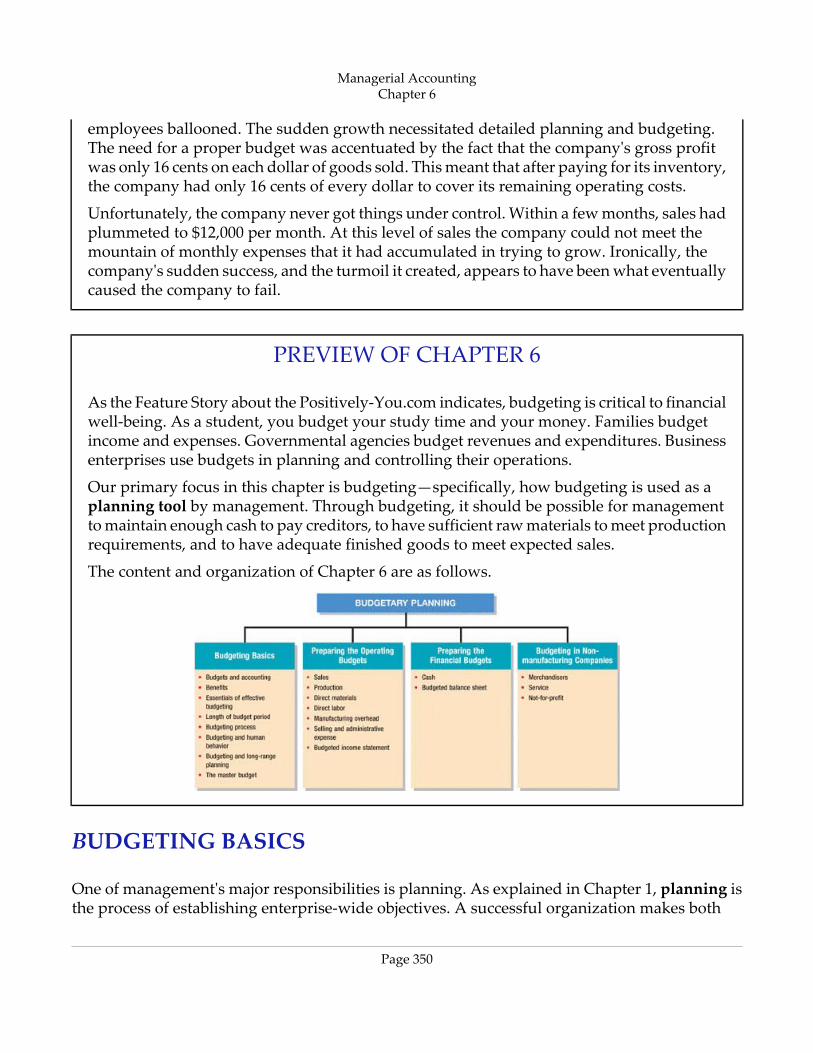
The content and organization of Chapter 6 are as follows.
BUDGETING BASICS
One of management's major responsibilities is planning. As explained in Chapter 1, planning isthe process of establishing enterprise‐wide objectives. A successful organization makes both
Managerial AccountingChapter 6
Page 350

long‐term and short‐term plans. These plans set forth the objectives of the company and theproposed way of accomplishing them.
A budget is a formal written statement of management's plans for a specified future time period,expressed in financial terms. It normally represents the primary method of communicatingagreed‐upon objectives throughout the organization. Once adopted, a budget becomes animportant basis for evaluating performance. It promotes efficiency and serves as a deterrent towaste and inefficiency. We consider the role of budgeting as a control device in Chapter 7.
BUDGETING AND ACCOUNTING
Accounting information makes major contributions to the budgeting process. From the accountingrecords, historical data on revenues, costs, and expenses can be obtained. These data are helpfulin formulating future budget goals.
Normally, accountants have the responsibility for expressing management's budgeting goals infinancial terms. In this role, they translate management's plans and communicate the budget toall areas of responsibility. Accountants also prepare periodic budget reports that provide thebasis for measuring performance and comparing actual results with planned objectives. Thebudget itself, and the administration of the budget, however, are entirely managementresponsibilities.
THE BENEFITS OF BUDGETING
The primary benefits of budgeting are:
1. It requires all levels of management to plan ahead and to formalize their goals on arecurring basis.
2. It provides definite objectives for evaluating performance at each level of responsibility.
3. It creates an early warning system for potential problems. With early warning,management has time to make changes before things get out of hand.
4. It facilitates the coordination of activitieswithin the business. It does this by correlatingthe goals of each segment with overall company objectives. Thus, production and salespromotion can be integrated with expected sales.
5. It results in greater management awareness of the entity's overall operations and theimpact on operations of external factors, such as economic trends.
6. It motivates personnel throughout the organization to meet planned objectives.
A budget is an aid to management; it is not a substitute for management. A budget cannot operateor enforce itself. The benefits of budgeting will be realized only when budgets are carefullyprepared and properly administered by management.
Managerial AccountingChapter 6
Page 351

ESSENTIALS OF EFFECTIVE BUDGETING
Effective budgeting depends on a sound organizational structure. In such a structure, authorityand responsibility for all phases of operations are clearly defined. Budgets based on researchand analysis should result in realistic goals that will contribute to the growth and profitabilityof a company. And, the effectiveness of a budget program is directly related to its acceptance byall levels of management.
Once the budget has been adopted, it should be an important tool for evaluating performance.Variations between actual and expected results should be systematically and periodically reviewedto determine their cause(s). However, individuals should not be held responsible for variationsthat are beyond their control.
LENGTH OF THE BUDGET PERIOD
The budget period is not necessarily one year in length. A budget may be prepared for anyperiod of time. Various factors influence the length of the budget period. These factors includethe type of budget, the nature of the organization, the need for periodic appraisal, and prevailingbusiness conditions. For example, cash may be budgeted monthly, whereas a plant expansionbudget may cover a ten‐year period.
The budget period should be long enough to provide an attainable goal under normal businessconditions. Ideally, the time period should minimize the impact of seasonal or cyclical fluctuations.On the other hand, the budget period should not be so long that reliable estimates are impossible.
The most common budget period is one year. The annual budget, in turn, is often supplementedby monthly and quarterly budgets. Many companies use continuous twelve‐month budgets.These budgets drop the month just ended and add a future month. One advantage of continuousbudgeting is that it keeps management planning a full year ahead.
THE BUDGETING PROCESS
The development of the budget for the coming year generally starts several months before theend of the current year. The budgeting process usually begins with the collection of data fromeach organizational unit of the company. Past performance is often the starting point from whichfuture budget goals are formulated.
The budget is developed within the framework of a sales forecast. This forecast shows potentialsales for the industry and the company's expected share of such sales. Sales forecasting involvesa consideration of various factors: (1) general economic conditions, (2) industry trends, (3) marketresearch studies, (4) anticipated advertising and promotion, (5) previous market share, (6) changesin prices, and (7) technological developments. The input of sales personnel and top managementare essential to the sales forecast.
Managerial AccountingChapter 6
Page 352

In small companies like Positively‐You.com, the budgeting process is often informal. In largercompanies, responsibility for coordinating the preparation of the budget is assigned to a budgetcommittee. The committee ordinarily includes the president, treasurer, chief accountant(controller), and management personnel from each of the major areas of the company, such assales, production, and research. The budget committee serves as a review board where managerscan defend their budget goals and requests. Differences are reviewed, modified if necessary, andreconciled. The budget is then put in its final form by the budget committee, approved, anddistributed.
Management Perspective
A recent study by Willard & Shullman Group Ltd. found that fewer than 14 percent ofbusinesses with fewer than 500 employees do an annual budget or have a written businessplan. In all, nearly 60 percent of these businesses have no plans on paper at all. For manysmall businesses the basic assumption is that, “As long as I sell as much as I can, and keepmy employees paid, I'm doing OK.” A few small business owners even say that they see noneed for budgeting and planning. Most small business owners, though, say that theyunderstand that budgeting and planning is critical for survival and growth. But given thelong hours that they already work addressing day‐to‐day challenges, they also say that theyare “just too busy to plan for the future.”
BUDGETING AND HUMAN BEHAVIOR
A budget can have a significant impact on human behavior. It may inspire a manager to higherlevels of performance. Or, it may discourage additional effort and pull down the morale of amanager. Why do these diverse effects occur? The answer is found in how the budget is developedand administered.
In developing the budget, each level of management should be invited to participate. The overallgoal is to reach agreement on a budget that the manager considers fair and achievable. Whenthis objective is met, the budget will have a positive effect on the manager. In contrast, if themanager views the budget as being unfair and unrealistic, he or she may feel discouraged anduncommitted to the budget goals. The risk of having unrealistic budgets is generally greaterwhen the budget is developed from top management down to lower management than viceversa. Illustration 1 graphically displays the appropriate flow of budget data from bottom to topin an organization.
Managerial AccountingChapter 6
Page 353
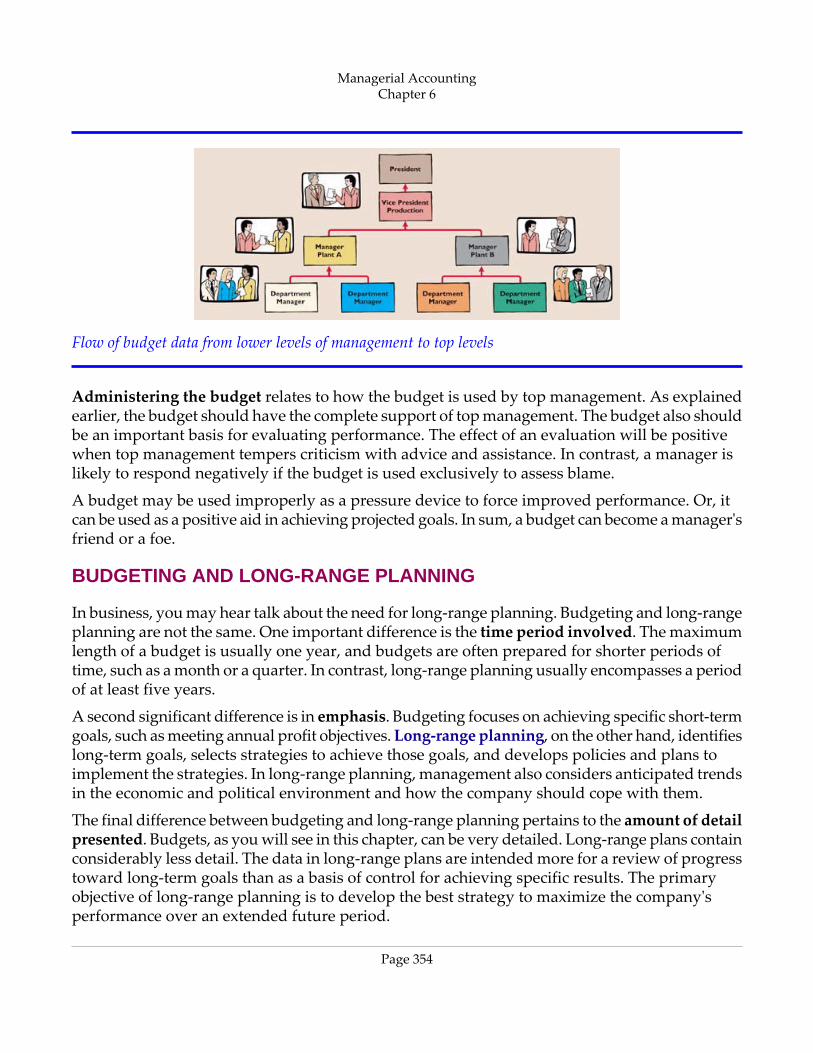
Flow of budget data from lower levels of management to top levels
Administering the budget relates to how the budget is used by top management. As explainedearlier, the budget should have the complete support of top management. The budget also shouldbe an important basis for evaluating performance. The effect of an evaluation will be positivewhen top management tempers criticism with advice and assistance. In contrast, a manager islikely to respond negatively if the budget is used exclusively to assess blame.
A budget may be used improperly as a pressure device to force improved performance. Or, itcan be used as a positive aid in achieving projected goals. In sum, a budget can become a manager'sfriend or a foe.
BUDGETING AND LONG-RANGE PLANNING
In business, you may hear talk about the need for long‐range planning. Budgeting and long‐rangeplanning are not the same. One important difference is the time period involved. The maximumlength of a budget is usually one year, and budgets are often prepared for shorter periods oftime, such as a month or a quarter. In contrast, long‐range planning usually encompasses a periodof at least five years.
A second significant difference is in emphasis. Budgeting focuses on achieving specific short‐termgoals, such as meeting annual profit objectives. Long‐range planning, on the other hand, identifieslong‐term goals, selects strategies to achieve those goals, and develops policies and plans toimplement the strategies. In long‐range planning, management also considers anticipated trendsin the economic and political environment and how the company should cope with them.
The final difference between budgeting and long‐range planning pertains to the amount of detailpresented. Budgets, as you will see in this chapter, can be very detailed. Long‐range plans containconsiderably less detail. The data in long‐range plans are intended more for a review of progresstoward long‐term goals than as a basis of control for achieving specific results. The primaryobjective of long‐range planning is to develop the best strategy to maximize the company'sperformance over an extended future period.
Managerial AccountingChapter 6
Page 354

THE MASTER BUDGET
The term “budget” is actually a shorthand term to describe a variety of budget documents. Allof these documents are combined into a master budget. The master budget is a set of interrelatedbudgets that constitutes a plan of action for a specified time period. The individual budgetsincluded in a master budget are pictured in Illustration 2.
Components of the master budget
As the illustration shows, the master budget contains two classes of budgets. Operating budgetsare the individual budgets that result in the preparation of the budgeted income statement. Thesebudgets establish goals for the company's sales and production personnel. In contrast, financialbudgets are the capital expenditure budget, the cash budget, and the budgeted balance sheet.These budgets focus primarily on the cash resources needed to fund expected operations andplanned capital expenditures.
The master budget is prepared in the sequence shown in Illustration 2. The operating budgetsare developed first, beginning with the sales budget. Then the financial budgets are prepared.
Managerial AccountingChapter 6
Page 355

We will explain and illustrate each budget shown in Illustration 2 except the capital expenditurebudget. This budget is discussed under the topic Capital Budgeting in Chapter 10.
Before You Go On...
Review It
1. What are the benefits of budgeting?
2. What are the factors essential to effective budgeting?
3. How does the budget process work?
4. How does budgeting differ from long‐range planning?
5. What is a master budget?
PREPARING THE OPERATING BUDGETS
A case study of Hayes Company will be used in preparing the operating budgets. Hayesmanufactures and sells a single product, Kitchen‐mate. The budgets will be prepared by quartersfor the year ending December 31, 2002. Hayes Company begins its annual budgeting process onSeptember 1, 2001, and it completes the budget for 2002 by December 1, 2001.
SALES BUDGET
As shown in the master budget in Illustration 2, the sales budget is the first budget prepared.Each of the other budgets depends on the sales budget. The sales budget is derived from thesales forecast. It represents management's best estimate of sales revenue for the budget period.An inaccurate sales budget may adversely affect net income. For example, an overly optimisticsales budget may result in excessive inventories that may have to be sold at reduced prices. Incontrast, an unduly conservative budget may result in loss of sales revenue due to inventoryshortages.
The sales budget is prepared by multiplying the expected unit sales volume for each product byits anticipated unit selling price. For Hayes Company, sales volume is expected to be 3,000 unitsin the first quarter, with 500‐unit increments in each succeeding quarter. Based on a sales priceof $60 per unit, the sales budget for the year, by quarters, is shown in Illustration 3. Somecompanies classify the anticipated sales revenue as cash or credit sales and by geographicalregions, territories, or salespersons.
Managerial AccountingChapter 6
Page 356

Sales budget
PRODUCTION BUDGET
The production budget shows the units that must be produced to meet anticipated sales.Production requirements are determined from the following formula.1
Production requirements formula
A realistic estimate of ending inventory is essential in scheduling production requirements.Excessive inventories in one quarter may lead to cutbacks in production and employee layoffsin a subsequent quarter. On the other hand, inadequate inventories may result either in addedcosts for overtime work or in lost sales. Hayes Company believes it can meet future salesrequirements by maintaining an ending inventory equal to 20 percent of the next quarter'sbudgeted sales volume. For example, the ending finished goods inventory for the first quarteris 700 units (20% × anticipated second‐quarter sales of 3,500 units). The production budget isshown in Illustration 5.
Managerial AccountingChapter 6
Page 357

Production budget
The production budget, in turn, provides the basis for determining the budgeted costs for eachmanufacturing cost element, as explained in the following pages.
Management Perspective
Wrong move, wrong time, poor planning. When Fruit of the Loom Inc. saw underwear andapparel sales slowing, it cut back production sharply. Too sharply, in fact: almost overnight,demand soared. Caught with its shorts down, the company hired back thousands of workersand frantically increased production. The mistimed production cuts contributed to a 43percent fall in first‐quarter profits. For the year, Fruit stood to lose $200 million in sales, andanalysts expected an 11 percent drop in profits for the year.
DIRECT MATERIALS BUDGET
The direct materials budget shows both the quantity and cost of direct materials to be purchased.The quantities of direct materials are derived from the following formula.
Managerial AccountingChapter 6
Page 358

Formula for direct materials quantities
The budgeted cost of direct materials to be purchased is then computed by multiplying therequired units of direct materials by the anticipated cost per unit.
The desired ending inventory is again a key component in the budgeting process. For example,inadequate inventories could result in temporary shutdowns of production. Because of its closeproximity to suppliers, Hayes Company has found that an ending inventory of raw materialsequal to 10 percent of the next quarter's production requirements is sufficient. The manufactureof each Kitchen‐mate requires 2 pounds of raw materials, and the expected cost per pound is $4.The direct materials budget is shown in Illustration 7.
Direct materials budget
Managerial AccountingChapter 6
Page 359

Management Perspective
The successful manufacturers of the twenty‐first century will be fully computerized. A crucialstep on the way is material requirements planning (MRP) systems. Early MRP systemsaccepted a sales forecast and computed how much materials, inventory, people, andmachinery a company needed to manufacture the product. Current MRP systems link thecompany's manufacturing resource planning with its financial management. This newcapability creates a powerful system of control over the entire business planning and operatingprocess. With MRP, management can make decisions on facts rather than on “hunches” and“instinct.”
DIRECT LABOR BUDGET
Like the direct materials budget, the direct labor budget contains the quantity (hours) and costof direct labor necessary to meet production requirements. Direct labor hours are determinedfrom the production budget. At Hayes Company, two hours of direct labor are required toproduce each unit of finished goods. The anticipated hourly wage rate is $10. These data areshown in Illustration 8. The direct labor budget is critical in maintaining a labor force that canmeet the expected levels of production.
Direct labor budget
MANUFACTURING OVERHEAD BUDGET
The manufacturing overhead budget shows the expected manufacturing overhead costs for thebudget period. As shown in Illustration 9, this budget distinguishes between variable and fixedoverhead costs.Hayes Company expects variable costs to fluctuate with production volume onthe basis of the following rates per direct labor hour: indirect materials $1.00, indirect labor $1.40,
Managerial AccountingChapter 6
Page 360

utilities $0.40, and maintenance $0.20. Thus, for 6,200 direct labor hours, budgeted indirectmaterials are $6,200 (6,200 × $1), and budgeted indirect labor is $8,680 (6,200 × $1.40). Hayes alsorecognizes that some maintenance is fixed. The amounts reported for fixed costs are assumed.
Manufacturing overhead budget
At Hayes Company, overhead is applied to production on the basis of direct labor hours. Thus,as shown in Illustration 9, the annual rate is $8 per hour ($246,400 ÷ 30,800).
SELLING AND ADMINISTRATIVE EXPENSE BUDGET
Hayes Company combines its operating expenses into one budget, the selling and administrativeexpense budget. This budget projects anticipated selling and administrative expenses for thebudget period. In this budget, as in the preceding one, expenses are classified as either variableor fixed. In this case, the variable expense rates per unit of sales are sales commissions $3.00 andfreightout $1.00. Variable expenses per quarter are based on the unit sales from the sales budget(Illustration 3). For example, sales in the first quarter are expected to be 3,000 units. Thus, SalesCommissions Expense is $9,000 (3,000 × $3), and Freight‐out is $3,000 (3,000 × $1). Fixed expensesare based on assumed data. The selling and administrative expense budget is shown in Illustration10.
Managerial AccountingChapter 6
Page 361

Selling and administrative expense budget
e‐Business Insight
Good budgeting depends on good information. And good information is what e‐businessis all about. As manufacturers, suppliers, and customers become electronically linked, eachbenefits by being better informed. Dell Computer not only is directly linked to Solectron,one of its main suppliers, but also to Texas Instruments, one of the main suppliers of partsto Solectron. This linking takes a lot of guesswork out of planning and budgeting for allthree companies.
To further improve planning and budgeting, Dell hopes that some day everyone in itsindustry will anonymously provide their up‐to‐the‐minute production and sales informationat a central, electronic exchange. A centralized database such as this would provide valuableinformation about the supply and demand of computer goods in the marketplace. Thisinformation might dramatically improve sales projections, leading to significantimprovements in the budgeting process.Source: “E‐Management,” The Economist, November 11, 2000.
Managerial AccountingChapter 6
Page 362

BUDGETED INCOME STATEMENT
The budgeted income statement is the important end‐product of the operating budgets. Thisbudget indicates the expected profitability of operations for the budget period. The budgetedincome statement provides the basis for evaluating company performance.
As you would expect, this budget is prepared from the various operating budgets. For example,to find the cost of goods sold, it is first necessary to determine the total unit cost of producingone Kitchen‐mate, as follows.
Computation of total unit cost
Cost of goods sold can then be determined by multiplying the units sold by the unit cost. ForHayes Company, budgeted cost of goods sold is $660,000 (15,000 × $44). All data for the statementare obtained from the individual operating budgets except the following: (1) interest expense isexpected to be $100, and (2) income taxes are estimated to be $12,000. The budgeted incomestatement is shown in Illustration 12.
Budgeted income statement
Managerial AccountingChapter 6
Page 363

PREPARING THE FINANCIAL BUDGETS
As shown in Illustration 2, the financial budgets consist of the capital expenditure budget, thecash budget, and the budgeted balance sheet. The capital expenditure budget is discussed inChapter 10; the other budgets are explained in the following sections.
CASH BUDGET
The cash budget shows anticipated cash flows. Because cash is so vital, this budget is consideredto be the most important output in preparing financial budgets. The cash budget contains threesections (cash receipts, cash disbursements, and financing) and the beginning and ending cashbalances, as shown in Illustration 13.
Basic form of a cash budget
The cash receipts section includes expected receipts from the company's principal source(s) ofrevenue. These are usually cash sales and collections from customers on credit sales. This sectionalso shows anticipated receipts of interest and dividends, and proceeds from planned sales ofinvestments, plant assets, and the company's capital stock.
The cash disbursements section shows expected cash payments. Such payments include directmaterials, direct labor, manufacturing overhead, and selling and administrative expenses. Thissection also includes projected payments for income taxes, dividends, investments, and plantassets.
Managerial AccountingChapter 6
Page 364

The financing section shows expected borrowings and the repayment of the borrowed fundsplus interest. This section is needed when there is a cash deficiency or when the cash balance isbelow management's minimum required balance.
Data in the cash budget must be prepared in sequence. The ending cash balance of one periodbecomes the beginning cash balance for the next period. Data for preparing the cash budget areobtained from other budgets and from information provided by management. In practice, cashbudgets are often prepared for the year on a monthly basis.
To minimize detail, we will assume that Hayes Company prepares an annual cash budget byquarters. The cash budget for Hayes Company is based on the following assumptions.
1. The January 1, 2002, cash balance is expected to be $38,000.
2. Sales (Illustration 3): 60 percent are collected in the quarter sold and 40 percent arecollected in the following quarter. Accounts receivable of $60,000 at December 31, 2001,are expected to be collected in full in the first quarter of 2002.
3. Short‐term investments are expected to be sold for $2,000 cash in the first quarter.
4. Direct materials (Illustration 7): 50 percent are paid in the quarter purchased and 50percent are paid in the following quarter. Accounts payable of $10,600 at December31, 2001, are expected to be paid in full in the first quarter of 2002.
5. Direct labor (Illustration 8): 100 percent is paid in the quarter incurred.
6. Manufacturing overhead (Illustration 9) and selling and administrative expenses(Illustration 10): All items except depreciation are paid in the quarter incurred.
7. Management plans to purchase a truck in the second quarter for $10,000 cash.
8. Hayes makes equal quarterly payments of its estimated annual income taxes.
9. Loans are repaid in the earliest quarter in which there is sufficient cash (i.e., when thecash on hand exceeds the $15,000 minimum required balance).
In preparing the cash budget, it is useful to prepare schedules for collections from customers(assumption No. 2, above) and cash payments for direct materials (assumption No. 4, above).The schedules are shown in Illustrations 14 and 15.
Managerial AccountingChapter 6
Page 365

Collections from customers
Payments for direct materials
The cash budget for Hayes Company is shown in Illustration 16. The budget indicates that $3,000of financing will be needed in the second quarter to maintain a minimum cash balance of $15,000.Since there is an excess of available cash over disbursements of $22,500 at the end of the thirdquarter, the borrowing, plus $100 interest, is repaid in this quarter.
Managerial AccountingChapter 6
Page 366

Cash budget
Management Perspective
Douglas Roberson, president of Atlantic Network, woke up one morning to find that hiscompany was out of cash. At that point, Roberson realized that managing cash flow isdifferent from simply accumulating sales. He says: “If you don't do serious projections abouthow much cash you will need to handle sales—and how long it will take to collect oninvoices—you can end up out of business no matter how fast you are growing.” In fact,Roberson says, fast growth makes cash flow problems worse because the company can bespending cash on supplies and payroll at an accelerated pace while waiting 45 days or longerto collect receivables.
A cash budget contributes to more effective cash management. It can show managers whenadditional financing will be necessary well before the actual need arises. And, it can indicatewhen excess cash will be available for investments or other purposes.
Managerial AccountingChapter 6
Page 367
BUDGETED BALANCE SHEET
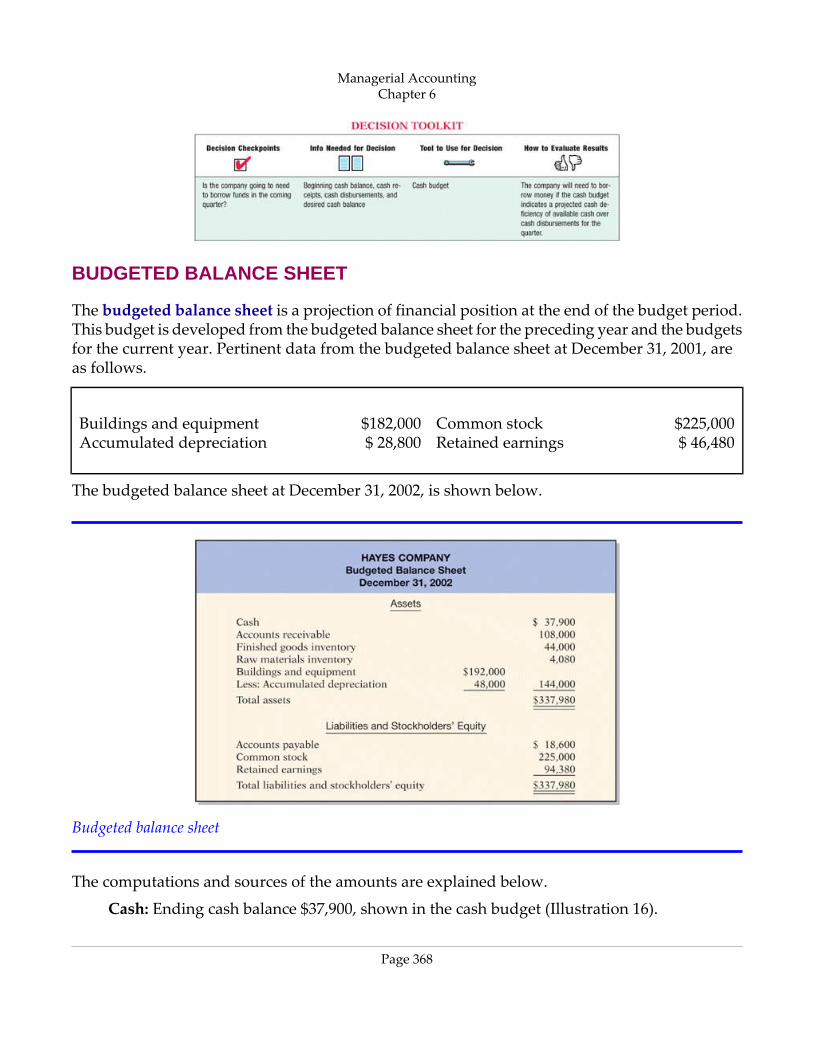
The budgeted balance sheet is a projection of financial position at the end of the budget period.This budget is developed from the budgeted balance sheet for the preceding year and the budgetsfor the current year. Pertinent data from the budgeted balance sheet at December 31, 2001, areas follows.
$225,000Common stock$182,000Buildings and equipment$ 46,480Retained earnings$ 28,800Accumulated depreciation
The budgeted balance sheet at December 31, 2002, is shown below.
Budgeted balance sheet
The computations and sources of the amounts are explained below.
Cash: Ending cash balance $37,900, shown in the cash budget (Illustration 16).
Managerial AccountingChapter 6
Page 368

Accounts receivable: 40 percent of fourth‐quarter sales $270,000, shown in the schedule ofexpected collections from customers (Illustration 14).
Finished goods inventory:Desired ending inventory 1,000 units, shown in the productionbudget (Illustration 5) times the total unit cost $44 (shown in Illustration 11).
Raw materials inventory:Desired ending inventory 1,020 pounds, times the cost per pound$4, shown in the direct materials budget (Illustration 7).
Buildings and equipment:December 31, 2001, balance $182,000, plus purchase of truck for$10,000.
Accumulated depreciation: December 31, 2001, balance $28,800, plus $15,200 depreciationshown in manufacturing overhead budget (Illustration 9) and $4,000 depreciation shownin selling and administrative expense budget (Illustration 10).
Accounts payable: 50 percent of fourth‐quarter purchases $37,200, shown in schedule ofexpected payments for direct materials (Illustration 15).
Common stock: Unchanged from the beginning of the year.
Retained earnings:December 31, 2001, balance $46,480, plus net income $47,900, shown inbudgeted income statement (Illustration 12).
Management Perspective
After the budgeting data are entered into the computer, the various budgets (sales, cash,etc.) can be prepared, as well as the budgeted financial statements. Management can alsomanipulate the budgets in “what if” (sensitivity) analyses based on different hypotheticalassumptions. For example, suppose that sales were budgeted to be 10 percent higher in thecoming quarter. What impact would the change have on the rest of the budgeting processand the financing needs of the business? The computer can quickly “play out” the impactof the various assumptions on the budgets. Armed with these analyses, management canmake more informed decisions about the impact of various projects. They also can anticipatefuture problems and business opportunities. Budgeting is one of the top uses of electronicspreadsheets. Template versions of every one of the Hayes Company budgets shown in thischapter could easily be prepared.
Managerial AccountingChapter 6
Page 369

Before You Go On...
Review It
1. What are the two classifications of the individual budgets in the master budget?
2. What is the sequence for preparing the budgets that comprise the operating budgets?
3. Identify some of the source documents that would be used in preparing each of theoperating budgets.
4. What are the three principal sections of the cash budget?
Do It
1. In Martian Company, management wants to maintain a minimum monthly cashbalance of $15,000. At the beginning of March, the cash balance is $16,500, expectedcash receipts for March are $210,000, and cash disbursements are expected to be$220,000. How much cash, if any, must be borrowed to maintain the desired minimummonthly balance?
Action Plan
• Write down the basic form of the cash budget, starting with the beginning cashbalance, adding cash receipts for the period, deducting cash disbursements,and identifying the needed financing to achieve the desired minimum endingcash balance.
• Insert the data given into the outlined form of the cash budget.
Related exercise material: BE6‐9 and E6‐9.
BUDGETING IN NONMANUFACTURING COMPANIES
Budgeting is not limited to manufacturers. Budgets may also be used by merchandisers, serviceenterprises, and not‐for‐profit organizations.
MERCHANDISERS
As in manufacturing operations, the sales budget for a merchandiser is both the starting pointand the key factor in the development of the master budget. The major differences between themaster budgets of a merchandiser and a manufacturer are these: (1) A merchandiser uses amerchandise purchases budget instead of a production budget. (2) A merchandiser does not
Managerial AccountingChapter 6
Page 370

use the manufacturing budgets (direct materials, direct labor, and manufacturing overhead).The merchandise purchases budget shows the estimated cost of goods to be purchased to meetexpected sales. The formula for determining budgeted merchandise purchases is:
Merchandise purchases formula
To illustrate, assume that the budget committee of Lima Company is preparing the merchandisepurchases budget for July. It estimates that budgeted sales will be $300,000 in July and $320,000in August. Cost of goods sold is expected to be 70 percent of sales. The company's desired endinginventory is 30 percent of the following month's cost of goods sold. Required merchandisepurchases for July are $214,200, computed as follows.
Computation of required merchandise purchases
Managerial AccountingChapter 6
Page 371
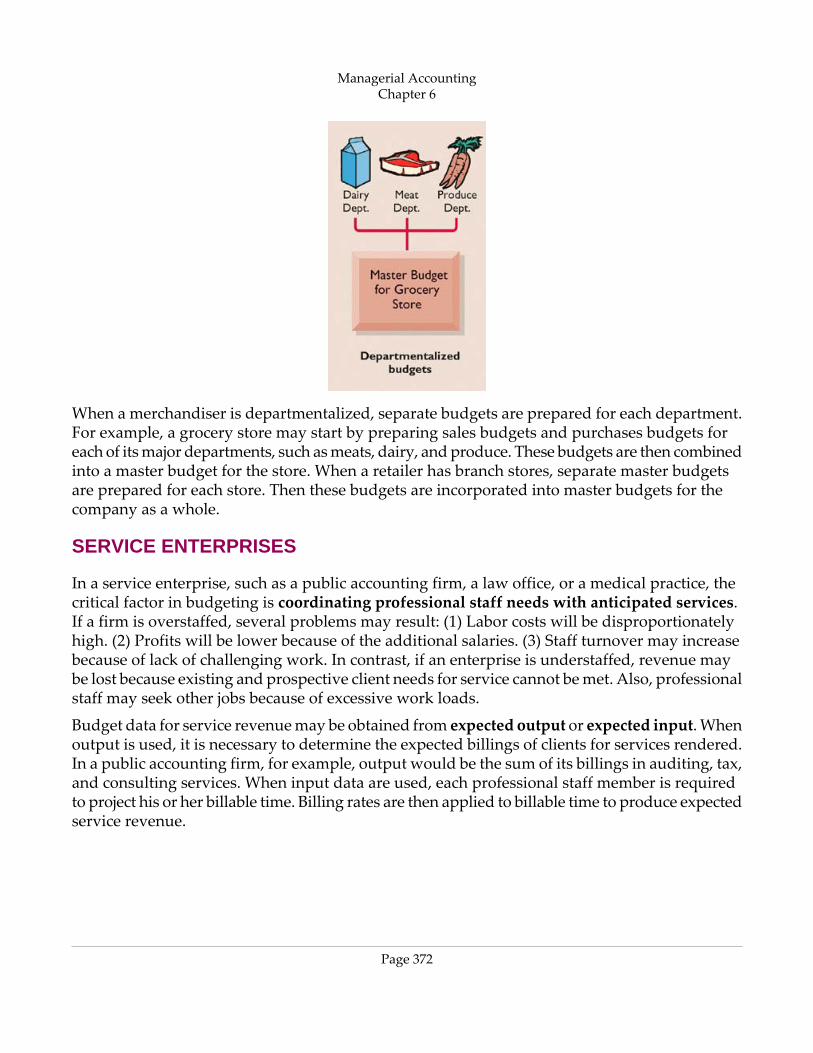
When a merchandiser is departmentalized, separate budgets are prepared for each department.For example, a grocery store may start by preparing sales budgets and purchases budgets foreach of its major departments, such as meats, dairy, and produce. These budgets are then combinedinto a master budget for the store. When a retailer has branch stores, separate master budgetsare prepared for each store. Then these budgets are incorporated into master budgets for thecompany as a whole.
SERVICE ENTERPRISES
In a service enterprise, such as a public accounting firm, a law office, or a medical practice, thecritical factor in budgeting is coordinating professional staff needs with anticipated services.If a firm is overstaffed, several problems may result: (1) Labor costs will be disproportionatelyhigh. (2) Profits will be lower because of the additional salaries. (3) Staff turnover may increasebecause of lack of challenging work. In contrast, if an enterprise is understaffed, revenue maybe lost because existing and prospective client needs for service cannot be met. Also, professionalstaff may seek other jobs because of excessive work loads.
Budget data for service revenue may be obtained from expected output or expected input. Whenoutput is used, it is necessary to determine the expected billings of clients for services rendered.In a public accounting firm, for example, output would be the sum of its billings in auditing, tax,and consulting services. When input data are used, each professional staff member is requiredto project his or her billable time. Billing rates are then applied to billable time to produce expectedservice revenue.
Managerial AccountingChapter 6
Page 372

Service Company Perspective
Lucy Carter, managing partner of a small CPA firm in Nashville, uses formal budgets as theprincipal tool for keeping cash flow on an even keel throughout the year. The firm budgetsannually for both revenues and expenses on a month‐by‐month basis. For example, therevenue budget is derived from chargeable‐hour goals set by the staff. The firm sets athreshold of 1,800 hours for each staff member and 1,700 hours for each manager. Eachmonth the budget is compared with the financial statements, and adjustments are made ifnecessary.
NOT-FOR-PROFIT ORGANIZATIONS
Budgeting is just as important for not‐for‐profit organizations as for profit‐oriented enterprises.The budget process, however, is significantly different. In most cases not‐for‐profit entities budgeton the basis of cash flows (expenditures and receipts), rather than on a revenue and expensebasis. Further, the starting point in the process is usually expenditures, not receipts. For thenot‐for‐profit entity, management's task generally is to find the receipts needed to support theplanned expenditures. The activity index is also likely to be significantly different. For example,in a not‐for‐profit entity, such as a university, budgeted faculty positions may be based on full‐timeequivalent students or credit hours expected to be taught in a department.
For some governmental units, the budget must be approved by voters. In other cases, such asstate governments and the federal government, legislative approval is required. After the budgetis adopted, it must be strictly followed. Overspending is often illegal. In governmental budgets,authorizations tend to be on a line‐by‐line basis. That is, the budget for a municipality may havea specified authorization for police and fire protection, garbage collection, street paving, and soon. The line‐item authorization of governmental budgets significantly limits the amount ofdiscretion management can exercise. The city manager often cannot use savings from one lineitem, such as street paving, to cover increased spending in another line item, such as snowremoval.
Before You Go On...
Review It
1. What is the formula for computing required merchandise purchases?
2. How does budgeting in service and not‐for‐profit organizations differ from budgetingfor manufacturers and merchandisers?
Managerial AccountingChapter 6
Page 373

USING THE DECISION TOOLKIT
The University of Wisconsin and its subunits must prepare budgets. One unique subunit ofthe University of Wisconsin is Babcock Ice Cream, a functioning producer of dairy products(and famous, at least on campus, for its delicious ice cream).
Assume that Babcock Ice Cream prepares monthly cash budgets. Relevant data from assumedoperating budgets for 2002 are:
FebruaryJanuary$412,000$460,000Sales210,000185,000Direct materials purchases85,00070,000Direct labor65,00050,000Manufacturing overhead95,00085,000Selling and administrative
expenses
Babcock sells 50% of its ice cream in its shops on campus, as well as selling to local stores.Collections from local stores are expected to be 50% in the month of sale, and 50% in themonth following sale. Sixty percent (60%) of direct materials purchases are paid in cash inthe month of purchase, and the balance due is paid in the month following the purchase.All other items above are paid in the month incurred. (Depreciation has been excluded frommanufacturing overhead and selling and administrative expenses.)
Other data:
1. Sales: November 2001, $370,000; December 2001, $320,000
2. Purchases of direct materials: December 2001, $175,000
3. Other receipts:
January—Donation received, $2,000
February—Sale of used equipment, $4,000
4. Other disbursements: February—Purchased equipment, $10,000
5. Repaid debt: January, $30,000
The company's cash balance on January 1, 2002, is expected to be $50,000. The companywants to maintain a minimum cash balance of $45,000.
Instructions
Managerial AccountingChapter 6
Page 374

1. a. Prepare schedules for (1) expected collections from customers and (2) expectedpayments for direct materials purchases.
b. Prepare a cash budget for January and February in columnar form.
Summary of Study Objectives
1. Indicate the benefits of budgeting. The primary advantages of budgeting are that it(a) requires management to plan ahead, (b) provides definite objectives for evaluatingperformance, (c) creates an early warning system for potential problems, (d) facilitatescoordination of activities, (e) results in greater management awareness, and (f)motivates personnel to meet planned objectives.
2. State the essentials of effective budgeting. The essentials of effective budgeting are(a) sound organizational structure, (b) research and analysis, and (c) acceptance byall levels of management.
3. Identify the budgets that comprise the master budget. The master budget consistsof the following budgets: (a) sales, (b) production, (c) direct materials, (d) directlabor, (e) manufacturing overhead, (f) selling and administrative expense, (g)budgeted income statement, (h) capital expenditure budget, (i) cash budget, and (j)budgeted balance sheet.
4. Describe the sources for preparing the budgeted income statement. The budgetedincome statement is prepared from (a) the sales budget, (b) the budgets for directmaterials, direct labor, and manufacturing overhead, and (c) the selling andadministrative expense budget.
5. Explain the principal sections of a cash budget. The cash budget has three sections(receipts, disbursements, and financing) and the beginning and ending cash balances.
6. Indicate the applicability of budgeting in nonmanufacturing companies. Budgetingmay be used by merchandisers for development of a master budget. In serviceenterprises budgeting is a critical factor in coordinating staff needs with anticipatedservices. In not‐for‐profit organizations, the starting point in budgeting is usuallyexpenditures, not receipts.
Managerial AccountingChapter 6
Page 375

Managerial AccountingChapter 6
Page 376

Demonstration Problem
1. Soroco Company is preparing its master budget for 2002. Relevant data pertainingto its sales and production budgets are as follows:
Sales: Sales for the year are expected to total 1,200,000 units. Quarterly sales are 20%,25%, 30%, and 25% respectively. The sales price is expected to be $50 per unit forthe first three quarters and $55 per unit beginning in the fourth quarter. Sales in thefirst quarter of 2003 are expected to be 10% higher than the budgeted sales volumefor the first quarter of 2002.
Production: Management desires to maintain ending finished goods inventories at25% of the next quarter's budgeted sales volume.
Instructions
Prepare the sales budget and production budget by quarters for 2002.
Solution to Demonstration Problem
SOROCO COMPANYSales Budget
For the Year Ending December 31, 2002Quarter
Year43211,200,000300,000360,000300,000240,000Expected unit
sales—× $55× $50× $50× $50Unit selling
price$61,500,000$16,500,000$18,000,000$15,000,000$12,000,000
SOROCO COMPANYProduction Budget
For the Year Ending December 31, 2002Quarter
Year4321300,000360,000300,000240,000Expected unit
sales66,000175,00090,00075,000Add: Desired
endingfinishedgoods units
366,000435,000390,000315,000Total requiredunits
Managerial AccountingChapter 6
Page 377

SOROCO COMPANYProduction Budget
For the Year Ending December 31, 200275,00090,00075,00060,0002Less:
Beginningfinishedgoods units
1,206,000291,000345,000315,000255,000Units to beproduced
1 Estimated first‐quarter 2003 sales volume 240,000 + (240,000 × 10%) = 264,000; 264,000 × 25%.
2 25% of estimated first‐quarter 2002 sales units.
1This formula ignores any work in process inventories, which are assumed to be nonexistentin Hayes Company.
SELF-STUDY QUESTIONSAnswers are at the end of the chapter.
1. The benefits of budgeting include all but one of the following:
a. Management can plan ahead.
b. An early warning system is provided for potential problems.
c. It enables disciplinary action to be taken at every level of responsibility.
d. The coordination of activities is facilitated.
Hint:
( Study Objective 1)
2. The essentials of effective budgeting do not include:
a. top‐down budgeting.
b. management acceptance.
c. research and analysis.
d. sound organizational structure.
Hint:
( Study Objective 2)
Managerial AccountingChapter 6
Page 378

3. Compared to budgeting, long‐range planning generally has the:
a. same amount of detail.
b. longer time period.
c. same emphasis.
d. same time period.
Hint:
( Study Objective 2)
4. A sales budget is:
a. derived from the production budget.
b. management's best estimate of sales revenue for the year.
c. not the starting point for the master budget.
d. prepared only for credit sales.
Hint:
( Study Objective 3)
5. The formula for the production budget is budgeted sales in units plus:
a. desired ending merchandise inventory less beginning merchandise inventory.
b. beginning finished goods units less desired ending finished goods units.
c. desired ending direct materials units less beginning direct materials units.
d. desired ending finished goods units less beginning finished goods units.
Hint:
( Study Objective 3)
6. Direct materials inventories are kept in pounds in Byrd Company, and the total poundsof direct materials needed for production is 9,500. If the beginning inventory is 1,000pounds and the desired ending inventory is 2,200 pounds, the total pounds to bepurchased is:
a. 9,400.
b. 9,500.
c. 9,700.
d. 10,700.
Hint:
( Study Objective 3)
Managerial AccountingChapter 6
Page 379

7. The formula for computing the direct labor cost budget is to multiply the direct laborcost per hour by the:
a. total required direct labor hours.
b. physical units to be produced.
c. equivalent units to be produced.
d. No correct answer is given.
Hint:
( Study Objective 3)
8. Each of the following budgets is used in preparing the budgeted income statementexcept the:
a. sales budget.
b. selling and administrative budget.
c. capital expenditure budget.
d. direct labor budget.
Hint:
( Study Objective 4)
9. Expected direct materials purchases in Read Company are $70,000 in the first quarterand $90,000 in the second quarter. Forty percent of the purchases are paid in cash asincurred, and the balance is paid in the following quarter. The budgeted cash paymentsfor purchases in the second quarter are:
a. $96,000.
b. $90,000.
c. $78,000.
d. $72,000.
Hint:
( Study Objective 5)
10. The budget for a merchandiser differs from a budget for a manufacturer because:
a. a merchandise purchases budget replaces the production budget.
b. the manufacturing budgets are not applicable.
c. None of the above.
d. Both (a) and (b) above.
Hint:
Managerial AccountingChapter 6
Page 380

( Study Objective 6)
QUESTIONS1. a. What is a budget?
b. How does a budget contribute to good management?
2. Valerie Flynn and Ken Leask are discussing the benefits of budgeting. They ask youto identify the primary advantages of budgeting. Comply with their request.
3. Lorraine Scott asks your help in understanding the essentials of effective budgeting.Identify the essentials for Lorraine.
4. a. “Accounting plays a relatively unimportant role in budgeting.” Do you agree?Explain.
b. What responsibilities does management have in budgeting?
5. What criteria are helpful in determining the length of the budget period? What is themost common budget period?
6. Mary Miller maintains that the only difference between budgeting and long‐rangeplanning is time. Do you agree? Why or why not?
7. Distinguish between a master budget and a sales budget.
8. What budget is the starting point in preparing the master budget? What may result ifthis budget is inaccurate?
9. “The production budget shows both unit production data and unit cost data.” Is thistrue? Explain.
10. Wheaton Company has 8,000 beginning finished goods units. Budgeted sales units are160,000. If management desires 20,000 ending finished goods units, what are therequired units of production?
11. In preparing the direct materials budget for Dukane Company, management concludesthat required purchases are 54,000 units. If 50,000 direct materials units are requiredin production and there are 7,000 units of beginning direct materials, what is the desiredunits of ending direct materials?
12. The production budget of Hinsdale Company calls for 90,000 units to be produced. Ifit takes 30 minutes to make one unit and the direct labor rate is $14 per hour, what isthe total budgeted direct labor cost?
13. Villanova Company's manufacturing overhead budget shows total variable costs of$168,000 and total fixed costs of $147,000. Total production in units is expected to be160,000. It takes 15 minutes to make one unit, and the direct labor rate is $15 per hour.
Managerial AccountingChapter 6
Page 381

Express the manufacturing overhead rate as (a) a percentage of direct labor cost, and(b) an amount per direct labor hour.
14. Westphal Company's variable selling and administrative expenses are 15% of net sales.Fixed expenses are $60,000 per quarter. The sales budget shows expected sales of$200,000 and $250,000 in the first and second quarters, respectively. What are the totalbudgeted selling and administrative expenses for each quarter?
15. For Advent Company, the budgeted cost for one unit of product is direct materials$10, direct labor $20, and manufacturing overhead 80% of direct labor cost. If 25,000units are expected to be sold at $77 each, what is the budgeted gross profit?
16. Indicate the supporting schedules used in preparing a budgeted income statementthrough gross profit for a manufacturer.
17. Identify the three sections of a cash budget. What balances are also shown in thisbudget?
18. Andrew Manion Company has credit sales of $500,000 in January. Past experiencesuggests that 45% is collected in the month of sale, 50% in the month following thesale, and 4% in the second month following the sale. Compute the cash collectionsfrom January sales in January, February, and March.
19. What is the formula for determining required merchandise purchases for amerchandiser?
20. How may expected revenues in a service enterprise be computed?
BRIEF EXERCISESBE6‐1 Sharon Livingston Manufacturing Company uses the following budgets: Balance
Sheet, Capital Expenditure, Cash, Direct Labor, Direct Materials, Income Statement,Manufacturing Overhead, Production, Sales, and Selling and Administrative.Prepare a diagram of the interrelationships of the budgets in the master budget.Indicate whether each budget is an operating or a financial budget.Hint:
Prepare a diagram of a master budget.
( Study Objective 3)
BE6‐2 Emil Company estimates that unit sales will be 10,000 in quarter 1; 12,000 in quarter2; 14,000 in quarter 3; and 15,000 in quarter 4. Using a sales price of $70 per unit,prepare the sales budget by quarters and for the year ending December 31, 2002.Hint:
Prepare a sales budget.
( Study Objective 3)
Managerial AccountingChapter 6
Page 382

BE6‐3 Sales budget data for Emil Company are given in BE6‐2. Management desires tohave an ending finished goods inventory equal to 30% of the next quarter's expectedunit sales. Prepare a production budget by quarters for the first 6 months of 2002.Hint:
Prepare a production budget for 2 quarters.
( Study Objective 3)
BE6‐4 Korenewych Company has 1,200 pounds of raw materials in its December 31, 2002,ending inventory. Required production for January and February are 4,000 and5,000 units, respectively. Two pounds of raw materials are needed for each unit,and the estimated cost per pound is $6. Management desires an ending inventoryequal to 15% of next month's materials requirements. Prepare the direct materialsbudget for January.Hint:
Prepare a direct materials budget for 1 month.
( Study Objective 3)
BE6‐5 For Shawn Green Company, units to be produced are 5,000 in quarter 1 and 6,000in quarter 2. It takes 1.8 hours to make a finished unit, and the expected hourlywage rate is $12 per hour. Prepare a direct labor budget by quarters and for the 6months ending June 30, 2002.Hint:
Prepare a direct labor budget for 2 quarters.
( Study Objective 3)
BE6‐6 For John Dunham Inc. variable manufacturing overhead costs are expected to be$20,000 in the first quarter of 2002, with $3,000 increments in each of the remainingthree quarters. Fixed overhead costs are estimated to be $35,000 in each quarter.Prepare the manufacturing overhead budget by quarters and for the year.Hint:
Prepare a manufacturing overhead budget.
( Study Objective 3)
BE6‐7 Chudzick Company classifies its selling and administrative expense budget intovariable and fixed components. Variable expenses are expected to be $25,000 in thefirst quarter, and $5,000 increments are expected in the remaining quarters of 2002.Fixed expenses are expected to be $40,000 in each quarter. Prepare the selling andadministrative expense budget by quarters and for 2002.Hint:
Prepare a selling and administrative expense budget.
( Study Objective 3)
Managerial AccountingChapter 6
Page 383

BE6‐8 Bitterman Company has completed all of its operating budgets. The sales budgetfor the year shows 50,000 units and total sales of $2,000,000. The total unit cost ofmaking one unit of sales is $28. Selling and administrative expenses are expectedto be $300,000. Income taxes are estimated to be $50,000. Prepare a budgeted incomestatement for the year ending December 31, 2002.Hint:
Prepare a budgeted income statement for the year.
( Study Objective 4)
BE6‐9 Jorie Aloisio Industries expects credit sales for January, February, and March to be$200,000, $275,000, and $310,000, respectively. It is expected that 70% of the saleswill be collected in the month of sale, and 30% will be collected in the followingmonth. Compute cash collections from customers for each month.Hint:
Prepare data for a cash budget.
( Study Objective 5)
BE6‐10 Maggie Sharrer Wholesalers is preparing its merchandise purchases budget.Budgeted sales are $400,000 for April and $450,000 for May. Cost of goods sold isexpected to be 75% of sales. The company's desired ending inventory is 20% of thefollowing month's cost of goods sold. Compute the required purchases for April.Hint:
Determine required merchandise purchases for 1 month.
( Study Objective 6)
EXERCISESE6‐1 L. Quick Electronics Inc. produces and sells two models of pocket calculators,
XQ‐103 and XQ‐104. The calculators sell for $12 and $20, respectively. Because ofthe intense competition Quick faces, management budgets sales semiannually. Itsprojections for the first 2 quarters of 2002 are as follows.
Unit SalesQuarter 2Quarter 1Product27,00030,000XQ‐10313,00012,000XQ‐104
No changes in selling prices are anticipated.
Instructions
Managerial AccountingChapter 6
Page 384
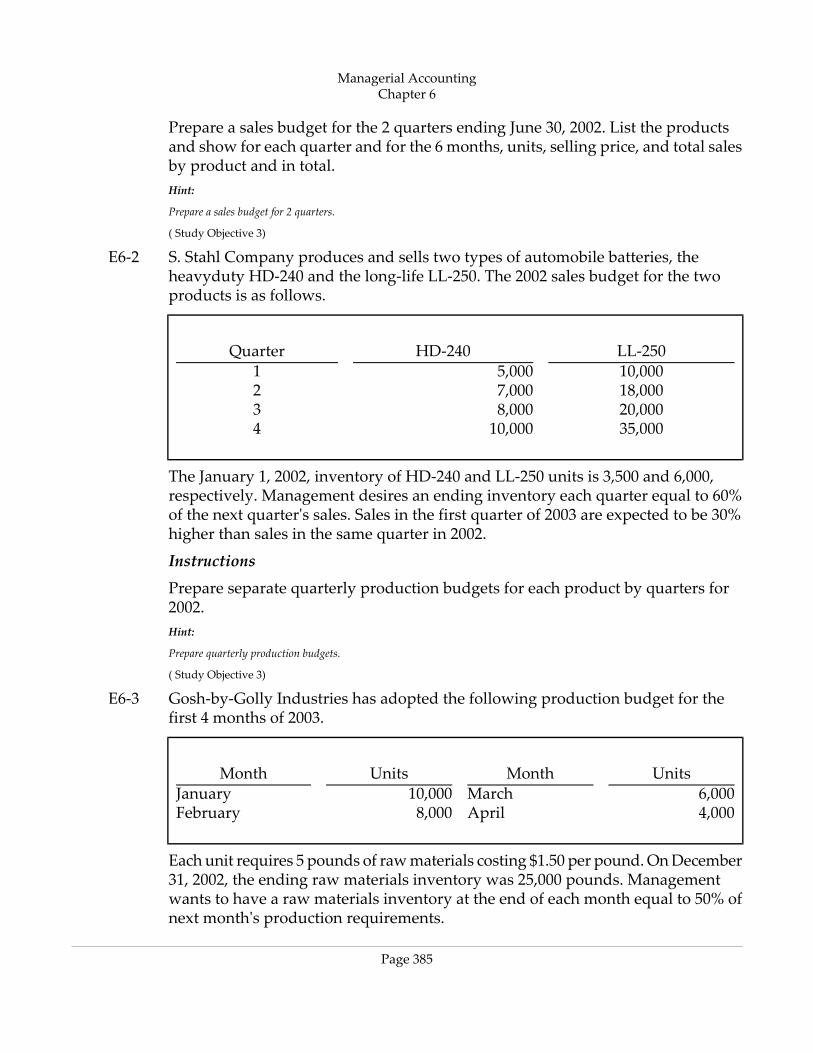
Prepare a sales budget for the 2 quarters ending June 30, 2002. List the productsand show for each quarter and for the 6 months, units, selling price, and total salesby product and in total.Hint:
Prepare a sales budget for 2 quarters.
( Study Objective 3)
E6‐2 S. Stahl Company produces and sells two types of automobile batteries, theheavyduty HD‐240 and the long‐life LL‐250. The 2002 sales budget for the twoproducts is as follows.
LL‐250HD‐240Quarter10,0005,000118,0007,000220,0008,000335,00010,0004
The January 1, 2002, inventory of HD‐240 and LL‐250 units is 3,500 and 6,000,respectively. Management desires an ending inventory each quarter equal to 60%of the next quarter's sales. Sales in the first quarter of 2003 are expected to be 30%higher than sales in the same quarter in 2002.
Instructions
Prepare separate quarterly production budgets for each product by quarters for2002.Hint:
Prepare quarterly production budgets.
( Study Objective 3)
E6‐3 Gosh‐by‐Golly Industries has adopted the following production budget for thefirst 4 months of 2003.
UnitsMonthUnitsMonth6,000March10,000January4,000April8,000February
Each unit requires 5 pounds of raw materials costing $1.50 per pound. On December31, 2002, the ending raw materials inventory was 25,000 pounds. Managementwants to have a raw materials inventory at the end of each month equal to 50% ofnext month's production requirements.
Managerial AccountingChapter 6
Page 385
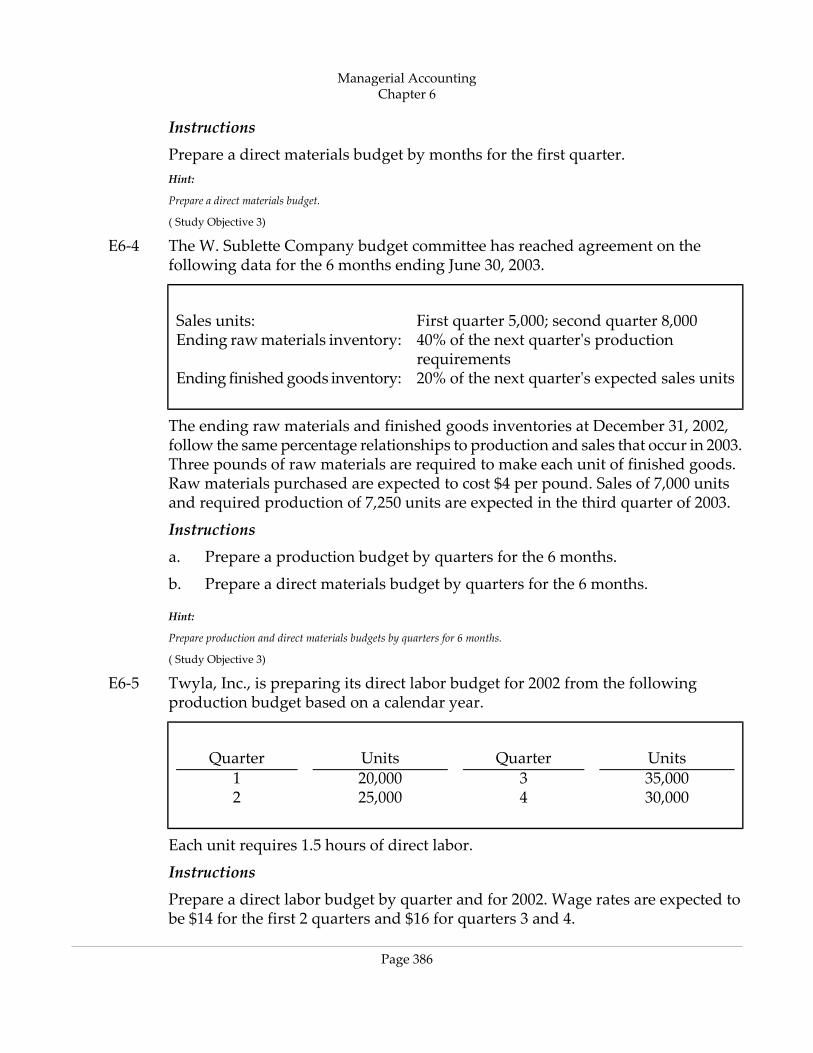
Instructions
Prepare a direct materials budget by months for the first quarter.Hint:
Prepare a direct materials budget.
( Study Objective 3)
E6‐4 The W. Sublette Company budget committee has reached agreement on thefollowing data for the 6 months ending June 30, 2003.
First quarter 5,000; second quarter 8,000Sales units:40% of the next quarter's productionrequirements
Ending raw materials inventory:
20% of the next quarter's expected sales unitsEnding finished goods inventory:
The ending raw materials and finished goods inventories at December 31, 2002,follow the same percentage relationships to production and sales that occur in 2003.Three pounds of raw materials are required to make each unit of finished goods.Raw materials purchased are expected to cost $4 per pound. Sales of 7,000 unitsand required production of 7,250 units are expected in the third quarter of 2003.
Instructions
a. Prepare a production budget by quarters for the 6 months.
b. Prepare a direct materials budget by quarters for the 6 months.
Hint:
Prepare production and direct materials budgets by quarters for 6 months.
( Study Objective 3)
E6‐5 Twyla, Inc., is preparing its direct labor budget for 2002 from the followingproduction budget based on a calendar year.
UnitsQuarterUnitsQuarter35,000320,000130,000425,0002
Each unit requires 1.5 hours of direct labor.
Instructions
Prepare a direct labor budget by quarter and for 2002. Wage rates are expected tobe $14 for the first 2 quarters and $16 for quarters 3 and 4.
Managerial AccountingChapter 6
Page 386

Hint:
Prepare a direct labor budget.
( Study Objective 3)
E6‐6 Vincent Nathan Company is preparing its manufacturing overhead budget for2002. Relevant data consist of the following.
Units to be produced (by quarters): 10,000, 12,000, 14,000, 16,000.
Direct labor: Time is 1.5 hours per unit.
Variable overhead costs per direct labor hour: Indirect materials $0.70; indirectlabor $1.20; and maintenance $0.30.
Fixed overhead costs per quarter: Supervisory salaries $35,000; depreciation $12,000;and maintenance $9,000.
Instructions
Prepare the manufacturing overhead budget by quarter and for the year in total.Hint:
Prepare a manufacturing overhead budget for the year.
( Study Objective 3)
E6‐7 Marcum Company combines its operating expenses for budget purposes in a sellingand administrative expense budget. For the first 6 months of 2002, the followingdata are available.
1. Sales: 15,000 units quarter 1; 18,000 units quarter 2.
2. Variable costs per dollar of sales: Sales commissions 5%, delivery expense 2%,and advertising 3%.
3. Fixed costs per quarter: Sales salaries $10,000, office salaries $6,000,depreciation $4,200, insurance $1,500, utilities $800, and repairs expense $600.
4. Unit selling price: $20.
Instructions
Prepare a selling and administrative expense budget by quarters and for the first6 months of 2002.Hint:
Prepare a selling and administrative expense budget for 2 quarters.
( Study Objective 3)
E6‐8 Longhead Company has accumulated the following budget data for the year 2002.
1. Sales: 30,000 units, unit selling price $80.
Managerial AccountingChapter 6
Page 387

2. Cost of one unit of finished goods: Direct materials 3 pounds at $5 per pound,direct labor 3 hours at $12 per hour, and manufacturing overhead $6 per directlabor hour.
3. Inventories (raw materials only): Beginning, 10,000 pounds; ending, 15,000pounds.
4. Raw materials cost: $5 per pound.
5. Selling and administrative expenses: $150,000.
6. Income taxes: 30% of income before income taxes.
Instructions
Prepare a budgeted income statement for 2002. Show the computation of cost ofgoods sold.Hint:
Prepare a budgeted income statement for the year.
( Study Objective 3 Study Objective 4)
E6‐9 Campagna Company expects to have a cash balance of $46,000 on January 1, 2002.Relevant monthly budget data for the first 2 months of 2002 are as follows.
Collections from customers: January $80,000, February $150,000.
Payments to suppliers: January $40,000, February $75,000.
Direct labor: January $30,000, February $45,000. Wages are paid in the month theyare incurred.
Manufacturing overhead: January $21,000, February $30,000. These costs includedepreciation of $1,000 per month. All other overhead costs are paid as incurred.
Selling and administrative expenses: January $15,000, February $20,000. These costsare exclusive of depreciation. They are paid as incurred.
Sales of marketable securities in January are expected to realize $10,000 in cash.Campagna Company has a line of credit at a local bank that enables it to borrowup to $25,000. The company wants to maintain a minimum monthly cash balanceof $20,000.
Instructions
Prepare a cash budget for January and February.Hint:
Prepare a cash budget for 2 months.
( Study Objective 5)
Managerial AccountingChapter 6
Page 388

E6‐10 In May 2002, the budget committee of Sherrick Stores assembles the following datain preparation of budgeted merchandise purchases for the month of June.
1. Expected sales: June $500,000, July $600,000.
2. Cost of goods sold is expected to be 65% of sales.
3. Desired ending merchandise inventory is 40% of the following (next) month'scost of goods sold.
4. The beginning inventory at June 1 will be the desired amount.
Instructions
a. Compute the budgeted merchandise purchases for June.
b. Prepare the budgeted income statement for June through gross profit on sales.
Hint:
Prepare a purchases budget and budgeted income statement for a merchandiser.
( Study Objective 6)
PROBLEMS: SET AP6‐1A Oakbrook Farm Supply Company manufactures and sells a pesticide called Snare.
The following data are available for preparing budgets for Snare for the first 2quarters of 2003.
1. Sales: Quarter 1, 35,000 bags; quarter 2, 50,000 bags. Selling price is $60 perbag.
2. Direct materials: Each bag of Snare requires 5 pounds of Gumm at a cost of$3 per pound and 8 pounds of Tarr at $1.50 per pound.
3. Desired inventory levels:
July 1April 1January 1Type of Inventory18,00012,0008,000Snare (bags)13,00010,0009,000Gumm (pounds)25,00020,00014,000Tarr (pounds)
4. Direct labor: Direct labor time is 15 minutes per bag at an hourly rate of $12per hour.
5. Selling and administrative expenses are expected to be 8% of sales plus$175,000 per quarter.
Managerial AccountingChapter 6
Page 389

6. Income taxes are expected to be 30% of income from operations.
Your assistant has prepared two budgets: (1) The manufacturing overhead budgetshows expected costs to be 150% of direct labor cost. (2) The direct materials budgetfor Tarr shows the cost of Tarr to be $477,000 in quarter 1 and $679,500 in quarter2.
Instructions
Prepare the budgeted income statement for the first 6 months and all requiredsupporting budgets by quarters and in total. (Note: Use variable and fixed in theselling and administrative expense budget.)Hint:
Prepare budgeted income statement and supporting budgets.
( Study Objective 3 Study Objective 4)
P6‐2A Joe Dunham Inc. is preparing its annual budgets for the year ending December 31,2003. Accounting assistants furnish the following data.
Product JB 60Product JB 50Sales budget:
180,000480,000Anticipated volume in units$25.00$20.00Unit selling price
Production budget:15,00025,000Desired ending finished goods units10,00030,000Beginning finished goods units
Direct materials budget:32Direct materials per unit (pounds)
15,00030,000Desired ending direct materials pounds10,00040,000Beginning direct materials pounds$4.00$3.00Cost per pound
Direct labor budget:0.60.4Direct labor hours per unit
$11.00$11.00Direct labor rate per hourBudgeted income statement:
$20.00$12.00Total unit cost
An accounting assistant has prepared the detailed manufacturing overhead budgetand the selling and administrative expense budget. The latter shows selling expensesof $660,000 for product JB 50 and $360,000 for product JB 60, and administrativeexpenses of $420,000 for product JB 50 and $340,000 for product JB 60. Income taxesare expected to be 30%.
Managerial AccountingChapter 6
Page 390

Instructions
Prepare the following budgets for the year. Show data for each product. Quarterlybudgets should not be prepared.
a. Sales
b. Production
c. Direct materials
d. Direct labor
e. Income statement (Note: Income taxes are not allocated to the products.)
Hint:
Prepare sales, production, direct materials, direct labor, and income statement budgets.
( Study Objective 3 Study Objective 4)
P6‐3A Hindu Industries had sales in 2002 of $6,300,000 and gross profit of $1,500,000.Management is considering two alternative budget plans to increase its gross profitin 2003.
Plan A would increase the selling price per unit from $9.00 to $9.40. Sales volumewould decrease by 5% from its 2002 level. Plan B would decrease the selling priceper unit by $0.50. The marketing department expects that the sales volume wouldincrease by 150,000 units.
At the end of 2002, Hindu has 30,000 units of inventory on hand. If Plan A isaccepted, the 2003 ending inventory should be equal to 4% of the 2003 sales. If PlanB is accepted, the ending inventory should be equal to 40,000 units. Each unitproduced will cost $1.60 in direct labor, $2.00 in direct materials, and $0.90 invariable overhead. The fixed overhead for 2003 should be $1,800,000.
Instructions
a. Prepare a sales budget for 2003 under each plan.
b. Prepare a production budget for 2003 under each plan.
c. Compute the production cost per unit under each plan. Why is the cost perunit different for each of the two plans? (Round to two decimals.)
d. Which plan should be accepted? (Hint: Compute the gross profit under eachplan.)
Hint:
Prepare sales and production budgets and compute cost per unit under two plans.
( Study Objective 3 Study Objective 4)
Managerial AccountingChapter 6
Page 391

P6‐4A Yaeger Company prepares monthly cash budgets. Relevant data from operatingbudgets for 2003 are:
FebruaryJanuary$400,000$360,000Sales130,000125,000Direct materials purchases100,00090,000Direct labor75,00070,000Manufacturing overhead86,00079,000Selling and administrative
expenses
All sales are on account. Collections are expected to be 50% in the month of sale,30% in the first month following the sale, and 20% in the second month followingthe sale. Sixty percent (60%) of direct materials purchases are paid in cash in themonth of purchase, and the balance due is paid in the month following the purchase.All other items above are paid in the month incurred except for selling andadministrative expenses that include $1,000 of depreciation per month.
Other data:
1. Credit sales: November 2002, $260,000; December 2002, $300,000.
2. Purchases of direct materials: December 2002, $100,000.
3. Other receipts:
January—Collection of December 31, 2002, notes receivable $15,000;
February—Proceeds from sale of securities $6,000.
4. Other disbursements: February—Withdrawal of $5,000 cash for personal useof owner, Dewey Yaeger.
The company's cash balance on January 1, 2003, is expected to be $70,000. Thecompany wants to maintain a minimum cash balance of $50,000.
Instructions
a. Prepare schedules for (1) expected collections from customers and (2) expectedpayments for direct materials purchases.
b. Prepare a cash budget for January and February in columnar form.
Hint:
Prepare cash budget for 2 months.
( Study Objective 5)
Managerial AccountingChapter 6
Page 392

P6‐5A The budget committee of Henning Company collects the following data for its SanMiguel Store in preparing budgeted income statements for May and June 2003.
1. Sales for May are expected to be $600,000. Sales in June and July are expectedto be 10% higher than the preceding month.
2. Cost of goods sold is expected to be 70% of sales.
3. Company policy is to maintain ending merchandise inventory at 25% of thefollowing month's cost of goods sold.
4. Operating expenses are estimated to be:
$25,000 per monthSales salaries5% of monthly salesAdvertising3% of monthly salesDelivery expense4% of monthly salesSales commissions$5,000 per monthRent expense$800 per monthDepreciation$600 per monthUtilities$500 per monthInsurance
5. Income taxes are estimated to be 30% of income from operations.
Instructions
a. Prepare the merchandise purchases budget for each month in columnar form.
b. Prepare budgeted income statements for each month in columnar form. Showin the statements the details of cost of goods sold.
Hint:
Prepare purchases and income statement budgets for a merchandiser.
( Study Objective 6)
P6‐6A East Asian Industries' balance sheet at December 31, 2002, is presented below.
Managerial AccountingChapter 6
Page 393

EAST ASIAN INDUSTRIESBalance Sheet
December 31, 2002Assets
Current assets$ 7,500Cash82,500Accounts receivable30,000Finished goods inventory (2,000 units)120,000Total current assets
Property, plant, and equipment$40,000Equipment
30,00010,000Less: Accumulated depreciation$150,000Total assets
Liabilities and Stockholders' EquityLiabilities
$ 25,000Notes payable45,000Accounts payable70,000Total liabilities
Stockholders' equity$50,000Common stock30,000Retained earnings
80,000Total stockholders' equity$150,000Total liabilities and stockholders' equity
Additional information accumulated for the budgeting process is as follows.
Budgeted data for the year 2003 include the following.
Year 2003 Total4th Quarter of 2003$280,000$80,000Sales budget (8,000 units at
$35)72,40017,000Direct materials used38,6008,500Direct labor42,00010,000Manufacturing overhead
applied76,00018,000Selling and administrative
expenses
Managerial AccountingChapter 6
Page 394

To meet sales requirements and to have 2,500 units of finished goods on hand atDecember 31, 2003, the production budget shows 8,500 required units of output.The total unit cost of production is expected to be $18. East Asian Industries usesthe first‐in, first‐out (FIFO) inventory costing method. Total depreciation for theyear is $4,000. Interest expense is expected to be $3,500 for the year. Income taxesare expected to be 30% of income before income taxes.
All sales and purchases are on account. It is expected that 60% of quarterly salesare collected in cash within the quarter and the remainder is collected in thefollowing quarter. Direct materials purchased from suppliers are paid 50% in thequarter incurred and the remainder in the following quarter. Purchases in the fourthquarter were the same as the materials used. In 2003, the company expects topurchase additional equipment costing $24,000. It expects to pay $8,000 on notespayable plus all interest due and payable to December 31 (included in interestexpense $3,500, above). Accounts payable at December 31, 2003, includes amountsdue suppliers (see above) plus other accounts payable of $7,500. In 2003, thecompany expects to declare and pay a $5,000 cash dividend. Unpaid income taxesat December 31 will be $5,000. The company's cash budget shows an expected cashbalance of $29,750 at December 31, 2003.
Instructions
Prepare a budgeted income statement for 2003 and a budgeted balance sheet atDecember 31, 2003. In preparing the income statement, you will need to computecost of goods manufactured and finished goods inventory (December 31, 2003).Hint:
Prepare a budgeted income statement and balance sheet.
( Study Objective 3 Study Objective 4)
PROBLEMS: SET BP6‐1B Alcorn Farm Supply Company manufactures and sells a fertilizer called Basic II.
The following data are available for preparing budgets for Basic II for the first 2quarters of 2002.
1. Sales: Quarter 1, 50,000 bags; quarter 2, 70,000 bags. Selling price is $60 perbag.
2. Direct materials: Each bag of Basic II requires 5 pounds of Crup at a cost of$3 per pound and 10 pounds of Dert at $1.50 per pound.
3. Desired inventory levels:
Managerial AccountingChapter 6
Page 395

July 1April 1January 1Type of Inventory20,00015,00010,000Basic II (bags)15,00012,0009,000Crup (pounds)25,00020,00015,000Dert (pounds)
4. Direct labor: Direct labor time is 15 minutes per bag at an hourly rate of $10per hour.
5. Selling and administrative expenses are expected to be 10% of sales plus$150,000 per quarter.
6. Income taxes are expected to be 30% of income from operations.
Your assistant has prepared two budgets: (1) The manufacturing overhead budgetshows expected costs to be 100% of direct labor cost. (2) The direct materials budgetfor Dert which shows the cost of Dert to be $832,500 in quarter 1 and $132,500 inquarter 2.
Instructions
Prepare the budgeted income statement for the first 6 months of 2002 and allrequired supporting budgets by quarters and in total. (Note:Use variable and fixedin the selling and administrative expense budget.)Hint:
Prepare a budgeted income statement and supporting budgets.
( Study Objective 3 Study Objective 4)
P6‐2B Borealis Inc. is preparing its annual budgets for the year ending December 31, 2002.Accounting assistants furnish the following data.
Managerial AccountingChapter 6
Page 396

Product LN 40Product LN 35Sales budget:
150,000300,000Anticipated volume in units$30.00$20.00Unit selling price
Production budget:25,00030,000Desired ending finished goods units15,00020,000Beginning finished goods units
Direct materials budget:32Direct materials per unit (pounds)
20,00050,000Desired ending direct materials pounds10,00040,000Beginning direct materials pounds$3.00$2.00Cost per pound
Direct labor budget:0.750.5Direct labor hours per unit$9.00$9.00Direct labor rate per hour
Budgeted income statement:$20.00$10.00Total unit cost
An accounting assistant has prepared the detailed manufacturing overhead budgetand the selling and administrative expense budget. The latter shows selling expensesof $460,000 for product LN 35 and $440,000 for product LN 40, and administrativeexpenses of $420,000 for product LN 35 and $380,000 for product LN 40. Incometaxes are expected to be 30%.
Instructions
Prepare the following budgets for the year. Show data for each product. Quarterlybudgets should not be prepared.
a. Sales
b. Production
c. Direct materials
d. Direct labor
e. Income statement (Note: Income taxes are not allocated to the products.)
Hint:
Prepare sales, production, direct materials, direct labor, and income statement budgets.
( Study Objective 3 Study Objective 4)
Managerial AccountingChapter 6
Page 397

P6‐3B David Chambers Industries has sales in 2002 of $5,250,000 (656,250 units) and grossprofit of $1,587,500. Management is considering two alternative budget plans toincrease its gross profit in 2003.
Plan A would increase the selling price per unit from $8.00 to $8.60. Sales volumewould decrease by 10% from its 2002 level. Plan B would decrease the selling priceper unit by 5%. The marketing department expects that the sales volume wouldincrease by 100,000 units.
At the end of 2002, Chambers has 75,000 units on hand. If Plan A is accepted, the2003 ending inventory should be equal to 87,500 units. If Plan B is accepted, theending inventory should be equal to 100,000 units. Each unit produced will cost$2.00 in direct materials, $1.50 in direct labor, and $0.50 in variable overhead. Thefixed overhead for 2003 should be $965,000.
Instructions
a. Prepare a sales budget for 2003 under (1) Plan A and (2) Plan B.
b. Prepare a production budget for 2003 under (1) Plan A and (2) Plan B.
c. Compute the cost per unit under (1) Plan A and (2) Plan B. Explain why thecost per unit is different for each of the two plans. (Round to two decimals.)
d. Which plan should be accepted? (Hint: Compute the gross profit under eachplan.)
Hint:
Prepare sales and production budgets and compute cost per unit under two plans.
( Study Objective 3 Study Objective 4)
P6‐4B Flypaper Company prepares monthly cash budgets. Relevant data from operatingbudgets for 2003 are:
FebruaryJanuary$400,000$350,000Sales110,00095,000Direct materials purchases115,000100,000Direct labor75,00060,000Manufacturing overhead85,00075,000Selling and administrative
expenses
All sales are on account. Collections are expected to be 60% in the month of sale,30% in the first month following the sale, and 10% in the second month followingthe sale. Thirty percent (30%) of direct materials purchases are paid in cash in the
Managerial AccountingChapter 6
Page 398
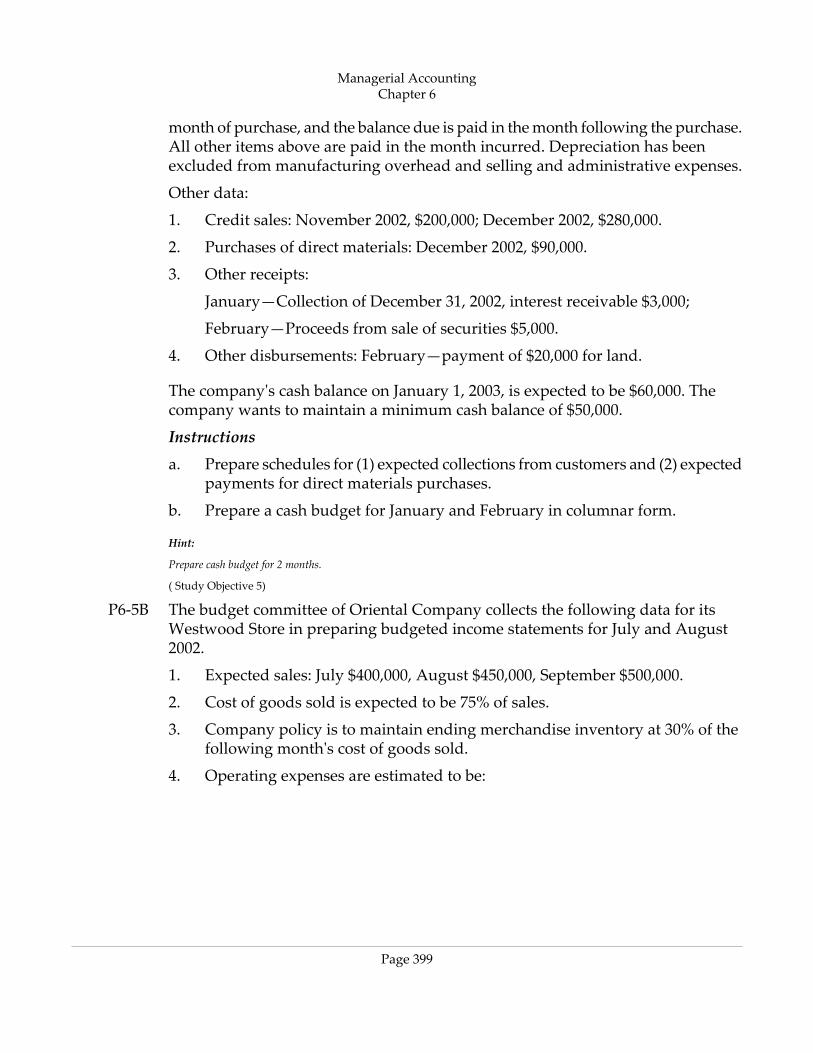
month of purchase, and the balance due is paid in the month following the purchase.All other items above are paid in the month incurred. Depreciation has beenexcluded from manufacturing overhead and selling and administrative expenses.
Other data:
1. Credit sales: November 2002, $200,000; December 2002, $280,000.
2. Purchases of direct materials: December 2002, $90,000.
3. Other receipts:
January—Collection of December 31, 2002, interest receivable $3,000;
February—Proceeds from sale of securities $5,000.
4. Other disbursements: February—payment of $20,000 for land.
The company's cash balance on January 1, 2003, is expected to be $60,000. Thecompany wants to maintain a minimum cash balance of $50,000.
Instructions
a. Prepare schedules for (1) expected collections from customers and (2) expectedpayments for direct materials purchases.
b. Prepare a cash budget for January and February in columnar form.
Hint:
Prepare cash budget for 2 months.
( Study Objective 5)
P6‐5B The budget committee of Oriental Company collects the following data for itsWestwood Store in preparing budgeted income statements for July and August2002.
1. Expected sales: July $400,000, August $450,000, September $500,000.
2. Cost of goods sold is expected to be 75% of sales.
3. Company policy is to maintain ending merchandise inventory at 30% of thefollowing month's cost of goods sold.
4. Operating expenses are estimated to be:
Managerial AccountingChapter 6
Page 399

$20,000 per monthSales salaries4% of monthly salesAdvertising2% of monthly salesDelivery expense3% of monthly salesSales commissions$3,000 per monthRent expense$700 per monthDepreciation$500 per monthUtilities$300 per monthInsurance
5. Income taxes are estimated to be 30% of income from operations.
Instructions
a. Prepare the merchandise purchases budget for each month in columnar form.
b. Prepare budgeted income statements for each month in columnar form. Showthe details of cost of goods sold in the statements.
Hint:
Prepare purchases and income statement budgets for a merchandiser.
( Study Objective 6)
BROADENING YOUR PERSPECTIVEGROUP DECISION CASE
BYP6‐1 Castle Corporation operates on a calendar‐year basis. It begins the annual budgetingprocess in late August when the president establishes targets for the total dollarsales and net income before taxes for the next year.
The sales target is given first to the marketing department. The marketing managerformulates a sales budget by product line in both units and dollars. From thisbudget, sales quotas by product line in units and dollars are established for eachof the corporation's sales districts. The marketing manager also estimates the costof the marketing activities required to support the target sales volume and preparesa tentative marketing expense budget.
The executive vice president uses the sales and profit targets, the sales budget byproduct line, and the tentative marketing expense budget to determine the dollaramounts that can be devoted to manufacturing and corporate office expense. Theexecutive vice president prepares the budget for corporate expenses. She thenforwards to the production department the product‐line sales budget in units andthe total dollar amount that can be devoted to manufacturing.
Managerial AccountingChapter 6
Page 400

The production manager meets with the factory managers to develop amanufacturing plan that will produce the required units when needed within thecost constraints set by the executive vice president. The budgeting process usuallycomes to a halt at this point because the production department does not considerthe financial resources allocated to be adequate.
When this standstill occurs, the vice president of finance, the executive vicepresident, the marketing manager, and the production manager meet together todetermine the final budgets for each of the areas. This normally results in a modestincrease in the total amount available for manufacturing costs and cuts in themarketing expense and corporate office expense budgets. The total sales and netincome figures proposed by the president are seldom changed. Although theparticipants are seldom pleased with the compromise, these budgets are final. Eachexecutive then develops a new detailed budget for the operations in his or her area.
None of the areas has achieved its budget in recent years. Sales often run belowthe target. When budgeted sales are not achieved, each area is expected to cut costsso that the president's profit target can be met. However, the profit target is seldommet because costs are not cut enough. In fact, costs often run above the originalbudget in all functional areas (marketing, production, and corporate office).
The president is disturbed that Castle has not been able to meet the sales and profittargets. He hired a consultant with considerable experience with companies inCastle's industry. The consultant reviewed the budgets for the past 4 years. Heconcluded that the product‐line sales budgets were reasonable and that the costand expense budgets were adequate for the budgeted sales and production levels.
Instructions
With the class divided into groups, answer the following.
a. Discuss how the budgeting process employed by Castle Corporationcontributes to the failure to achieve the president's sales and profit targets.
b. Suggest how Castle Corporation's budgeting process could be revised tocorrect the problems.
c. Should the functional areas be expected to cut their costs when sales volumefalls below budget? Explain your answer. (CMA adapted.)
MANAGERIAL ANALYSIS
BYP6‐2 Thebeau & Lewis Inc. manufactures ergonomic devices for computer users. Someof their more popular products include glare screens (for computer monitors),keyboard stands with wrist rests, and carousels that allow easy access to floppydisks. Over the past 5 years, they experienced rapid growth, with sales of allproducts increasing 20% to 50% each year.
Managerial AccountingChapter 6
Page 401

Last year, some of the primary manufacturers of computers began introducing newproducts with some of the ergonomic designs, such as glare screens and wrist rests,already built in. As a result, sales of Thebeau & Lewis's accessory devices havedeclined somewhat. The company believes that the disk carousels will probablycontinue to show growth, but that the other products will probably continue todecline. When the next year's budget was prepared, increases were built in toresearch and development so that replacement products could be developed or thecompany could expand into some other product line. Some product lines beingconsidered are generalpurpose ergonomic devices including back supports, footrests, and sloped writing pads.
The most recent results have shown that sales decreased more than was expectedfor the glare screens. As a result, the company may have a shortage of funds. Topmanagement has therefore asked that all expenses be reduced 10% to compensatefor these reduced sales. Summary budget information is as follows.
$240,000Raw materials110,000Direct labor50,000Insurance90,000Depreciation30,000Machine repairs50,000Sales salaries80,000Office salaries50,000Factory salaries (indirect labor)$700,000Total
Instructions
Using the information above, answer the following questions.
a. What are the implications of reducing each of the costs? For example, if thecompany reduces raw materials costs, it may have to do so by purchasinglower‐quality materials. This may affect sales in the long run.
b. Based on your analysis in (a), what do you think is the best way to obtain the$70,000 in cost savings requested? Be specific. Are there any costs that cannotor should not be reduced? Why?
REAL-WORLD FOCUS
BYP6‐3 Network Computing Devices Inc. was founded in 1988 in Mountain View, Calif.The company develops hardware and software thin‐client computing products.(Thin clients are computers that do not have a hard drive but, rather, are served
Managerial AccountingChapter 6
Page 402
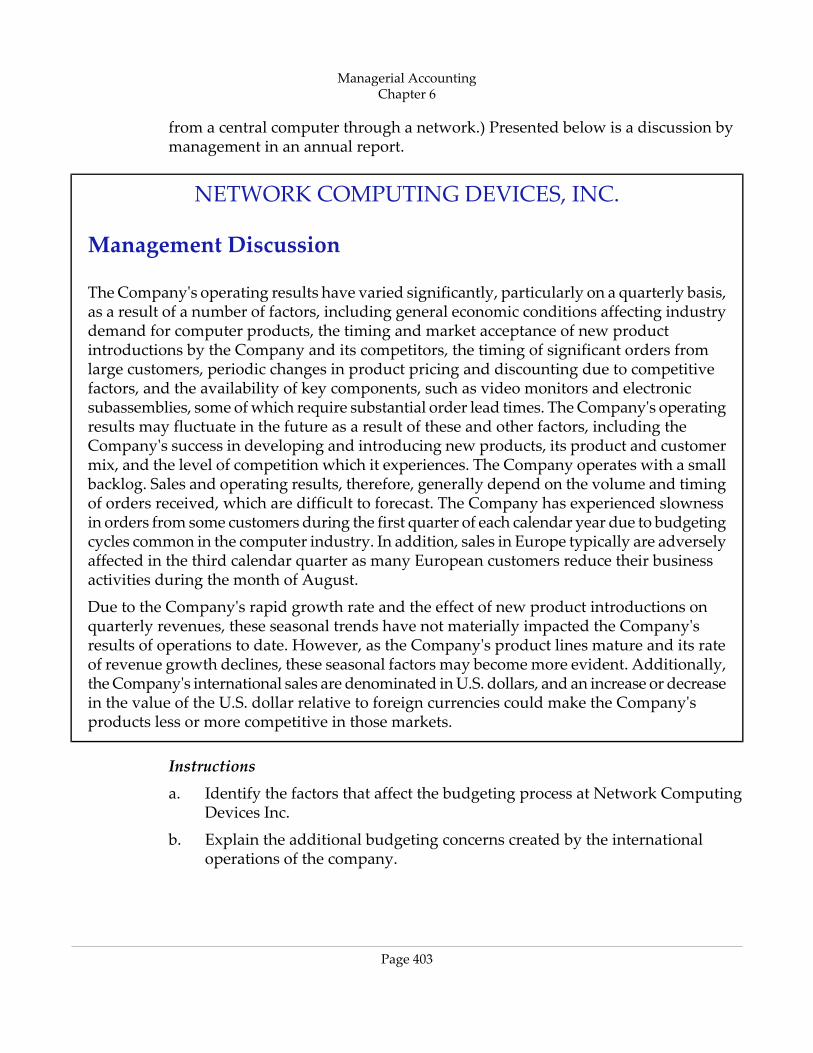
from a central computer through a network.) Presented below is a discussion bymanagement in an annual report.
NETWORK COMPUTING DEVICES, INC.
Management Discussion
The Company's operating results have varied significantly, particularly on a quarterly basis,as a result of a number of factors, including general economic conditions affecting industrydemand for computer products, the timing and market acceptance of new productintroductions by the Company and its competitors, the timing of significant orders fromlarge customers, periodic changes in product pricing and discounting due to competitivefactors, and the availability of key components, such as video monitors and electronicsubassemblies, some of which require substantial order lead times. The Company's operatingresults may fluctuate in the future as a result of these and other factors, including theCompany's success in developing and introducing new products, its product and customermix, and the level of competition which it experiences. The Company operates with a smallbacklog. Sales and operating results, therefore, generally depend on the volume and timingof orders received, which are difficult to forecast. The Company has experienced slownessin orders from some customers during the first quarter of each calendar year due to budgetingcycles common in the computer industry. In addition, sales in Europe typically are adverselyaffected in the third calendar quarter as many European customers reduce their businessactivities during the month of August.
Due to the Company's rapid growth rate and the effect of new product introductions onquarterly revenues, these seasonal trends have not materially impacted the Company'sresults of operations to date. However, as the Company's product lines mature and its rateof revenue growth declines, these seasonal factors may become more evident. Additionally,the Company's international sales are denominated in U.S. dollars, and an increase or decreasein the value of the U.S. dollar relative to foreign currencies could make the Company'sproducts less or more competitive in those markets.
Instructions
a. Identify the factors that affect the budgeting process at Network ComputingDevices Inc.
b. Explain the additional budgeting concerns created by the internationaloperations of the company.
Managerial AccountingChapter 6
Page 403

EXPLORING THE WEB
BYP6‐4 The opportunities for business consulting in the areas of corporate planning,budgeting, and strategy are almost limitless as new, more powerful softwarecontinues to be developed. This exercise takes you to the Web site of CP CorporatePlanning, a European consulting firm.
Address: www.corporate‐planning.com/home/fse_home.html (or go towww.wiley.com/college/weygandt )
Steps:
Go to the site above.
Instructions
Choose three case studies, and in each case identify the problem the company facedand how the situation was resolved.
COMMUNICATION ACTIVITY
BYP6‐5 In order to better serve their rural patients, Drs. Jim and Jeff Howell (brothers)began giving safety seminars. Especially popular were their“emergencypreparedness” talks given to farmers. Many people asked whether the“kit” of materials the doctors recommended for common farm emergencies wascommercially available.
After checking with several suppliers, the doctors realized that no other companyoffered the supplies they recommended in their seminars, packaged in the waythey described. Their wives, Marie and Pam, agreed to make a test package byordering supplies from various medical supply companies and assembling theminto a “kit” that could be sold at the seminars. When these kits proved a runawaysuccess, the sisters‐in‐law decided to market them. At the advice of their accountant,they organized this venture as a separate company, called Life Protection Products(LPP), with Marie Howell as CEO and Pam Howell as Secretary‐Treasurer.
LPP soon started receiving requests for the kits from all over the country, as wordspread about their availability. Even without advertising, LPP was able to sell itsfull inventory every month. However, the company was becoming financiallystrained. Marie and Pam had about $100,000 in savings, and they invested abouthalf that amount initially. They believed that this venture would allow them tomake money. However, at the present time, only about $30,000 of the cash remains,and the company is constantly short of cash.
Marie Howell has come to you for advice. She does not understand why thecompany is having cash flow problems. She and Pam have not even beenwithdrawing salaries. However, they have rented a local building and have hired
Managerial AccountingChapter 6
Page 404

two more full‐time workers to help them cope with the increasing demand. Theydo not think they could handle the demand without this additional help.
Marie is also worried that the cash problems mean that the company may not beable to support itself. She has prepared the cash budget shown on the next page.All seminar customers pay for their products in full at the time of purchase. Inaddition, several large companies have ordered the kits for use by employees whowork in remote sites. They have requested credit terms and have been allowed topay in the month following the sale. These large purchasers amount to about 25%of the sales at the present time. LPP purchases the materials for the kits about 2months ahead of time. Marie and Pam are considering slowing the growth of thecompany by simply purchasing less materials, which will mean selling fewer kits.
The workers are paid in cash weekly. Marie and Pam need about $15,000 cash onhand at the beginning of the month to pay for purchases of raw materials. Rightnow they have been using cash from their savings, but as noted, only $30,000 isleft.
The cash budget that Marie Howell has given you is shown below.
LIFE PROTECTION PRODUCTSCash Budget
For the Quarter Ending June 30, 2003JuneMayApril
$15,000$15,000$15,000Cash balance,beginningCash received
12,5007,5005,000From prior monthsales
37,50022,50015,000From current sales65,00045,00035,000Total cash on hand
Cash payments3,0003,0003,000To employees45,00035,00025,000For products7,0006,0005,000Miscellaneous
expenses1,0001,0001,000Postage56,00045,00034,000Total cash payments$ 9,000$ 0$ 1,000Cash balance$ 1,000$15,000$14,000Borrow from savings$ 7,000$ 0$ 0Borrow from bank?
Managerial AccountingChapter 6
Page 405

Instructions
Write a response to Marie Howell. Explain why LPP is short of cash. Will thiscompany be able to support itself? Explain your answer. Make any recommendationsyou deem appropriate.
RESEARCH ASSIGNMENT
BYP6‐6 The April 2000 issue of the Journal of Accountancy contains an article by LawrenceB. Macgregor Serven entitled “The Planning Peril.”
Instructions
Read the article and answer the following questions.
a. Describe the three reasons why revamping the planning process can beperilous.
b. What four recommendations does the author provide to improve the chancesof success of efforts to revamp the planning and budgeting process?
c. Review the sample survey. Identify what you believe are the three mostimportant questions in this survey, and explain why you think they areimportant.
ETHICS CASE
BYP6‐7 You are an accountant in the budgetary, projections, and special projects departmentof American Bare Conductor, Inc., a large manufacturing company. The president,Robert Boey, asks you on very short notice to prepare some sales and incomeprojections covering the next 2 years of the company's much heralded new productlines. He wants these projections for a series of speeches he is making while on a2‐week trip to eight East Coast brokerage firms. The president hopes to bolsterAmerican Bare's stock sales and price.
You work 23 hours in 2 days to compile the projections, hand deliver them to thepresident, and are swiftly but graciously thanked as he departs. A week later youfind time to go over some of your computations and discover a miscalculation thatmakes the projections grossly overstated. You quickly inquire about the president'sitinerary and learn that he has made half of his speeches and has half yet to make.You are in a quandary as to what to do.
Instructions
a. What are the consequences of telling the president of your grossmiscalculations?
b. What are the consequences of not telling the president of your grossmiscalculations?
Managerial AccountingChapter 6
Page 406

c. What are the ethical considerations to you and the president in this situation?
GLOSSARY
Budget A formal written statement of management's plans for a specified futuretime period, expressed in financial terms. (p. 230)
Budget committee A group responsible for coordinating the preparation of the budget. (p. 232)
Budgeted balancesheet
A projection of financial position at the end of the budget period. (p. 245)
Budgeted incomestatement
An estimate of the expected profitability of operations for the budgetperiod.(p. 241)
Cash budget A projection of anticipated cash flows.(p. 242)
Direct laborbudget
A projection of the quantity and cost of direct labor to be incurred to meetproduction requirements. (p. 238)
Direct materialsbudget
An estimate of the quantity and cost of direct materials to be purchased. (p.237)
Financial budgets Individual budgets that indicate the cash resources needed for expectedoperations and planned capital expenditures. (p. 234)
Long‐rangeplanning
A formalized process of selecting strategies to achieve long‐term goals anddeveloping policies and plans to implement the strategies.(p. 233)
Manufacturingoverhead budget
An estimate of expected manufacturing overhead costs for the budget period.(p. 239)
Master budget A set of interrelated budgets that constitutes a plan of action for a specifictime period. (p. 234)
Merchandisepurchases budget
The estimated cost of goods to be purchased by a merchandiser to meetexpected sales. (p. 247)
Operating budgets Individual budgets that result in a budgeted income statement. (p. 234)
Production budget A projection of the units that must be produced to meet anticipated sales.(p. 236)
Sales budget An estimate of expected sales for the budget period. (p. 235)
Sales forecast The projection of potential sales for the industry and the company's expectedshare of such sales.(p. 232)
Managerial AccountingChapter 6
Page 407
Selling andadministrativeexpense budget
A projection of anticipated selling and administrative expenses for the budgetperiod. (p. 240)
Managerial AccountingChapter 6
Page 408