Embed Size (px)
Citation preview

Formation Metals Inc.
Management’s Discussion and Analysis
For the Three Months Ended May 31, 2013
Unaudited
Date of Report: July 15, 2013
Suite 1810 – 999 West Hastings Street Vancouver, BC, Canada
V6C 2W2
Symbol: Toronto Stock Exchange - FCO

Table of Contents
1.1 Date .............................................................................................................................................................................. 1 1.2 Overview ..................................................................................................................................................................... 1 1.2.1 Summary ................................................................................................................................................................... 1 1.2.2 Highlights for the three months ended May 31, 2013 and subsequent events......................................................... 2 1.2.3 Risk Management ..................................................................................................................................................... 3 1.2.4 Basis of Analysis ....................................................................................................................................................... 4 1.2.5 Property Activities ..................................................................................................................................................... 4
(a) Idaho Cobalt Project – Idaho, USA .................................................................................................................... 4 (b) Big Creek Hydrometallurgical Complex (the “Complex”) – Idaho, USA ........................................................... 11 (c) Black Pine – Idaho, USA .................................................................................................................................. 11 (d) Badger Basin – Idaho, USA ............................................................................................................................. 11 (e) Morning Glory – Idaho, USA ............................................................................................................................ 11 (f) Queen of the Hills – Idaho, USA ...................................................................................................................... 12 (g) Wallace Creek – Idaho, USA ........................................................................................................................... 12 (h) El Milagro – Mexico .......................................................................................................................................... 12 (i) Kernaghan Lake / Bell – Saskatchewan, Canada ............................................................................................ 12 (j) Virgin River – Saskatchewan, Canada ............................................................................................................ 12 (k) Other Projects .................................................................................................................................................. 15
1.2.6 Outlook .................................................................................................................................................................... 15 1.3 Selected Annual Information .................................................................................................................................. 23 1.4 Results of Operations .............................................................................................................................................. 24 1.5 Summary of Quarterly Results ............................................................................................................................... 26 1.6 Liquidity .................................................................................................................................................................... 27 1.7 Capital Resources .................................................................................................................................................... 27 1.8 Off-Balance Sheet Arrangements ........................................................................................................................... 28 1.9 Transactions with Related Parties ......................................................................................................................... 28 1.10 Proposed Transactions ......................................................................................................................................... 28 1.11 Critical Accounting Estimates .............................................................................................................................. 28 1.13 Financial Instruments and Other Instruments .................................................................................................... 33 1.14 Other MD&A Requirements ................................................................................................................................... 34
(a) Disclosure of Outstanding Share Data ................................................................................................................ 34 (b) Internal Controls over Financial Reporting and Disclosure Controls .................................................................. 35 (c) Additional Information .......................................................................................................................................... 36

1
This Management’s Discussion and Analysis (“MD&A”) should be read in conjunction with the audited consolidated financial statements of Formation Metals Inc. (the “Company”) and the notes thereto, for the years ended February 28, 2013 and February 29, 2012 which have been prepared in accordance with International Financial Reporting Standards (“IFRS”) and are available through the internet on SEDAR at www.sedar.com. All dollar amounts herein are expressed in Canadian Dollars unless stated otherwise.
This MD&A includes certain statements that may be deemed “forward-looking statements” which the Company believes it has a reasonable basis for disclosing. All statements in this discussion, other than statements of historical facts, that address future production, reserve potential, exploration drilling, exploitation activities and events or developments that the Company expects are forward-looking statements. Although the Company believes the expectations expressed in such forward-looking statements are based on reasonable assumptions, investors are cautioned such statements are not guarantees of future performance and actual results or developments may differ materially from those in the forward-looking statements. Factors that could cause actual results to differ materially from those in forward-looking statements include market prices, exploitation and exploration successes, continued availability of capital and financing and general economic, market or business conditions. The Company does not undertake to update any forward-looking statements that are contained herein, except in accordance with applicable securities laws. 1.1 Date
This MD&A is prepared as of July 15, 2013 1.2 Overview
1.2.1 Summary
Formation Metals Inc. (the “Company”) is a mineral exploration, development and refining company listed on the senior board of the Toronto Stock Exchange under the symbol FCO. The Company is engaged in the business of exploring minerals in Canada, the United States and Mexico either directly or indirectly through its wholly owned subsidiaries including:
(a) Formation Holdings Corp. (“Formation Holdings”), a British Columbia corporation; (b) Formation Capital Corporation, U.S (“Formation Capital”), a Nevada corporation. (c) Formation Holdings US, Inc.(“Formation Holdings US”), an Idaho corporation; (d) US Cobalt, Inc. (“US Cobalt”), an Idaho corporation; (e) Coronation Mines Ltd. (“Coronation”), a Saskatchewan company; (f) Minera Terranova S.A. de C.V. (“Minera Terranova”), a Mexican company; (g) Essential Metals Corporation® (“EMC”), an Idaho corporation; and (h) Formation Metals, U.S. (“FM US”) a Nevada corporation. (dba Sunshine Precious Metals Refinery).
The Company’s flagship project, the 100% owned Idaho Cobalt Project (the “ICP”), is comprised of the mine and mill site (“ICP Mine Site”) located in Lemhi County, Idaho, near the town of Salmon, and the current conceptual Cobalt Production Facility (“CPF”) located at the Big Creek Hydrometallurgical Refining Complex (the “Complex”) in Shoshone County, near the town of Kellogg, Idaho. The ICP is an environmentally permitted, primary cobalt deposit that will be capable of producing high purity cobalt (“HPC”) metal suitable for critical applications in the superalloy sector once fully financed and in production. If the ICP is put into production in the near-term, it is expected that the Company will become the United States’ sole integrated primary cobalt miner and refiner of superalloy grade HPC metal. Stage I Construction, completed in 2010, consisted primarily of clearing timber from the site in preparation for laying the foundation to be used for the ICP Mine Site structures. Over the course of the past fiscal year, efforts concentrated on completing detailed engineering at the ICP Mine Site and the CPF (95% complete) and accomplishing time critical tasks of Stage II construction to prepare the ICP for the commencement of underground development. At the ICP Mine Site, work concluded includes the mobilization and assembly of modular administration offices for permanent use, the completion of pad earthwork construction at the concentrator, crusher, tram discharge terminal and miner’s dry and the procurement of additional equipment. Portal bench excavation and geotechnical drilling was completed to assist in further evaluation of engineering for surface and underground work at the mine. At the Tailing Waste Storage Facility (“TWSF”), construction on all berms and the wetlands mitigation pond was completed and sufficient liner was installed preparing the TWSF to accept mine portal tailings once underground operations commence. Roadwork on the associated infrastructures to and from these facilities was also completed.
At the CPF, pouring of concrete for foundations of the new building was completed and refurbishment of existing regrind mill and copper circuits is ongoing. Additional concrete construction began in July 2012 and was completed in August 2012. This work was concentrated on the foundations for the cobalt electrowinning cells, crane structures, and constructing the oxygen tank pad. The cobalt electrowinning cells were placed on the CPF foundation beams and were covered for the winter months. Significant progress on beneficiation engineering analysis was completed and these studies demonstrated that in lieu of modifying existing autoclaves, the installation of a new autoclave would enhance efficiency at the CPF. Ongoing studies are considering the most favorable location for the CPF with a view to reducing estimated operating costs.

2
The Company announced on May 2, 2013 its decision to defer underground development at the ICP. This decision was made in light of weak cobalt prices during fiscal 2013 and enhanced adversity to risk by potential financiers in prevailing turbulent markets, which resulted in unattractive financing costs to complete development of the ICP. This decision allowed the Company to preserve working capital and delay extraction of cobalt and copper resources until market conditions improve to enhance the ICP’s economics. The Company fully intends to recommence construction of the ICP once markets improve and financing has been completed. Stage III of construction involves underground excavation to the ore face and the building of the required facilities such as the mill, concentrator and water treatment plant. Initial commercial production is expected to begin between 9 and 14 months from the commencement of Stage III construction. The Company’s Sunshine Precious Metals Refinery (the “Sunshine Refinery”) and copper refinery (“SX-EW”) are also located at the Complex. The SX-EW is a facility that could be shared by both the Sunshine Refinery and the CPF; however internal studies conducted in 2012 concluded that a standalone facility would be better suited to process concentrate from the ICP Mine Site rather than a retro-fit of the existing Complex. The standalone facility can be relocated within the general vicinity where the Company holds an additional 16 acres of industrial zoned private land. This also affords the opportunity for management to consider the relocation of the standalone facility to a location closer to the ICP Minesite, and/or a railhead, which would have a positive impact on future operational expenditures for the ICP. The Sunshine Refinery has been receiving silver doré from major silver producers and high grade silver products from silver users, mints and from other sources. On April 30, 2012, the Company’s Sunshine Refinery became an Approved Refiner and Brand on the official list of the COMEX (Commodity Exchange, Inc., a designated contract market of the CME Group Inc.). On June 6, 2013, the Company entered into a binding letter agreement (the “Letter Agreement”) to sell, for US$9.0 million in cash, 100% of its Sunshine Refinery, copper refinery and certain lands at the Complex (the “Refinery Assets”) to certain entities that are associated or affiliated with Waterton Global Resource Management, Inc. (“Waterton”). On June 26, 2013, the Company announced that the proposed sale of the Refinery Assets to Waterton had terminated, and on July 5, 2013 the Company announced the execution of a full and final mutual release with Waterton in respect of the Letter Agreement and the payment to Waterton of a break fee of US$1.0 million. A sale of this non-core asset continues to be pursued. In addition to cobalt, other minerals being explored for by the Company and its various subsidiaries include silver, gold, copper, lead, zinc, uranium, platinum group metals and rare earth elements (“REE’S”). 1.2.2 Highlights for the three months ended May 31, 2013 and subsequent events
ICP:
(a) On May 2, 2013, the Company announced its decision to defer underground development of the ICP due to weak cobalt
prices during fiscal 2013 and enhanced adversity to risk by potential financiers in prevailing markets, which resulted in
unattractive financing costs to complete development of the ICP. The Company fully intends to recommence construction
of the ICP once markets improve and financing has been completed; and
(b) During the three months ended May 31, 2013, the Company capitalized an additional $202,972 on the ICP, totalling
$56,701,323 spent on the ICP at May 31, 2013;
Sunshine Refinery:
(a) The Company announced on June 6, 2013 that it had entered into a binding Letter Agreement to sell, for US$9.0 million in cash, 100% of the Refinery Assets to Waterton;
(b) On June 13, 2013, Dundee Corporation (“Dundee”) filed a Petition in the Supreme Court of British Columbia against the Company, its directors and Waterton seeking to obtain a determination that the sale of the Refinery Assets to Waterton is a sale of all or substantially all of the Company’s undertaking subject to approval of the Company’s shareholders, under the Business Corporations Act (British Columbia), to obtain injunctions restraining the Company and Waterton from proceeding with the sale pending determination of that issue and seeking leave to commence a derivative proceeding against the directors of the Company based on allegations of breach of fiduciary duty;
(c) The Company announced on June 20, 2013 that the Supreme Court of British Columbia had dismissed Dundee’s
application for an injunction to halt the potential sale of the Refinery Assets to Waterton and that Dundee had sought only injunctive relief and did not proceed with its petition with respect to the issue of shareholder approval of any sale, nor leave to bring a derivative action;
(d) On June 26, 2013, the Company announced that the proposed sale of the Refinery Assets to Waterton had terminated;
and
(e) On July 5, 2013, the Company announced the execution of a full and final mutual release with Waterton in respect of the Letter Agreement and the payment to Waterton of a break fee of US$1.0 million. A sale of this non-core asset continues to be pursued. In the meantime, operations at the Complex are continuing.
3
Corporate:
(a) During the three months ended May 31, 2013, the Company reported a comprehensive loss of $3,533,680 and accumulated deficit of $46,047,422;
(b) As at May 31, 2013, the Company has working capital of $8,325,074;
(c) On May 9, 2013, the Company repaid the remaining US$43,600,000 of the Federal Stimulus Program Recovery Zone Facility Bonds (the “Bonds”) by using restricted cash from the Bank of Montreal (“BMO”) Letter of Credit (“LOC”). The balance of amounts requisitioned by the Company on redemption date was US$34,667,602 resulting in an unused balance of US$8,932,398. The Company also closed the LOC in conjunction with the Bond redemption and released net cash of US$9,569,439 or $9,595,277 from unused Bond proceeds and restricted cash to the Company’s treasury;
(d) On June 14, 2013, Dundee issued a letter and proxy circular soliciting the Company’s shareholders to vote for two nominees proposed by Dundee to be the two Class III directors elected at the Company’s Annual General and Special Meeting on June 21, 2013;
(e) On June 21, 2013, at the Annual General and Special Meeting, the Company’s shareholders voted to re-elect
managements’ director nominees, Mari-Ann Green and Scott Bending. The other resolutions considered at the Annual General and Special Meeting were also passed in accordance with the recommendations of management; and
(f) On July 9, 2013, pursuant to an initial recommendation of the Compensation, Nomination and Corporate Governance Committee of the Board, which was previously charged with undertaking a comprehensive review of the Company’s corporate governance practices, the roles of Chairman and CEO have been separated. Mr. Robert Quinn, previously Lead Director, has been appointed Chairman of the Board of Directors of the Company and Mari-Ann Green will continue in her role as director and Chief Executive Officer.
1.2.3 Risk Management Overview
The Company is an exploration, development, mining and refining company. Its activities subject the Company to a broad range of risks. These risks are managed within a company-wide risk management framework. The Company’s goal in managing risk is to strategically optimize risk taking and risk management to support long-term revenue, earnings and capital growth. Management seeks to achieve this by capitalizing on business opportunities that are aligned with the Company’s risk taking philosophy, risk appetite and return expectations; by identifying, measuring and monitoring key risks taken; and by executing risk control and mitigation programs. The Company’s risk management framework sets out policies and standards of practice related to risk governance, risk identification, risk measurement, risk monitoring, and risk control and mitigation. With an overall goal of effectively executing risk management activities, the Company continuously invests to build, acquire and maintain the necessary personnel, processes, tools and systems. The Company manages risk taking activities against an overall risk appetite, which defines the amount and type of risks we are willing to assume. The risk appetite reflects the Company’s financial condition, risk tolerance and business strategies. The quantitative component of our risk appetite establishes Company targets defined in relation to economic capital, and projected earnings sensitivity. Management has further established targets for each of the Company’s principal risks to assist management in maintaining appropriate levels of exposures and a risk profile that is well diversified across risk categories. Individual risk management programs are in place for each of the Company’s broad risk categories including strategic, market, liquidity, credit, insurance and operational. To ensure consistency, these programs incorporate policies and standards of practice covering:
(a) Assignment of risk management accountabilities across the organization;
(b) Delegation of authorities related to risk taking activities;
(c) Philosophy and appetite related to assuming risks;
(d) Establishment of specific risk targets or limits;
(e) Identification, measurement, assessment, monitoring, and reporting of risks; and
(f) Activities related to risk control and mitigation.
The Company cautions that the preceding discussion of risks that may affect future results is not exhaustive. When relying on forward-looking statements, investors and others should carefully consider the foregoing risks, as well as other uncertainties and potential events, and other external and Company specific risks that may adversely affect the future business, financial condition or results of operations of the Company.

4
1.2.4 Basis of Analysis
The sections that follow provide information about the important aspects of our operations and investments, on a consolidated basis, and include discussions of our results of operations, financial position and sources and uses of cash, as well as significant future commitments. In addition, we have highlighted key trends and uncertainties to the extent practical. The content and organization of the financial and non-financial data presented in these sections are consistent with information used by our chief operating decision makers for, among other purposes, evaluating performance and allocating resources. The following discussion should be read in conjunction with the Company’s audited annual consolidated financial statements for the fiscal year ended February 28, 2013 and February 29, 2012 and notes thereto. As part of our decision-making process we monitor many economic indicators, especially those most closely related to the demand, supply and pricing of metals, as well as the politico-economic situation in the main commodity supplier and consumer countries. Political developments affecting metal production can change quickly in some of the major cobalt producing countries such as the Democratic Republic of Congo, Zambia, Cuba, Russia, and in particular, those countries that are currently coping with armed conflicts. While most economic indicators impact our operations to some degree, we are especially sensitive to capital spending in cobalt intensive industries such as the re-chargeable battery sector, aerospace, high-tech, medical prosthetics, industrial, high-temperature steels and environmental applications such as gas and coal to liquids processes, oil desulphurization, wind turbine generators and hybrid-electric vehicles. We also monitor cobalt–related consumption expenditures on such items as computers, cell phones, paints and cutting steels. 1.2.5 Property Activities
The Company holds mineral exploration properties in Canada, the United States and Mexico. The Company’s 100% owned subsidiary, FM US, is engaged in the operation of a precious metals and concentrate refining business located in the State of Idaho. The Company conducts its exploration independently as well as through joint venture agreements with third parties. The following is a brief discussion of the Company’s major mineral exploration and development projects: (a) Idaho Cobalt Project – Idaho, USA
Background
The Company’s principal property is the 100% owned ICP Mine Site, a primary high grade cobalt deposit located in Lemhi County, Idaho, acquired through staking in 1994 and 1995. The property is held by the Company’s 100% owned subsidiary Formation Capital, and was extensively explored and developed to a bankable feasibility stage. All required environmental permits have been received from the various permitting agencies and construction of the project commenced with timber clearing in the spring of 2010. The project covers an area of approximately 4,080 acres and includes 241 mining claims. The Company now owns a 100% interest in these claims. This project is not subject to any royalty payments. Technical Results
A National Instrument 43-101 compliant technical report (the “Technical Report”), was completed September 14, 2007, revised May 19, 2008, amended and restated June 23, 2008 and SEDAR filed on July 15, 2008 and was derived from a more comprehensive Bankable Feasibility Study. The Technical Report is an engineering document designed to assess the mineral resources of the ICP and evaluate, among other things, the economic parameters of the deposit for potential financiers for the purpose of securing funds for mine development. The SEDAR filed Technical Report revealed the conservative base case scenario utilizing a 7.5% discount rate and utilizing a US$22.52 per lb. high purity cobalt metal price, returned a pre-tax Net Present Value (“NPV”) of US$87.29 million with an Internal Rate of Return (“IRR”) of 22.30%. Modifications to planned mining methods are being studied with the objective of reducing construction and operating costs and improve the NPV and IRR. Capital costs may be further reduced during detailed engineering and re-assessment of capital expenditures as the prices of several inputs have decreased since the Technical Report was completed prior to the onset of the world financial crisis. These optimization studies are ongoing. Prior to the completion of the Technical Report, an updated resource estimate was completed by Mine Development & Associates (MDA) in October of 2006 and is summarized in the following table.

5
Total Cobalt Project Resource utilizing 0.2% cut-off:
Category Tons % Cobalt % Copper Oz/ton Gold
Measured (“M”) 1,840,700 0.626 0.592 0.015
Indicated (“I”) 813,700 0.632 0.681 0.017
Total M&I 2,654,400 0.628 0.619 0.016
Inferred 1,121,600 0.585 0.794 0.017
Contained Metal Pounds Pounds Ounces
Measured and Indicated 33.3 million 32.9 million 41,000
Inferred 13.1 million 17.8 million 19,000
The resource estimate was prepared in conformance with the requirements set out in the Standards of Disclosure for Mineral Projects defined by National Instrument 43-101, under the direction of Mr. Neil Prenn, P.Eng., a Principal of MDA, who is an independent Qualified Person as defined by National Instrument 43-101. This report was SEDAR filed on November 3, 2006. The proven and probable mineral reserves outlined in the Technical Report are 2,636,200 tons with an average grade of 0.559% cobalt, 0.596% copper and 0.014 ounces per ton gold, based on a cut-off grade of 0.2% cobalt for a ten year mine life. The inferred resource for the ICP, not a part of this study, is 1,121,600 tons grading 0.585% cobalt, 0.794% copper and 0.017 ounces per ton gold as reported in the October 2006 MDA report mentioned above. Previous exploration and development drilling demonstrated that the permissive sequence for cobaltiferous mineralization in the Ram deposit remains open at both the north and south ends along strike and remains open down dip. This represents a currently defined strike length of approximately 3,200 feet. A 6,000 foot diamond drill program was initiated in late July 2010 in a previously untested area on the ICP and concluded in October 2010 with final assay results released in January 2011. Drill assays results confirmed economic ore grade mineralization in an additional 390 feet along strike to the south and 200 feet down dip, representing a 14% increase in the known strike extension of the Ram deposit to 3,200 feet. These results are expected to increase the reserve / resource base and mine life of the project, however, to date, no comprehensive NI 41-101 compliant studies have been conducted to confirm this expectation of resource base and mine life extension. An additional 5,727.5 feet were drilled in six holes in a previously untested area along the southern extension of the Ram deposit during this program. The data from this verification drill program has provided information needed to optimize mine design and production plans and has been used to maximize ore production as early in mine life as possible. Additional material for follow-up metallurgical testing on gold and REE’s known to occur on the property will be obtained once underground operations reach the ore face. Potential revenue from the production of gold and REE’s was not included in the Company’s Technical Report and no estimation of the potential economic viability of any such additional commodities currently exists. Financing
(i) Letters of Credit Arrangements
In September 2010, the Company received two Certificates of Allocation from the State of Idaho authorizing a total of US$46,700,000 in Bonds to the Company as ultimate beneficiary to be issued by the Industrial Development Corporation of Lemhi County, Idaho and the Industrial Development Corporation of Shoshone County, Idaho. In December 2010, the Company was issued revised Certificates of Allocation from the State of Idaho authorizing an additional US$31,000,000 in Bonds. As a result, the Company’s wholly owned subsidiaries, Formation Capital and EMC, were the sole beneficiaries of US$77,700,000 in Bonds. The interest rate on the Bonds is benchmarked with the Securities Industry and Financial Markets Association (“SIMFA”) Municipal Swap Index. These tax exempt industrial facility bonds were sold to the public prior to their December 31, 2010 expiry date and the funds were placed in a trust account. The terms of the Bonds require that the Company secure supporting letters of credit for the amounts to be drawn upon. Otherwise, the funds will be returned to the bondholders. The Company only record the liability at the time when funds are withdrawn from the Bonds. To provide letters of credit guarantees to back the Bonds, the Company mandated BNP Paribas (“BNPP”) to act as sole Mandated Lead Arranger and bookrunner for a senior secured debt facility (the “Facility”) for the construction and operation of the ICP. Based on an indicative term sheet negotiated between BNPP and the Company through its financial advisor, Auramet Trading, LLC, the Facility was expected to take the form of an amortizing construction / term loan or Letter of Credit supporting the issuance of the Bonds. In December 2010, Micon International Limited (“Micon”) was chosen through a selective bid process, to act as Independent Technical Engineer to provide the necessary due diligence technical reviews required for the Company’s ICP debt financing. Micon and JDS Energy and Mining Inc. (“JDS”), the Company’s Construction Manager, and in house engineers completed their due diligence during the second quarter of fiscal 2012 resulting in the receipt of the commitment from BNPP to provide a Facility to back the Bonds. On November 3, 2011, the commitment by BNPP to provide the Facility support of the Bonds was terminated without closing. On November 21, 2011, the Company secured a Letter of Credit (“LOC”) from BMO Bank of Montreal in support of US$43,600,000 of the US$77,700,000 raised from the sale of the Bonds. This LOC was cash
6
collateralized with $43,800,000 from the Company’s treasury. Although US$43,600,000 was secured, the full amount of the LOC was not used to draw down the Bond. An extension for the placement of letters of credit was made for the remaining US$34,100,000 of the US$77,700,000 Bonds until March 21, 2012. On February 7, 2012, the Company engaged Union Bank, N.A. (“UB”) as Lead Arranger to provide a credit facility supporting the Company’s US$77,700,000 Bonds. As UB was involved as one of the key syndicate members in the BNPP structured Facility, it was familiar with the Company’s ICP project. UB proposed to arrange a club of underwriters that would include themselves and at their discretion, additional lenders. On March 21, 2012, due to feedback from UB, other banks and the capital market, the Company repaid US$34,100,000 of the US$77,700,000 to Bond purchasers from cash originally held in trust. The Bonds added long term value with respect to their relatively low interest rates but they would have limited the Company’s flexibility with respect to the capital structure of project finance under current market conditions. On May 9, 2013, the Company repaid the remaining US$43,600,000 of Bonds by using restricted cash from the LOC. During the three months period ended May 31, 2013, the Company requisitioned $nil (February 28, 2013- US$11,130,229 or $11,479,718) for an aggregate requisitioned balance of US$34,667,602 or $35,756,165 prior to redemption of the Bonds. These funds were requisitioned from the ICP construction accounts to reimburse qualified ICP construction expenditures to the Company’s treasury since the inception of the Bonds. The unused balance of the Bonds on redemption date was US$8,932,398. In conjunction with the Bonds redemption, the Company closed the LOC and released net cash of US$9,569,439 or $9,595,277 from unused Bond proceeds and restricted cash to the Company’s treasury. As at May 31, 2013, amounts owed for Bonds proceed requisitioned is $nil (February 28, 2013- US$34,667,602 or $35,756,165). The Bonds repayment was made as a result of the Company’s decision to defer underground development of the ICP due to weak cobalt prices and enhanced adversity to risk by potential financiers in prevailing market conditions, which resulted in unattractive financing costs for further ICP development. The Company fully intends to recommence construction once market conditions improve and mine financing has been concluded.
(ii) Letters of Credit and Restricted Cash
Per the LOC, the Company was required to secure US$626,475 for finance and accrued interest for up to 106 days at 8% calculated on the principal of the Bonds, less US$800,000 for initial issuance costs. The total amount secured by the November 21, 2011 LOC was US$44,226,474. On March 21, 2012, the Company returned US$34,100,000 to bondholders. As a result, accrued interest for this portion of the Bond was collapsed reducing the LOC to US$44,163,958. The LOC for US$44,163,958 was made up of one set of Letters of Credit expiring November 21, 2013. As consideration, the Company agreed to pay the BMO interest of 0.375% per annum on the principal of the LOC and a quarterly fee of $200 for each LOC. The Company is required to pay BMO on demand in Canadian currency, at BMO’s prevailing US dollars selling rate, amounts drawn from the LOC and all other charges and expenses incurred by BMO relative to the LOC. The Company had converted all cash held in restricted cash account to US dollars since November 21, 2011. This eliminated foreign exchange risks as 100% of the US dollars Letters of Credit have been secured by US dollars held in restricted cash account. On May 9, 2013, the Company repaid the remaining US$43,600,000 of Bonds by using restricted cash from the LOC. The balance of amounts requisitioned by the Company on redemption date was US$34,667,602 resulting in an unused balance of US$8,932,398. The Company also closed the LOC in conjunction with the Bond redemption and released net cash of US$9,569,439 or $9,595,277 from unused Bond proceeds and restricted cash to the Company’s treasury. Due to the Bonds redemption and cancelation of the LOC, the Company collateralized $nil (February 28, 2013- $45,550,708) with cash from treasury to secure the LOC with BMO as at May 31, 2013. During the three months ended May 31, 2013, the Company paid $32,430 (May 31, 2012- $43,154) for interest and fees related to the LOC prior to the cancelation of the LOC.
7
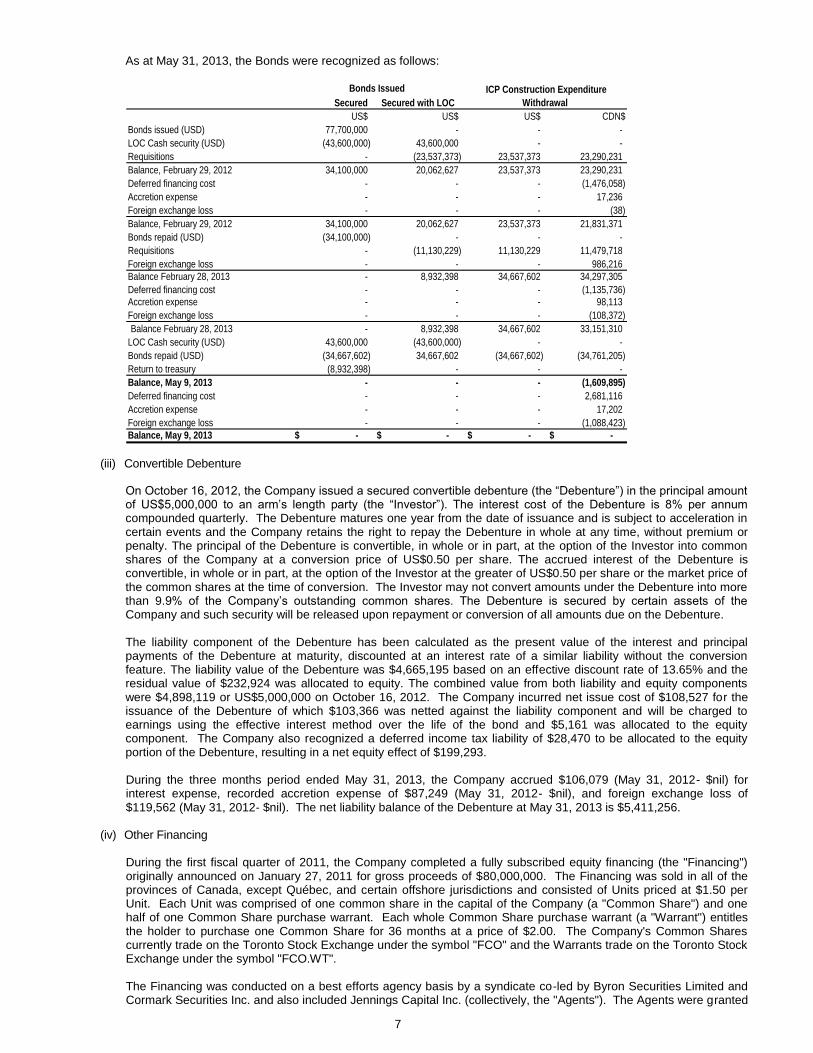
As at May 31, 2013, the Bonds were recognized as follows:
Secured Secured with LOC
US$ US$ US$ CDN$
Bonds issued (USD) 77,700,000 - - -
LOC Cash security (USD) (43,600,000) 43,600,000 - -
Requisitions - (23,537,373) 23,537,373 23,290,231
Balance, February 29, 2012 34,100,000 20,062,627 23,537,373 23,290,231
Deferred financing cost - - - (1,476,058)
Accretion expense - - - 17,236
Foreign exchange loss - - - (38)
Balance, February 29, 2012 34,100,000 20,062,627 23,537,373 21,831,371
Bonds repaid (USD) (34,100,000) - - -
Requisitions - (11,130,229) 11,130,229 11,479,718
Foreign exchange loss - - - 986,216
Balance February 28, 2013 - 8,932,398 34,667,602 34,297,305
Deferred financing cost - - - (1,135,736)
Accretion expense - - - 98,113
Foreign exchange loss - - - (108,372)
Balance February 28, 2013 - 8,932,398 34,667,602 33,151,310
LOC Cash security (USD) 43,600,000 (43,600,000) - -
Bonds repaid (USD) (34,667,602) 34,667,602 (34,667,602) (34,761,205)
Return to treasury (8,932,398) - - -
Balance, May 9, 2013 - - - (1,609,895)
Deferred financing cost - - - 2,681,116
Accretion expense - - - 17,202
Foreign exchange loss - - - (1,088,423)
Balance, May 9, 2013 -$ -$ -$ -$
Bonds Issued ICP Construction Expenditure
Withdrawal
(iii) Convertible Debenture
On October 16, 2012, the Company issued a secured convertible debenture (the “Debenture”) in the principal amount of US$5,000,000 to an arm’s length party (the “Investor”). The interest cost of the Debenture is 8% per annum compounded quarterly. The Debenture matures one year from the date of issuance and is subject to acceleration in certain events and the Company retains the right to repay the Debenture in whole at any time, without premium or penalty. The principal of the Debenture is convertible, in whole or in part, at the option of the Investor into common shares of the Company at a conversion price of US$0.50 per share. The accrued interest of the Debenture is convertible, in whole or in part, at the option of the Investor at the greater of US$0.50 per share or the market price of the common shares at the time of conversion. The Investor may not convert amounts under the Debenture into more than 9.9% of the Company’s outstanding common shares. The Debenture is secured by certain assets of the Company and such security will be released upon repayment or conversion of all amounts due on the Debenture. The liability component of the Debenture has been calculated as the present value of the interest and principal payments of the Debenture at maturity, discounted at an interest rate of a similar liability without the conversion feature. The liability value of the Debenture was $4,665,195 based on an effective discount rate of 13.65% and the residual value of $232,924 was allocated to equity. The combined value from both liability and equity components were $4,898,119 or US$5,000,000 on October 16, 2012. The Company incurred net issue cost of $108,527 for the issuance of the Debenture of which $103,366 was netted against the liability component and will be charged to earnings using the effective interest method over the life of the bond and $5,161 was allocated to the equity component. The Company also recognized a deferred income tax liability of $28,470 to be allocated to the equity portion of the Debenture, resulting in a net equity effect of $199,293. During the three months period ended May 31, 2013, the Company accrued $106,079 (May 31, 2012- $nil) for interest expense, recorded accretion expense of $87,249 (May 31, 2012- $nil), and foreign exchange loss of $119,562 (May 31, 2012- $nil). The net liability balance of the Debenture at May 31, 2013 is $5,411,256.
(iv) Other Financing During the first fiscal quarter of 2011, the Company completed a fully subscribed equity financing (the "Financing") originally announced on January 27, 2011 for gross proceeds of $80,000,000. The Financing was sold in all of the provinces of Canada, except Québec, and certain offshore jurisdictions and consisted of Units priced at $1.50 per Unit. Each Unit was comprised of one common share in the capital of the Company (a "Common Share") and one half of one Common Share purchase warrant. Each whole Common Share purchase warrant (a "Warrant") entitles the holder to purchase one Common Share for 36 months at a price of $2.00. The Company's Common Shares currently trade on the Toronto Stock Exchange under the symbol "FCO" and the Warrants trade on the Toronto Stock Exchange under the symbol "FCO.WT". The Financing was conducted on a best efforts agency basis by a syndicate co-led by Byron Securities Limited and Cormark Securities Inc. and also included Jennings Capital Inc. (collectively, the "Agents"). The Agents were granted

8
an option, exercisable at any time for a period of 30 days, to purchase additional Units equal to 15% of the number of Units sold pursuant to the offering at the issue price of the Units, to cover over-allotments, if any and for market stabilization purposes. No portion of this option was exercised by the Agents. In consideration for the services rendered by the Agents under the offering, the Agents received a cash commission of 6% of the gross proceeds of the Offering and received broker warrants to purchase an aggregate number of Common Shares equal to 6% of the number of Units issued under the offering, at a purchase price of $1.50 for a period of 24 months. Concurrent with the close of the Financing, the Company repaid the balance owing of $7,000,000 on the $8,000,000 unsecured convertible debenture (the "Debenture") issued to Coalcorp Mining Inc. ("Coalcorp") on May 7, 2010. The Debenture was repaid through a mutually agreed cash and share settlement in the amount of $9,330,000 in cash for the unsecured debenture balance and any accrued and unpaid interest and 400,000 common shares issued at market value of $1.25 per share. The Company recorded a $2,737,588 loss from this settlement for the fiscal year ended February 29, 2012. The successful conclusion of the $80,000,000 equity financing allowed the Company to commence Stage II Construction of the ICP in the summer of 2011.
Construction of ICP Mine Site and Cobalt Production Facility
In December 2009, the Company and the United States Department of Agriculture Forest Service signed the “Forest Service Evaluation” which approved and finalized the Company’s Mine Plan of Operations for the ICP. The approval and finalization of the Company’s Mine Plan of Operations allowed the Company to commence Stage I Construction on the ICP Mine Site which consisted of timber clearing for the crusher and concentrator site, tailings and waste rock storage facility, topsoil stock pile area and road areas around the mill site. This was completed in the first quarter of the 2011 fiscal year. Additional approvals such as agreements on bonding continue to be negotiated. On June 17, 2011, the Company signed a Services Agreement with JDS for Project and Construction Management services for the ICP. JDS is working on a target based project risk/reward basis that includes an on-budget, on schedule and no harm execution accountability. Project development includes comprehensive overall project design and execution review to enhance the ICP (now completed), detailed design, procurement and contract execution and construction management through to commissioning and handover. Upon the successful conclusion of mine financing and completion of construction, the Company plans to use a mining contractor for the preproduction mine development and the first two years of mine production. Mine equipment will be required starting in Year 3 to continue development and to mine the stopes. According to the Company’s independent Technical Report completed in 2007, the amount of financing required to complete the ICP construction was estimated to be US$138.7 million. This figure did not include the post reclamation financial assurance (bonds) for both surface disturbance reclamation and long-term water treatment. More recent internal estimates by management in coordination with JDS places the estimated forecast at completion for construction and commissioning of the ICP at US$155,334,770 less cost to date, which takes into account the bonding requirements and additional facilities to increase precious metals recovery, and to increase autoclave leach capacity by 51%. This new cost estimation consists of US$93,318,852 for the mine concentrator, infrastructure and bonding, and US$62,015,913 for the retrofitting of the hydrometallurgical plant. These costs include mechanical and electrical equipment, construction materials, labor, labor supervision and contracted direct and indirect costs for these facilities. As at May 31, 2013 the Company spent $56,701,323 on the ICP. Of that, $202,972 was spent during the three months period ended May 31, 2013 (February 28, 2013- $13,176,084). Included in amounts spent to date, $16,498,912 previously spent on long lead items are not included in the current budget. Total to complete the project net of cost spent is currently estimated to be US$118,310,674. Since completion of the 2007 Technical Report, the Mine Plan has been re-engineered and optimized to maximize the extraction of the highest grade ore material in the shortest possible time frame in order to provide an optimized cash flow scenario in the early years of mine life. This resulted in a re-positioning of the portal bench and other engineering modifications associated with this re-positioning. This has not materially changed capital costs and is expected to assist in streamlining future mine operations. Review and optimization of the ICP Mine Site and the CPF is an ongoing process that incorporates new technology, new concepts, improved logistics and changing conditions. The approval of the Mine Plan of Operations for the ICP by the U.S. Forest Service outlines a 5-stage approach for posting the bonds that is coordinated with the development and operation of the ICP. Stages I and II pertain to all surface disturbance activities including Phase I of the tailings and waste rock storage facility expansion schedule (operational years approximately 1-6). The total bond requirement for Stages I and II is approximately US$6,379,617. To date, US$2,232,000 in cash was posted to secure a reclamation surety bond in the amount of approximately US$6,379,617, in conjunction with the commencement of Stage II Construction. Prior to the decision to defer mine financing and construction, mine development efforts concentrated on accomplishing time critical tasks of Stage II construction to prepare the ICP Mine Site for underground development and winterization of the construction site. These tasks included access road upgrades, portal bench construction and the preparation of the TWSF to accept waste rock from underground development. Underground excavation to the ore face will commence once the time critical construction tasks are completed and final mine finance is secured. The building of the required processing facilities such as the mill, concentrator and water treatment plant are expected to begin concurrently with underground development.

9
Initial production is expected to begin between 9 and 14 months from the commencement of underground development. Other tasks accomplished include the following:
(i) Modular administration offices were mobilized and assembled for permanent use at the mine site;
(ii) Construction of a new haul road resulted in eliminating the need to use the portion of Bucktail Road on the neighbouring property and shortening the haul distance from the portal bench by approximately two miles. This is expected to result in additional savings in mining costs and may eliminate the need to utilize an aerial tram system to haul ore and waste.;
(iii) Concurrent with the above roadwork, the installation of several extensive guardrails and berms on roads and gates to restricted areas were completed. These measures were implemented to reduce road maintenance and enhance the safety of the mine workers;
(iv) Placement of new surfacing material on all new and existing roads was conducted. In collaboration with the United States Department of Agriculture Forest Service and Lemhi County, maintenance of the transportation route to the project site was also conducted. This included blading, watering and rolling of approximately 10 miles of surface on Williams Creek Road for safety and road surface protection purposes;
(v) Drilling of water capture and monitoring wells was initiated and the installation of all monitoring wells required on the mine site and capture wells offsite was completed;
(vi) Excavation and sub-grade preparation and installation of the foundation-drain piping of the south half of the TWSF and the installation of a portion of the liners in the south half the TWSF was completed;
(vii) Excavation and sub-grade preparation of the WMP and the septic system drain field excavation was completed;
(viii) Installation of pipeline from Portal Bench to Big Deer Creek for treated water discharge, including the in-stream diffuser, air release valves and reclamation seeding and mulching of the completed right of way was conducted;
(ix) Construction on the portal access road, TWSF haul road, soil stockpile road and the WMP access road was completed; and
(x) Repairing of the 7900 level surface water diversion ditch and the installation of a security gate at the property boundary on the Big Flat area was completed.
Prior to the decision to defer mine financing, in addition to physical earthworks and other construction efforts, the Company’s development team of operations, process and outsourced engineers continued mine optimization studies. These studies were developed to demonstrate additional economic potential outside of the scope of the Bankable Feasibility Study, primarily for mine financing purposes. Construction efforts at the mine site will continue upon the successful conclusion of mine financing. Prior to and during the first fiscal quarter of 2013, JDS concentrated its efforts on finalizing budgets and engineering and procurement tasks involving several areas at the CPF. Engineering emphasis continued on flow sheet development and refinements to the heat and water balances and equipment layout specifications for the CPF were undertaken. The planned stand-alone CPF building and the adjacent existing refinery building collectively comprise the Complex. At the CPF, additional concrete construction began in July of 2012 and was completed in August 2012. This work concentrated on the foundations for the cobalt electrowinning cells, crane structures, and constructing the oxygen tank pad. Engineering and construction efforts at the refinery focused on the development of the P&ID’s and GA drawings at the CPF. In addition, modifications of the silver refinery progressed to accommodate the requisite modifications for third party copper / silver concentrates as well as cobalt concentrates from the ICP Mine Site. However internal studies concluded that a standalone facility would be better suited to process concentrate from the ICP Mine Site rather than a retro-fit of the existing Complex. P&ID’s show the connectivity of equipment, sensors, and valves in a control system. P&ID’s also provide the basis for the conceptual layout of the CPF. Other tasks accomplished include the following:
(i) The PHA of CPF designs were initiated;
(ii) Design of the Leach Residue Repository facility progressed, with the water management area were surveyed, and information on geo-tube layout design was received from one of the Company’s engineering consultants. Geo-tube requests for proposals were released to determine the recommended vendor;
(iii) The budget support documentation was reviewed and project execution strategy was conducted as part of ICP finance due diligence;
(iv) The cobalt electrowinning cells were placed on the CPF foundation beams and covered for the winter;
(v) An engineering schedule for completion of P&ID review and GA drawings was prepared;
(vi) A review of P&ID & Control Philosophy by the Company was initiated. Over half of P&ID’s and their related sections of control philosophy were finalized; and
10
Several photos have been posted on the Company's website documenting the above work and can be viewed at http://www.formationmetals.com/s/ConstructionGallery.asp. In addition, video updates of construction progress at both the mine site and at the refinery have been posted on the Company’s website at http://www.formationmetals.com/s/Presentations.asp documenting the work completed to date. Stage III Construction includes posting the bond for long-term water treatment prior to mine development below the water table. The amount of the Stage III bond was previously determined by the Forest Service at approximately US$20.60 million; however, the Company successfully appealed this decision and is working with the Forest Service to determine the appropriate discount rate for use in calculating the bond for Stage III Construction. Stage IV and Stage V Construction correspond with Phases II and III of the TWSF expansion schedule (operational years approximately 7-10) and amount to approximately US$1.90 million, and US$0.80 million, respectively. As a result of discussions with insurance brokers, the Company anticipates the actual cost for surface disturbance bonding will be approximately US$2.40 million. The long-term water treatment bonding will be determined when discount rate discussions with the Forest Service are concluded. Long lead time items that have not already been delivered to the mine site, are currently being stored in a company owned facility and in a nearby leased storage facility outside of the town of Salmon, Idaho. The 9,600 square foot company owned facility is located on a 3 acre lot on the outskirts of town. The facility will also act as a staging area for the transportation of mine employees to and from the mine site, as well as an offloading area for mine concentrate to be transported to the CPF. Mine equipment stored at the staging areas include ball mill components, flotation cells, power transformer, bridge crane, vibratory feeders, crusher and concentrator building components, the cyclone package, the aerial tram towers, cables, drive system, bucket and tram loading and discharge terminals. The equipment is for the processing of primary cobalt ore at a production rate of 800 tons per day at the cobalt mine site. Concentrate from the mine will be shipped to the CPF for processing into high purity, superalloy grade cobalt metal at a design rate of approximately 1,500 tons per year on average over a minimum 10 year mine life. The mine life is expected to be longer than the minimum ten years outlined in the Technical Report, as the primary deposit remains open along both strike directions and at depth. Including inferred resources would add an additional 4 years to the mine life. In addition, numerous other targets remain to be explored and developed on the property. To date, none of these additional resources or extensions of mine life have been verified through any studies or reports that are National Instrument 43-101 compliant. Several engineering companies were engaged and worked on finalizing different aspects of the engineering plans for the mine and the cobalt production facility. This included engineering work on site, roads, portal bench, tram layout revisions, power line layout, tailings and waste rock storage facility final design and concentrator site layout and design. Once construction of the ICP reaches a critical stage, an intensive hiring program will be involved for both the Mine Site and the CPF locations and includes professional recruitment campaigns for more senior positions and advertising with employment agencies and / or employment websites for staff positions. There is a local qualified workforce in both the Salmon and Kellogg areas to draw from and we expect to fill our labour needs without serious difficulty. Contingent upon financing of the construction of the ICP, the Company intends to continue ICP construction personnel hiring resulting in a total of 52 employees for the Salmon operation and an additional 41 employees for the Kellogg facility, totalling 93 new jobs in Lemhi and Shoshone Counties, Idaho. It is estimated that an additional 49 miners would be employed by a contract miner. These jobs are expected to have a positive impact on both local economies. If made operational in the near term, the ICP is expected to be the only primary cobalt producer in the Western Hemisphere, making Formation Metals Inc. the United States’ sole integrated cobalt miner and refiner of high purity, superalloy grade cobalt.
Once in full production, the project would create approximately 200 well-paying jobs in two Idaho counties.
Impairment Analysis
In order to assess the recoverability of the non-current assets recorded as part of the ICP, management has estimated the after tax future cash flows of the ICP and compared these results to the carrying value of the ICP. The after-tax cash flows have been determined based on the estimated life of mine and dates for operational commencement, production levels at current estimates of proven and probable reserves and inferred resources, future operating costs, non-expansionary capital expenditures and most significantly estimated metal selling prices for Cobalt. The projected cash flows are significantly affected by changes in assumptions of metal prices, future capital expenditures, production cost estimates, construction completion timelines and discount rates. Metal prices are estimated based on historical price volatility ranges. For their assessment as at the year-ended February 28, 2013, management used an estimated price assumption of US$19.83 per lb. for high purity cobalt (“HPC”) which is based on historical twenty year average price. HPC trades at a premium with greater expected demand than cobalt of lesser purity. The reasons are due primarily to this select class of material being the most difficult to produce, is not affected by African production, increase in demand in the super-alloy sector, a lack of substitution for premium material, and only a limited number of producers fall within this cobalt subsector. The ability to increase supply to meet demand growth is very limited. More information on HPC can be found in the section “1.2.6 Outlook”, under the subheading “High Purity Cobalt Market”.

11
Cash flow projections are discounted at a rate of 8.24% which represents management best estimate of its weighted average cost of capital. Management also estimated the time for commercial production at the mine to be one year from balance sheet date of February 28, 2013, pending successful financing. A decrease of 6.75% in cobalt pricing assumptions made by management, by itself, could have an adverse impact on the estimated recoverable amount of the project.
(b) Big Creek Hydrometallurgical Complex (the “Complex”) – Idaho, USA
The Company acquired the Complex in 2002 for the purpose of retrofitting the hydrometallurgical facility for cobalt production to meet the processing requirements of the ICP. In 2004, management restarted the precious metals refining section of the facility, known as the Sunshine Refinery, to help meet increasing North American demand for silver and gold refining. The Company’s Sunshine Refinery and SX-EW are located at the Complex. The SX-EW is a facility that can be shared by both the Sunshine Refinery and the CPF; however internal studies conducted in 2012 concluded that a standalone CPF would be better suited to process concentrate from the ICP Mine Site rather than a retro-fit of the existing Complex. The standalone CPF can be relocated within the general vicinity where the Company holds an additional 16 acres of industrial zoned private land. This also affords the opportunity for management to consider the relocation of the standalone facility to a location closer to the ICP Minesite, and/or a railhead, which would have a positive impact on future operational expenditures for the ICP. On March 29, 2012 the Company announced that after significant analysis, it would install a new autoclave in the CPF in lieu of modifying the existing autoclaves to process cobalt. This decision effectively separated the existing refinery operations from the proposed CPF and allows the existing autoclaves to be used to process third party precious and base metals concentrates. The Company proceeded to obtain expressions of interest letters, contracts, and testing of various materials from customers and potential customers. However, the Company determined that the successful development of that business will require substantial capital expenditures, sufficient working capital, a hedging program and the ability to provide provisional payments. Current unprecedented market turmoil has made it unlikely that the Company will obtain these capital requirements in the near future.
The Company announced on June 6, 2013 that it had entered the Letter Agreement to sell, for US$9.0 million in cash, 100% of the Refinery Assets to Waterton. The sale was subject to, among other things, confirmatory due diligence, the execution of a definitive acquisition agreement by June 20, 2013, unless mutually extended, and any required regulatory approvals. In addition, the Letter Agreement included an exclusivity provision in respect of the Company until its termination and required the Company to pay Waterton a break fee of US$1.0 million and a portion of Waterton’s costs in certain circumstances. Cormark Securities Inc. was engaged to provide a fairness opinion on the transaction.
On June 26, 2013, the Company announced that it had terminated the proposed sale of the Refinery Assets to Waterton, and on July 5, 2013 the Company announced the execution a full and final mutual release with Waterton in respect of the Letter Agreement and the payment to Waterton of a break fee of US$1.0 million.
The Sunshine Refinery continues to receive product from customers and the Company is continuing its efforts to expand this division of the business. The refinery is a zero liquid discharge operation and as such the Company ascertained through consultation with legal counsel and environmental experts that there are no legal requirements related to reclamation of real property upon any sale, temporary shut down or closure of the refinery.
The Company’s refinery operations currently generate revenue from both toll material and purchased material. The Company’s principal objective is to generate revenue from toll material; however, given the value of the precious metals being refined, credit conditions have on occasion required the Company to purchase the material from customers. Toll material fees vary by customer and can consist of straight fees and/or “retainage”, (the retention of some of the refined product). Purchased material generally has a similar value attributed to the refining process as toll but requires the recognition of the sale at the gross value in accordance with generally accepted accounting principles. From time to time the Company enters into forward sale contracts in those situations where it does purchase material to eliminate exposure to silver and gold price fluctuations. The Sunshine Refinery has been receiving silver doré from major silver producers, high grade silver products from silver users, mints and from other sources. On April 30, 2012, the Company’s Sunshine Refinery became an Approved Refiner and Brand on the official list of the COMEX (Commodity Exchange, Inc, a designated contract market of the CME Group Inc).
(c) Black Pine – Idaho, USA
The Company has a 100% interest in certain mineral claims with prospects for copper, cobalt and gold located in Lemhi County, Idaho. An option agreement is in effect until the year 2014 to share on a 50/50 basis with the option or any payments received from a joint venture partner.
(d) Badger Basin – Idaho, USA
The Company has a 100% interest in certain mineral claims acquired through staking with prospects for copper and cobalt located in Lemhi County, Idaho.
(e) Morning Glory – Idaho, USA
The Company has a 100% interest in certain mineral claims with prospects for gold and silver located in Lemhi County, Idaho. The Company also has a 100% lease option on certain additional mineral claims located in the same area. A total of

12
US$45,900 has been paid to date to the option or. To exercise the option, the Company must pay a total purchase price of US$1,000,000 including the advance annual minimum royalty payments. During fiscal 2013, the option and mineral claims were maintained in good standing. Confidentiality Agreements have been signed with parties interested in a possible joint venture.
(f) Queen of the Hills – Idaho, USA
The Company holds a lease option to purchase 100% of certain mineral claims with prospects for gold and silver located in Lemhi County, Idaho. A total of US$25,200 (2011 - US$25,200) has been paid to date to the option or. Total purchase price of US$1,000,000 including advance payments must be made to exercise the option. During the fiscal year ended February 28, 2013, the option and mineral claims were maintained in good standing. Confidentiality Agreements have been signed with parties interested in a possible joint venture.
(g) Wallace Creek – Idaho, USA
The Company has a 100% interest in certain mineral claims with prospects for gold and silver located in Lemhi County, Idaho. The Company also has a 100% lease option on certain additional mineral claims located in the same area. To exercise the option, the Company must pay a total purchase price of US$1,000,000 of which US$25,600 has been paid to date.
(h) El Milagro – Mexico
The Company entered into a purchase option agreement in 1998 that was completed at year end February 28, 2003. The Company now has a 100% interest in the prospective silver rich base metal property. The primary target defined within the Milagro Concessions is the Santa Maria Vein, a 1-4 meter wide tabular subvertical NNE trending breccias vein that has been mapped over a strike length of 450 meters, with a lead-rich polymetallic assemblage and bonanza silver grades. This vein, localized along the footwall contact of a sericite altered dike, is cemented by a fine grained intergrowth of galena, sphalerite, pyrite, barite and manganese oxides. Silver grades in the sulphitic vein material have been reported in the range of 1.5 to 5.5 kg per tonne (Tschauder, 1988). It has been reported to the Company that the Mexican Government intends to establish a Protected National Area in the general area that encompasses the Milagro project. The Company has been advised by its legal counsel that this new designation will involve additional environmental analysis by Mexican permitting authorities, but in no way precludes the exploration, development and mining of minerals from the property. The permitting of the project is not expected to be any more onerous than what the Company’s internal environmental standards and guidelines require and what it has already experienced and is familiar with during the exploration and development of its other mineral projects. The Company intends to further evaluate the mineral occurrences on the property and define targets for further development. Previously, the Company embarked on a strategic land acquisition program that has complemented the existing core land holdings of the El Milagro project. These additional holdings cover the extension of the Santa Maria Vein occurrence and it is management’s intention to further pursue exploration of this project once additional financial and personnel resources become available or through joint venture or other such partnerships. Subsequent to the end of the three months period ended May 31, 2013, a Confidentiality Agreement has been signed by a third party expressing possible interest in joint venturing the property.
(i) Kernaghan Lake / Bell – Saskatchewan, Canada
The Company granted an option whereby the optionee has earned 80% interest in certain mineral claims by making certain payments (received), and completing exploration work totaling $1,000,000 (deemed completed). The project area is located near the northeast rim of the Athabasca Basin approximately 42 km north of Points North Landing. The Kernaghan / Bell project currently consists of 13 mineral claims totaling 4,342 hectares. The target unconformity depth ranges from 160m to 290m. To date 38 diamond drill holes within the property outline totaling 10,051.4m have been drilled targeting the unconformity. The completed drilling for the 2009 program consisted of 8 drill holes, KB04 through KB11, totaling 2,683.4m. Geochemical analyses were received for basement systematic and selective samples collected for drill holes KB-04 to KB-11. These samples returned anomalous uranium intersections with a maximum partial uranium value returned from Ker A Conductor in drill hole KB-11 of 160 ppm and a maximum partial uranium value returned from K 1 Conductor in drill hole KB-07 of 34.2 ppm, none of the holes drilled in 2009 intersected significant uranium mineralization. A Geochemical Compilation Report was sent out to joint venture partners and filed for assessment credit. Approval of the assessment filing will keep the project land in good standing until 2017. There wasn’t a proposed budget for field work for the current period.
(j) Virgin River – Saskatchewan, Canada
In the year ended February 28, 1999, the Company entered into a joint exploration agreement with UEM Inc. UEM Inc. was a corporation owned 50% by Cameco Corporation ("Cameco") and 50% by AREVA on the Virgin River project located in the Athabasca Basin of northern Saskatchewan. Subsequently, UEM was dissolved and both Cameco and AREVA became equal partners (49% each) in the joint exploration agreement. Cameco is the operator of the project. The Company's wholly owned subsidiary, Coronation Mines Ltd. owns the remaining 2% of the project with the first right of offer to acquire up to 10% of the project and has been carried through to $10.0 million worth of exploration and development (vetted). As at February 28, 2013,

13
over $32.0 million has been spent on the project exploring for a large unconformity-type deposit that has resulted in the discovery of the Centennial Deposit. Cameco is the operator of the project. The Centennial Deposit was traced over 650 metres of strike length and has a minimum across strike width ranging from 10.0 metres to 52.5 metres. Approximately $14.0 million was reported by Cameco as having been spent on the 2009 - 2012 drill programs that were designed to follow up on the 2004 - 2008 drill results from the Centennial Zone. The joint venture approved a budget of $2.15 million for continued drilling on the Virgin River project for calendar 2012. The 2012 drill program concentrated on the evaluation of the off-conductor mineralization intersected in drill hole DDH VR-051 and evaluated the conductor responses from a proposed geophysical survey between L21N and L33N located to the north of the deposit. Several tests were also dedicated to upgrading mineralization on the Centennial Deposit by assessing the cross structural influence on uranium mineralization within the deposit. High grade U3O8 intersections of up to 298 GT have been intersected within the Centennial Deposit (33.9 metres grading 8.78% U3O8 -- see Company News release dated May 30, 2011). GT is defined as % grade U3O8 multiplied by thickness in metres. Assay results returned from diamond drill programs from 2004 to 2011 on the Centennial deposit have resulted in 39 significant primary uranium intersections returning results greater than 10.0 GT. Results from the 2011 drill program were discussed in the Company's news release dated January 12, 2012 with final results of the program released during the quarter ended May 31, 2012 in the Company’s news release dated April 4, 2012. All drill holes completed on or immediately surrounding the Centennial Deposit in 2011 displayed uranium enrichment throughout the basal sandstone in contact with the basement unconformity with elevated pathfinder elements such as lead, vanadium and nickel. Significant high grade uranium intercepts were intersected in 7 of the drill holes with GT's over 10. Diamond drill programs from 2004 to 2012 on the Centennial Zone have resulted in 39 significant primary uranium intersections returning results greater than 10.0 GT. Drilling during the 2012 program consisted of 6 diamond drill holes which included 4 pilot holes and 2 wedge holes, VR-051W1, 51W2, 52, 53, 54 and 55, totaling 4,487.9 m. These holes were drilled to evaluate a quartzite fault north of the Centennial Zone, and to investigate the geophysical conductors known as C1 and CF. Final assay results are pending as at the date of this report. Plans for the 2013 program are concentrated on environmental studies focused on the indigenous Woodland Caribou population, an evaluation of a permanent overland road to the Centennial Deposit for year round exploration and development access and the compilation of existing data to prepare the project area for renewed exploration activities in 2015 and beyond with a proposed 2013 budget of $450,000. Drilling was not planned for the fiscal year ended February 28, 2013.

14
Significant diamond drill results greater than 10.0 GT from the Centennial Deposit From 2004 - 2011:
Note: Inductively Coupled Plasma - Optical Emission Spectroscopy Split assay results with core recovery intervals of less than 75% were replaced by shielded probe results.
Cameco has indicated they are exploring for a McArthur River style uranium deposit, and the Company’s management is very encouraged with results to date. All uranium assays were carried out by the Saskatchewan Research Council (SRC) of Saskatoon, Saskatchewan. Delayed neutron counting (DNC) and / or X-ray fluorescence spectroscopy (XRF) U3O8 check assays were completed on all split assay samples returning greater than 1.0% U3O8. The average of the check assays and the ICP-OES results were used in the calculations of grade thicknesses. Mr. Eric (Rick) Honsinger, P.Geo., of Formation Metals Inc., is the Qualified Person who has reviewed and approved the information in this MD&A with respect to the Virgin River Project based on an examination of the data submitted to the Company by the project operator Cameco Corporation.

15
(k) Other Projects
The Company has varying other interests of up to 100% in certain mineral claims located in Idaho, Saskatchewan and Manitoba.
1.2.6 Outlook
Over the course of the next several months the Company expects to focus its activities on assessing the world financial markets for the opportunity to have a successful conclusion of ICP financing and recommencing the final Stages of construction of the ICP. The continued rise in cobalt prices from their lows in late 2012 are expected to assist in ICP financing efforts. In addition, any proceeds from a potential sale of the refinery will be used to enhance the Company’s working capital and allow for access to capital to further develop the Company’s assets and to take advantage of potential opportunities that may arise. Potential financing alternatives include bank debt financing, securing strategic partnerships, securing off-take, securing streaming arrangements for future by-product copper and gold production at the ICP, securing a high yield debt facility and/or other means deemed reasonable by management including joint ventures. The Company will also continue to seek opportunities to form additional exploration joint ventures in order to reduce shareholder risk. As a mineral exploration and development company, until such time as construction of the ICP re-commences, the future liquidity of the Company is expected to be affected principally by the level of exploration and development expenditures and by its ability to raise capital in the equity markets. The Company’s current cash position is not sufficient to fund construction of the ICP Mine Site and the CPF. During the three months ended May 31, 2013, the Company’s shares, trading on the TSX under the symbol FCO, attained a high of $0.23 in early March 2013 and reached a low of $0.06 in mid June 2013. Similarly, the Company’s warrants trading on the TSX under the symbol FCO.WT, sustained a low of $0.005 during the same period where they remain today. Prevailing weak and uncertain financial markets resulting from the European Union’s unresolved financial crisis, the weak economic recovery of the United States and a decline in a demand for commodities, particularly in Asia, continue to severely affect the resource sector and its ability to finance mining projects. The commodities and resource sector in general continued to decline to unprecedented levels. Following the Company’s May 2, 2013 announcement of the deferral of underground development for the ICP, the stock traded down to a historic low of $0.06 representing a market capitalization discounting the Company’s cash position. Figure 1: Formation Metals’ Share Price, March 1, 2013 – July 15, 2013
Outlook for the Cobalt Market
Cobalt markets have been less turbulent than in previous years. High purity cobalt rose to nearly US$52.00 per lb. in early 2008 and subsequently fell to a low of approximately US$17.00 per lb. During 2010 cobalt prices near the beginning of the year were around US$24.00 per lb., and subsequently softened to around US$19.50 per lb. in March 2010 then rose to close to US$25.00 per lb. in April 2010. Average prices then remained in a narrow trading range between US$21.00 per lb. and US$22.00 per lb. until late in 2010. Average prices for 99.8% purity cobalt during 2011 have traded in a range between US$15.50 and US$21.00 per lb. During the first nine months of 2012 high purity cobalt prices traded in a narrow range between US$12.00 and US$16.50 per lb. Prices softened during the last three months of 2012 to a multi-year low of between $10.20 and $11.80 per lb. (MetalBulletin)

16
January 8, 2013. Prices started to recover early in 2013 and market analysts are now forecasting higher prices. Current cobalt prices for good grade metal are in the US$15.00 to $15.50 per lb. range. The 2008-2009 crises in the financial markets had a significant effect throughout the world however most published analysts, including Metal Bulletin.com quoting CRU, (May 2012) believe that the remaining effects should only impact markets in the short term. The mid to long term outlook for the high purity cobalt market is expected to remain strong through 2015 and beyond with demand for all types of cobalt (including treatment of intermediates, and recycled scrap) by some market participants projected to exceed 100,000 tonnes by 2015 (Street Authority, October 2012,). The Japanese earthquake and tsunami of March 11, 2011, have slowed some cobalt end markets especially those related to the rechargeable battery and automotive sectors, however the impacts are not expected to be long lasting. Changes to some production facilities have occurred due to these events with production being moved from Japan to other jurisdictions. Recent sovereign debt concerns in Europe have had an impact on projected economic growth rates but it is not yet possible to determine if any significant long term impacts to metal markets will occur. There is also growing uncertainty on the strength of the economy in China. Trade publications such as Metal-Pages.com regularly report that numerous Chinese cobalt processors are losing money at current prices and are plagued by high operating costs. A partial restructuring in the Chinese cobalt market is a certainty according to market participants such as Beijing Antaike Information Development Company (CDI Presentation, May 2012). They also said that if low prices continue a major restructuring could be necessary. Current overall cobalt prices appear to be close to an unsustainable low price with significant closures and cut-backs occurring, particularly in China. Numerous refiners and processors in China have been complaining that they can’t make money at present prices. Market analysts have been calling for a major restructuring of the Chinese cobalt industry due to too many players and too high production costs. Metal Bulletin published a news commentary in May 2013 that speculated that a significant amount of China’s cobalt processing industry is uneconomic and has no future. In spite of a robust 20 year massive expansion of cobalt processing facilities from less than 1,000 tonnes per year to over 35,000 tonnes per year, because very few of the cobalt processors are also producers of the raw cobalt units, Metal Bulletin believes that much of the business will not survive. The forecast mentioned above does appear to be happening and should result in an improving metal price once this turbulence has past. MetalBulletin reported on January 8, 2013 that production of cobalt was 5% lower during 2012 than 2011 and that prices were expected to rise in the future. The Cobalt Development Institute (CDI) estimates, from the companies that report to them, that refined cobalt production for 2011 was approximately 82,247 tonnes; however, these estimates do not include production of refined cobalt from CDI non-reporting companies treating various cobalt-containing intermediate products and scrap. The CDI estimates that during 2011, Chinese refined production was at 34,969 tonnes which is down by 960 tonnes (or -3.4%). This was the first decline since the CDI records began for China in 1994. The CDI also estimates that during 2011, global apparent consumption was around 75,000 tonnes, which is an increase over 2010 of approximately 15%. During Q1 2012, the London Metal Exchange (LME) announced that trading in the listed cobalt contract was surging to new records. Volumes were up 86% in Q1 2012 compared with the corresponding period in 2011. The LME has announced that in August 2012, 1,871 lots of cobalt were traded on the LME, nearly six times the level traded in August 2011. They also announced that in September 2012, 1,759 lots were traded which is more than double the same month last year. There is significant potential of new cobalt production that could come from the Democratic Republic of Congo (“DRC”) and var ious nickel laterite projects; however, many of the nickel laterite projects have been delayed, have suffered massive cost over-runs or have been placed on hold. Many analysts in the industry still have concerns about the viability and reliability of the new nickel laterite projects. The recent low nickel price is also adding to uncertainty within the nickel industry. In addition, the bulk of this possible new production will be in the form of mixed sulfide concentrate, impure cobalt chemicals and low-mid grade metal that will, in many cases, require additional processing. Very little, if any, of this potential new production is expected to be in the form of high purity cobalt metal, which is the second fastest growing sector after batteries. Recent elections in the DRC have been contested by opposition parties and condemned by numerous international observers as being corrupt. Political instability appears to be increasing as a result. A new group of rebel fighters now renamed M 23 has been increasing in power and getting larger. News accounts of this rebel group have been widely reported in the international media. Fighting has also recently been reported in the copper-cobalt producing region of the DRC, called Katanga. As has happened in the past, any sustained fighting within the DRC could significantly impact metal production and could damage or destroy production facilities. The DRC government also recently announced that it will institute a ban on the export of raw cobalt units and intermediates that have moisture content above 25% (such as cobalt hydroxide). This ban has apparently been modified to a tax increase up to $100 per tonne of concentrate and been deferred until the end of 2013 (Metal-Pages, July 2013). Transportation disruptions have also occurred at the border between Zambia and the DRC according to numerous news reports. In recent years, there has been significant cost pressure in the production of cobalt with CRU Strategies (UK) in past years projecting that “long run marginal costs” would soon be exceeding US$14.00 per lb. Projected increased consumption is due primarily to growing demands in the aerospace, catalyst and rechargeable battery sectors. This is spurred on, in large part, despite the world financial crisis, by the rapid modernization and GDP growth of China and India, utilization of new energy sources and new environmental considerations such as the widespread adoption of hybrid electric vehicles, adoption of land based turbine electrical power generation from natural gas, and a desire for more fuel efficient aircraft engines. Several potential new cobalt applications were announced over the course of the previous year, including some exciting potential uses to advance solar energy viability and reduce current costs. A new potential application of cobalt replacing platinum in fuel cells could significantly reduce costs in this emerging technology. Figure 2 below outlines cobalt consumption by sector for 2011.
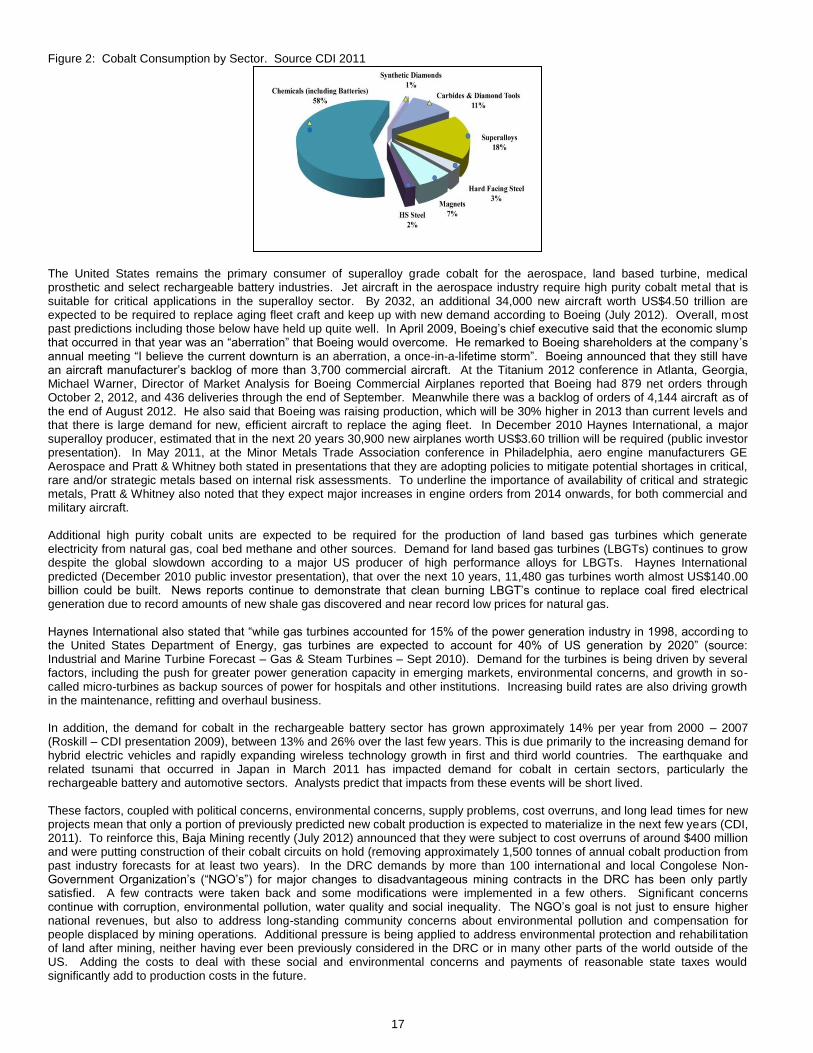
17
Figure 2: Cobalt Consumption by Sector. Source CDI 2011
The United States remains the primary consumer of superalloy grade cobalt for the aerospace, land based turbine, medical prosthetic and select rechargeable battery industries. Jet aircraft in the aerospace industry require high purity cobalt metal that is suitable for critical applications in the superalloy sector. By 2032, an additional 34,000 new aircraft worth US$4.50 trillion are expected to be required to replace aging fleet craft and keep up with new demand according to Boeing (July 2012). Overall, most past predictions including those below have held up quite well. In April 2009, Boeing’s chief executive said that the economic slump that occurred in that year was an “aberration” that Boeing would overcome. He remarked to Boeing shareholders at the company’s annual meeting “I believe the current downturn is an aberration, a once-in-a-lifetime storm”. Boeing announced that they still have an aircraft manufacturer’s backlog of more than 3,700 commercial aircraft. At the Titanium 2012 conference in Atlanta, Georgia, Michael Warner, Director of Market Analysis for Boeing Commercial Airplanes reported that Boeing had 879 net orders through October 2, 2012, and 436 deliveries through the end of September. Meanwhile there was a backlog of orders of 4,144 aircraft as of the end of August 2012. He also said that Boeing was raising production, which will be 30% higher in 2013 than current levels and that there is large demand for new, efficient aircraft to replace the aging fleet. In December 2010 Haynes International, a major superalloy producer, estimated that in the next 20 years 30,900 new airplanes worth US$3.60 trillion will be required (public investor presentation). In May 2011, at the Minor Metals Trade Association conference in Philadelphia, aero engine manufacturers GE Aerospace and Pratt & Whitney both stated in presentations that they are adopting policies to mitigate potential shortages in critical, rare and/or strategic metals based on internal risk assessments. To underline the importance of availability of critical and strategic metals, Pratt & Whitney also noted that they expect major increases in engine orders from 2014 onwards, for both commercial and military aircraft. Additional high purity cobalt units are expected to be required for the production of land based gas turbines which generate electricity from natural gas, coal bed methane and other sources. Demand for land based gas turbines (LBGTs) continues to grow despite the global slowdown according to a major US producer of high performance alloys for LBGTs. Haynes International predicted (December 2010 public investor presentation), that over the next 10 years, 11,480 gas turbines worth almost US$140.00 billion could be built. News reports continue to demonstrate that clean burning LBGT’s continue to replace coal fired electr ical generation due to record amounts of new shale gas discovered and near record low prices for natural gas. Haynes International also stated that “while gas turbines accounted for 15% of the power generation industry in 1998, according to the United States Department of Energy, gas turbines are expected to account for 40% of US generation by 2020” (source: Industrial and Marine Turbine Forecast – Gas & Steam Turbines – Sept 2010). Demand for the turbines is being driven by several factors, including the push for greater power generation capacity in emerging markets, environmental concerns, and growth in so-called micro-turbines as backup sources of power for hospitals and other institutions. Increasing build rates are also driving growth in the maintenance, refitting and overhaul business. In addition, the demand for cobalt in the rechargeable battery sector has grown approximately 14% per year from 2000 – 2007 (Roskill – CDI presentation 2009), between 13% and 26% over the last few years. This is due primarily to the increasing demand for hybrid electric vehicles and rapidly expanding wireless technology growth in first and third world countries. The earthquake and related tsunami that occurred in Japan in March 2011 has impacted demand for cobalt in certain sectors, particularly the rechargeable battery and automotive sectors. Analysts predict that impacts from these events will be short lived. These factors, coupled with political concerns, environmental concerns, supply problems, cost overruns, and long lead times for new projects mean that only a portion of previously predicted new cobalt production is expected to materialize in the next few years (CDI, 2011). To reinforce this, Baja Mining recently (July 2012) announced that they were subject to cost overruns of around $400 million and were putting construction of their cobalt circuits on hold (removing approximately 1,500 tonnes of annual cobalt production from past industry forecasts for at least two years). In the DRC demands by more than 100 international and local Congolese Non-Government Organization’s (“NGO’s”) for major changes to disadvantageous mining contracts in the DRC has been only partly satisfied. A few contracts were taken back and some modifications were implemented in a few others. Significant concerns continue with corruption, environmental pollution, water quality and social inequality. The NGO’s goal is not just to ensure higher national revenues, but also to address long-standing community concerns about environmental pollution and compensation for people displaced by mining operations. Additional pressure is being applied to address environmental protection and rehabili tation of land after mining, neither having ever been previously considered in the DRC or in many other parts of the world outside of the US. Adding the costs to deal with these social and environmental concerns and payments of reasonable state taxes would significantly add to production costs in the future.

18
Future resource nationalization and royalty issues could also have an increasing effect on new potential production as almost half of the world’s cobalt reserves and resources are in the DRC. In mid April 2010, the DRC implemented new laws to restrict the export of concentrates and intermediate cobalt and copper products. This initial ban was not upheld. A new ban was again announced in March 2013 and the government has provided exporters 90 days to comply. It was announced in July, 2013 that the ban was deferred until year end and a tax increase to $100 per tonne of concentrate will be imposed on concentrate exports, apparently due to a lack of available power. If this holds, then large amounts of new capital will be required to transform these cobalt units into finished end products for export. One major obstacle is a lack of power and skilled personnel. Recent published estimates have China importing over 35,000 tonnes per year of cobalt units contained within these concentrates and intermediate cobalt products. If this or a similar export ban in the future holds, China will need to have all of these cobalt and copper units processed in the DRC before the units can be exported. As discussed above, recent elections in the DRC have been widely criticized; as more than one person is claiming to be the legitimate President. New armed groups have formed and even more of a concern is that one group is forming in the region from which most copper and cobalt production occurs. The long term average price of cobalt from 1980 to 2011, (in 2011 dollars) was over US$22.00 per lb.. Management believes that this figure represents a conservative view of future cobalt prices. In addition, long term cobalt–copper and cobalt–nickel ratios are at anomalously low historical ratios, something that is unlikely to continue into the future. These ratios indicate that either both nickel and copper are historically overpriced or that cobalt is significantly historically under-priced. Potential for cobalt prices, especially high purity metal, to return to new highs is considered likely by some market followers, especially with either political instability in the DRC and/or responsible environmental, social and post mining reclamation policies (including real cost bonding) being put into place within the DRC and other third world countries with cobalt production. For reference on historical and present cobalt prices see Figure 3. Figure 3: Cobalt Price, US$ per lb., February 2004 – May 2013
Cobalt minimum 99.8% Aerospace Application
Source: Metal Pages High Purity Cobalt Market
Cobalt used for the production of superalloys for critical applications must be of the highest purity and must meet strict specification requirements in terms of chemical content. Such specifications relate not only to the level of purity but more importantly, impose strict maximum levels measured at the parts per million (ppm) levels for specific impurities and other trace elements. The Company’s technical staff and consultants utilizing various reliable industry sources project that the total amount of cobalt metal produced annually is approximately 22,000 – 24,000 tonnes. Of this approximately 8,500 to 9,500 tonnes are suitable for superalloy applications. Of this number, only around 6,000 tonnes are suitable for critical applications in the superalloy sector. Annual consumption of cobalt metal in the superalloy sector is widely reported to be around 13,500 tonnes per year (CDI, 2010) and is projected to rise to over 17,500 in the next few years (Roskill, 2010). In an August 2011 market report, CRU Strategies projected that tightness will remain a feature of the market for high grade cobalt for the foreseeable future. These figures indicate that a substantial shortfall may soon exist for cobalt suitable for superalloy applications and is likely to continue into the future. This is the material the ICP is projected to produce at approximately 1,500 tonnes annually, which represents just over 10% of the existing high purity cobalt metal market. The US presently consumes almost 60% of all available superalloy cobalt, with the aerospace industry accounting for 64% and land based turbines accounting for an additional 26% of world consumption (Figure 4). According to the US Geological Survey (USGS - Mineral Commodity Summaries, 2012, USGS Minerals Yearbook, 2010), the US currently produces no cobalt metal of any grade.
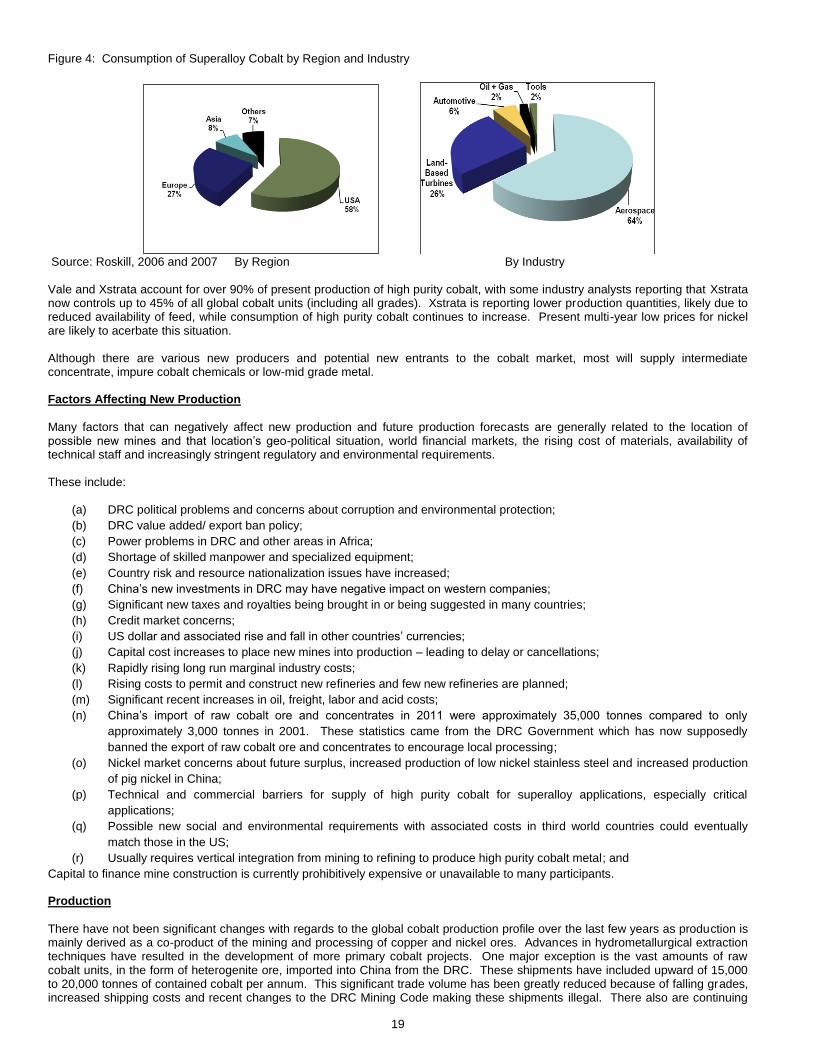
19
Figure 4: Consumption of Superalloy Cobalt by Region and Industry
Source: Roskill, 2006 and 2007 By Region By Industry Vale and Xstrata account for over 90% of present production of high purity cobalt, with some industry analysts reporting that Xstrata now controls up to 45% of all global cobalt units (including all grades). Xstrata is reporting lower production quantities, likely due to reduced availability of feed, while consumption of high purity cobalt continues to increase. Present multi-year low prices for nickel are likely to acerbate this situation. Although there are various new producers and potential new entrants to the cobalt market, most will supply intermediate concentrate, impure cobalt chemicals or low-mid grade metal. Factors Affecting New Production
Many factors that can negatively affect new production and future production forecasts are generally related to the location of possible new mines and that location’s geo-political situation, world financial markets, the rising cost of materials, availability of technical staff and increasingly stringent regulatory and environmental requirements. These include:
(a) DRC political problems and concerns about corruption and environmental protection;
(b) DRC value added/ export ban policy;
(c) Power problems in DRC and other areas in Africa;
(d) Shortage of skilled manpower and specialized equipment;
(e) Country risk and resource nationalization issues have increased;
(f) China’s new investments in DRC may have negative impact on western companies;
(g) Significant new taxes and royalties being brought in or being suggested in many countries;
(h) Credit market concerns;
(i) US dollar and associated rise and fall in other countries’ currencies;
(j) Capital cost increases to place new mines into production – leading to delay or cancellations;
(k) Rapidly rising long run marginal industry costs;
(l) Rising costs to permit and construct new refineries and few new refineries are planned;
(m) Significant recent increases in oil, freight, labor and acid costs;
(n) China’s import of raw cobalt ore and concentrates in 2011 were approximately 35,000 tonnes compared to only
approximately 3,000 tonnes in 2001. These statistics came from the DRC Government which has now supposedly
banned the export of raw cobalt ore and concentrates to encourage local processing;
(o) Nickel market concerns about future surplus, increased production of low nickel stainless steel and increased production
of pig nickel in China;
(p) Technical and commercial barriers for supply of high purity cobalt for superalloy applications, especially critical
applications;
(q) Possible new social and environmental requirements with associated costs in third world countries could eventually
match those in the US;
(r) Usually requires vertical integration from mining to refining to produce high purity cobalt metal; and
Capital to finance mine construction is currently prohibitively expensive or unavailable to many participants. Production
There have not been significant changes with regards to the global cobalt production profile over the last few years as production is mainly derived as a co-product of the mining and processing of copper and nickel ores. Advances in hydrometallurgical extraction techniques have resulted in the development of more primary cobalt projects. One major exception is the vast amounts of raw cobalt units, in the form of heterogenite ore, imported into China from the DRC. These shipments have included upward of 15,000 to 20,000 tonnes of contained cobalt per annum. This significant trade volume has been greatly reduced because of falling grades, increased shipping costs and recent changes to the DRC Mining Code making these shipments illegal. There also are continuing

20
production increases from new and/or expanding operations in the DRC. The export of these new cobalt units, has largely replaced traditional heterogenite raw ore exports to China, and has helped feed China’s expanding processing capacity. During the past few years China has been constructing new cobalt processing facilities and importing increasing amounts of impure cobalt units from the DRC and nickel laterite projects. Cobalt production (in all forms) from these imported materials has risen from 8,000 tonnes annually in 2004 to almost 35,000 tonnes in 2011. The breakdown of refined cobalt production sources is as follows: Nickel Industry: 48%, Copper Industry & Other: 37%, Primary Cobalt Operation Industry: 15% Recovery from secondary sources of cobalt can occur through the introduction of recycled material but this is only economic at higher cobalt prices. Recent higher cobalt prices have resulted in this type of recovery and as such, little stockpiled material remains. Final products can be in the form of cathodes, powders, oxides, salts or solutions. The following table outlines CDI published production figures from 2005 through 2011:
According to the CDI (Cobalt News, 2009), 7 years of refined cobalt production had been growing at an average rate of 2,725 tonnes per year (“TPY”) and in the past 4 years this has increased to an average of 3,230 TPY, mainly as a result of the phenomenal increase in Chinese output since 2003. China has mostly utilized raw ore and intermediate materials imported from the DRC. This increased output helped satisfy a huge increase in Chinese demand as that market moved into industrial overdrive. During 2011 total refined cobalt production (all forms and grades) increased approximately 4% than in the previous year, to 82,247 tonnes. From 2000 to 2006 China managed to increase its own annual production of refined, lower grade, cobalt ten-fold from 1,200 tonnes to 12,700 tonnes. During 2007 and 2008, China’s production increased to 18,239 tonnes, largely through the import of raw ore material from DRC. China has a large capacity to produce lower grade refined cobalt, but lacks the raw material supply. In April 2010, the CDI estimated that 2009 cobalt production increased 5.3% with Chinese production estimated at 23,138 tonnes or an increase of around 5,000 tonnes from 2008. In April 2011, the CDI estimated that 2010 cobalt production increased 27% with Chinese production estimated at 32,930 tonnes or an increase of around 10,000 tonnes from 2009. At present China has capacity to refine almost 36,000 tonnes of cobalt materials per year. China also produced very limited amounts of higher purity cobalt materials. With changes in the DRC, China is in the process of replacing most, if not all, of this raw ore with intermediates and impure chemical products, much of which is also from new and expanded mines in the DRC. This transition is now in jeopardy because of the recent ban on concentrates and intermediate products which includes hydroxide. There has been a six month deferral of this event until the end of 2013 but the government continues to state they will implement it. Any upheaval in the DRC could likely have a devastating impact on China’s ability to source the cobalt units that they require and result in soaring cobalt prices. In addition, Chinese producers have recently been complaining that at the present cobalt prices, they are losing money and have been closing plants and/or cutting back production. Most market analysts believe that a major re-structuring of the cobalt industry in China is overdue and will occur over the next couple of years. Analysts (Beijing Antaike Information Development Company, Roskill Information Services, May 2012 CDI Presentations) predict that a combination of plant closures, merging of weaker participants and rationalization of resources will occur. The ongoing concern continues to be the near total reliance of China cobalt production on feed from the DRC. At the same time, there has also been a near continuous rundown in strategic stockpiles over the years, to the extent that the US Defense Logistics Agency (DLA) stocks stood at only 301 tonnes on December 31, 2011, with no deliveries made in 2011. Little if any cobalt is apparent in other stockpiles although plans to create stockpiles have been reported from Japan and Europe. China has been reported to hold an inventory of cobalt intermediates for future processing, but the size of this stockpile is open for debate. Recent strikes, legal problems, technical problems, and related shut downs at mines in DRC, Zambia, Australia, Canada and elsewhere, combined with production decreases at Xstrata’s refinery in Norway, all impact current cobalt production. China was expected to impact cobalt availability in 2012 and this could lead to shortages later in 2013 and in future years. Consumption
CRU (CDI presentation, May 2010) forecasts cobalt demand to increase at rates of between 8.9% and 16.7% per year between 2010 and 2013. Cobalt demand has grown at a compound annual rate of about 6.6% for the past 10 years (according to the CRU) and at significantly higher rates in the more recent years as a result of the increased demand for chemicals in China, mainly for rechargeable batteries. According to Roskill Information Services (2011 CDI Presentation), growth from the previous year in battery
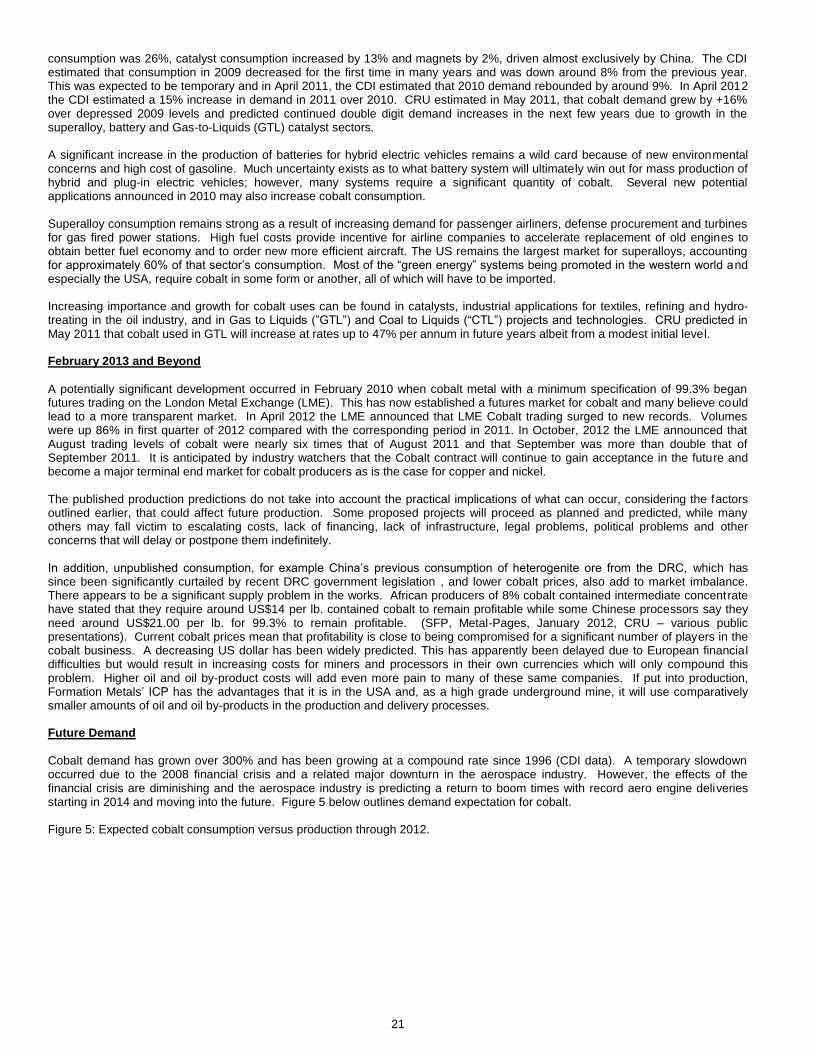
21
consumption was 26%, catalyst consumption increased by 13% and magnets by 2%, driven almost exclusively by China. The CDI estimated that consumption in 2009 decreased for the first time in many years and was down around 8% from the previous year. This was expected to be temporary and in April 2011, the CDI estimated that 2010 demand rebounded by around 9%. In April 2012 the CDI estimated a 15% increase in demand in 2011 over 2010. CRU estimated in May 2011, that cobalt demand grew by +16% over depressed 2009 levels and predicted continued double digit demand increases in the next few years due to growth in the superalloy, battery and Gas-to-Liquids (GTL) catalyst sectors. A significant increase in the production of batteries for hybrid electric vehicles remains a wild card because of new environmental concerns and high cost of gasoline. Much uncertainty exists as to what battery system will ultimately win out for mass production of hybrid and plug-in electric vehicles; however, many systems require a significant quantity of cobalt. Several new potential applications announced in 2010 may also increase cobalt consumption. Superalloy consumption remains strong as a result of increasing demand for passenger airliners, defense procurement and turbines for gas fired power stations. High fuel costs provide incentive for airline companies to accelerate replacement of old engines to obtain better fuel economy and to order new more efficient aircraft. The US remains the largest market for superalloys, accounting for approximately 60% of that sector’s consumption. Most of the “green energy” systems being promoted in the western world and especially the USA, require cobalt in some form or another, all of which will have to be imported. Increasing importance and growth for cobalt uses can be found in catalysts, industrial applications for textiles, refining and hydro-treating in the oil industry, and in Gas to Liquids (”GTL”) and Coal to Liquids (“CTL”) projects and technologies. CRU predicted in May 2011 that cobalt used in GTL will increase at rates up to 47% per annum in future years albeit from a modest initial level. February 2013 and Beyond
A potentially significant development occurred in February 2010 when cobalt metal with a minimum specification of 99.3% began futures trading on the London Metal Exchange (LME). This has now established a futures market for cobalt and many believe could lead to a more transparent market. In April 2012 the LME announced that LME Cobalt trading surged to new records. Volumes were up 86% in first quarter of 2012 compared with the corresponding period in 2011. In October, 2012 the LME announced that August trading levels of cobalt were nearly six times that of August 2011 and that September was more than double that of September 2011. It is anticipated by industry watchers that the Cobalt contract will continue to gain acceptance in the future and become a major terminal end market for cobalt producers as is the case for copper and nickel. The published production predictions do not take into account the practical implications of what can occur, considering the factors outlined earlier, that could affect future production. Some proposed projects will proceed as planned and predicted, while many others may fall victim to escalating costs, lack of financing, lack of infrastructure, legal problems, political problems and other concerns that will delay or postpone them indefinitely. In addition, unpublished consumption, for example China’s previous consumption of heterogenite ore from the DRC, which has since been significantly curtailed by recent DRC government legislation , and lower cobalt prices, also add to market imbalance. There appears to be a significant supply problem in the works. African producers of 8% cobalt contained intermediate concentrate have stated that they require around US$14 per lb. contained cobalt to remain profitable while some Chinese processors say they need around US$21.00 per lb. for 99.3% to remain profitable. (SFP, Metal-Pages, January 2012, CRU – various public presentations). Current cobalt prices mean that profitability is close to being compromised for a significant number of players in the cobalt business. A decreasing US dollar has been widely predicted. This has apparently been delayed due to European financial difficulties but would result in increasing costs for miners and processors in their own currencies which will only compound this problem. Higher oil and oil by-product costs will add even more pain to many of these same companies. If put into production, Formation Metals’ ICP has the advantages that it is in the USA and, as a high grade underground mine, it will use comparatively smaller amounts of oil and oil by-products in the production and delivery processes. Future Demand
Cobalt demand has grown over 300% and has been growing at a compound rate since 1996 (CDI data). A temporary slowdown occurred due to the 2008 financial crisis and a related major downturn in the aerospace industry. However, the effects of the financial crisis are diminishing and the aerospace industry is predicting a return to boom times with record aero engine deliveries starting in 2014 and moving into the future. Figure 5 below outlines demand expectation for cobalt. Figure 5: Expected cobalt consumption versus production through 2012.
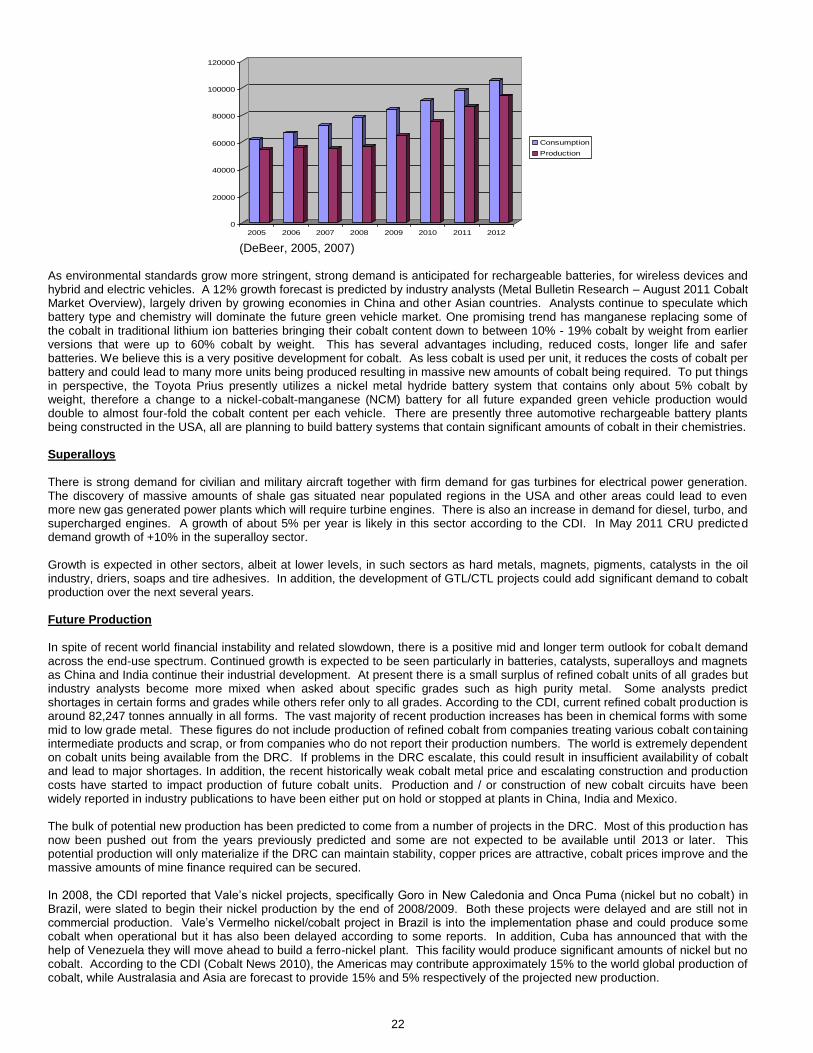
22
(DeBeer, 2005, 2007)
As environmental standards grow more stringent, strong demand is anticipated for rechargeable batteries, for wireless devices and hybrid and electric vehicles. A 12% growth forecast is predicted by industry analysts (Metal Bulletin Research – August 2011 Cobalt Market Overview), largely driven by growing economies in China and other Asian countries. Analysts continue to speculate which battery type and chemistry will dominate the future green vehicle market. One promising trend has manganese replacing some of the cobalt in traditional lithium ion batteries bringing their cobalt content down to between 10% - 19% cobalt by weight from earlier versions that were up to 60% cobalt by weight. This has several advantages including, reduced costs, longer life and safer batteries. We believe this is a very positive development for cobalt. As less cobalt is used per unit, it reduces the costs of cobalt per battery and could lead to many more units being produced resulting in massive new amounts of cobalt being required. To put things in perspective, the Toyota Prius presently utilizes a nickel metal hydride battery system that contains only about 5% cobalt by weight, therefore a change to a nickel-cobalt-manganese (NCM) battery for all future expanded green vehicle production would double to almost four-fold the cobalt content per each vehicle. There are presently three automotive rechargeable battery plants being constructed in the USA, all are planning to build battery systems that contain significant amounts of cobalt in their chemistries. Superalloys
There is strong demand for civilian and military aircraft together with firm demand for gas turbines for electrical power generation. The discovery of massive amounts of shale gas situated near populated regions in the USA and other areas could lead to even more new gas generated power plants which will require turbine engines. There is also an increase in demand for diesel, turbo, and supercharged engines. A growth of about 5% per year is likely in this sector according to the CDI. In May 2011 CRU predicted demand growth of +10% in the superalloy sector. Growth is expected in other sectors, albeit at lower levels, in such sectors as hard metals, magnets, pigments, catalysts in the oil industry, driers, soaps and tire adhesives. In addition, the development of GTL/CTL projects could add significant demand to cobalt production over the next several years. Future Production
In spite of recent world financial instability and related slowdown, there is a positive mid and longer term outlook for cobalt demand across the end-use spectrum. Continued growth is expected to be seen particularly in batteries, catalysts, superalloys and magnets as China and India continue their industrial development. At present there is a small surplus of refined cobalt units of all grades but industry analysts become more mixed when asked about specific grades such as high purity metal. Some analysts predict shortages in certain forms and grades while others refer only to all grades. According to the CDI, current refined cobalt production is around 82,247 tonnes annually in all forms. The vast majority of recent production increases has been in chemical forms with some mid to low grade metal. These figures do not include production of refined cobalt from companies treating various cobalt containing intermediate products and scrap, or from companies who do not report their production numbers. The world is extremely dependent on cobalt units being available from the DRC. If problems in the DRC escalate, this could result in insufficient availability of cobalt and lead to major shortages. In addition, the recent historically weak cobalt metal price and escalating construction and production costs have started to impact production of future cobalt units. Production and / or construction of new cobalt circuits have been widely reported in industry publications to have been either put on hold or stopped at plants in China, India and Mexico. The bulk of potential new production has been predicted to come from a number of projects in the DRC. Most of this production has now been pushed out from the years previously predicted and some are not expected to be available until 2013 or later. This potential production will only materialize if the DRC can maintain stability, copper prices are attractive, cobalt prices improve and the massive amounts of mine finance required can be secured. In 2008, the CDI reported that Vale’s nickel projects, specifically Goro in New Caledonia and Onca Puma (nickel but no cobalt) in Brazil, were slated to begin their nickel production by the end of 2008/2009. Both these projects were delayed and are still not in commercial production. Vale’s Vermelho nickel/cobalt project in Brazil is into the implementation phase and could produce some cobalt when operational but it has also been delayed according to some reports. In addition, Cuba has announced that with the help of Venezuela they will move ahead to build a ferro-nickel plant. This facility would produce significant amounts of nickel but no cobalt. According to the CDI (Cobalt News 2010), the Americas may contribute approximately 15% to the world global production of cobalt, while Australasia and Asia are forecast to provide 15% and 5% respectively of the projected new production.
0
20000
40000
60000
80000
100000
120000
2005 2006 2007 2008 2009 2010 2011 2012
Consumption
Production

23
Of all the new projects, Africa could contribute by far the largest proportion of cobalt production - about 65% - mainly from the DRC (CDI, Cobalt News 2010). The recent decrease in the nickel price to below US$8.00 may also impact the viability of new nickel projects and any associated cobalt units, as numerous analysts have indicated that this is a key price level for industry to replace older mines and make production decisions. Thus, as previously discussed, the bulk of possible future production should be the most heavily discounted and this adds great uncertainty to future production estimates. Conclusion
Cobalt consumption has undergone a long period of sustained growth since the beginning of the new millennium and this growth appears set to continue. The anomaly of reduced consumption that occurred in 2009 is expected to now be behind us. However, given the continuing robust demand and constrained availability of raw material before new projects come on stream, it is possible that there could be a period of volatility apparent in the market during the short-term. The availability of intermediates, cobalt chemicals and low-mid grade cobalt metal appears to be good; however, the same can’t be said for high purity cobalt metal where shortages are predicted by leading market analysis groups. The long term average price of cobalt from 1980 to 2011, (in 2011 dollars) was over US$22.00 per lb. The Company believes that this figure represents a conservative view of future cobalt prices. Too many analysts and companies fail to recognize or report the significant costs of sustaining capital and capital cost repayment in their cash costs of production numbers which places a false low number into circulation. Both of these can substantially increase the real cash costs of production for each pound of cobalt some projects. Potential for cobalt prices to return to new highs is considered to be probable, especially high purity cobalt metal. With increasing external costs associated with construction and mining such as energy, labor (including availability and skills), structural material costs, increased borrowing costs etc., together with extended lead times for critical parts and equipment, it is highly likely that many capital and operating costs will still need to be revised upward in the future. Projects will take longer to bring on stream and marginal costs of production could well increase. Resource nationalism issues and threatened new royalties from many different cobalt producing countries may also have significant impact on future developments. Implementation of western environmental standards, real cost bonding, and mine rehabilitation would impose significant new costs in many third world countries. These protections are controls that responsible consumers should insist upon in order to bring an end to the poor practices and destruction caused in the past and which are still commonly occurring at operations outside the developed world. The short term outlook for the cobalt market is mixed; however, the medium term outlook for the cobalt market remains positive. Provided that global industrial development continues to recover and then maintains its historical growth momentum, largely influenced by China/Asia, then the longer term outlook for the cobalt market would appear favorable. Many potential new environmental applications for cobalt could also significantly increase cobalt consumption around the world. The Company believes that the ICP is well positioned to capitalize on the growing demand for cobalt, in particular high purity cobalt metal. Being located in the United States provides close proximity to customers, cost effective access to resources, and stable operating standards including protection from currency devaluations. The rise of new laws to combat political corruption and graft and demands for greater transparency and reporting for mining companies around the world are beginning to have an impact. Concerned customers are starting to request metals from only areas and/or regions that do not have these problems. Cobalt being added to the LME also enhances product marketing because it establishes a futures market to utilize when needed and provides for more transparent pricing information. Management believes that the ongoing restructuring of cobalt processing plants, particularly in China and India bodes well for future cobalt prices in late 2014 and beyond.
1.3 Selected Annual Information
The Company’s results of operations, financial position and sources and uses of cash in the reflect management’s focus on the following key areas: (a) Capital Allocation – Capital spending has been directed toward the creation of an integrated mining, production, refining
and marketing operation to service the precious metals refining industry and the world’s growing cobalt market.
(b) Raising Capital – The financial statements reflect the emphasis of management on sourcing the cash resources to fund our operating and investing activities and to eliminate debt. In Management’s view, given the nature of the Company’s business and stage of development, the most meaningful financial information concerning the Company relates to its current liquidity and capital resources. The following table is a summary of the results of the Company’s operations and activities for its last three completed financial years.
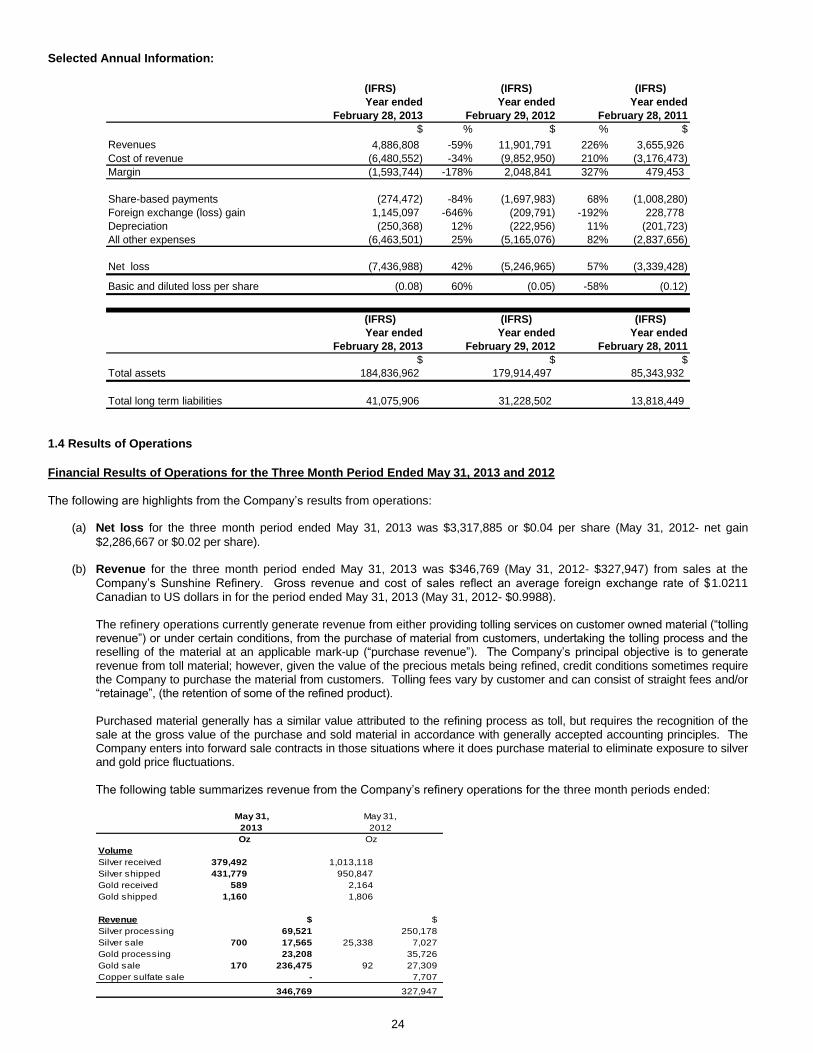
24
Selected Annual Information:
(IFRS) (IFRS) (IFRS)
Year ended Year ended Year ended
February 28, 2013 February 29, 2012 February 28, 2011
$ % $ % $
Revenues 4,886,808 -59% 11,901,791 226% 3,655,926
Cost of revenue (6,480,552) -34% (9,852,950) 210% (3,176,473)
Margin (1,593,744) -178% 2,048,841 327% 479,453
Share-based payments (274,472) -84% (1,697,983) 68% (1,008,280)
Foreign exchange (loss) gain 1,145,097 -646% (209,791) -192% 228,778
Depreciation (250,368) 12% (222,956) 11% (201,723)
All other expenses (6,463,501) 25% (5,165,076) 82% (2,837,656)
Net loss (7,436,988) 42% (5,246,965) 57% (3,339,428)
Basic and diluted loss per share (0.08) 60% (0.05) -58% (0.12)
(IFRS) (IFRS) (IFRS)
Year ended Year ended Year ended
February 28, 2013 February 29, 2012 February 28, 2011
$ $ $
Total assets 184,836,962 179,914,497 85,343,932
Total long term liabilities 41,075,906 31,228,502 13,818,449 1.4 Results of Operations
Financial Results of Operations for the Three Month Period Ended May 31, 2013 and 2012
The following are highlights from the Company’s results from operations:
(a) Net loss for the three month period ended May 31, 2013 was $3,317,885 or $0.04 per share (May 31, 2012- net gain
$2,286,667 or $0.02 per share).
(b) Revenue for the three month period ended May 31, 2013 was $346,769 (May 31, 2012- $327,947) from sales at the
Company’s Sunshine Refinery. Gross revenue and cost of sales reflect an average foreign exchange rate of $1.0211 Canadian to US dollars in for the period ended May 31, 2013 (May 31, 2012- $0.9988).
The refinery operations currently generate revenue from either providing tolling services on customer owned material (“tolling revenue”) or under certain conditions, from the purchase of material from customers, undertaking the tolling process and the reselling of the material at an applicable mark-up (“purchase revenue”). The Company’s principal objective is to generate revenue from toll material; however, given the value of the precious metals being refined, credit conditions sometimes require the Company to purchase the material from customers. Tolling fees vary by customer and can consist of straight fees and/or “retainage”, (the retention of some of the refined product). Purchased material generally has a similar value attributed to the refining process as toll, but requires the recognition of the sale at the gross value of the purchase and sold material in accordance with generally accepted accounting principles. The Company enters into forward sale contracts in those situations where it does purchase material to eliminate exposure to silver and gold price fluctuations. The following table summarizes revenue from the Company’s refinery operations for the three month periods ended:
Oz Oz
Volume
Silver received 379,492 1,013,118
Silver shipped 431,779 950,847
Gold received 589 2,164
Gold shipped 1,160 1,806
Revenue $ $
Silver processing 69,521 250,178
Silver sale 700 17,565 25,338 7,027
Gold processing 23,208 35,726
Gold sale 170 236,475 92 27,309
Copper sulfate sale - 7,707
346,769 327,947
May 31, May 31,
2013 2012

25
(c) Cost of refinery revenues for the three month period ended May 31, 2013 $993,416 (May 31, 2012- $525,341), resulting in
a net loss from refinery of $586,647 (May 31, 2012- $197,394). Profit margin was negative 169% of revenue during the current period compared to negative 60% in 2012. Higher costs during the current period were primarily due to increases in labour cost and adjustments to gold inventory. During the fiscal year ended February 28, 2013, the Company began investing capital and resources in the 100% owned Complex to process third party base and precious metal concentrates. This new business is currently in the commissioning and ramp up stages and is not fully functional until the 2014 fiscal year. During the three months ended May 31, 2013, the Company capitalized $263,281 (May 31, 2012- $nil) to development expenditures. The Company plans to depreciate this asset once the project is fully commissioned and the third party base and precious metals processing business is fully operational.
(d) Bank, interest, and financing charges for the three month period ended May 31, 2013 was $181,220 (May 31, 2012-
$78,506). This was mainly made up of interest paid on the Bonds $33,770 (May 31, 2012- $62,441) and interests accrued on Convertible Debenture $106,079 (May 31, 2012- $nil). .
(e) Foreign exchange gain for the three month period ended May 31, 2013 was $7,228 (May 31, 2012- $3,423,945). On May
9, 2013, the Company repaid the remaining US$43,600,000 of Bonds by using restricted cash from the LOC. The Company also closed the LOC in conjunction with the Bond redemption and released net cash of US$9,569,439 or
$9,595,277 from unused Bond proceeds and restricted cash to the Company’s treasury. Restricted cash balance on May
31, 2013 was US$nil (May 31, 2012- US$44,163,958), this significantly reduced the foreign exchange risk from cash held in US dollars. The US dollar appreciated against the Canadian dollar from $1.0314 on February 28 2013 to $1.0368 on May 31, 2013.
(f) Depreciation totaled $55,661 during the three months ended May 31, 2013 (May 31, 2012- $49,909).
(g) Accounting and audit fees totaled $113,343 (May 31, 2012- $99,889) for the three months period ended May 31, 2013.
(h) Administration expense for the three months ended May 31, 2013 was $64,692 (May 31, 2012- $80,865). Decrease in
administration expense during the period was a result of salary reduction implemented by management in December 2012.
(j) Interest income for the three month period ended May 31, 2013 was $65,225 (May 31, 2012- $43,235). This was
predominately made up of interest from cash held in investment, cash held in restricted accounts guaranteeing the LOC, and interest from Bond proceeds held as construction fund in trust up to May 9, 2013.
(k) Accretion expense for the three month period ended May 31, 2013 was $266,807 (May 31, 2012- $13,477). During the
period, the Company recorded accretion expenses of $74,925 (May 31, 2012- $13,477) related to the Bond, $ 87,249 (May 31, 2012- $nil) related to convertible debenture, and $13,236 (May 31, 2012- $nil) for provision for site reclamation and closure costs.
(l) Income tax recovery of $1,666,425 (May 31, 2012- income tax expense $58,506) was recognized during the three month
period ended May 31, 2013.
(m) Deferred financing cost of $2,681,116 (May 31, 2012- $nil) was expensed during the three months ended May 31, 2013.
These costs were previously deferred and amortized to the life of the Bonds. The Company expensed these costs during the period as a result of the Bonds redemption on May 9, 2013.
(n) Inventory write down to fair value was $464,065 (May 31, 2012- $313,664) for the period ended May 31, 2013. This
was due to reduction in fair market value of silver and gold relative to the value of silver and gold held as inventory.
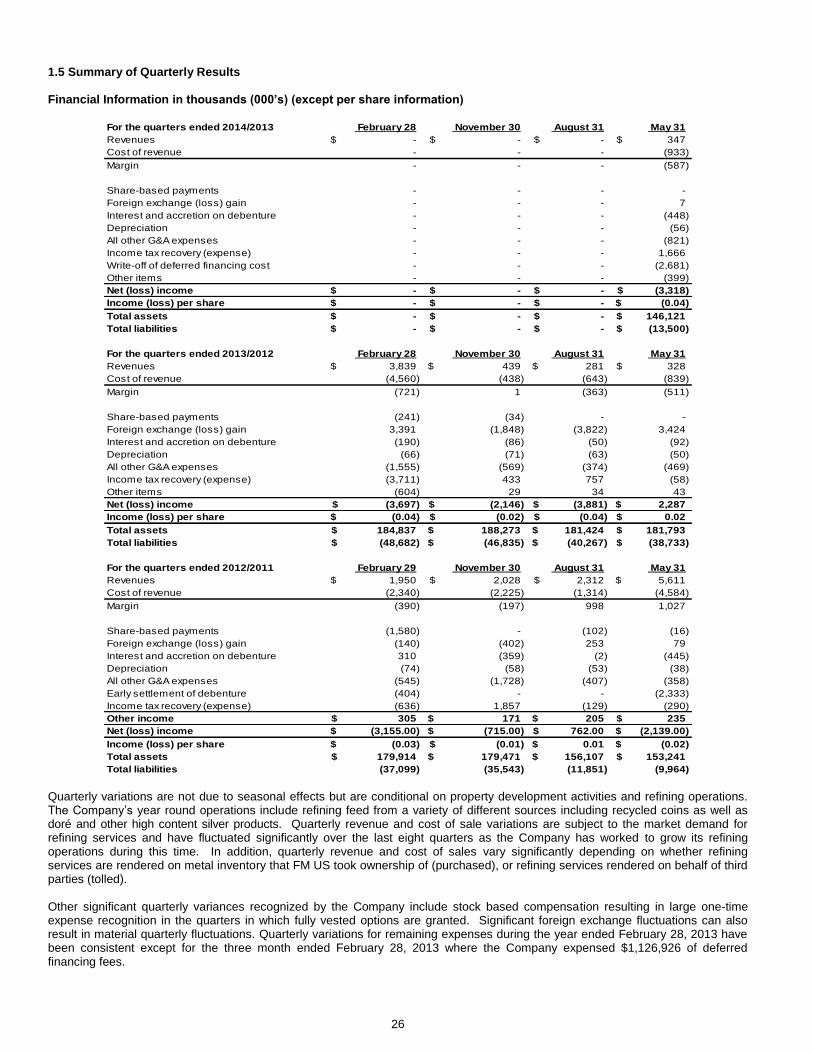
26
1.5 Summary of Quarterly Results Financial Information in thousands (000’s) (except per share information)
For the quarters ended 2014/2013 February 28 November 30 August 31 May 31
Revenues -$ -$ -$ 347$
Cost of revenue - - - (933)
Margin - - - (587)
Share-based payments - - - -
Foreign exchange (loss) gain - - - 7
Interest and accretion on debenture - - - (448)
Depreciation - - - (56)
All other G&A expenses - - - (821)
Income tax recovery (expense) - - - 1,666
Write-off of deferred financing cost - - - (2,681)
Other items - - - (399)
Net (loss) income -$ -$ -$ (3,318)$
Income (loss) per share -$ -$ -$ (0.04)$
Total assets -$ -$ -$ 146,121$
Total liabilities -$ -$ -$ (13,500)$
For the quarters ended 2013/2012 February 28 November 30 August 31 May 31
Revenues 3,839$ 439$ 281$ 328$
Cost of revenue (4,560) (438) (643) (839)
Margin (721) 1 (363) (511)
Share-based payments (241) (34) - -
Foreign exchange (loss) gain 3,391 (1,848) (3,822) 3,424
Interest and accretion on debenture (190) (86) (50) (92)
Depreciation (66) (71) (63) (50)
All other G&A expenses (1,555) (569) (374) (469)
Income tax recovery (expense) (3,711) 433 757 (58)
Other items (604) 29 34 43
Net (loss) income (3,697)$ (2,146)$ (3,881)$ 2,287$
Income (loss) per share (0.04)$ (0.02)$ (0.04)$ 0.02$
Total assets 184,837$ 188,273$ 181,424$ 181,793$
Total liabilities (48,682)$ (46,835)$ (40,267)$ (38,733)$
For the quarters ended 2012/2011 February 29 November 30 August 31 May 31
Revenues 1,950$ 2,028$ 2,312$ 5,611$
Cost of revenue (2,340) (2,225) (1,314) (4,584)
Margin (390) (197) 998 1,027
Share-based payments (1,580) - (102) (16)
Foreign exchange (loss) gain (140) (402) 253 79
Interest and accretion on debenture 310 (359) (2) (445)
Depreciation (74) (58) (53) (38)
All other G&A expenses (545) (1,728) (407) (358)
Early settlement of debenture (404) - - (2,333)
Income tax recovery (expense) (636) 1,857 (129) (290)
Other income 305$ 171$ 205$ 235$
Net (loss) income (3,155.00)$ (715.00)$ 762.00$ (2,139.00)$
Income (loss) per share (0.03)$ (0.01)$ 0.01$ (0.02)$
Total assets 179,914$ 179,471$ 156,107$ 153,241$
Total liabilities (37,099) (35,543) (11,851) (9,964) Quarterly variations are not due to seasonal effects but are conditional on property development activities and refining operations. The Company’s year round operations include refining feed from a variety of different sources including recycled coins as well as doré and other high content silver products. Quarterly revenue and cost of sale variations are subject to the market demand for refining services and have fluctuated significantly over the last eight quarters as the Company has worked to grow its refining operations during this time. In addition, quarterly revenue and cost of sales vary significantly depending on whether refining services are rendered on metal inventory that FM US took ownership of (purchased), or refining services rendered on behalf of third parties (tolled). Other significant quarterly variances recognized by the Company include stock based compensation resulting in large one-time expense recognition in the quarters in which fully vested options are granted. Significant foreign exchange fluctuations can also result in material quarterly fluctuations. Quarterly variations for remaining expenses during the year ended February 28, 2013 have been consistent except for the three month ended February 28, 2013 where the Company expensed $1,126,926 of deferred financing fees.

27
1.6 Liquidity May 31, 2013 and 2012
(a) Cash and cash equivalents as at May 31, 2013 were $11,378,495 (May 31, 2012- $7,809,209). On May 9, 2013, the
Company repaid the remaining US$43,600,000 of Bonds by using restricted cash from the LOC. The Company also closed the LOC in conjunction with the Bond redemption and released net cash of US$9,569,439 or $9,595,277 from unused Bond proceeds and restricted cash to the Company’s treasury. This increased the Company’s cash and cash equivalents during the current period.
(b) Working capital as at May 31, 2013 was $8,325,074 (May 31, 2012- $27,209,718).
(c) Mineral property expenditures of $429,161 was capitalized during the three month period ended May 31, 2013 (May 31,
2012- $936,541).
(d) Net Purchase of Property, Plant and Equipment expenditures for the three month period ended May 31, 2013 was
$301,259 (May 31, 2012- $4,100,185) of which $202,972 was related to construction of the ICP and refurbishing and construction of its mill and CPF and $98,287 (May 31, 2012- $378,405) was related to the Sunshine Refinery.
Excess cash is invested in highly rated investment securities at fixed interest rates of up to 1.25% with varying terms maturing in less than three months from the date of purchase. The Company’s current working capital position and anticipated cash flows from operations are not sufficient to meet the Company’s ongoing corporate and refinery operational requirements. The Company will require additional financing to pursue ongoing development of its respective properties and the construction of the ICP. Contractual Commitments
The following is a schedule of the Company’s commitments as at May 31, 2013:
Note 2014 2015 2016 2017 and Later
$ $ $ $
Mineral property expenditure (a) 9,000 - - -
Office operating leases (b ) 131,775 175,700 118,626 40,720
140,775 175,700 118,626 40,720
(a) As per the February 28, 1999 Virgin River joint venture exploration agreement whereby the Company has 2% interest, the Company’s commitment to the 2013-14 exploration program budget is $9,000.
(b) The Company has annual operating leases commitments of 131,775 for the remaining 2014 fiscal year, $175,700 for fiscal
year 2015, $118,626 for fiscal year ending 2016, and half year lease for 2017.
(c) Pursuant to employment agreements, the Company may be obligated to pay up to $3,400,000 in the event that certain senior management is terminated without cause.
Contingency
The Convertible Debenture Agreement dated October 16, 2012 for US$5,000,000 was the first portion of additional financing with an arm’s length party (the “Investor”). As part of the Debenture agreement, the Company agreed to pay the Investor US$2,500,000 for reimbursement of fees in the event that the Company obtains other sources of financing in an aggregate amount greater than US$50,000,000 within 12 months from the agreement date. As at May 31, 2013, discussion between the Company and the Investor as to a second portion of the investment are on-going and no assurance can be given that a definitive agreement with respect to such an investment will be concluded.
1.7 Capital Resources
The Company’s working capital as at May 31, 2013 was $8,325,074 (February 28, 2013- $11,039,699). The Company’s capital resource requirements are dependent on the development stages of its respective properties. Total to complete the project net of cost spent is currently estimated to be US$118,310,674. Total estimated forecast at completion for construction and commission of the ICP is currently budgeted for US$155,334,770, which takes into account the bonding requirements and additional facilities to increase precious metals recovery and to increase autoclave leach capacity by 51%. This new cost estimation consists of US$93,318,852 for the mine concentrator, infrastructure and bonding, and US$62,015,913 for the retrofitting of the hydrometallurgical plant. These costs include mechanical and electrical equipment, construction materials, labor, labor supervision and contracted direct and indirect costs for these facilities. As at May 31, 2013, design, engineering and

28
procurement for the ICP Mine and Mill were greater than 95% complete with the actual costs of work performed being $56,701,323 to date. Of that, $202,972 (February 28, 2013- $13,176,084) was spent during the three month period ended May 31, 2013. Included in amounts spent to date, $16,498,912 previously spent on long lead items are not included in the current budget. 1.8 Off-Balance Sheet Arrangements
None 1.9 Transactions with Related Parties
(a) Subsidiaries
May 31, 2013 February 28, 2013
Formation Holdings Corp. 100% 100%
Formation Holdings US, Inc. 100% 100%
US Cobalt, Inc. 100% 100%
Formation Capital Corporation, U.S. 100% 100%
Essential Metals Corporation 100% 100%
Formation Metals, U.S. 100% 100%
Coronation Mines Ltd. 100% 100%
Minera Terranova S.A. de C.V. 100% 100%
Ownership interest
Balances and transactions between the Company and its subsidiaries have been eliminated on consolidation and are not disclosed in this note. Details of transactions between the Company and other related parties are disclosed below.
(b) Compensation of key management personnel
The compensation to directors and officers of the Company during the years ended were as follows:
May 31, May 31,
Note 2013 2012
$ $
Salaries and short-term employee benefits
including bonuses 180,920 226,150
Share based compensation - -
180,920 226,150
Outstanding balances owed to directors and officers at May 31, 2013 was $365,083 (May 31, 2012- $nil).
Some executive officers are entitled to termination and change of control benefits. These executive officers are entitled to lump sum compensation ranging from 36 to 60 months of base compensation in the event of termination without sufficient advance notice. These executive officers are also entitled to lump sum compensation ranging from 36 to 60 months of base compensation in the event of change of control.
1.10 Proposed Transactions
None 1.11 Critical Accounting Estimates
The Company’s significant accounting policies are contained in Note 3 to the audited consolidated financial statements for the year ended February 28, 2013. The following is a discussion of the accounting estimates that are critical in determining the Company’s financial results.
(a) Measurement uncertainties and estimates
The preparation of financial statements in conformity with IFRS requires management to make estimates and assumptions that affect the reported amounts of assets and liabilities and disclosure of contingent assets and liabilities at the date of the financial statements and the reported amounts of revenues and expenses during the reporting periods. Actual results could differ from those estimates and would impact future results of operations and cash flows. Significant estimates were used in the preparation of these financial statements and these include but are not limited to the following:
29
(i) Carrying value of mineral properties and exploration expenditures incurred and the likelihood of future economic recoverability of these carrying values. The application of the Company’s accounting policy for and determination on recoverability of capitalized exploration and evaluation expenditure requires judgement to determine if future economic benefits are likely, which are based on assumptions about future events or circumstances. New information may change estimates and assumptions made. If information becomes available indicating that recovery of expenditure is unlikely, the amounts capitalized is impaired and recognized as loss in the period that the new information becomes available.
(ii) Discount rates, future commodity prices, production levels, operating and capital expenditures, taxes, length of mine life, proven and probable mineral reserves and resources, and other estimates and assumptions used within the Company’s mine model for assessing possible impairment.
(iii) Assumptions and estimates on short and long term operating budget, expected profitability, investing and financing activities, and management’s strategic planning used for the assessment on going concern.
(iv) Precious metals inventory.
(v) Provision for site reclamation and closure cost. The Company examines its site reclamation and closure cost obligations annually. Significant estimates and assumptions are made to determine provision for site reclamation and closure cost due to various factors that will affect the ultimate liability. These factors include estimates of extent and cost of reclamation activities, technological and regulatory changes, cost increases and changes in discount rates. Uncertainty of these factors may result in future actual reclamation expenditure to differ from current estimates.
(vi) Assumptions used in share-based payments. The fair value of stock options and warrants are subject to the limitation of Black-Scholes option pricing model that requires market data and estimates used by the Company in the assumptions. These inputs are subjective assumptions and changes in these inputs can materially affect the fair value estimated.
(vii) Identification and disclosure of contingent liabilities and commitments.
(viii) Provision for income and mining taxes including expected recovery and periods of reversals of timing differences and composition of deferred income taxes and liabilities.
(ix) Assumptions on useful life of property, plant and equipment and related depreciation.
(b) Income taxes Current taxes Current tax for each taxable entity in the Company is based on the local taxable income at the local statutory tax rate enacted or substantively enacted at the statement of financial position date, and includes adjustments to tax payable or recoverable in respect of previous periods. Deferred taxes Deferred tax is accounted for using the liability method, providing for the tax effect of temporary differences between the carrying amount of assets and liabilities for financial reporting purposes and their respective tax bases. Deferred income tax liabilities are recognized for all taxable temporary differences except where the deferred income tax liability arises from the initial recognition of goodwill, or the initial recognition of an asset or liability in a transaction that is not a business combination and, at the time of the transaction, affects neither the accounting profit or loss nor taxable profit or loss. Deferred income tax assets are recognized for all deductible temporary differences, carry-forward of unused tax losses and unused tax credits, to the extent that it is probable that taxable profit will be available against which the deductible temporary differences, and the carry-forward of unused tax losses can be utilized, except where the deferred income tax asset related to the deductible temporary difference arises from the initial recognition of an asset or liability in a transaction that is not a business combination and, at the time of the transaction, affects neither the accounting profit or loss nor taxable profit or loss. The carrying amount of deferred income tax assets is reviewed at each statement of financial position date and is derecognized to the extent that it is no longer probable that sufficient taxable profit will be available to allow all or part of the asset to be utilized. To the extent that an asset not previously recognized fulfills the criteria for recognition, a deferred income tax asset is recorded. Deferred tax is measured on an undiscounted basis using the tax rates that are expected to apply in the period when the liability is settled or the asset is realized, based on tax rates and tax laws enacted or substantively enacted at the statement of financial position date. Deferred tax assets and liabilities are offset when they relate to income taxes levied by the same

30
taxation authority and the Company intends to settle its current tax assets and liabilities on a net basis. Current and deferred tax relating to items recognized directly in equity is recognized in equity and not in the statement of operations.
(c) Mineral properties
Acquisition costs of mineral properties together with direct exploration and development expenditures thereon are capitalized. These costs will be amortized using the unit-of-production method based on proven and probable reserves on the commencement of commercial production or written-off as the properties are sold, allowed to lapse or are abandoned. Mineral property costs not directly attributable to specific properties are expensed during the year.
(d) Reserves and resources
The Company routinely engages independent professional consultants to evaluate its mineral resources and reserves. The estimation of resources and reserves involves the application of scientific principals as well as the exercise of educated judgement. Forecasts are based on geological, geophysical, geochemical, engineering and economic data, all of which are subject to many uncertainties and interpretations. The Company expects that over time its resource and reserve estimates will be revised upward or downward based on updated information. Such information may include revisions to geological data or assumptions, a change in economic data, and the interpretation of results of future drilling and exploration activities. Resource and reserve estimates can have a significant impact on net earnings, as they are a key component in the calculation of depreciation and depletion. In addition, changes in resource and reserve estimates, the price of cobalt, gold, copper or silver and future operating and capital costs can have a significant impact on the impairment assessments of the assets. The resource estimate was prepared in conformance with the requirements set out in the Standards of Disclosure for Mineral Projects defined by National Instrument 43-101, under the direction of Mr. Neil Prenn, P.Eng., a Principal of Mine Development Associates, who is an independent Qualified Person as defined by National Instrument 43-101. These measured and indicated resources were incorporated into the Technical Report. The proven and probable mineral reserves outlined in the Technical Report are 2,636,200 tons with an average grade of 0.559% cobalt, 0.596% copper and 0.014 ounces per ton gold, based on a cut-off grade of 0.2% cobalt for a ten year mine life. The inferred resource for the ICP, not a part of this study, is 1,121,600 tons grading 0.585% cobalt, 0.794% copper and 0.017 ounces per ton gold as reported in the October 2006 MDA report mentioned above. At present, none of our properties other than ICP have a known body of commercial ore.
(e) Property, plant and equipment Property, plant and equipment are recorded at cost less accumulated depreciation, depletion and impairment charges. Finance costs incurred as a result of ongoing Letter of Credit financing for Recovery Zone Facility Bonds are also recorded in property, plant and equipment as these costs are qualified as Idaho Cobalt Project finance cost and were requisitioned from the Recovery Zone Facility Bonds. These finance costs will be depreciated according to the Life of Mine of the Idaho Cobalt Project. Where an item of plant and equipment comprises major components with different useful lives, the components are accounted for as separate items of plant and equipment. Expenditures incurred to replace a component of an item of property, plant and equipment that is accounted for separately, including major inspection and overhaul expenditures, are capitalized. Directly attributable expenses incurred for major capital projects and site preparation are capitalized until the asset is brought to a working condition for its intended use. Property, plant and equipment are depreciated to estimated residual value using the declining balance method. Management reviews the estimated useful lives, residual values and depreciation methods of the Company’s property plant and equipment annually and when events and circumstances indicate that such a review should be made. Changes to estimated useful lives, residual values or depreciation methods resulting from such review are accounted for prospectively. Assets under constructions or undergoing refurbishment are depreciated when they are available for their intended use, over their estimated useful lives. The significant classes of plant and equipment and their rate of depreciation are as follows:
Land Not depreciated
Buildings 5%
Equipment 30%
Furniture and fixtures 30%
31
(f) Site reclamation and closure cost obligations The Company records a provision for the estimated future costs of site reclamation and closure of operating projects, which are discounted to net present value using the risk free interest rate applicable to the future cash outflows. Estimates of future costs represent management’s best estimate which incorporate assumptions on the effects of inflation, movements in foreign exchange rates other specific risks associated with the related liabilities. A provision for reclamation and closure is re-measured at the end of each reporting period for changes in estimates and circumstances. Changes in estimates and circumstances include changes in legal or regulatory requirements, increased obligations arising from additional mining activities, changes to cost estimates and changes to the risk free interest rate. A provision for reclamation and closure cost obligations is accreted over time to reflect the unwinding of the discount with the accretion expense included in finance costs. Reclamation and closure cost obligations relating to mine development projects are initially recorded with a corresponding increase to the carrying amounts of related mining properties.
1.12 Changes in Accounting Policies
Application of new and revised accounting standards
The Company has applied the certain new and revised IFRS standards issued by the IASB or IFRS Interpretations Committee that are mandatory for accounting periods beginning before or on January 1, 2013. The adoption of the following new IFRS pronouncement will result in enhanced financial statement disclosures in the Company’s annual consolidated financial statemen ts. The pronouncement does not affect the Company’s financial results nor does it result in restatement of 2012 comparative periods.
(a) Fair value measurement IFRS 13, Fair Value Measurement (“IFRS 13”): IFRS 13 defines fair value and sets out a single framework for measuring fair value which is applicable to all IFRSs that require or permit fair value measurements or disclosures about fair value measurements. IFRS 13 requires that when using a valuation technique to measure fair value, the use of relevant observable inputs should be maximized while unobservable inputs should be minimized.
The adoption of IFRS 13 did not have an effect on the condensed interim consolidated financial statements for the current period. The disclosure requirements of IFRS 13 will be incorporated in the annual consolidated financial statements for the year ended February 28, 2014. This will include disclosures about fair values of financial assets and liabilities measured on a recurring basis and non-financial assets and liabilities measured on a non-recurring basis.
(b) Consolidation A IFRS 10, Consolidated Financial Statements (“IFRS 10”), which supersedes SIC 12, Consolidation – Special Purpose Entities, and the requirements relating to consolidated financial statements in IAS 27, Consolidated and Separate Financial Statements. IFRS 10 establishes control as the basis for an investor to consolidate its investees and defines control as an investor’s power over an investee with exposure, or rights, to variable returns from the investee and the ability to affect the investor’s returns through its power over the investee.
The IASB also issued IFRS 12, Disclosure of Interests in Other Entities (“IFRS 12”), which combines and enhances the disclosure requirements for the Company’s subsidiaries, joint arrangements, associates and unconsolidated structured entities. The requirements of IFRS 12 include enhanced reporting of the nature of risks associated with the Company’s interests in other entities, and the effects of those interests on the Company’s consolidated financial statements.
The application of IFRS 10 and IFRS 12 did not affect the Company’s consolidated financial statements or disclosures nor
did these changes have an effect on the Company’s existing accounting treatment. (c) Joint arrangements
In May 2011, the IASB issued IFRS 11, Joint Arrangement (“IFRS 11”), which supersedes IAS 31, Interests in Joint Ventures and SIC 13, Jointly Controlled Entities – Non-Monetary Contributions by Venturers. Under IFRS 11, joint arrangements are classified as joint operations or joint ventures based on the rights and obligations of the parties to the joint arrangements. A joint operation is a joint arrangement whereby the parties that have joint control of the arrangement (“joint operators”) have rights to the assets, and obligations for the liabilities, relating to the arrangement. A joint venture is a joint arrangement whereby the parties that have joint control of the arrangement (“joint venturers”) have rights to the net assets of the arrangement. IFRS 11 requires that a joint operator recognize its portion of assets, liabilities, revenues and expenses of a joint arrangement, while a joint venturer recognizes its investment in a joint arrangement using the equity method.
The application of IFRS 11 12 did not affect the Company’s consolidated financial statements or disclosures nor did these
changes have an effect on the Company’s existing accounting treatment.

32
(d) Financial statement presentation
IAS 1, Presentation of Financial Statements (“IAS 1”), requires an entity to group items presented in the statement of other comprehensive income on the basis of whether they may be reclassified to profit or loss subsequent to initial recognition. For those items presented before tax, the amendments to IAS 1 also require that the tax related to the two separate groups be presented separately.
The application of this amendment did not affect the Company’s consolidated financial statements or disclosures nor did
these changes have an effect on the Company’s existing accounting treatment.
(e) Employee benefits
The IASB issued amendments to IAS 19, Employee Benefits (“IAS 19”), that introduced significant changes to the
accounting for defined benefit plans and other employee benefits. The amendments include elimination of the options to defer or recognize in full in profit or loss actuarial gains and losses and instead mandates the immediate recognition of all actuarial gains and losses in other comprehensive income. The amended IAS 19 also requires calculation of net interest on the net defined benefit liability or asset using the discount rate used to measure the defined benefit obligation.
Other changes incorporated into the amended standard include changes made to the date of recognition of liabilities for
termination benefits and changes to the definitions of short-term employee benefits and other long-term employee benefits which may impact on the classification of liabilities associated with those benefits.
Amendments to IAS 19 did not affect the Company’s consolidated financial statements or disclosures nor did these
changes have an effect on the Company’s existing accounting treatment.
(f) Separate financial statements
IAS 27, Separate Financial Statements: IAS 27 has been updated to require an entity presenting separate financial statements to account for those investments at cost or in accordance with IFRS 9 Financial Instruments. The new IAS 27 excludes the guidance on the preparation and presentation of consolidated financial statements for a group of entities under the control of a parent, which is within the scope of the current IAS 27 Consolidated and Separate Financial Statements, and is replaced by IFRS 10.
The application of IAS 27 did not affect the Company’s consolidated financial statements or disclosures nor did these
changes did an effect on the Company’s existing accounting treatment.
(g) Investments in Associates
IAS 28, Investments in Associates and Joint Ventures: IAS 28 has been updated and it is to be applied by all entities that are investors with joint control of, or significant influence over, an investee. The scope of the current IAS 28 Investments in Associates does not include joint ventures.
The application of IAS 28 did not affect the Company’s consolidated financial statements or disclosures nor did these
changes have an effect on the Company’s existing accounting treatment.
(h) Disclosures
Disclosures – Offsetting Financial Assets and Financial Liabilities (Amendments to IFRS 7). On December 16, 2011 the IASB published new disclosure requirements jointly with the FAS that enables users of financial statements to better compare financial statements prepared in accordance with IFRS and US GAAP.
The application of the amendments to IFRS 7 did not affect the Company’s consolidated financial statements or
disclosures nor did these changes have an effect on the Company’s existing accounting treatment.
(i) Other standards
IFRIC 20 – Stripping Costs in the Production Phase of a Mine: In October 2011, the IASB issued IFRIC 20 which clarifies the requirements for accounting for the costs of stripping activity in the production phase when two benefits accrue: (i) usable ore that can be used to produce inventory and (ii) improved access to further quantities of material that will be mined in future periods.
The application of IFRIC 20 did not affect the Company’s consolidated financial statements or disclosures nor did these
changes have an effect on the Company’s existing accounting treatment.

33
1.13 Financial Instruments and Other Instruments
There are three levels of the fair value hierarchy that prioritize the inputs to valuation techniques used to measure fair value. As at May 31, 2013 and May 31, 2012, the Company does not have any financial instruments measured at fair value and therefore the hierarchy is not applicable. The Company’s financial assets consist of loans and receivables which includes cash and cash equivalents, restricted cash, reclamation bond, trade and other receivables. The fair value of these instruments approximate their carrying value because of the short term nature of these instruments except for the reclamation bond whereby its fair value will not be realized until the bond is released from the trustee (note 7).
The Company’s financial instruments include other liabilities which consist of accounts payable, accrued liabilities, convertible debenture, and Bonds are held at amortized cost using the effective interest method of amortization.
At May 31, 2013 and May 31, 2012, the carrying values and the fair values of the Company’s financial instruments are shown in the following table:
May 31, May 31,
2013 2012
Carrying Fair Carrying Fair
value value value value
$ $ $ $
Financial assets
Cash and cash equivalents 11,378,495 11,378,495 7,809,209 7,809,209
Restricted cash - - 45,632,296 45,632,296
Trade and other receivables 492,284 492,284 160,284 160,284
Reclamation bond 2,321,257 2,279,060 2,308,786 2,266,815
Financial liabilities -
Accounts payable 1,040,395 1,040,395 1,971,057 1,971,057
Accrued liabilities 743,960 743,960 2,372,172 2,372,172
Convertible debenture 5,411,256 5,411,256 - - Federal stimulus recovery zone facility bonds - - 24,763,154 24,763,154
The Company has exposure to risk of varying degrees of significance which could affect its ability to achieve its strategic objectives for growth and shareholder returns. The principal financial risk to which the Company is exposed are credit risk, liquidity risk, interest rate risk, foreign exchange rate risk, and metal price risk. The Company’s Board of Directors has overall responsib ility for the establishment and oversight of the Company’s risk management framework and reviews the Company’s policies on an ongoing basis. Credit risk Credit risk is the risk of an unexpected loss if a customer or third party to a financial instrument fails to meet its contractual obligations and arises principally from the Company’s cash and cash equivalents, restricted cash, trade and other receivables, and reclamation bonds. The Company’s exposure to credit risk with its customers is influenced mainly by the individual characteristics of each customer. The Company generally does not require collateral for sales. The Company takes into consideration the customer’s payment history, their credit worthiness and the current economic environment in which the customer operates to assess impairment. The Company closely monitors extensions of credit and has not experienced significant credit losses in the past. At May 31 2013, the Company had no material past due trade receivables. The Company invests its excess cash principally in highly rated government and corporate debt securities. The Company has established guidelines relative to diversification, credit ratings and maturities that maintain safety and liquidity. These guidelines are periodically reviewed by the Company’s audit committee and modified to reflect changes in market conditions. The Company’s maximum exposure to credit risk is as follows:
May 31, 2013 May 31, 2012
$ $
Cash and cash equivalents 11,378,495 7,809,209
Restricted cash - 45,632,296
Trade and other receivables 492,284 160,284
Reclamation bond 2,321,257 2,308,786 Liquidity risk Liquidity risk is the risk that the Company will not be able to meet its financial obligations as they fall due. The Company has in place a planning and budgeting process to help determine the funds required to support the Company’s operating requirements as well as its planned capital expenditures. The Company manages its financial resources to ensure that there is sufficient working capital to fund near term planned exploration work, capital and operating expenditures. The Company has considerable discretion to reduce or increase exploration plans and capital investment budgets depending on current or projected liquidity. The fol lowing summarizes the financial assets including the remaining balance available from the Recovery Zone Facility Bonds secured by Letters of Credit (note 11) and their maturity that are held to manage liquidity risk:
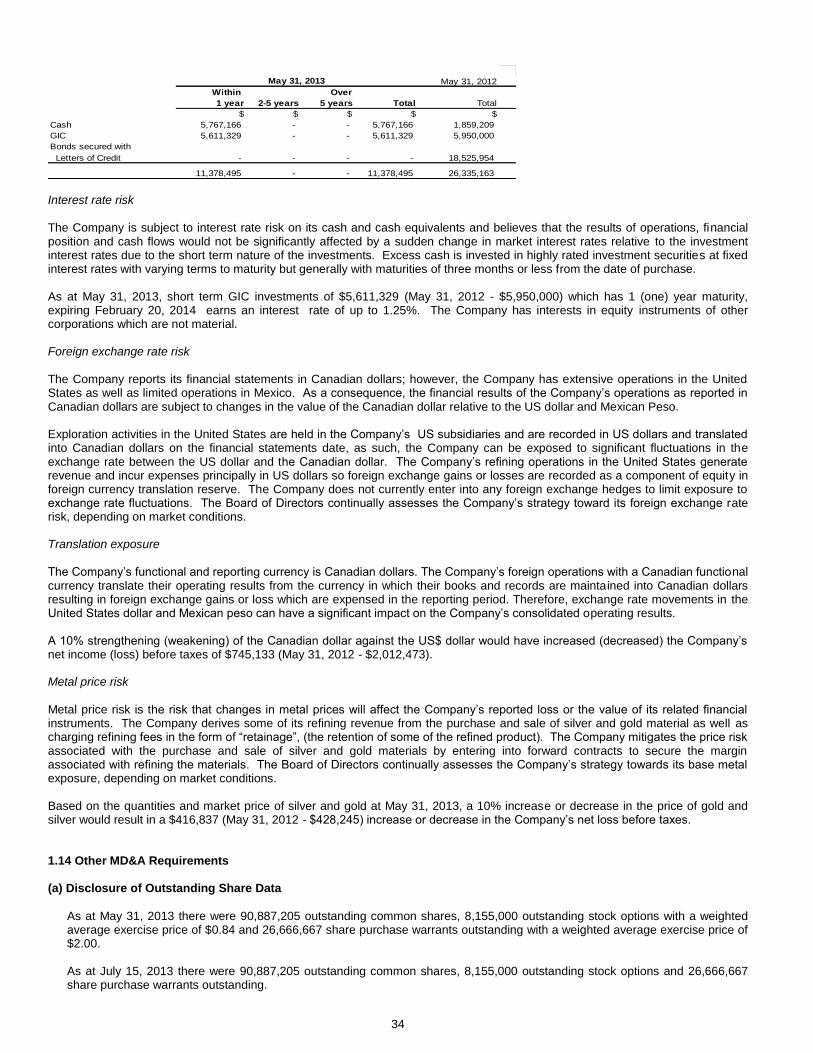
34
Within Over
1 year 2-5 years 5 years Total Total
$ $ $ $ $
Cash 5,767,166 - - 5,767,166 1,859,209
GIC 5,611,329 - - 5,611,329 5,950,000
Bonds secured with
Letters of Credit - - - - 18,525,954
11,378,495 - - 11,378,495 26,335,163
May 31, 2013 May 31, 2012
Interest rate risk The Company is subject to interest rate risk on its cash and cash equivalents and believes that the results of operations, financial position and cash flows would not be significantly affected by a sudden change in market interest rates relative to the investment interest rates due to the short term nature of the investments. Excess cash is invested in highly rated investment securities at fixed interest rates with varying terms to maturity but generally with maturities of three months or less from the date of purchase. As at May 31, 2013, short term GIC investments of $5,611,329 (May 31, 2012 - $5,950,000) which has 1 (one) year maturity, expiring February 20, 2014 earns an interest rate of up to 1.25%. The Company has interests in equity instruments of other corporations which are not material. Foreign exchange rate risk The Company reports its financial statements in Canadian dollars; however, the Company has extensive operations in the United States as well as limited operations in Mexico. As a consequence, the financial results of the Company’s operations as reported in Canadian dollars are subject to changes in the value of the Canadian dollar relative to the US dollar and Mexican Peso. Exploration activities in the United States are held in the Company’s US subsidiaries and are recorded in US dollars and translated into Canadian dollars on the financial statements date, as such, the Company can be exposed to significant fluctuations in the exchange rate between the US dollar and the Canadian dollar. The Company’s refining operations in the United States generate revenue and incur expenses principally in US dollars so foreign exchange gains or losses are recorded as a component of equity in foreign currency translation reserve. The Company does not currently enter into any foreign exchange hedges to limit exposure to exchange rate fluctuations. The Board of Directors continually assesses the Company’s strategy toward its foreign exchange rate risk, depending on market conditions. Translation exposure The Company’s functional and reporting currency is Canadian dollars. The Company’s foreign operations with a Canadian functional currency translate their operating results from the currency in which their books and records are maintained into Canadian dollars resulting in foreign exchange gains or loss which are expensed in the reporting period. Therefore, exchange rate movements in the United States dollar and Mexican peso can have a significant impact on the Company’s consolidated operating results. A 10% strengthening (weakening) of the Canadian dollar against the US$ dollar would have increased (decreased) the Company’s net income (loss) before taxes of $745,133 (May 31, 2012 - $2,012,473). Metal price risk Metal price risk is the risk that changes in metal prices will affect the Company’s reported loss or the value of its related financial instruments. The Company derives some of its refining revenue from the purchase and sale of silver and gold material as well as charging refining fees in the form of “retainage”, (the retention of some of the refined product). The Company mitigates the price risk associated with the purchase and sale of silver and gold materials by entering into forward contracts to secure the margin associated with refining the materials. The Board of Directors continually assesses the Company’s strategy towards its base metal exposure, depending on market conditions. Based on the quantities and market price of silver and gold at May 31, 2013, a 10% increase or decrease in the price of gold and silver would result in a $416,837 (May 31, 2012 - $428,245) increase or decrease in the Company’s net loss before taxes.
1.14 Other MD&A Requirements (a) Disclosure of Outstanding Share Data
As at May 31, 2013 there were 90,887,205 outstanding common shares, 8,155,000 outstanding stock options with a weighted average exercise price of $0.84 and 26,666,667 share purchase warrants outstanding with a weighted average exercise price of $2.00. As at July 15, 2013 there were 90,887,205 outstanding common shares, 8,155,000 outstanding stock options and 26,666,667 share purchase warrants outstanding.

35
(b) Internal Controls over Financial Reporting and Disclosure Controls
Evaluation of Disclosure Controls and Procedures
Disclosure controls and procedures are designed to provide reasonable assurance that all relevant information is gathered and reported on a timely basis to senior management, so that appropriate decisions can be made regarding public disclosure. The certifying officers reviewed and evaluated such disclosure controls and procedures and concluded that the disclosure controls and procedures were operating effectively as of May 31, 2013. Internal Controls over Financial Reporting
The Company’s management, with the participation of its Chief Executive Officer and Chief Financial Officer, are responsible for establishing and maintaining adequate internal control over financial reporting. The Company evaluated the design and operational effectiveness of its internal controls over financial reporting as defined under NI 52-109 for the interim period ended May 31, 2013.
The Company’s controls include policies and procedures that:
(i) relate to the maintenance of records that, in reasonable detail, accurately and fairly reflect the transactions and dispositions of the assets of the Company;
(ii) provide reasonable assurance that transactions are recorded as necessary to permit preparation of financial statements in accordance with GAAP, and that receipts and expenditures of the Company are being made only in accordance with authorizations of the Company’s management and directors; and
(iii) provide reasonable assurance regarding prevention or timely detection of unauthorized acquisition, use or disposition of the Company’s assets that could have a material effect on the annual financial statements or interim financial statements.
There were several changes made in internal control over financial reporting during the fiscal year ended February 29, 2012 which included adding additional accounting resources both in Canada and the US. A designated accountant was hired as the Company’s Corporate Controller and a designated accountant was hired to support the expansion of mine development and reporting for the ICP. Expanded involvement with Canadian and US tax experts contributed to additional complex accounting and tax specialist resources. The Company invested in improved accounting and financial reporting tools and streamlined its financial consolidation processes. These added resources have enhanced the Company’s financial reporting by enabling further segregation of duties and enabling greater review and monitoring capabilities. During the year ended February 28, 2013, the Controller at the Complex retired resulting in several changes of accountant personnel. At the year-end inventory reconciliation, the Company discovered that revenue, cost of revenue and resulting net profit margin were undervalued as they were recorded on net rather than gross basis for some sales transactions during the personnel transition period. The Company does not consider the net impact of these adjustments to be material. As a result of these adjustments, the Company has designed new internal control procedures to improve existing inventory and sales tracking to prevent future errors. The Company’s management, including its Chief Executive Officer and Chief Financial Officer, has evaluated the design and operational effectiveness of the Company’s internal control over financial reporting using the framework and criteria established in Internal Control – Integrated Framework, issued by the Committee of Sponsoring Organizations of the Treadway Commission. Management has evaluated the design of the Company’s internal control over financial reporting and tested the operating effectiveness as of May 31, 2013. Management does not consider the above discovery and adjustments to be material therefore no material weaknesses have been identified by management in this regard. Limitation of Controls and Procedures
The Company’s management, including its Chief Executive Officer and Chief Financial Officer, believe that any disclosure controls and procedures or internal control over financial reporting, no matter how well conceived and operated, can provide only reasonable, not absolute, assurance that the objectives of the control system are met. Further, the design of a control system must reflect the fact that there are resource constraints, and the benefits of controls must be considered relative to their costs. Because of the inherent limitations in all control systems, they cannot provide absolute assurance that all control issues and instances of fraud, if any, within the Company have been prevented or detected. These inherent limitations include the realities that judgments in decision-making can be faulty, and that breakdowns can occur because of simple error or mistake. Additionally, controls can be circumvented by the individual acts of some persons, by collusion of two or more people, or by unauthorized override of the controls. The design of any system of controls also is based in part upon certain assumptions about the likelihood of future events, and there can be no assurance that any design will succeed in achieving its stated goals under all potential future conditions. Accordingly, because of the inherent limitations in a cost effective control system, misstatements due to error or fraud may occur and not be detected. Also, projections of any evaluation of effectiveness to future periods are subject to the risk that controls may become inadequate because of changes in conditions, or that the degree of compliance with the policies or procedures may deteriorate.

36
(c) Additional Information
More information can be found on the Company’s website at www.FormationMetals.com. The Company has made progress toward becoming America’s sole integrated cobalt miner and refiner and has achieved its goal of becoming a precious metals bullion producer. Currently, the Company is processing various customers’ material at the refinery. As at May 31 2013 the Company had working capital of $8,325,074. The Company’s ability to conduct its future operations, including the acquisition, permitting, exploration, and development of mineral properties, is currently based on its ability to raise funds from equity and debt sources. Additional information is provided in the Company’s audited annual consolidated financial statements for the years ended February 28, 2013 and February 29, 2012. Information Circulars and Annual Information Forms are also available at www.sedar.com.
_______________________________________ _______________________________________ Mari-Ann Green J. Paul Farquharson
Chairman, CEO CFO