Embed Size (px)
Citation preview

MANAGEMENT’S DISCUSSION AND ANALYSIS
YEAR ENDED DECEMBER 31, 2020
As of March 9, 2021
(Monetary amounts are expressed in US dollars, unless otherwise indicated)

Table of Contents Page Business of the Company 3 Full Year 2020 Financial and Operating Highlights 4 Lindero Mine 8 2021 Guidance and Outlook 9 Financial Results 14 Results of Operations 18 Quarterly Information 22 Liquidity and Capital Resources 25 Financial Instruments 26 Related Party Transactions 27 Amendments to Accounting Standards That Have Been Issued 27 Risks and Uncertainties 28 Critical Accounting Estimates, Assumptions, and Judgements 35 Share Position & Outstanding Options & Equity Based Share Units 39 Controls and Procedures 40 Non-GAAP Financial Measures 40 Cautionary Statement on Forward-Looking Statements 47 Cautionary Note to United States Investors Concerning Estimates of Reserves and Resources 50

Fortuna Silver Mines Inc.
Management's Discussion and Analysis, page 3
Business of the Company Fortuna Silver Mines Inc. (“Fortuna” or the “Company”) is engaged in precious and base metal mining and related activities in Latin America, including exploration, extraction, and processing. The Company:
• operates the Caylloma silver, lead and zinc mine (“Caylloma”) in southern Peru,
• operates the San Jose silver and gold mine (“San Jose”) in southern Mexico, and
• is in the commissioning phase of its 18,750 tpd open pit gold heap leach mine (“Lindero Mine”) in northern Argentina.
The Company only processes ore extracted from its own mining concessions and does not purchase ore or mineral concentrates from third parties either for processing, refining, or trading. Fortuna is a publicly traded company incorporated and domiciled in British Columbia, Canada. Its common shares are listed on the New York Stock Exchange under the trading symbol FSM, on the Toronto Stock Exchange under the trading symbol FVI, and on the Frankfurt Stock Exchange under the trading symbol F4S.F. The Company’s registered office is located at Suite 650 - 200 Burrard Street, Vancouver, British Columbia, Canada V6C 3L6. The consolidated financial statements include wholly-owned subsidiaries of the Company; the most significant of which at December 31, 2020 are presented in the following table: Name Location Ownership Principal Activity
Minera Bateas S.A.C. ("Bateas") Peru 100% Caylloma Mine Compania Minera Cuzcatlan S.A. de C.V. ("Cuzcatlan") Mexico 100% San Jose Mine Mansfield Minera S.A. ("Mansfield") Argentina 100% Lindero Mine
This Management’s Discussion and Analysis (“MD&A”) is intended to help readers understand the significant factors that affect the performance of Fortuna and its subsidiaries, and those that may affect future performance. This MD&A has been prepared as of March 9, 2021 and should be read in conjunction with the Company’s audited consolidated financial statements for the years ended December 31, 2020 and 2019. The Company’s significant accounting policies are set out in Note 4 of the December 31, 2020 and 2019 audited consolidated financial statements. All amounts in this MD&A are expressed in United States dollars, unless otherwise indicated. Certain amounts shown in tables within this MD&A may not add exactly to the totals due to rounding. The Company prepares its annual financial statements in accordance with International Financial Reporting Standards (“IFRS”) as issued by the International Accounting Standards Board (“IASB"). In this MD&A, we refer to various Non-GAAP Financial Measures. These measures are used by us to manage and evaluate the operating performance of our mines and their ability to generate cash flows and these measures are widely reported in the mining industry as benchmarks for performance. Refer to the discussion under the heading “Non-GAAP Financial Measures”. Additional information about the Company, including our Annual Information Form, is available on SEDAR at www.sedar.com. This document contains forward-looking statements. Refer to the cautionary language under the heading “Cautionary Statement on Forward-Looking Statements.”

Fortuna Silver Mines Inc.
Management's Discussion and Analysis, page 4
Full Year 2020 Financial and Operating Highlights Sales were $279.0 million, an increase of 8% from the $257.2 million reported in the year ended December 31, 2019 (“2019”). Mine operating income was $110.2 million, an increase of 30% from the $84.6 million reported in 2019. Operating income was $57.2 million, an increase of 67% from the $34.2 million reported in 2019. Net income was $21.6 million or $0.12 per share, a 9% decrease from the $23.8 million or $0.15 per share reported in 2019. Adjusted net income (refer to Non-GAAP Financial Measures) was $31.8 million compared to $28.4 million in 2019. Adjusted EBITDA (refer to Non-GAAP Financial Measures) was $112.6 million compared to $95.4 million reported in 2019. Free cash flow from ongoing operations (refer to Non-GAAP Financial Measures) was $78.9 million compared to $34.5 million reported in 2019. Following the first gold pour at the Lindero Mine in October 2020, the Company recognized $20.3 million in gold sales from commissioning activities at the mine. In the fourth quarter of 2020, the Company elected to early adopt amendments to IAS 16, Property, Plant and Equipment – Proceeds before Intended Use, which clarifies the accounting for the net proceeds from selling gold doré produced during the commissioning of the Lindero Mine. The amendment prohibits companies from applying the previous guidance of deducting amounts received from selling items produced from the cost of property, plant and equipment while the Company is preparing the asset for its intended use. Instead, sales proceeds and the cost of producing these items are now recognized in profit or loss. COVID-19 During the year ended December 31, 2020, our operations were negatively impacted by the spread of the COVID-19 pandemic. Operations at the San Jose Mine were suspended for 54 days in Q2 as a result of a government mandated national quarantine in Mexico, and construction activities were temporarily suspended at the Lindero Mine on March 19, 2020 for a period of 60 days due to a government mandated period of national social isolation in Argentina. In response to a period of social isolation mandated by the Peruvian government in Q1 and Q2, operations were able to continue at the Caylloma mine, initially by drawing ore from the coarse ore stockpile during Q1, and as the stockpile decreased the mine was subsequently re-started in Q2 using a reduced taskforce in compliance with the applicable Peruvian Government requirements. However, operations were voluntarily suspended at the Caylloma Mine in Q3 for 21 days, to among other things sanitize and disinfect the mine and make infrastructure improvements to accommodate social distancing guidelines. As a result of the temporary suspension of operations at both the San Jose and Caylloma mines, the Company incurred $2.9 million in care and maintenance costs. The Company is managing the necessary country-by-country restrictions in order to assist in the protection of those most vulnerable. Each of the Company’s mine sites is, at the date of this MD&A, operating with a reduced workforce. Worker availability continues to be a challenge but is currently being mitigated by increasing the use of temporary workers and contractors. Health protocols are in place at each mine site for control, isolation and quarantine, as necessary, and these continue to be reviewed and adjusted accordingly based on the circumstances at each location. The Company’s focus is the health and safety of the workforce and on measures to prevent and manage the transmission of COVID-19 amongst the workforce and the communities in which the Company operates. As at the date of this MD&A, the number of COVID-19 cases and deaths in the countries where our mines operate continues to either ascend or remain at an elevated level. Until the number of cases and death rate starts to flatten and decline, there

Fortuna Silver Mines Inc.
Management's Discussion and Analysis, page 5
is no certainty that the governments may not mandate another round of extreme measures, including the suspension of business activities, which could include mining. Outbreaks of COVID-19 in areas where we operate, further restrictive directives of government and public health authorities, delays in our supply chain, restrictions which may impact access to our mine sites, restrictions that may affect our ability to transport and ship gold doré and or metal concentrates, restrict access to processing and refinery facilities, cause disruptions to our supply chain, impediments to market logistics, and further suspensions of operations or curtailment of commissioning activities at the Company’s mines remain a significant risk to our business and operations. As the situation with respect to the COVID-19 pandemic is dynamic, the Company was unable to determine the impact of COVID-19 on its production and cost guidance for 2020, and on April 2, 2020, the Company withdrew its production and cost guidance for the remainder of 2020. The production and cost guidance was reinstated for 2021 (refer to Fortuna news release dated January 19, 2021). Operating Highlights
Three months ended Years ended December 31, December 31, Consolidated Metrics 2020 2019 % Change 2020 2019 % Change Key Indicators Silver
Metal produced (oz) 1,912,737 2,251,917 (15%) 7,133,717 8,809,767 (19%) Metal sold (oz) 1,985,783 2,221,330 (11%) 7,194,362 8,798,054 (18%) Realized price ($/oz) 24.43 17.33 41% 21.18 16.20 31%
Gold Metal produced (oz) 25,357 12,279 107% 55,349 50,525 10% Metal sold (oz) 23,297 12,157 92% 53,375 50,374 6% Realized price ($/oz) 1,864 1,483 26% 1,805 1,393 30%
Lead Metal produced (000's lbs) 8,426 7,441 13% 29,628 28,746 3% Metal sold (000's lbs) 8,386 7,559 11% 29,582 28,969 2%
Zinc Metal produced (000's lbs) 12,434 11,614 7% 45,545 45,600 (0%) Metal sold (000's lbs) 12,154 11,974 2% 45,154 45,781 (1%)
Silver and gold production for the three months ended December 31, 2020 decreased 15% and increased 107%, respectively, to 1,912,737 ounces and 25,357 ounces over the same period in 2019. The lower silver production was due mainly to lower head grades at San Jose. The higher gold production was driven by the commissioning of the Lindero Mine which produced 13,435 ounces of gold doré during the quarter. Lead and zinc production increased by 13% and 7%, respectively, to 8.4 million pounds of lead and 12.4 million pounds of zinc. The increase in lead and zinc production was due to higher mill throughput and higher head grades at the Caylloma Mine. Silver and gold production for the year ended December 31, 2020 decreased 19% and increased 10%, respectively, to 7,133,717 ounces and 55,349 ounces over 2019. The silver and gold production at San Jose decreased 22% and 23% due to lower head grades and the impact to production from a government mandated 54-day temporary suspension of mining operations due to the COVID-19 pandemic. Offsetting lower gold production at San Jose was the 13,435 ounces of gold doré produced during the commissioning of the Lindero Mine. Lead production increased 3% to 29.6 million pounds and zinc production was 45.5 million pounds, which was flat year-over-year.

Fortuna Silver Mines Inc.
Management's Discussion and Analysis, page 6
Selected Financial Information
Three months ended Years ended December 31, December 31, Consolidated Financial Metrics 2020 2019 % Change 2020 2019 2018
(Expressed in $ millions except per share information)
Sales 103.5 69.0 50% 279.0 257.2 263.3 Mine operating income 46.9 23.4 100% 110.2 84.6 96.6 Operating income 28.2 9.0 213% 57.2 34.2 61.6 Net income 18.6 19.0 (2%) 21.6 23.8 34.0 Earnings per share - basic 0.10 0.12 (17%) 0.12 0.15 0.21 Adjusted net income1 23.0 10.9 111% 31.8 28.4 38.4 Adjusted EBITDA1 44.8 25.1 78% 112.6 95.4 113.9 Net cash provided by operating activities 31.3 16.4 91% 93.4 60.2 83.5 Free cash flow from ongoing operations1 34.5 6.4 439% 78.9 34.5 55.2 Capex
Sustaining 8.8 6.2 42% 19.5 20.4 24.0 Non-sustaining 1.0 0.9 11% 1.2 2.0 3.3 Lindero 10.5 26.8 (61%) 46.8 188.3 80.0 Brownfields 1.0 0.9 11% 3.8 4.8 8.6
Dec 31,
2020 Dec 31,
2019 Dec 31,
2018 Cash and cash equivalents 131.9 83.4 163.3 Total assets 1,055.3 936.1 786.5 Debt 158.6 146.5 69.3 Shareholders' equity 725.8 635.4 602.8 Notes: 1 Refer to Non-GAAP financial measures.
Sales for the three months ended December 31, 2020 were $103.5 million, a 50% increase from the $69.0 million reported in the same period in 2019. The increase was driven by a 41% and 26% increase in the prices of silver and gold and $20.3 million from the sale of 10,935 ounces of gold from the Lindero Mine. The Company recognized gold sales and related production costs from the Lindero Mine after the Company elected to early adopt amendments to IAS 16, Property, Plant and Equipment – Proceeds before Intended Use, which is effective for annual periods beginning on or after January 1, 2022. Early adoption is permitted. Under this amended standard, a company is required to recognize sales proceeds and related cost of items produced in the income statement while the company is preparing the asset for its intended use. Sales for the year ended December 31, 2020 increased 8% to $279.0 million compared to $257.2 million reported for the same period in 2019. The increase was due mainly from the sale of $20.3 million of gold doré produced during the commissioning of the Lindero Mine, which is discussed above. Mine operating income for the three months ended December 31, 2020 was $46.9 million, a $23.5 million increase from the $23.4 million reported in the same period in 2019. Higher precious metal prices and commissioning activities at the Lindero Mine that generated $10.2 million of mine operating income were the primary factors for the increase. Mine operating income for the year ended December 31, 2020 increased 30% to $110.2 million compared to $84.6 million reported in 2019. The increase in mine operating income was driven by higher precious metal prices and the recognition of $10.2 million of mine operating income from the Lindero Mine after the Company elected to early adopt amendments to the accounting standard IAS 16, Property, Plant and Equipment – Proceeds before Intended Use. The Lindero Mine generated $20.3 million of proceeds from the sale of gold doré produced during the commissioning of the mine.

Fortuna Silver Mines Inc.
Management's Discussion and Analysis, page 7
Operating income for the three months ended December 31, 2020 was $28.2 million, a $19.2 million increase from the $9.0 million reported in the same period in 2019. The higher mine operating income, as discussed above, was partially offset by a $4.7 million foreign exchange loss mainly from the devaluation of the Argentine Peso and the Mexican Peso compared to a $1.4 million loss in 2019, as well as higher general and administrative expenses of $2.6 million related mostly to the impact of an increase in the Company’s share price on the value of the cash-settled share awards. Operating income for the year ended December 31, 2020 was $57.2 million, a $23.0 million increase from the $34.2 million reported in the same period in 2019. The higher mine operating income was partially offset by a $5.3 million increase in general and administrative expenses as share-based payments expense increased $6.4 million over 2019 due to a 98% year-over-year increase in the Company’s share price which directly impacts the value of the outstanding cash-settled share units. Net income for the three months ended December 31, 2020 was $18.6 million, a $0.4 million decrease from the $19.0 million reported in the same period in 2019. The comparable period in 2019 included an investment gain of $11.0 million compared to $nil in the quarter ended December 31, 2020 and a $7.2 million deferred tax recovery which resulted in a 5% effective rate compared to 33% for the fourth quarter of 2020. Net income for the year ended December 31, 2020 was $21.6 million, a $2.2 million decrease from the $23.8 million reported in 2019. The decrease was due primarily to lower investment gains and lower deferred tax recoveries of $7.8 million and $11.0 million, respectively. Adjusted net income (refer to Non-GAAP Financial Measures) for the three months ended December 31, 2020 was $23.0 million, a $12.1 million increase from the $10.9 million reported in the same period in 2019. The increase was due primarily to the addback of $3.2 million of foreign exchange losses compared to an addback of $1.0 million in 2019 relating to the recoverable value added tax paid on the Lindero construction. The comparable period in 2019 also included deduction of $11.0 million related to investment gains in Argentina compared to $Nil for 2020. Adjusted net income (refer to Non-GAAP Financial Measures) for the year ended December 31, 2020 was $31.8 million compared to $28.4 million in 2019. Adjusted EBITDA (refer to Non-GAAP Financial Measures) for the three months ended December 31, 2020 was $44.8 million compared to $25.1 million reported in the same period in 2019 due primarily to higher silver and gold prices and the early adoption of amendments to IAS 16, Property, Plant and Equipment – Proceeds before Intended Use, relating to the Lindero Mine, which collectively, increased mine operating income by $23.7 million and partially offset by higher share-based payments expense. Adjusted EBITDA (refer to Non-GAAP Financial Measures) for the year ended December 31, 2020 was $112.6 million compared to $95.4 million in 2019. As explained above, the increase was due primarily to the increases in the prices of silver and gold as well as the impact to mine operating income from the early adoption of amendments to IAS 16, Property, Plant and Equipment – Proceeds before Intended Use. Free cash flow from ongoing operations (refer to Non-GAAP Financial Measures) for the three months ended December 31, 2020 was $34.5 million compared to $6.4 million in the same period in 2019,. The increased free cashflow was driven mainly by higher precious metal prices and positive changes in working capital at the San Jose Mine related to trade receivables and recovery of value-added tax. Free cash flow from ongoing operations (refer to Non-GAAP Financial Measures) for the year ended December 31, 2020 was $78.9 million compared to $34.5 million. The increase was driven by higher precious metal prices, which contributed to increased cashflow from operations. As at December 31, 2020, the Company had cash and cash equivalents of $131.9 million (December 31, 2019 – $83.4 million), an increase of $48.5 million since the beginning of the year. For the full year 2020, the Company generated $93.4 million of

Fortuna Silver Mines Inc.
Management's Discussion and Analysis, page 8
net cash from operations, completed an equity financing for gross proceeds of $69.0 million, drew down $65.0 million and repaid $55.0 million of the revolving credit facility, and received $1.0 million in proceeds from the exercise of stock options. Uses of cash include $100.3 million on construction, capitalized borrowing costs, and value added taxes for the Lindero Mine. Spending on exploration, mineral properties, plant and equipment totaled $24.1 million, excluding Lindero construction. Lindero Mine Construction at Lindero is substantially complete as of the end of December 2020 with total construction cost projected to be within the $320 million guidance (refer to Fortuna news release dated May 8, 2020), including remaining capital expenditures of $2.0 million to be allocated to finalize construction of ancillary facilities and to commissioning activities. During 2020, sustaining capital of $1.7 million was spent mainly on the purchase of spare parts for major equipment. Construction activities were temporarily suspended on March 19, 2020 for a period of 60-days due a government mandated period of national social isolation in Argentina to contain the spread of the coronavirus. The following table summarizes the spending on construction and pre-production costs for the year ended December 31, 2020 at the Lindero Mine:
Cumulative to Twelve months ended (Expressed in $ millions) December 31, 2019 December 31, 2020 Total
Construction capital expenditures 268.2 46.8 315.0 Contractor advances and deposits on equipment, net of transfers 10.5 (9.8) 0.7
Total Construction Spending 278.7 37.0 315.7 Preproduction costs 10.8 21.8 32.6 Spare parts, supplies and materials inventory 6.2 12.9 19.1 Other costs 1 4.5 0.2 4.7
Total Lindero Mine Costs 300.2 71.9 372.1
Note 1: Consists of Argentina financial transaction taxes, deposits, and other costs
During the fourth quarter of 2020, the Company adopted amendments to IAS 16, Property, Plant and Equipment – Proceeds before Intended Use, on a modified retrospective basis. As a result of the adoption, the Company reclassified $21.9 million (December 31, 2019 - $2.8 million) of pre-production costs related to the production of ore stockpile and operating supplies spent during the construction period to September 30, 2020. There were $7.7 million of construction and other trade payables outstanding as at December 31, 2020. Gold Production and Sales The Company produced 13,435 ounces of gold at the Lindero Mine in 2020, which is in line with its revised production forecast of between 13,000 to 15,000 ounces (refer to Fortuna news release dated November 12, 2020). Gold sales for the fourth quarter of 2020 and for the year totaled 10,935 ounces. The Company elected to early adopt amendments to IAS 16, Property, Plant and Equipment – Proceeds before Intended Use. As a result, the Company recognized gold sales of $20.3 million and related cost of sales of $10.1 million in the income statement.
Mining A total of 3.78 million tonnes of ore were mined in 2020 at a strip ratio of 1.05:1. Mining and equipment performance are in line with design parameters and support the operation´s processing capacity of 18,750 tonnes per day.

Fortuna Silver Mines Inc.
Management's Discussion and Analysis, page 9
Processing During 2020, a total of 1.6 million tonnes of coarse ore were placed on the heap leach pad at an average gold head grade of 1.00 g/t containing a total of 52,000 ounces of gold. Average ore crushing throughput rate for the year was 8,831 tonnes per day. Recovery of gold from the heap leach was in line with expectations, based on metallurgical testing of coarse ore with an estimated 16,687 ounces of gold leached as of December 31, 2020.
In the fourth quarter of 2020, primary and secondary crusher throughput averaged 10,406 tonnes per day with the ramp up schedule progressing according to plan, achieving 75% of the 18,750 tonnes per day design capacity in December 2020. The operation team is fine-tuning the crushing system with a focus on screens, chutes, and belt conveyors in order to ramp up crushing throughput to the design capacity.
Commissioning of the HPGR, agglomeration plant, and stacking system was completed in mid-December with all systems in the ramp up phase. The operation is transitioning from placing coarse ore on the heap leach pad with trucks to placing tertiary crushed ore via the stacking system, which is expected to increase heap gold recovery from an estimated 50% to 78% over a 90-day period based on metallurgical column test results. As at the end of February 2021, the stacking system was operating at 23% of design capacity.
The SART plant was commissioned in mid-December and the ramp up phase commenced with the circulation of 80 cubic meters per hour of pregnant solution, which is approximately 20% of design capacity. Once design parameters are achieved, copper concentration in the pregnant solution will be reduced allowing the ADR plant to operate at design parameters.
At the end of the first quarter of 2021, the Company will provide an assessment on the status of the ramp up to commercial production.
2021 Guidance and Outlook Production and Cost Guidance The Company’s production and cost guidance set out below for 2021 assumes that operations will continue during the year without any major interruptions related to COVID-19. At each of our mine sites, health protocols are in place for control, isolation and quarantine, as necessary, and these continue to be reviewed and adjusted accordingly based on the circumstances at each location. The Company’s focus is the health and safety of the workforce and on measures to prevent and manage the transmission of COVID-19 amongst the workforce and the communities in which Fortuna operates.
Silver Gold Lead Zinc Cash Cost1 AISC1 Mine (Moz) (koz) (Mlbs) (Mlbs)
Silver (US$/t)
(US$/oz Ag Eq)
San Jose, Mexico 5.8 - 6.5 38 - 42 - - 68 - 75 12.2 - 14.5 Caylloma, Peru 1.0 - 1.1 - 29 - 32 44 - 49 85 - 93 19.4 - 23.0
Gold (US$/oz
Au)
(US$/oz Au)
Lindero2,3, Argentina - 140 - 160 - - 365 - 430 730 - 860
Consolidated Total 6.8 - 7.6 178 - 202 29 - 32 44 - 49 Notes:
1. All-in sustaining cost (AISC) is a non-GAAP financial measure, refer to Forward-looking Statements regarding non-GAAP financial measures; AISC includes production cash cost, commercial and government royalties, mining tax, export duties, if applicable, workers’ participation, if applicable, subsidiary G&A, sustaining capital expenditures and Brownfields exploration and is estimated at metal prices of $1,800/oz Au, $22 /oz Ag, $1,900/t Pb, and $2,300/t Zn.
2. Totals may not add due to rounding. 3. Refer to Lindero Mine 2021 Cost Guidance section below.

Fortuna Silver Mines Inc.
Management's Discussion and Analysis, page 10
2021 All-In-Sustaining Cash Cost Per Silver and Gold Ounce Calculations
Silver Mines – All-in-Sustaining Cash Cost per Silver Ounce Equivalent
$/oz Ag San Jose Caylloma
Cash cost $ 8.2 - 9.7 $ 13.4 - 15.9 Adjustments: Commercial and government royalties and mining tax 0.5 - 0.6 0.3 - 0.3 Worker's participation 0.7 - 0.8 0.1 - 0.2 General and administrative expenses 0.6 - 0.7 0.9 - 1.1 Sustaining capital expenditures 1.3 - 1.5 3.6 - 4.2 Brownfields exploration expenditures 1 - 1.1 1.1 - 1.3
All-in-sustaining cash cost per payable ounce of silver $ 12.2 - 14.5 $ 19.4 - 23.0
Gold Mine – All in Sustaining Cash Cost per Gold Ounce Equivalent
$/oz Au Lindero
Cash cost, net of by-product credits $ 366 - 432 Adjustments: Commercial and government royalties and mining tax 39 - 46 Export duties 121 - 143 General and administrative expenses 37 - 44 Sustaining capital expenditures 126 - 149 Stripping capitalization 38 - 44 Brownfields exploration expenditures 2 - 2
All-in-sustaining cash cost per payable ounce of gold $ 730 - 860
2021 Capital Expenditure and Exploration Guidance
(Expressed in $ millions) San Jose Caylloma Lindero Total
Equipment and infrastructure $ 3.6 $ 11.1 $ 20.5 $ 35.2 Mine development 6.9 5.9 - 12.8 Brownfields exploration 10.0 4.7 0.3 15.0 Other sustaining capex 3.0 - - 3.0
Total $ 23.5 $ 21.7 $ 20.8 $ 66.0
Annual cash cost per ounce of gold at the Lindero Mine for 2021 is projected between $365 and $430 and AISC is projected between $730 and $860 per ounce of gold. For the first half of the year, AISC is projected between $1,130 and $1,335 due to the ramp-up in gold production and sustaining capital expenditure execution in the first semester and to range between $525 and $615 per ounce of gold in the second half of 2021. Projected AISC at the Lindero Mine for 2021 is approximately $200 per ounce of gold higher than was projected in our news releases dated February 20, 2020 and May 8, 2020. The main drivers of the increase, which are partially offset by reduced cost in key consumables of approximately $25 per ounce of gold, are listed below:
• Sustaining capital expenditures: Expansion of the ADR plant and the heap leach pad represents approximately $80 per ounce of gold.
• Export duty and mining royalty: Higher gold price assumptions represent $20 per ounce, and a higher export duty rate of 8% of sales, compared to 5% in the prior guidance, represents $40 per ounce of gold
• Production cost: A 10% increase in unit costs per tonne represents approximately $40 per ounce of gold. The main drivers of the increase are related to COVID-19 expenses of $2.1 million, various indirect costs of approximately $1.8 million, and higher planned maintenance contractor services at the processing plant in 2021 of $1.2 million.

Fortuna Silver Mines Inc.
Management's Discussion and Analysis, page 11
San Jose Mine, Mexico At the San Jose Mine, the operation plans to process 1.13 million tonnes averaging 196 g/t Ag and 1.26 g/t Au. Capital investments are estimated at $23.4 million, including $13.4 million for sustaining capital expenditures and $10.0 million for Brownfields exploration programs. Major sustaining capital investment projects include:
• Mine development: $6.9 million
• Dry stack expansion: $1.8 million
• Equipment and infrastructure: $1.8 million
• Infill drilling: $0.9 million Caylloma Mine, Peru At the Caylloma Mine, the operation plans to process 530,000 tonnes averaging 74 g/t Ag, 2.87% Pb, and 4.30% Zn. Capital investments are estimated at $21.7 million, including $15.2 million for sustaining capital expenditures and $4.7 million for Brownfields exploration programs. Major sustaining capital investment projects include:
• Mine development and infill drilling: $5.9 million
• Tailings dam expansion: $4.7 million
• Electric system upgrade: $1.9 million
• Infrastructure: $1.5 million
Lindero Mine, Argentina At the Lindero Mine, the operation plans to place on the leach pad 6.3 million tonnes of ore averaging 1.08 g/t Au, containing an estimated 218,000 ounces of gold. Capital investments are estimated at $20.8 million, including $20.5 million for sustaining capital expenditures and $0.3 million for Brownfields exploration programs. Gold production is planned to ramp-up throughout the year to reach the annual guidance range of between 140,000 to 160,000 ounces with approximately two thirds of annual production anticipated to be achieved in the second half of 2021. The ramp up phase of the HPGR, agglomeration, and stacking system is proceeding according to schedule, and the integration of the entire comminution and conveyor belt system and is expected to reach design capacity by the end of the first quarter of 2021. Throughout this period, some coarse ore will continue to be placed on the heap leach pad by truck as the operations team transitions to the stacking system. By the end of the first quarter of 2021, the operations team also expects the SART plant to achieve design capacity which will reduce soluble copper in the pregnant solution, resulting in more efficient cyanide consumption and gold recovery at the ADR plant. The operations team expects to complete construction of the planned phase one expansion of the heap leach pad by the second quarter of 2021, which will provide sufficient leaching area until 2024. Major sustaining capital investment projects include:
• Heap leach pad completion (years 1 – 3): $7.0 million
• ADR plant expansion: $5.0 million
• Maintenance and energy: $4.0 million The Company expects to incur $6.1 million of deferred stripping costs in 2021.

Fortuna Silver Mines Inc.
Management's Discussion and Analysis, page 12
The Company has decided to bring forward the expansion of the ADR plant from year four in the life of mine plan, due to higher projected gold production of 24,000 ounces for the initial three years compared to the original feasibility study. The expansion of the ADR will provide greater gold adsorption capacity and efficient recovery of the additional ounces. The major components of sustaining capital, including the expansions of the ADR plant and heap leach pad, representing between 70% and 80% of the annual budget are expected to be executed in the first half of 2021.
Brownfields Exploration 2021 Outlook Due to COVID-19 restrictions and the reallocation of capital to complete the construction of the Lindero Mine, limited brownfields exploration was carried out in 2020. Consolidated Brownfields exploration expenditures in 2020 were $3.8 million. The Company is expanding its exploration budget and initiatives in 2021 as the capital-intensive phase of the Lindero construction has ended. Fortuna´s consolidated Brownfields exploration budget for 2021 for all three mines totals $15.9 million, which includes 53,800 meters of diamond drilling and 2,170 meters of underground development. San Jose Mine, Mexico The Brownfields exploration program budget for 2021 at the San Jose Mine is $10.9 million, which includes 33,800 meters of diamond drilling and 1,770 meters of underground development for drilling access, platforms, and services. Underground exploration drilling will focus on the shallow and deep north and south extensions of the Trinidad vein system and the sub-parallel Victoria mineralized zone, while surface drilling will test the new grassroots Los Diaz and Los Vasquez targets located south and north of the mine, respectively. Caylloma Mine, Peru The Brownfields exploration program budget for 2021 at the Caylloma Mine is $4.7 million, which includes 19,000 meters of diamond drilling and 500 meters of underground development for drilling access, platforms, and services. Surface and underground drilling will focus on the extensions of two ore shoots along the Animas vein, the extension of the Animas vein to the northeast, the possible extension of silver-dominant mineral resources along the San Cristobal silver vein located to the north of the mine, the depth potential under favorable surface geochemistry at the undrilled, near-mine La Plata / Corona Antimonio vein system and the Pisacca grassroots target located to the south of the mine. Lindero Mine, Argentina The Brownfields exploration program budget for 2021 at the Lindero Mine is $320,000, which includes 1,000 meters of drilling on the Arizaro target located 3.5 kilometers to the southeast of the mine. The drilling will test for additional mineralization. Greenfields Exploration 2021 Outlook Due to COVID-19 restrictions and the reallocation of capital to complete the construction of the Lindero Mine, limited greenfields exploration was carried out in 2020. Total greenfields exploration expenditures in 2020 were $1.2 million. Active reconnaissance exploration programs on acquired projects and evaluations of possible acquisitions in Mexico, Argentina, and select other jurisdictions will continue throughout 2021. Projects under option include the Santa Fe project in southern Sinaloa, Mexico, where current small-scale mining is exploiting gold-silver epithermal veins. Fortuna’s exploration plans at Santa Fe include mapping, grid soil sampling, a LiDAR geophysical survey and drilling previously untested veins that have been mapped near-mine and scout drilling following up on ground surveys and geophysical anomalies. In Argentina, exploration work is planned for the second half of 2021 at the Cerro Lindo high-sulfidation target, which hosts multiple areas of undrilled, high-level, acid- sulfate alteration and at Solitario where massive silica ribs of up to 30 meters in width could be high-level expressions of potential at depth. Allocated budget for greenfield exploration activities in 2021 is $5.0 million.

Fortuna Silver Mines Inc.
Management's Discussion and Analysis, page 13
2021 COVID-19 Outlook Although our mines are currently operating at full capacity, COVID-19 cases and deaths are either on the rise or at elevated levels in the countries that host our mining operations. The Company has also experienced an increase in COVID-19 cases in Peru which has affected our Caylloma mining operations and has resulted in a reduced workforce and quarantine periods for those affected. The full extent and impact of COVID-19 on the Company’s operations cannot currently be ascertained, as it depends upon future developments which cannot be predicted, and includes among other matters: the impact of additional waves of the pandemic or increases in outbreaks in the countries where we operate, the duration of outbreaks, the severity of the virus and the ability to treat it, the timeliness of the distribution of vaccines in the countries where we operate, the ability to collect sufficient data to track the virus and the collective actions taken to curb the spread of the virus, directives of government and public health authorities, the speed at which the Company’s suppliers and logistics providers can return to full operation, the status of labour availability, and the impact of supplier prioritization of clearing backlogs. The impacts of the COVID-19 crisis that may have an effect on the Company include: a further decrease in short-term and/or long-term demand and/or pricing for the metals that we produce; reductions in production levels; further increased costs resulting from our efforts to mitigate the impact of COVID-19; deterioration of worldwide credit and financial markets that could limit our ability to obtain external financing to fund our operations and capital expenditures and result in losses on our holdings of cash and investments due to failures of financial institutions and other parties and a higher rate of losses on our accounts receivable due to credit defaults; restrictions may impact access to our mine sites and affect our ability to transport and ship gold doré and or metal concentrates, restrict access to processing and refinery facilities; cause disruptions to our supply chain; impairments and/or write-downs of assets; and adverse impacts on our information technology systems and our internal control systems as a result of the need to increase remote work arrangements. A material adverse effect on our employees, customers, suppliers and/or logistics providers could have a material adverse effect on the Company. The overall severity and duration of COVID-19-related adverse impacts on the Company’s business will depend on future developments which cannot be predicted. Even after the COVID-19 outbreak has subsided, the Company may continue to experience material adverse impacts to its business as a result of the global economic impact, including any related recession, as well as lingering impacts on demand for our products.

Fortuna Silver Mines Inc.
Management's Discussion and Analysis, page 14
Financial Results
Sales
Three months ended Years ended December 31, December 31,
2020 2019 % Change 2020 2019 % Change
Provisional sales ($ million) Caylloma 22.2 18.8 18% 67.0 73.6 (9%) San Jose 58.0 48.9 19% 188.3 183.2 3% Lindero 20.3 - 100% 20.3 - 100%
Adjustments ($ million)1 3.0 1.3 131% 3.4 0.4 750%
Total Sales ($ million) 103.5 69.0 50% 279.0 257.2 8% Silver
Metal produced (oz) 1,912,737 2,251,917 (15%) 7,133,717 8,809,767 (19%) Provisional sales (oz) 1,985,783 2,221,330 (11%) 7,194,362 8,798,054 (18%) Provisional sales ($ million) 45.0 35.7 26% 140.9 131.9 7% Realized price ($/oz)2 24.43 17.33 41% 21.18 16.20 31% Net realized price ($/oz)3 22.65 16.07 41% 19.58 14.99 31%
Gold Metal produced (oz) 25,357 12,279 107% 55,349 50,525 10% Provisional sales (oz) 23,297 12,157 92% 53,375 50,374 6% Provisional sales ($ million) 41.7 17.4 140% 91.1 66.6 37% Realized price ($/oz)2 1,864 1,483 26% 1,805 1,393 30% Net realized price ($/oz)3 1,791 1,429 25% 1,707 1,323 29%
Lead Metal produced (000's lbs) 8,426 7,441 13% 29,628 28,746 3% Provisional sales (000's lbs) 8,386 7,559 11% 29,582 28,969 2% Provisional sales ($ million) 6.0 6.4 (6%) 19.7 24.6 (20%) Realized price ($/lb)2 0.86 0.92 (7%) 0.83 0.91 (8%) Net realized price ($/lb)3 0.72 0.85 (15%) 0.67 0.85 (21%)
Zinc Metal produced (000's lbs) 12,434 11,614 7% 45,545 45,600 (0%) Provisional sales (000's lbs) 12,154 11,974 2% 45,154 45,781 (1%) Provisional sales ($ million) 7.7 8.3 (7%) 24.0 33.7 (29%) Realized price ($/lb)2 1.18 1.08 9% 1.03 1.15 (11%) Net realized price ($/lb)3 0.64 0.69 (7%) 0.53 0.74 (28%)
Notes: 1 Adjustments consists of mark to market, final price and assay adjustments 2 Based on provisional sales before final price adjustments. Net after payable metal deductions, treatment, and refining charges 3 Treatment charges are allocated to base metals at Caylloma and to gold at San Jose
Consolidated Sales for the three months ended December 31, 2020 were $103.5 million, a 50% increase from the $69.0 million reported in the same period in 2019. Sales for the three months ended December 31, 2020, including adjustments, at San Jose were $60.5 million, a 20% increase from the $50.4 million reported in the same period in 2019. The increased sales were driven by a 31% and 28% increase in the prices of silver and gold despite a 13% and 11% decrease in the volume of silver and gold ounces sold. Sales from the Caylloma Mine were $22.7 million, a 22% increase from the $18.6 million reported in the same period in 2019. The increased sales were driven by higher silver and zinc prices of 40% and 9%, respectively, as well as higher volume of metals sold. The Company also recognized gold sales of $20.3 million from commissioning activities at the Lindero Mine after the Company elected to early adopt amendments to IAS 16, Property, Plant and Equipment – Proceeds before Intended Use, which
Fortuna Silver Mines Inc.
Management's Discussion and Analysis, page 15
becomes effective on January 1, 2022. Under this amended standard, a company is required to recognize sales proceeds and related cost of items produced in the income statement while the company is preparing the asset for its intended use. Consolidated sales for the twelve months ended December 31, 2020 increased 8% to $279.0 million compared to $257.2 million for the same period in 2019. The increased sales were due primarily to $20.3 million of gold doré sales from the sale of 10,935 ounces of gold at the Lindero Mine. Sales at San Jose for the twelve months ended December 31, 2020 increased 4% to $191.0 million as silver and gold prices increased 41% and 26%, respectively, which were partially offset by a 21% decrease in the volume of silver and gold ounces sold. The lower metal production was due mainly to lower head grades and the lost production from a 54-day government mandated temporary suspension of mining operations during the second quarter to mitigate the spread of the COVID-19 pandemic. Sales at Caylloma decreased 7% to $67.6 million due primarily to decreases in the prices of lead and zinc of 9% and 10%, respectively. The Company also recognized $20.3 million of gold sales from commissioning activities at the Lindero Mine, as referenced above.
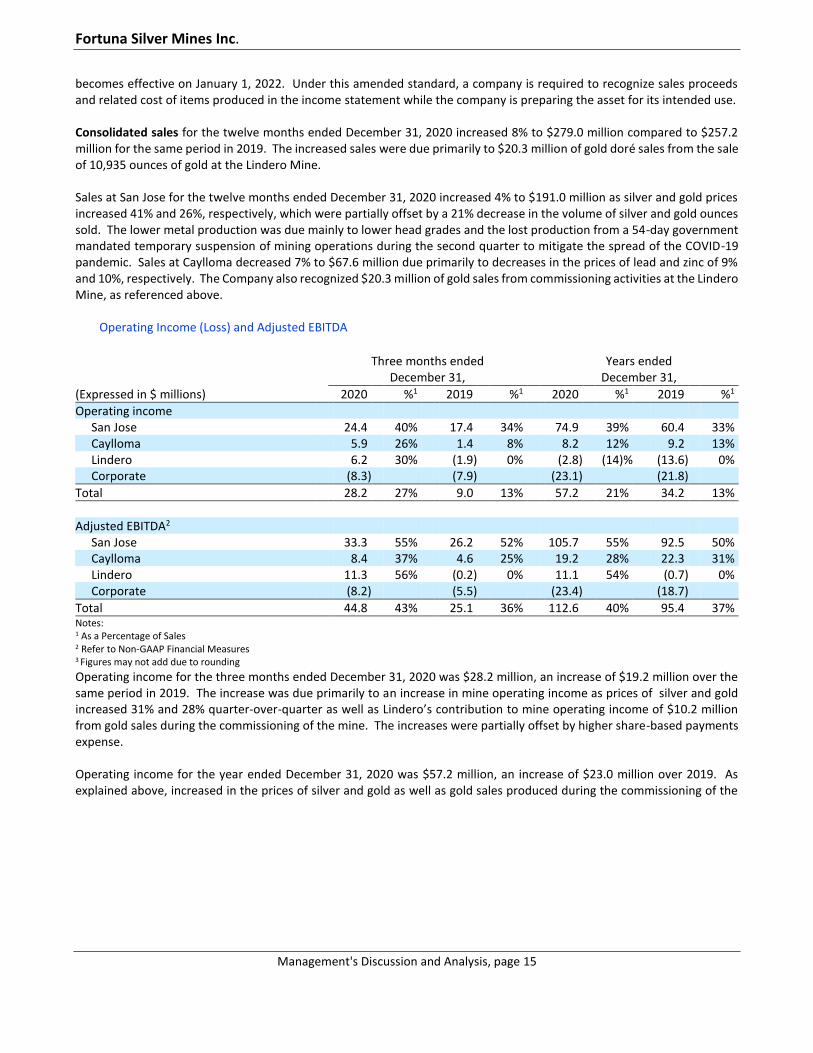
Operating Income (Loss) and Adjusted EBITDA
Three months ended Years ended December 31, December 31,
(Expressed in $ millions) 2020 %1 2019 %1 2020 %1 2019 %1
Operating income San Jose 24.4 40% 17.4 34% 74.9 39% 60.4 33% Caylloma 5.9 26% 1.4 8% 8.2 12% 9.2 13% Lindero 6.2 30% (1.9) 0% (2.8) (14)% (13.6) 0% Corporate (8.3) (7.9) (23.1) (21.8)
Total 28.2 27% 9.0 13% 57.2 21% 34.2 13%
Adjusted EBITDA2
San Jose 33.3 55% 26.2 52% 105.7 55% 92.5 50% Caylloma 8.4 37% 4.6 25% 19.2 28% 22.3 31% Lindero 11.3 56% (0.2) 0% 11.1 54% (0.7) 0% Corporate (8.2) (5.5) (23.4) (18.7)
Total 44.8 43% 25.1 36% 112.6 40% 95.4 37% Notes: 1 As a Percentage of Sales 2 Refer to Non-GAAP Financial Measures 3 Figures may not add due to rounding
Operating income for the three months ended December 31, 2020 was $28.2 million, an increase of $19.2 million over the same period in 2019. The increase was due primarily to an increase in mine operating income as prices of silver and gold increased 31% and 28% quarter-over-quarter as well as Lindero’s contribution to mine operating income of $10.2 million from gold sales during the commissioning of the mine. The increases were partially offset by higher share-based payments expense. Operating income for the year ended December 31, 2020 was $57.2 million, an increase of $23.0 million over 2019. As explained above, increased in the prices of silver and gold as well as gold sales produced during the commissioning of the

Fortuna Silver Mines Inc.
Management's Discussion and Analysis, page 16
Lindero Mine, were partially offset by a $6.4 million increase in share-based payments expense. The Company’s share price increased 99% year-over-year and negatively impacted the value of the cash-settled share units.
General and Administrative (“G&A”) Expenses
Three months ended Years ended December 31, December 31,
(Expressed in $ millions) 2020 2019 % Change 2020 2019 % Change
Mine G&A 3.4 3.5 (3%) 10.1 10.9 (7%) Corporate G&A 3.7 3.0 23% 10.8 11.4 (5%) Share-based payments 4.6 2.4 92% 12.4 6.0 107% Workers' participation 0.5 0.5 0% 1.8 1.5 20%
Total 12.2 9.4 30% 35.1 29.8 18%
General and administrative expenses for the three months ended December 31, 2020 increased 28% to $12.2 million compared to $9.4 million reported in the same period in 2019, which was due primarily to a $2.2 million increase in share-based payments and higher payroll related expenses. The Company’s share price increased 23% during the quarter which impacted the value of cash-settled share units. Mine G&A decreased $0.3 million due to lower personnel and other corporate administration expenses which was due, in part, to cost reduction initiatives implemented during the second and third quarter to lessen the impact of the COVID-19 pandemic. General and administrative expenses for the year ended December 31, 2020 increased 17% to $35.1 million compared to $29.8 million reported in 2019. The increase was due primarily to a 107% increase in share-based payments impacted by a 98% year-over-year increase in the Company’s share price, which was partially offset by a $1.7 million decrease in mine and corporate personnel and administration costs. Other expenses comprise of write downs, care and maintenance costs related to COVID-19 and other income and expenses. Other expenses for the three months ended December 31, 2020 decreased 59% to $1.3 million compared to $3.2 million reported in the same period in 2019. The decrease was due primarily to lower non-cash write downs compared to 2019 when the Company wrote down $2.7 million on its investment in associates. Other expenses for the year ended December 31, 2020 decreased 4% to $4.4 million compared to $4.6 million reported in 2019. The decrease was due primarily to lower non-cash write downs, which was offset by $3.1 million of care and maintenance costs incurred during the government mandated temporary suspension of the Company’s mining operations in the second and third quarter of 2020.
Foreign Exchange Loss Foreign exchange loss for the three months ended December 31, 2020 increased $3.3 million to $4.7 million compared to $1.4 million reported in the same period in 2019. The increase was mainly related to the devaluation of the Argentine Peso against the U.S. dollar and its impact on Argentine Pesos denominated value added tax receivable accumulated during the construction of the Lindero Mine and partially offset by a 7% quarter-over-quarter strengthening of the Mexican Peso against the US dollar which impacted the Mexican Peso denominated value added tax receivable. Foreign exchange loss for the twelve months ended December 31, 2020 decreased $1.1 million to $12.2 million compared to $13.3 million reported in the same period in 2019. The main driver for the foreign exchange loss was the year-over-year devaluation of the Argentine Peso. Due to the devaluation on Lindero’s Argentine Peso denominated working capital items, and primarily, the value added tax receivable, the Company recognized a $11.8 million foreign exchange loss compared to a $11.5 million foreign exchange loss in 2019. The Mexican Peso end the 2020 year relatively flat against the US dollar compared to in 2019 when the Company recognized a $1.6 million foreign exchange loss on a weak Mexican Peso against the US dollar.

Fortuna Silver Mines Inc.
Management's Discussion and Analysis, page 17
Income Tax Expense
Income tax expense for the three months ended December 31, 2020 was $9.1 million or $8.0 million higher than the $1.1 million reported in the same period in 2019, which included two one-time items - the recognition of $2.0 million of tax assets that had previously not been recognized related to the accounting of the convertible debenture and the impact of $11.0 million in investment gains from cross-border trades. The high precious metal and zinc prices increased San Jose and Caylloma mines’ pre-tax income by $10.6 million with a corresponding $5.2 million increase in income tax expense over the same period in 2019. The effective tax rate (“ETR”) for the three months ended December 31, 2020 was 33% compared to 5% for the same period in 2019. Excluding the one-time items, as referenced above, the 2019 ETR would have been 46%. The impact of: (1) a strong Mexican Peso on local currency denominated non-monetary assets lowered the ETR by 8% and (2) the early adoption of amendments to IAS16, Property, Plant and Equipment – Proceeds before intended use, lowered the ETR by 18 percentage point. Income tax expense for the year ended December 31, 2020 was $37.4 million or $17.2 million higher than the $20.2 million reported in the same period in 2019. The effective tax rate was 63% compared to 46% for the same period in 2019. Factors that contributed to a high ETR were the impact of foreign exchange fluctuations (+13%) on the translation of local currency denominated non-monetary assets, and tax benefits not recognized (+6%). The Company is subject to tax in various jurisdictions, including Peru, Mexico, Argentina and Canada. There are a number of factors that can significantly impact the Company’s effective tax rate including the geographic distribution of income, variations in our income before income taxes, varying rates in different jurisdictions, the non-recognition of tax assets, local inflation rates, fluctuation in the value of the United States dollar and foreign currencies, changes in tax laws and the impact of specific transactions and assessments. As a result of the number of factors that can potentially impact the effective tax rate and the sensitivity of the tax provision to these factors, the effective tax rate will fluctuate, sometimes significantly. This trend is expected to continue in future periods.

Fortuna Silver Mines Inc.
Management's Discussion and Analysis, page 18
Results of Operations
San Jose Mine Operating Results The San Jose Mine is an underground silver-gold mine located in the state of Oaxaca in southern Mexico. The following table shows the key metrics used to measure the operating performance of the mine: throughput, head grade, recovery, gold and silver production and unit costs:
Three months ended Years ended December 31, December 31,
2020 2019 2020 2019
Mine Production Tonnes milled 272,179 273,066 934,381 1,068,722 Average tonnes milled per day 3,024 3,034 2,647 3,028
Silver
Grade (g/t) 206 249 224 252 Recovery (%) 91 91 92 91 Production (oz) 1,648,816 2,002,633 6,165,606 7,868,478 Metal sold (oz) 1,721,697 1,968,550 6,225,433 7,849,438 Realized price ($/oz) 24.45 17.34 21.26 16.20
Gold
Grade (g/t) 1.26 1.50 1.38 1.57 Recovery (%) 91 91 91 91 Production (oz) 10,095 11,993 37,805 48,880 Metal sold (oz) 10,594 11,870 38,391 48,731 Realized price ($/oz) 1,875 1,483 1,786 1,393
Unit Costs
Production cash cost ($/t)2 71.45 70.19 69.38 69.60 Production cash cost ($/oz Ag Eq)1,2 8.91 6.82 7.62 6.74 Net smelter return ($/t) 203.80 181.85 199.22 172.04 All-in sustaining cash cost ($/oz Ag Eq)1,2 14.52 10.54 12.15 9.83
Capital expenditures ($000's) Sustaining 5,022 3,737 11,540 9,969 Brownfields 802 649 3,319 4,077
Notes: 1 Production cash cost silver equivalent and All-in sustaining cash cost silver equivalent are calculated using realized metal prices for each period respectively 2 Production cash cost, Production cash cost silver equivalent, and All-in sustaining cash cost silver equivalent are Non-GAAP Financial Measures. Refer to Non-GAAP Financial Measures.
Quarterly and Annual Results The San Jose Mine produced 1,648,816 ounces of silver and 10,095 ounces of gold during the three months ended December 31, 2020, which represents an 18% and 16% decrease over the same period in 2019. The decrease in production was due to lower head grades which were consistent with the adjusted mine sequencing after the restart of production at the end of May 2020 following the Mexican government mandated suspension of operations to curb the spread of COVID-19. Annual production of silver and gold totaled 6,165,606 ounces and 37,805 ounces, respectively, a decrease of 22% and 23% from 2019. The decrease in production was due to a 54-day government mandated suspension of mining operations in the

Fortuna Silver Mines Inc.
Management's Discussion and Analysis, page 19
second quarter of 2020 related to the COVID-19 pandemic and lower silver and gold head grades of 11% and 12% (refer to Fortuna news release dated May 26, 2020). The cash cost per tonne for the three months ended December 31, 2020 was $71.45 per tonne (refer to Non-GAAP Financial Measures) compared to $70.19 per tonne in the same period in 2019. COVID-19 related expenses in the quarter were $0.40 per tonne. Cash cost per tonne for the full year 2020 was consistent year-over-year at $69.38 per tonne compared to $69.60 per tonne for 2019. COVID-19 related expenses for the full year were $0.70 per tonne. Cash costs incurred during the government mandated temporary suspension of mining operations in the second quarter of 2020 totaled $2.1 million and were recorded as care and maintenance costs. The all-in sustaining cash cost of payable silver equivalent for the full year 2020 increased 24% to $12.15 per ounce due primarily to lower production resulting from the COVID-19 related temporary suspension, higher sustaining capital expenditures, and higher royalty and mining taxes associated with higher metal prices.

Fortuna Silver Mines Inc.
Management's Discussion and Analysis, page 20
Caylloma Mine Operating Results Caylloma is an underground silver, lead and zinc mine located in the Arequipa Department in southern Peru. Its commercial products are silver-lead and zinc concentrates. The table below shows the key metrics used to measure the operating performance of the mine: throughput, head grade, recovery, silver, lead and zinc production and unit costs:
Three months ended Years ended December 31, December 31,
2020 2019 2020 2019
Mine Production Tonnes milled 136,132 133,271 510,047 531,307 Average tonnes milled per day 1,530 1,481 1,433 1,497
Silver
Grade (g/t) 73 71 72 66 Recovery (%) 82 82 82 83 Production (oz) 263,921 249,284 968,111 941,289 Metal sold (oz) 262,356 252,780 967,199 948,616 Realized price ($/oz) 24.30 17.31 20.63 16.23
Lead
Grade (%) 3.16 2.84 3.00 2.72 Recovery (%) 89 89 88 90 Production (000's lbs) 8,426 7,441 29,628 28,746 Metal sold (000's lbs) 8,386 7,559 29,582 28,969 Realized price ($/lb) 0.86 0.92 0.83 0.91
Zinc
Grade (%) 4.69 4.48 4.61 4.36 Recovery (%) 88 88 88 89 Production (000's lbs) 12,434 11,614 45,545 45,600 Metal sold (000's lbs) 12,154 11,974 45,154 45,781 Realized price ($/lb) 1.18 1.08 1.03 1.15
Unit Costs
Production cash cost ($/t)2 87.02 85.86 81.29 86.15 Production cash cost ($/oz Ag Eq)1,2 15.38 11.67 14.57 10.92 Net smelter return ($/t) 163.57 138.07 131.40 137.77 All-in sustaining cash cost ($/oz Ag Eq)1,2 19.51 15.40 17.79 14.30
Capital expenditures ($000's) Sustaining 2,364 2,487 6,406 10,440 Brownfields 106 214 521 700
Notes: 1 Production cash cost silver equivalent and All-in sustaining cash cost silver equivalent are calculated using realized metal prices for each period respectively. 2 Production cash cost, Production cash cost silver equivalent, and All-in sustaining cash cost silver equivalent are Non-GAAP Financial Measures. Refer to Non-GAAP Financial Measures.

Fortuna Silver Mines Inc.
Management's Discussion and Analysis, page 21
Quarterly and Annual Results The Caylloma Mine produced 263,921 ounces of silver, 8.4 million pounds of lead and 12.4 million pounds of zinc during the three months ended December 31, 2020, and were 6%, 13%, and 7% higher than the same period in 2019. The increased metal production was due mainly to higher head grades. Gold production totaled 1,827 ounces with an average head grade of 0.60 g/t. Annual production of silver, lead and zinc totaled 968,111 ounces, 29.6 million pounds of lead, and 45.5 million pounds of zinc, which represent a 3% increase in silver and lead while zinc production was flat year-over-year. Gold production for the full year 2020 totaled 4,109 ounces, which was an increase of 150% over 2019, with an average head grade of 0.41 g/t. Gold production was positively impacted by unusually high head grades compared to the reserve model at the Animas NE vein. The exploration team is carrying out work to understand the occurrence and controls of these higher-grade zones that can carry gold grades as high as 10 g/t. Production for the full year was not impacted despite government mandated restrictions, (refer to Fortuna news release dated March 17, 2020), and a voluntary three-week suspension of operations in July (refer to Fortuna news release dated July 28, 2020), as lower throughput of 4% was offset by higher average head grades for the full year. The cash cost per tonne of processed ore for the three months ended December 31, 2020 increased 1% to $87.02 (refer to Non-GAAP Financial Measures) compared to $85.86 in the same period in 2019. COVID-19 related expenses in the quarter were $5.30 per tonne. The cash cost per tonne of processed ore for the full year 2020 decreased 6% to $81.29 compared to $86.15 for the full year 2019 and reflects cost reduction initiatives the Company implemented during the second and third quarter to address the impact of COVID-19 on our operations. COVID-19 related expenses for the full year were $3.10 per tonne. Cash cost incurred during the government mandated temporary suspension of mining operations in the third quarter of 2020, totaled $0.9 million and were recorded as care and maintenance costs. The all-in sustaining cash cost for the three months ended December 31, 2020 increased 27% to $19.51 per ounce compared to $15.40 per ounce for the same period in 2019. The increase was driven by COVID-19 related expenses and higher treatment charges in the quarter. The all-in sustaining cash cost for the full year 2020 increased 24% to $17.79 per ounce compared to $14.30 per ounce in 2019 due to the changes in the prices of lead and zinc relative to the silver price, which affects the silver equivalent calculation. As a result of the changes in relative prices, the ounces of payable silver equivalent decreased 18% to 4,308,239 ounces compared to 5,252,403 ounces in 2019 despite a 13% and 7% increase in the annual production of lead and zinc.

Fortuna Silver Mines Inc.
Management's Discussion and Analysis, page 22
Lindero Mine Operating Results
The Lindero Mine is an open pit gold mine located in in northern Argentina. The following table shows the key metrics used to measure the operating performance of the mine: throughput, head grade, recovery, and gold production:
Three months ended Years ended December 31, December 31,
2020 2019 2020 2019
Mine Production Tonnes placed on the leach pad 950,000 - 1,610,000 - Average tonnes crushed per day 10,406 - 8,831 -
Gold
Grade (g/t) 1.13 - 1.00 - Recovery (%) 50 - 50 - Production (oz) 13,435 - 13,435 - Metal sold (oz) 10,935 - 10,935 - Realized price ($/oz) 1,853 - 1,853 -
Capital expenditures ($000's) Sustaining 1,410 - 1,410 -
Quarterly and Annual Results In the fourth quarter of 2020, a total of 950,000 tonnes of ore were placed on the heap leach pad averaging 1.13 g/t gold, containing an estimated 34,000 ounces of gold. First gold was poured at Lindero in October 2020, and gold production for the fourth quarter of 2020 was 13,435 ounces of gold. For the full year 2020, a total of 1.61 million tonnes of ore have been placed on the heap leach pad averaging 1.00 g/t gold, containing an estimated 52,000 ounces of gold. Cash cost per ounce of gold for the three and twelve months ended December 31, 2020 was $657.14 per ounce. Quarterly Information The following table provides information for the last eight fiscal quarters up to December 31, 2020:
Expressed in $ millions, except per share amount
Q4 2020 Q3 2020 Q2 2020 Q1 2020 Q4 2019 Q3 2019 Q2 2019 Q1 2019
Sales 103.5 83.4 44.5 47.5 69.0 61.3 67.9 59.0 Mine operating income 46.7 42.1 13.8 7.5 23.4 16.7 23.0 21.5 Operating income (loss) 28.2 28.5 (1.3) 1.8 9.0 (1.5) 15.7 10.9 Net income (loss) 18.6 13.1 (5.7) (4.5) 19.0 (7.7) 10.3 2.2 Basic earnings (loss) per share 0.10 0.07 (0.03) (0.03) 0.12 (0.05) 0.07 0.01 Diluted earnings (loss) per share 0.09 0.07 (0.03) (0.03) 0.12 (0.05) 0.07 0.01 Total assets 1,055.3 987.8 959.4 957.7 936.1 871.5 823.3 796.7 Debt 158.6 133.1 132.6 187.1 146.5 109.4 69.4 69.3
Sales increased 24% in the fourth quarter of 2020 to $103.5 million compared to $83.4 million in the third quarter of 2020 due primarily to the recognition of $20.3 million of gold sales and $10.1 million of cost of sales from commissioning activities at Lindero Mine as the Company elected to early adopt the amendments to IAS 16, Property, Plant and Equipment – Proceeds

Fortuna Silver Mines Inc.
Management's Discussion and Analysis, page 23
before Intended Use. Sales at San Jose decreased $4.2 million to $60.5 million quarter-over-quarter due to lower volume of silver and gold sold while sales at Caylloma increased $3.9 million. Share-based payments increased 24% to $4.5 million as the result of a 23% increase in the Company’s share price which impacts the cash-settled share units. With construction of the Lindero Mine substantially complete, the Company ceased capitalization of interest at the end of November 2020 and expensed $0.7 million of borrowing costs. Net income increased $5.5 million to $18.6 million over the prior quarter. Sales increased 87% in the third quarter of 2020 to $83.4 million compared to $44.5 million in the second quarter of 2020 due to increases in the prices of silver and gold and the resumption of operations at the San Jose Mine after a 54-day temporary suspension of the mine in the second quarter. Mine operating income more than tripled to $42.1 million despite a 21-day temporary suspension of the Caylloma mine in July. The costs incurred during the suspension of operations totaled $0.9 million and are reported as care and maintenance costs. Income tax expense also increased $8.8 million over the second quarter to $15.0 million due primarily to higher pre-tax profit from the San Jose Mine, which impacted net income for the period. Sales decreased 6% in the second quarter of 2020 to $44.5 million compared to $47.5 million in the first quarter of 2020. The primary reason for the decrease was the 54-day government mandated temporary suspension of the San Jose Mine as part of the Mexican Government’s response to curb the spread of COVID-19 which severely curtailed silver and gold production by 34% and 31% despite higher silver and gold prices. The net loss included $2.0 million of care and maintenance costs incurred during the 54-day suspension of the San Jose Mine and higher share-based payment expense, which were partially offset by $2.2 million of investment gains from cross-border bond trades. Sales decreased 31% in the first quarter of 2020 to $47.5 million compared to $69.0 million in the fourth quarter of 2019. The decrease in sales was due primarily to the beginning of the COVID-19 pandemic in mid-March which severely impacted metal prices and combined with a planned change in mine sequencing at the San Jose Mine, caused lower grade material to be mined. This reduction in production resulted in a decrease in the volume of silver and gold ounces sold of 14% and 17%, respectively, and mine operating income decreased $15.9 million quarter-over-quarter. Partially offsetting the lower mine operating income were lower mine site and corporate administration costs and lower share-based payment expense as the Company’s share price declined in the quarter impacting the valuation of cash-settled share units. Sales increased 13% in the fourth quarter of 2019 to $69.0 million compared to $61.3 million in the third quarter of 2019 due primarily to a 15% and 7% increase in the volume of silver and gold ounces sold, respectively. Cash mine operating costs at the San Jose and Caylloma Mines were 6% higher and 4% lower, respectively. Pre-tax income included $11.0 million of investment gains from cross-border securities trades.

Fortuna Silver Mines Inc.
Management's Discussion and Analysis, page 24
Precious Metal Prices Trends
For the year ended December 31, 2020, the sale of silver and gold ounces represents approximately 91% of the Company’s sales revenue while lead and zinc make up the remaining 9%. Therefore, the prices of silver and gold are the most dominant factors in determining the Company’s profitability and cash flow from operations. The prices of gold and silver are subject to volatile fluctuations over short periods of time and can be affected by numerous macroeconomic conditions, including supply and demand factors, value of the U.S. dollar, interest rates and global economic and political issues. The Company’s financial performance is expected to continue to be closely linked to the prices of silver and gold. The metal price environment for silver and gold has evolved during the COVID-19 pandemic. Since the low of $1,498 per ounce in March 2020, gold steadily edged higher to close at $1,768 per ounce at the end of June. Gold continued to trend higher and peak at $2,067 per ounce on August 6, 2020 before retracing to close at $1,902 per ounce at the end of September. The price of gold traded at a high of $1,940 per ounce in early November and a low of $1,760 per ounce at the end of November before recovering to close at $1,888 per ounce on December 31, 2020. This represents a 25% increase in the price of gold since the start of 2020. The US federal government and the U.S. Treasury provided monetary and fiscal stimulus to the US economy which have helped to spur increases in the prices of silver and gold. The silver price plummeted to multi-year lows in March 2020 when U.S. stock markets had their greatest single day fall since the 1987 crash as silver fell from $17.02 per ounce to $12.01 per ounce on March 19, a decline of 29%. Following the March lows, the price of silver showed resilience during the second and third quarter of 2020 trending higher month-over-month and peaked at $29.37 per ounce on August 6, 2020, before retracing to close at $23.35 per ounce at the end of September. The price of silver closed at $26.30 as at December 31, 2020, a 47% increase since the start of 2020.
10
12
14
16
18
20
22
24
26
28
30
1,000
1,200
1,400
1,600
1,800
2,000
2,200
1-Dec-17 1-Mar-18 1-Jun-18 1-Sep-18 1-Dec-18 1-Mar-19 1-Jun-19 1-Sep-19 1-Dec-19 1-Mar-20 1-Jun-20 1-Sep-20 1-Dec-20
Precious Metal Prices
LBMA Gold Price PM ($/ozt) LBMA Silver Price ($/ozt)

Fortuna Silver Mines Inc.
Management's Discussion and Analysis, page 25
Liquidity and Capital Resources
Cash and Cash Equivalents The Company had cash and cash equivalents of $131.9 million at December 31, 2020, an increase of $48.5 million since the beginning of the year. The increase was due primarily to $93.4 million of net cash generated from operations, which was net of $21.8 million of preproduction costs to produce ore stockpile and supplies inventory that was spent during the construction of the Lindero Mine. The Company also received $65.6 million of net proceeds from a bought deal equity financing in the second quarter and drew the remaining $10.0 million from the Credit Facility. Uses of funds include $79.5 million on construction, of the Lindero Mine, $24.1 million on sustaining and non-sustaining capital and brownfields exploration and $13.4 million of value added tax payments mainly from the construction of the Lindero Mine. The Company’s investment objectives for its cash balances, in order of priority, are to preserve capital, to ensure liquidity and to maximize returns. The Company’s strategy to achieve these objectives is to invest its excess cash balance in a portfolio of primarily fixed income instruments with specified credit rating targets established by the Board of Directors of the Company. The Company does not own any asset-based commercial paper or other similar at-risk investments in its investment portfolios.
Working Capital
Working capital at December 31, 2020 increased $89.2 million during the year to $151.6 million, which included a $37.0 million value added tax (“VAT”) receivable that was reclassified from long-term compared to $62.9 million at December 31, 2019. This VAT related to the amounts paid, net of foreign exchange impact, on the Lindero construction project and was reclassified to current after the Argentine tax authorities approved the application for a partial refund of value added taxes paid and there was confirmation of payment. Subsequent to December 31, 2020, the Company received a refund of $10.1 million and interest of $1.1 million, which approximates the amount of the expected refund.
Capital Resources As at December 31, 2020, the Company had fully drawn $40 million from its non-revolving credit facility and the $80 million from its revolving credit facility (collectively, the “Credit Facility”). The revolving portion of the Credit Facility, which had temporarily increased from $80 million to $110 million, effective December 18, 2018, reverted back to a limit of $80 million as of December 31, 2020, which has been fully drawn. The interest rate on the revolving credit facility is on a sliding scale at one-month LIBOR plus an applicable margin ranging from 2.5% to 3.5%, based on the Company’s Net Senior Secured Debt to EBITDA Ratio as defined in the Credit Facility. The Credit Facility is secured by a first ranking lien on the assets of the San Jose and Caylloma mines as well as their holding companies.
(Expressed in $ millions) December 31, 2020 December 31, 2019 Change
Cash and cash equivalents 131.9 83.4 48.5 Credit facility 120.0 150.0 (30.0)
Total liquidity available 251.9 233.4 18.5 Amount drawn on credit facility (120.0) (110.0) (10.0)
Net liquidity position 131.9 123.4 8.5
As at December 31, 2020, the Company was in compliance with its financial covenants. The full extent and impact of COVID-19 on the Company’s operations and financial condition continues to be difficult to ascertain until the duration of the outbreak, the severity of the virus and the ability to treat it can reasonably be predicted, and when the government of the countries which host our operations lift restrictions on business activities. In the event of an unexpectedly prolonged duration of COVID-19, or in the event that more rigorous capital controls are implemented in

Fortuna Silver Mines Inc.
Management's Discussion and Analysis, page 26
Argentina, the Company may be required to raise additional debt or equity. There is no assurance that the lenders will agree to such a request or that financing will be available to the Company on terms acceptable to it. The Company does not have unlimited financial resources and there is no assurance that sufficient additional funding or financing will be available when needed by the Company or its direct and indirect subsidiaries on acceptable terms, or at all, to further explore or develop its properties or to fulfill its obligations under any applicable agreements. Fortuna is a multinational company and relies on financial institutions worldwide to fund corporate and project needs. Instability of large financial institutions may impact the ability of the Company to obtain equity or debt financings in the future and, if obtained, on terms that may not be favorable to the Company. Disruptions in the capital and credit markets as a result of uncertainty, geo-political events, changing or increased regulations of financial institutions, reduced alternatives or failures of significant financial institutions could adversely affect the Company’s access to the liquidity needed for the business in the longer term. The Company may incur substantial debt from time to time to finance working capital, capital expenditures, investments or acquisitions or for other purposes. If the Company does so, the risks related to the Company’s indebtedness could intensify, including: (i) increased difficulty in satisfying existing debt obligations (ii) limitations on the ability to obtain additional financings, or imposed requirements to make non-strategic divestures (iii) impose hedging requirements (iv) imposed restrictions on the Company’s cash flows, for debt repayments or capital expenditures (v) increased vulnerability to general adverse economic and industry conditions (vi) interest rate risk exposure as borrowings may be at variable rates of interest (vii) decreased flexibility in planning for and reacting to changes in the mining industry (viii) reduced competitiveness versus less leveraged competitors, and (ix) increased cost of borrowings. Subject to the various risks and uncertainties, as explained in the Risks and Uncertainties section, management believes the Company’s mining operations will generate sufficient cash flows and the Company has sufficient available credit lines and cash on hand to fund the construction of the Lindero Mine and planned capital and exploration programs. The Company has contingencies and capital commitments as described in the Note 33 “Contingencies and Capital Commitments” in the Company’s annual audited consolidated financial statements. From time to time, the Company may also be involved in legal proceedings that arise in the ordinary course of its business. Off-Balance Sheet Arrangements The Company does not have any off-balance sheet arrangements or commitments that are expected to have a current or future effect on the financial condition, results of operations, liquidity, capital expenditures, or capital resources that are material to investors. Financial Instruments
The Company does not utilize complex financial instruments in hedging foreign exchange or interest exposure. Any hedging activity requires approval of the Company’s Board of Directors. The Company will not hold or issue derivative instruments for speculative or trading purposes. Provisional priced trade receivables of $26.3 million and an interest rate swap (notional amount of $40.0 million), forward sales, and forward fuel contracts liability totaling $1.3 million are the Company’s only level 2 fair valued financial instruments and no level 3 instruments are held. Provisionally priced trade receivables are valued using forward London Metal Exchange prices until final prices are settled at a future date. The interest rate swap is measured at estimated fair value.

Fortuna Silver Mines Inc.
Management's Discussion and Analysis, page 27
Related Party Transactions The Company has entered into the following related party transactions during the three and twelve months ended December 31, 2020 and 2019: (a) Purchase of Goods and Services The Company was charged for general and administrative services pursuant to a shared services agreement with Gold Group Management Inc., a company of which Simon Ridgway, the Company’s former Chairman, is a director.
Years ended December 31, (Expressed in $ thousands) 2020 2019
Personnel costs 19 21 General and administrative expenses 138 189
157 210
As at December 31, 2020, the Company had an outstanding balance payable to Gold Group Management Inc. of $5 (December 31, 2019 - $14). Amounts due to related parties are due on demand and are unsecured. Effective February 2, 2021, Mr. Ridgway stepped down as a director and Chairman of the Board of Directors of the Company. (b) Key Management Personnel During the years ended December 31, 2020 and 2019, the Company was charged for consulting services by Mario Szotlender, a director of the Company, and by Mill Street Services Ltd., a company of which Simon Ridgway, the Company’s former Chairman, is a director. Such amounts, along with other amounts paid to key management personnel are as follows:
Years ended December 31,
(Expressed in $ thousands) 2020 2019
Salaries and benefits 4,266 4,716 Directors fees 707 702 Consulting fees 134 135 Share-based payments 11,115 5,449
16,222 11,002
Amendments to Accounting Standards That Have Been Issued In September 2019, the IASB issued first phase amendments IFRS 9 Financial Instruments, IAS 39 Financial Instruments: Recognition and Hedging and IFRS 7 Financial Instrument Disclosures to address the financial reporting impact of the reform on interest rate benchmarks, such as the discontinuance of the interbank offered rates. This amendment is effective on January 1, 2020 and the first phase amendment is focused on the impact to hedge accounting requirements. The Company adopted the first phase amendment and there was no material impact on its consolidated financial statements. The Company will continue to assess the effect of amendments related to the interest rate benchmark reform on its consolidated financial statements.
On May 14, 2020, the IASB published a narrow scope amendment to IAS 16 Property, Plant and Equipment - Proceeds before Intended Use. The amendment prohibits deducting from the cost of property, plant and equipment amounts received from selling items produced while preparing the asset for its intended use. Instead, amounts received will be recognized as sales proceeds and related cost in profit or loss. The effective date is for annual periods beginning on or after January 1, 2022,

Fortuna Silver Mines Inc.
Management's Discussion and Analysis, page 28
with early adoption permissible. The Company has elected to early adopt the amendment to IAS 16 Standard for the year ended December 31, 2020 and has recognized $20.3 million of gold sales and related cost of sales of $10.1 million in the income statement.
Risks and Uncertainties The Company is exposed to many risks in conducting its business, including but not limited to metal price risk as the Company derives its revenue from the sale of silver, gold, lead and zinc; credit risk in the normal course of business; foreign exchange risk as the Company reports its financial statements in U.S. dollars whereas the Company operates in jurisdictions that conducts its business in other currencies; the inherent risks of uncertainties in estimating mineral reserves and mineral resources; the risk in relation to the construction, the timing of completion of commissioning and the commencement of commercial production at the Lindero Mine; operational risks related to the spread of the COVID-19 pandemic; political risks, exchange rate and capital controls risk, environmental risks; and risks related to its relations with employees. These and other risks are described below and in the Company’s audited consolidated financial statements for 2020, its Annual Information Form which is available on SEDAR at www.sedar.com, and its Form 40-F filed with the SEC. Readers are encouraged to refer to these documents for a more detailed description of some of the risks and uncertainties inherent to the Company’s business.
Foreign Jurisdiction Risk The Company currently conducts its operations in Peru, Mexico and Argentina. All these jurisdictions are potentially subject to a number of political and economic risks, including those described in the following section. The Company is unable to determine the impact of these risks or its future financial position or results of operations and the Company’s exploration, development and production activities may be substantially affected by factors outside of the Company’s control. These potential factors include but are not limited to royalty and tax increases or claims by governmental bodies, expropriation or nationalization, lack of an independent judiciary, foreign exchange controls, capital and currency controls, import and export regulations, cancellation or renegotiation of contracts and environmental and permitting regulations. The Company has no political risk insurance coverage against these risks. The majority of the Company’s production and revenue to December 31, 2020 was derived from its operations in Peru and Mexico. As the Company’s business is carried on in a number of developing countries, it is exposed to a number of risks and uncertainties, including the following: expropriation or nationalization without adequate compensation especially in Argentina which has a history of expropriation where the Company is currently in the process of commissioning the Lindero Mine; changing political and fiscal regimes, and economic and regulatory instability; unanticipated changes to royalty and tax regulations; unreliable and undeveloped infrastructure, labor unrest and labor scarcity; difficulty procuring key equipment and components for equipment; import and export regulation and restrictions; the imposition of capital controls which may affect the repatriation of funds; high rates of inflation; extreme fluctuations in foreign exchange rates and the imposition of currency controls; inability to obtain fair dispute resolution or judicial determination because of bias, corruption or abuse of power; difficulties enforcing judgments; difficulties understanding and complying with regulatory and legal framework with respect to ownership and maintenance of mineral properties, mines and mining operations, local opposition to mine development projects, which include the potential for violence, property damage and frivolous or vexatious claims; terrorism and hostage taking; military repression and increased likelihood of international conflicts or aggression; increased public health concerns. Certain of these risks and uncertainties are prevalent in the jurisdictions where the Company operates. There can be no assurance that these measures will not be extended or that more restrictive measures will be put in place in the countries in which the Company operates, which may result in the suspension of operations or construction at the Company’s mines on a short or long-term basis.

Fortuna Silver Mines Inc.
Management's Discussion and Analysis, page 29
Estimating Mineral Resources and Mineral Reserves There is a degree of uncertainty attributable to the estimation of Mineral Resources, Mineral Reserves and expected mineral grades. Until mineral deposits are actually mined and processed, Mineral Resources, Mineral Reserves must be considered as estimates only. Any such estimates are expressions of judgment based on knowledge, mining experience, analysis of drilling results and industry practices.
Mineral Resources and Mineral Reserves may require revision based on actual production experience. Market fluctuations in the price of metals, as well as increased production costs and reduced metallurgical recovery rates, may render certain Mineral Reserves uneconomic and may ultimately result in a restatement of Mineral Resources and/or Mineral Reserves. Short-term operating factors relating to the Mineral Resources and Mineral Reserves, such as the need for sequential development of ore bodies, may adversely affect the Company’s profitability in any accounting period. Estimates of operating costs are based on assumptions including those relating to inflation and currency exchange, which may prove incorrect. Estimates of mineralization can be imprecise and depend upon geological interpretation and statistical inferences drawn from drilling and sampling analysis, which may prove to be unreliable. In addition, the grade and/or quantity of precious metals ultimately recovered may differ from that indicated by drilling results. There can be no assurance that precious metals recovered in small scale tests will be duplicated in large scale tests under onsite conditions or in production scale. Amendments to mine plans and production profiles may be required as the amount of Mineral Resources changes or upon receipt of further information during the implementation phase of the project. Extended declines in market prices for gold, silver and other metals may render portions of the Company’s mineralization uneconomic and result in reduced reported mineralization. Any material reduction in estimates of mineralization, or in the Company’s ability to develop its properties and extract and sell such minerals, could have a material adverse effect on the Company's results of operations or financial condition.
Mining Operations The capital costs required by the Company’s projects may be significantly higher than anticipated. Capital and operating costs, production and economic returns, and other estimates contained in the Company’s current technical reports, may differ significantly from those provided for in future studies and estimates and from management guidance, and there can be no assurance that the Company’s actual capital and operating costs will not be higher than currently anticipated. In addition, delays to construction and exploration schedules may negatively impact the net present value and internal rates of return of the Company’s mineral properties as set forth in the applicable technical report. Similarly, there can be no assurance that historical rates of production, grades of ore processed, rates of recoveries or mining cash costs will not experience fluctuations or differ significantly from current levels over the course of the mining operations. In addition, there can be no assurance that the Company will be able to continue to extend the production from its current operations through exploration and drilling programs.
Uncertainties and Risks Related to the Completion of Commissioning and Commencement of Production at the Lindero Mine
The Company is subject to inherent uncertainties and risks related to the commencement of commercial production at the Lindero Mine, the principal of which include: delays in pre-commissioning, and ramp-up to commercial production; delays associated with contractors; budget overruns due to changes in costs of fuel, labour, power, materials and supplies, inflation and exchange rate risks and potential opposition from non-governmental organizations, environmental groups or local groups which may delay or prevent activities. The Company’s ability to meet construction, development, and production schedules and cost estimates for the Lindero Mine cannot be assured. The Company has prepared estimates of capital costs and/or operating costs for the Lindero Mine, but no assurance can be given that such estimates will be achieved. Delays in the commencement of commercial production, failure to achieve cost estimates or material increases in costs due to increases in foreign exchange rates; continuation of capital controls imposed in Argentina; imposition of exchange control restrictions; and delays in obtaining

Fortuna Silver Mines Inc.
Management's Discussion and Analysis, page 30
the value added tax refunds, could have an adverse impact in future cash flows, profitability, results of operations and financial condition of the Company.
Environmental Uncertainties All phases of the Company’s operations are subject to environmental regulation in the various jurisdictions in which it operates. These laws address emissions into the air, discharges into water, management of waste, management of hazardous substances, protection of natural resources, antiquities and endangered species and reclamation of lands disturbed by mining operations. The Company’s operations generate chemical and metals depositions in the form of tailings. The Company’s ability to obtain, maintain and renew permits and approvals and to successfully develop and operate mines may be adversely affected by real or perceived impacts associated with the Company’s activities or of other mining companies that affect the environment, human health and safety. Environmental hazards may exist on the Company’s properties which are unknown to the Company at present and were caused by previous or existing owners or operators of the properties, for which the Company could be held liable. Environmental legislation is evolving in a manner requiring stricter standards and enforcement, increased fines and penalties for non-compliance, more stringent environmental assessments of proposed projects and a heightened degree of responsibility for companies and their officers, directors and employees. Compliance with environmental laws and regulations may require significant capital outlays on behalf of the Company and may cause material changes or delays in the Company's intended activities. Failure to comply with applicable environmental laws, regulations and permitting requirements may result in enforcement actions thereunder, including orders issued by regulatory or judicial authorities, causing operations to cease or be curtailed. Such enforcement actions may include the imposition of corrective measures requiring capital expenditure, installation of new equipment or remedial action. There is no assurance that future changes in environmental regulation, if any, will not adversely affect the Company’s operations.
Uncertainties and Risks Relating to COVID-19 The outbreak of COVID-19, which was declared a global pandemic by the World Health Organization in March 2020 and has resulted in a wide spread global health crisis. The novel strain of COVID-19 emerged from China and spread to other countries including Peru, Mexico, Argentina and Canada, the countries in which the Company operates. The international response to the spread of COVID-19 has led to significant restrictions on travel, temporary business closures, mandatory quarantines, global stock market volatility, operating and supply chain delays and disruptions, and a general reduction in consumer activity.
During the year ended December 31, 2020, our operations were negatively impacted by the spread of the COVID-19 pandemic. Operations at the San Jose Mine were suspended for 54 days in Q2 as a result of a government mandated national quarantine in Mexico, and construction activities were temporarily suspended at the Lindero Mine on March 19, 2020 for a period of 60 days due to a government mandated period of national social isolation in Argentina. In response to a period of social isolation mandated by the Peruvian government in Q1 and Q2, operations were able to continue at the Caylloma Mine, initially by drawing ore from the coarse ore stockpile during Q1, and as the stockpile decreased the mine was subsequently re-started in Q2 using a reduced taskforce in compliance with applicable Peruvian Government requirements. However, operations were voluntarily suspended at the Caylloma Mine in Q3 for 21 days, to among other things sanitize and disinfect the mine and make infrastructure improvements to accommodate social distancing guidelines.
Even though the Company has and continues to implement business continuity measures to mitigate and reduce any potential impacts of COVID-19 on its business, operations, supply chain and financial condition, the spread of COVID-19 in the countries in which it operates could have a material adverse impact on: the Company’s workforce; production at the Caylloma Mine and the San Jose Mine, the pre-production, commissioning and the commencement of commercial production at the Lindero Mine; the continued operation of its mines and exploration projects; its ability to transport and sell concentrates and doré could likewise be restricted; any of which would have an effect on the Company’s financial condition.

Fortuna Silver Mines Inc.
Management's Discussion and Analysis, page 31
Given the fast-changing situation with respect to the COVID-19 pandemic, including further waves of the virus and the emergence of variants of the virus, it is difficult to predict the exact nature and extent of the impact the pandemic may have on the Company and its business. Until the number of cases and death rate start to flatten the curve and decline, and vaccines are readily available, there is no certainty that governments may not mandate another round of extreme measures, which could include the suspension of business activities, including mining, which would have an adverse impact on our business and operations.
In addition, COVID-19 has caused: volatility in commodity prices (including gold, silver, lead and zinc); volatility in the stock markets on which the Company’s Common Shares and Debentures are listed, and in the price of the Company’s securities. The continued adverse effects of the spread of COVID-19 if not contained, could impact the Company’s ability to raise capital or refinance the Company’s debt obligations in the future, which may have a material adverse effect on the business, operations and financial condition of Company.
The Company remains focused on ensuring the health and safety of the workforce and in continuing measures to prevent and manage transmission of COVID-19 amongst the workforce and the wider community. Despite these measures, there can be no assurance that such measures will be successful.
Credit Risk Credit risk is the risk of an unexpected loss if a customer or third party to a financial instrument fails to meet its contractual obligations. All of our trade receivables from concentrate sales are held with large international metals trading companies.
The Company’s cash and cash equivalents and short-term investments are held through large financial institutions. These investments mature at various dates within one year. The Company’s maximum exposure to credit risk as at December 31, 2020 and 2019 is as follows
December 31, December 31, (Expressed in $ millions) 2020 2019
Cash and cash equivalents 131.9 83.4 Accounts receivable and other assets 76.6 47.7 Income tax receivable - 2.6 Other non-current receivables 5.5 38.4
214.0 172.1
The carrying amount of financial assets recorded in the financial statements represents the Company’s maximum exposure to credit risk. We limit our exposure to counterparty credit risk on cash and term deposits by only dealing with financial institutions with high credit ratings and through our investment policy of purchasing only instruments with a high credit rating. Almost all of our concentrate is sold to large well-known concentrate buyers.
Metal Price Risk The Company derives its revenue from the sale of silver, gold, lead and zinc. The Company’s sales are directly dependent on metal prices, and metal prices have historically shown significant volatility that is beyond the Company’s control.

Fortuna Silver Mines Inc.
Management's Discussion and Analysis, page 32
The following table illustrates the sensitivity to a +/-10% change in metal prices on the Company’s outstanding trade receivables as at December 31, 2020:
Metal (Expressed in $ millions) Change Effect on Sales
Silver +/- 10% 1.3 Gold +/- 10% 0.6 Lead +/- 10% 0.2 Zinc +/- 10% 0.3
From time to time, the Company mitigates the price risk associated with its base metal production by entering into forward sale and collar contracts for some of its forecasted base metal production and non-metal commodities. During December 2020, the Company entered into the following contracts:
● zero-cost collars for 12,300 tonnes of zinc with a floor price of $2,600 per tonne and a cap of $2,900 per tonne, maturing monthly from January 1, 2021 to December 31, 2021;
● zero-cost collars for 720,000 gallons of heating oil with a floor price of $1.40 per gallon and a cap of $1.6150 per gallon, maturing monthly from January 1, 2021 to December 31, 2021;
● zero-cost collars for 1,680,000 gallons of jet fuel with a floor price of $1.30 per gallon and a cap of $1.4775 per gallon, maturing monthly from January 1, 2021 to December 31, 2021;
● forward swaps for 720,000 gallons of heating oil with a price of $1.52 per gallon, maturing monthly from January 1, 2022 to December 31, 2022; and
● forward swaps for 1,680,000 gallons of jet fuel with a price of $1.438 per gallon, maturing monthly from January 1, 2022 to December 31, 2022.
On February 11, 2021, the Company entered into a zero-cost collars for 6,237 tonnes of lead with a floor price of $2,000 per tonne and a cap of $2,125 per tonne, maturing monthly beginning on February 1, 2021 to December 31, 2022. The zinc, lead and fuel contracts are derivative financial instruments and are not accounted for as designated hedges. They were initially recognized at fair value on the date on which the related derivative contracts were entered into and are subsequently re-measured to estimated fair value. Any gains or losses arising from changes in the fair value of the derivatives are credited or charged to profit or loss.
Currency Risk The functional and reporting currency for all entities within the consolidated group is the US dollar. We are exposed to fluctuations in foreign exchange rates as a portion of our expenses are incurred in Canadian dollars, Peruvian soles, Argentine peso and Mexican peso. A significant change in the foreign exchange rates between the United States dollar relative to the other currencies could have a material effect on the Company’s profit or loss, financial position, or cash flows. We have not hedged our exposure to foreign currency fluctuations. The following table summarizes the sensitivity to a +/-10% change in foreign currency exchange rates on the Company’s foreign currency exposure as at December 31, 2020:
Effect on foreign denominated Currency (Expressed in $ millions) Change items
Mexican Peso +/- 10% 2.3 Peruvian Soles +/- 10% 0.2 Argentine Peso +/- 10% 2.6 Canadian Dollar +/- 10% 1.1

Fortuna Silver Mines Inc.
Management's Discussion and Analysis, page 33
Due to the volatility of the exchange rate for Argentine Peso, the Company is applying additional measures in cash management to minimize potential losses arising from the conversion of funds. As discussed below in the capital management section, the capital controls are in effect when the Lindero Mine reaches commercial production, the Company will be required to convert the equivalent value into Argentine Peso from the export sale of all gold doré from the Lindero Mine. In addition, the Company would be required to obtain the prior consent of the Argentine Central Bank for the payment of cash dividends and distributions of profits out of Argentina. The following tables summarizes the Company’s exposure to currency risk through the following assets and liabilities denominated in foreign currencies:
December 31, 2020
(In millions of local currency)
Canadian Dollars
Peruvian Soles
Mexican Pesos
Argentine Pesos
Cash and cash equivalents 1.4 9.7 3.1 2.3 Marketable securities 1.3 - - - Trade and VAT receivables 0.1 3.6 108.6 3,281.8 Income tax receivable - 6.9 - - VAT - long term receivable - - 67.5 - Trade and other payables (17.8) (28.0) (311.7) (764.3) Due to related parties - - - - Provisions, current - 0.1 (4.9) (77.5) Income tax payable - (0.3) (297.1) - Other liabilities (0.2) - (5.2) - Provisions, non-current - (0.8) (67.1) -
Total foreign currency exposure (15.2) (8.8) (506.8) 2,442.3
US$ equivalent of foreign currency exposure (12.0) (2.4) (25.4) 29.1 Totals may not add due to rounding
December 31, 2019
(In millions of local currency)
Canadian Dollars
Peruvian Soles
Mexican Pesos
Argentine Pesos
Cash and cash equivalents 0.6 2.3 13.1 11.8 Trade and other receivables 0.3 1.8 4.0 117.5 Income tax receivable - 8.5 - - Investments in associates 1.4 - - - VAT - long term receivable - - 10.7 2,039.9 Trade and other payables (8.5) (19.4) (214.7) (1,454.4) Due to related parties - - - - Provisions, current (0.1) - (3.9) - Income tax payable - - (161.9) - Other liabilities - - (4.2) - Provisions, non-current - - (87.5) -
Total foreign currency exposure (6.3) (6.8) (444.4) 714.8
US$ equivalent of foreign currency exposure (4.8) (2.1) (23.6) 11.8
Liquidity Risk
Liquidity risk is the risk that we will not be able to meet our financial obligations as they come due. We manage our liquidity risk by continually monitoring forecasted and actual cash flows. We have in place a planning and budgeting process to help determine the funds required to support our normal operating requirements and our development plans. We aim to maintain sufficient liquidity to meet our short term business requirements, taking into account our anticipated cash flows from operations, our holdings of cash and cash equivalents, and our committed and anticipated liabilities.

Fortuna Silver Mines Inc.
Management's Discussion and Analysis, page 34
The Company manages its liquidity risk by continuously monitoring forecasted and actual cashflows. A rigorous reporting, planning and budgeting process are in place to help facilitate forecasting funding requirements, to support operations on an ongoing basis and expansion plans, if any. See also Liquidity and Capital Resources. As at December 31, 2020, the Company expects the following maturities of its financial liabilities, lease obligations, and other contractual commitments, excluding payments relating to interest:
Expected payments due by year as at December 31, 2020
Less than After (Expressed in $ millions) 1 year 1 - 3 years 4 - 5 years 5 years Total
Trade and other payables 65.3 - - - 65.3 Debt - 120.0 46.0 - 166.0 Income taxes payable 23.8 - - - 23.8 Lease obligations 7.4 6.2 4.0 14.1 31.7 Other liabilities - 2.5 - - 2.5 Capital commitments, Lindero 2 0.6 - - - 0.6 Closure and reclamation provisions 0.4 5.4 10.7 23.8 40.3
97.5 134.1 60.7 37.9 330.2 1 Figures may not add due to rounding 2 Net of $1 million of advances to contractors
Capital Management
The Company’s objective when managing its capital is to maintain its ability to continue as a going concern while at the same time maximizing the growth of its business and providing returns to its shareholders. The Company manages its capital structure and makes adjustments based on changes to its economic environment and the risk characteristics of the Company’s assets. Effective December 23, 2019, changes to Argentina’s tax laws proposed by the new Argentine Government were implemented. The changes ratified and extended legislation which was to expire on December 31, 2019 and allow the Argentine Central Bank to regulate funds coming into and flowing out of Argentina in order to maintain stability and support the economic recovery of the country. These capital controls together with additional temporary controls enacted on May 29, 2020, have the effect of: requiring exporters to convert the equivalent value of foreign currency received from the export into Argentine Pesos; requiring the prior consent of the Argentine Central Bank to the payment of cash dividends and distributions of currency out of Argentina; requiring Argentine companies to convert foreign currency loans received from abroad into Argentine Pesos; and restricting the sale of Argentine Pesos for foreign currency. In September 2020, the Argentine Central Bank approved a new resolution which requires companies to restructure sixty percent of any individual debt exceeding $1.0 million, which has at least a two-year term and is maturing between October 15, 2020 and March 31, 2021. However, this resolution does not apply to intercompany debt and the Company does not hold any external debt at Lindero. The Argentine Central Bank has also issued a temporary measure in effect until March 31, 2021, which requires the consent of the Central Bank to the repayment of certain types of intercompany loans. There can be no assurance that the temporary measure will not be extended. The Company’s capital requirement is effectively managed based on the Company having a thorough reporting, planning and forecasting process to help identify the funds required to ensure the Company is able to meet its operating and growth objectives.

Fortuna Silver Mines Inc.
Management's Discussion and Analysis, page 35
The Company’s capital structure consists of equity comprising of share capital, reserves and retained earnings as well as debt consisting of credit facilities and convertible debentures, lease obligations less cash and cash equivalents.
December 31, December 31, (Expressed in $ millions) 2020 2019
Equity 725.8 635.4 Debt 158.6 146.5 Lease obligations 19.5 23.9 Less: cash and cash equivalents (131.9) (83.4)
772.0 722.4
Figures may not add due to rounding As discussed above, the Company operates in Argentina where the new Argentine government has ratified and extended legislation to December 31, 2025 to allow the Argentine Central Bank to regulate funds coming into and flowing out of Argentina. Other than the restrictions related to these capital controls and complying with the debt covenants under the credit facilities, the Company is not subject to any externally imposed capital requirements. As at December 31, 2020, the Company was in compliance with its debt covenants. See also Liquidity and Capital Resources.
Interest Rate Risk Interest rate risk is the risk that the fair value or future cash flows of a financial instrument will fluctuate because of changes in market interest rates. Currently, our interest rate exposure mainly relates to interest earned on our cash and cash equivalents balances, interest paid on its LIBOR-based debt, and the mark-to-market value of derivative instruments which depend on interest rates. As at December 31, 2020, the Company has outstanding an interest rate swap as a hedge on the $40 million non-revolving credit facility to mitigate the interest rate risk on our debt.
Key Personnel The Company is dependent on a number of key management and employee personnel. The Company’s ability to manage its exploration, development, construction and operating activities, and hence its success, will depend in large part on the ability to retain current personnel and attract and retain new personnel, including management, technical and unskilled employees. The loss of the services of one or more key management personnel, as well as a prolonged labor disruption, could have a material adverse effect on the Company’s ability to successfully manage and expand its affairs.
Claims and Legal Proceedings The Company is subject to various claims and legal proceedings covering a wide range of matters that arise in the normal course of business. The Company may be subject to claims by local communities, indigenous groups or private land owners relating to land and mineral rights and such claimants may seek sizable monetary damages or seek the return of surface or mineral rights that may be valuable to the Company which may significantly impact operations and profitability, if lost. These matters are subject to various uncertainties and it is possible that some of these matters may be resolved with an unfavorable outcome to the Company. The Company does carry liability insurance coverage, but such coverage does not cover all risks to which the Company may be exposed to. Critical Accounting Estimates, Assumptions and Judgements Many of the amounts included in the consolidated financial statements require management to make estimates, assumptions and judgements. These estimates, assumptions and judgements are continuously evaluated and are based on management’s experience and knowledge of the relevant facts and circumstances. Areas where critical accounting estimates and assumptions have the most significant effect on the amounts recognized in the consolidated financial statements include:

Fortuna Silver Mines Inc.
Management's Discussion and Analysis, page 36
Mineral Reserves and Resources and the Life of Mine Plan
We estimate our mineral reserves and mineral resources in accordance with the requirements of National Instrument 43-101 Standards of Disclosure for Mineral Projects published by the Canadian Securities Administrators. Estimates of the quantities of the mineral reserves and mineral resources form the basis for our life of mine plans, which are used for the calculation of depletion expense under the units of production method, impairment tests, and forecasting the timing of the payments related to the environmental rehabilitation provision. Significant estimation is involved in determining the reserves and resources included within our life of mine plans. Changes in forecast prices of commodities, exchange rates, production costs or metallurgical recovery rates may result in our life of mine plan being revised and such changes could impact depletion rates, asset carrying values and our environmental rehabilitation provision. As at December 31, 2020 we have used the following long-term prices for our mineral reserve and mineral resource estimations: gold $1,600/oz, silver $21/oz, lead $2,000/t and zinc $2,270/t. In addition to the estimates above, estimation is involved in determining the percentage of mineral resources ultimately expected to be converted to mineral reserves and hence included in our life of mine plans. Our life of mine plans include a portion of inferred mineral resources as we believe this provides a better estimate of the expected life of mine for certain types of deposits, in particular for vein type structures. The percentage of inferred resources of the total tonnage included in the life of mine plans is based on site specific geological, technical, and economic considerations. Estimation of future conversion of resources is inherently uncertain and involves judgment and actual outcomes may vary from these judgments and estimates and such changes could have a material impact on the financial results. Some of the key judgments of the estimation process include geological continuity, stationarity in the grades within defined domains, reasonable geotechnical and metallurgical conditions, treatment of outlier (extreme) values, cut-off grade determination and the establishment of geostatistical and search parameters. Revisions to these estimates are accounted for prospectively in the period in which the change in estimate arises. See note 4(g)(i) to the audited consolidated financial statements for 2020.
Valuation of Mineral Properties and Exploration Properties The Company carries its mineral properties at cost less accumulated depletion and any accumulated provision for impairment. The costs of each property and related capitalized expenditures are depleted over the economic life of the property on a units-of-production basis. Costs are charged to the consolidated statement of income (loss) when a property is abandoned or when there is an impairment. The Company undertakes a review of the carrying values of mining properties and related expenditures whenever events or changes in circumstances indicate that their carrying values may exceed their estimated net recoverable amounts determined by reference to estimated future operating results and discounted net cash flows. Where previous impairment has been recorded the Company analyzes any impairment reversal indicators. An impairment loss is recognized when the carrying value of those assets is not recoverable. In undertaking this review, management of the Company is required to make significant estimates of, amongst other things, future production and sales volumes, metal prices, foreign exchange rates, mineral resource and reserve quantities, future operating and capital costs to the end of the mine’s life, and reclamation costs. These estimates are subject to various risks and uncertainties which may ultimately have an effect on the expected recoverability of the carrying values of the mining properties and related expenditures. The Company, from time to time, acquires exploration and development properties. When properties are acquired, the Company must determine the fair value attributable to each of the properties. When the Company conducts exploration on a mineral property and the results from the exploration do not support the carrying value, the property is written down to its new fair value which could have a material effect on the consolidated statement of financial position and the consolidated income statement.

Fortuna Silver Mines Inc.
Management's Discussion and Analysis, page 37
Reclamation and Other Closure Provisions The Company has obligations for reclamation and other closure activities related to its mining properties. The future obligations for mine closure activities are estimated by the Company using mine closure plans or other similar studies which outline the requirements that will be carried out to meet the obligations. Because the obligations are dependent on the laws and regulations of the countries in which the mines operate, the requirements could change as a result of amendments in the laws and regulations relating to environmental protection and other legislation affecting resource companies. As the estimate of the obligations is based on future expectations, a number of estimates and assumptions are made by management in the determination of closure provisions.
Revenue Recognition Revenue from the sale of concentrate to customer is recognized when the customer obtains control of the concentrate. A provisional invoice is issued to the customer based on the monthly average metal prices on the expected date of final settlement at which time the final sale prices will be fixed. Variations between the prices at initial recognition and final settlement may occur due to changes in the market metal prices and result in an embedded derivative in the accounts receivable. The embedded derivative is recorded at fair value each period until final settlement occurs with changes in the fair value classified as revenue. For changes in metal quantities upon receipt of new information and assays, the provisional sale quantities are adjusted.
Contingencies Contingencies can be either possible assets or possible liabilities arising from past events which, by their nature, will only be resolved when one or more future events not within our control occur or fail to occur. The assessment of such contingencies inherently involves the exercise of significant judgment and estimates of the outcome of future events. In assessing loss contingencies related to legal proceedings that are pending against the Company or unasserted claims that may result in such proceedings or regulatory or government actions that may negatively impact our business or operations, the Company with assistance from its legal counsel evaluates the perceived merits of any legal proceedings or unasserted claims or actions. A liability is recognized in the consolidated financial statements when the outcome of the legal proceedings is probable, and the estimated settlement amount can be estimated reliably. Contingent assets are not recognized in the consolidated financial statements until virtually certain. In 2017 the Mexican Geological Service (“SGM”) advised the Company that a previous owner of one of the Company’s mineral concessions located at the San Jose Mine in Oaxaca, Mexico had granted the SGM a royalty of 3% of the billing value of minerals obtained from the concession. The Company, supported by legal opinions from three independent law firms, has previously advised the Mexican mining authorities that it is of the view that no royalty is payable, and in 2018 initiated administrative and legal proceedings (the “Administrative Proceedings”) in the Mexican Federal Administrative Court (“FAC”) against the Dirección General de Minas (“DGM”) to remove reference to the royalty on the title register. The proceedings are progressing in accordance with the procedures of the FAC.
In January 2020, the Company received notice from the DGM seeking to cancel the mining concession if the royalty, in the Mexican peso equivalent of $30,000 plus VAT (being the amount of the claimed royalty from 2011 to 2019), was not paid before March 15, 2020. In February 2020, the Company initiated legal proceedings (the “Amparo Proceedings”) against the DGM in the Juzgado Séptimo de Distrito en Materia Administrativa en la Ciudad de México (“District Court”) to contest and extinguish the cancellation procedure on the grounds that the royalty is not valid, and also to stay the cancellation process. The District Court in Mexico City admitted the Company’s legal proceedings on March 2, 2020 and granted a permanent stay of execution, which protects the Company from the cancellation of the concession until a final non-appealable resolution is reached on the legality of the DGM’s cancellation procedure.

Fortuna Silver Mines Inc.
Management's Discussion and Analysis, page 38
On November 27, 2020, the District Court at first instance found that the Company suffered no harm from the initiation of the cancellation procedure and dismissed the proceedings (the “Procedural Finding”) without deciding on the merit of the Amparo Proceedings and on the validity of the royalty. The Procedural Finding does not affect the permanent stay of execution, which remains in place. The Company’s Mexican advisors are of the view that the decision of the District Court is flawed. The Company’s legal position with respect to the disputed royalty remains unchanged. The Company intends to vigorously defend its position and has filed an appeal to the Procedural Finding with the Collegiate Court in Mexico The previously obtained stay of execution protects the Company from the cancellation of the concession and remains in place until all avenues of appeal have been exhausted. In the event that the Company does not prevail in the appeal, it may be required to pay the disputed royalty in order to preserve the mining concession. If the Company is required to pay the royalty, it will do so from available capital resources.
The Company has determined that it is more likely than not that it will succeed in these proceedings; therefore, no provision has been recorded as at December 31, 2020 and December 31, 2019.
Critical Accounting Judgements in Applying the Entity’s Accounting Policies Judgements that have the most significant effect on the amounts recognized in the Company’s consolidated financial statements are as follows:
Income Taxes Deferred tax assets and liabilities are determined based on differences between the financial statement carrying values of assets and liabilities and their respective income tax bases (“temporary differences”) and losses carried forward. The determination of the ability of the Company to utilize tax loss carry-forwards to offset deferred tax liabilities requires management to exercise judgment and make certain assumptions about the future performance of the Company. Management is required to assess whether it is “probable” that the Company will benefit from these prior losses and other deferred tax assets. Changes in economic conditions, metal prices and other factors could result in revisions to the estimates of the benefits to be realized or the timing of utilization of the losses.
Assessment of Impairment and Reversal of Impairment Indicators Management applies significant judgment in assessing whether indicators of impairment or reversal of impairment exist for an asset or a group of assets which could result in a testing for impairment. Internal and external factors such as significant changes in the use of the asset, commodity prices, life of mines, tax laws or regulations in the countries that our mines operate in and interest rates are used by management in determining whether there are any indicators of impairment or reversal of previous impairments.
Functional Currency The functional currency for the Company and its subsidiaries is the currency of the primary economic environment in which each operates. The Company has determined that its functional currency and that of its subsidiaries is the U.S. dollar. The determination of functional currency may require certain judgments to determine the primary economic environment. The Company reconsiders the functional currency used when there is a change in the events and conditions which determined the primary economic environment.

Fortuna Silver Mines Inc.
Management's Discussion and Analysis, page 39
IFRS 16 Leases
Significant estimates, assumptions and judgments made by management on adoption of IFRS 16 Leases primarily included judgement about whether the lease conveys the right to use a specific asset, whether the Company obtains substantially all of the economic benefits from the use of the asset, whether the Company has the right to direct the use of the asset, evaluating the appropriate discount rate to use to discount the lease liability for each lease or groups of assets, and to determine the lease term where a contract includes renewal options. Significant estimates, assumptions and judgements over these factors would affect the present value of the lease liabilities, as well as the associated amount of the ROU asset. Share Position and Outstanding Options and Equity Based Share Units The Company has 184,195,727 common shares outstanding as at March 9, 2021. In addition, there were 3,427,106 outstanding equity-settled share-based awards as follows: Incentive stock options 1,054,570 Restricted share units 1,533,366 Performance share units 839,170 Total 3,427,106 An aggregate of 422,609 equity-settled performance share units issued in 2019 are subject to a multiplier ranging from 50% to 200% depending on the achievement level of certain performance targets. On April 20, 2020, the Company granted 815,220 equity-settled restricted share units which vest 20% on the first anniversary of the date of grant, 30% on the second anniversary and 50% on the third anniversary. The fair value of each restricted share unit on the grant date was $2.36 (C$3.32). As at December 31, 2020, the Company has $46.0 million of Debentures that are convertible at the holder’s option into common shares in the capital of the Company at a conversion price of $5.00 per share, representing a conversion rate of 200 Common Shares per $1,000 principal amount of Debentures, subject to adjustment in certain circumstances. Subject to certain exceptions in connection with a change of control of the Company, the Debentures cannot be redeemed by the Company prior to October 31, 2022. Between November 1, 2022 and prior to October 31, 2023, the Debentures may be redeemed in whole or in part from time to time at the Company’s option at a price equal to their principal amount plus accrued and unpaid interest, provided that the volume weighted average trading price of the Common Shares on the NYSE for the 20 consecutive trading days ending on the fifth trading day preceding the date on which the notice of the redemption is given is at least 125% of the Conversion Price. On and after October 31, 2023, the Debentures may be redeemed in whole or in part from time to time at the Company’s option at a price equal to their principal amount plus accrued and unpaid interest regardless of the trading price of the Common Shares. The Debentures mature on October 31, 2024 and bear interest at a rate of 4.65% per annum, payable semi-annually in arrears on the last business day of April and October, commencing on April 30, 2020.
Controls and Procedures
Evaluation of Disclosure Controls and Procedures Disclosure controls and procedures have been designed to provide reasonable assurance that all material information related to the Company is identified and communicated to management on a timely basis. Management of the Company, under the supervision of the President and Chief Executive Officer and the Chief Financial Officer, is responsible for the design and operation of disclosure controls and procedures in accordance with the requirements of National Instrument 52-109 of the Canadian Securities Administrators (“National Instrument 52-109”) and as defined in Rules 13a-15(e) and 15d-15(e) under the Securities Exchange Act of 1934, as amended (the U.S. Exchange Act).

Fortuna Silver Mines Inc.
Management's Discussion and Analysis, page 40
Management’s Report on Internal Control over Financial Reporting
The Company’s internal control over financial reporting (“ICFR”) is designed to provide reasonable assurance regarding the reliability of financial reporting and preparation of financial statements for external reporting purposes in accordance with IFRS as issued by the International Accounting Standards Board. However, due to its inherent limitations, internal control over financial reporting may not prevent or detect all misstatements and fraud. Management assesses the effectiveness of the Company’s internal control over financial reporting using the Internal Control – Integrated Framework (2013) issued by the Committee of Sponsoring Organization of the Treadway Commission (“COSO”). Management conducted an evaluation of the effectiveness of ICFR and concluded that it was effective as at December 31, 2020.
Changes in Internal Control over Financial Reporting There have been no changes in the Company’s internal control over financial reporting during the year ended December 31, 2020 that have materially affected, or are reasonably likely to materially affect, the Company’s internal control over financial reporting. Non-GAAP Financial Measures This MD&A refers to various Non-GAAP Financial Measures, including cash cost per payable ounce of silver equivalent; cash cost per tonne of processed ore; total production cash cost per tonne; all-in sustaining cash cost per payable ounce of silver equivalent production; all-in sustaining cash cost per payable ounce of silver equivalent production; free cash flow and free cashflow from ongoing operations; adjusted net income; and adjusted EBITDA. These measures are used by the Company to manage and evaluate operating performance and ability to generate cash flow and are widely reported in the mining industry as benchmarks for performance. The Company believes that certain investors use these Non-GAAP Financial Measures to evaluate the Company’s performance. However, the measures do not have a standardized meaning and may differ from measures used by other companies with similar descriptions. Accordingly, Non-GAAP Financial Measures should not be considered in isolation or as a substitute for measures of performance prepared in accordance with IFRS. The Company has calculated these measures consistently for all periods presented. To facilitate a better understanding of these measures as calculated by the Company, descriptions and reconciliations are provided here.
Cash Cost per Payable Ounce of Silver Equivalent Production and Cash Cost per Tonne of Processed Ore Cash cost per payable ounce of silver equivalent production and total production cash cost per tonne of processed ore are key performance measures that management uses to monitor performance. Management believes that certain investors also use these Non-GAAP Financial Measures to evaluate the Company’s performance. Cash cost is an industry-standard method of comparing certain costs on a per unit basis; however, they do not have a standardized meaning or method of calculation, even though the descriptions of such measures may be similar. These performance measures have no meaning under IFRS, and, therefore, amounts presented may not be comparable with similar data presented by other mining companies.

Fortuna Silver Mines Inc.
Management's Discussion and Analysis, page 41
The following tables present a reconciliation of cash cost per tonne of processed ore and cash cost per payable ounce of silver equivalent production to the cost of sales in the consolidated financial statements for the three and twelve months ended December 31, 2020 and 2019:
Three months ended Years ended SILVER MINES CASH COST SILVER EQUIVALENT December 31, December 31, (Expressed in $'000's, except unit costs) 2020 2019 2020 2019
Cost of sales 46,502 45,539 158,672 172,607 Changes in concentrate inventory (1,159) 443 (855) 969 Depletion and depreciation in concentrate inventory 738 (178) 378 (280) Inventory adjustment 3 (1,257) 5 (1,327) IFRS 16 embedded lease adjustment 726 626 2,415 2,409 Royalties and mining taxes (1,544) (1,462) (4,812) (4,134) Provision for community support - 128 101 282 Workers participation (1,989) (1,922) (7,459) (6,012) Depletion and depreciation (11,984) (11,309) (42,157) (44,357)
Cash cost A 31,293 30,608 106,288 120,157
Treatment charges 6,639 2,275 20,879 10,060 Refining charges 701 1,274 4,342 5,011
Cash cost applicable per payable ounce B 38,633 34,157 131,509 135,228 Payable ounces of silver equivalent production1 C 3,487,341 4,132,079 13,331,597 16,806,749 Cash cost per ounce of payable silver equivalent2 ($/oz) =B/C 11.08 8.27 9.86 8.05 Notes: 1 Silver equivalent production for Q4 2020 is calculated using a silver to gold ratio of 76.7:1 (Q4 2019: 85.5:1), silver to lead ratio of 1:28.2 pounds (Q4 2019: 1:18.7), and silver to zinc ratio of 1:20.6 pounds (Q4 2019: 1:16.0). Year 2020: silver gold ratio of 84.5:1 (Year 2019: 86.0:1), silver to lead ratio of 1:24.9 pounds (Year 2019: 1:17.9) and silver to zinc ratio of 1:20.0 pounds (Year 2019: 1:14.1) 2 Silver equivalents is calculated using the realized prices for gold, silver, lead, and zinc. Refer to Financial Results - Sales and Realized Prices

Fortuna Silver Mines Inc.
Management's Discussion and Analysis, page 42
Three months ended Years ended SAN JOSE MINE December 31, December 31, (Expressed in $'000's, except unit costs) 2020 2019 2020 2019
Cost of sales 31,027 30,024 104,315 114,156 Changes in concentrate inventory (1,477) 741 (1,200) 1,111 Depletion and depreciation in concentrate inventory 967 (231) 380 (325) Inventory adjustment 16 (1,235) 18 (1,235) IFRS 16 embedded lease adjustment 5 31 20 93 Royalties and mining taxes (1,411) (844) (4,289) (3,385) Workers participation (1,501) (1,779) (6,560) (5,293) Depletion and depreciation (8,179) (7,541) (27,856) (30,736)
Cash cost A 19,447 19,166 64,828 74,386 Total processed ore (tonnes) B 272,179 273,066 934,382 1,068,722
Cash cost per tonne of processed ore ($/t) =A/B 71.45 70.19 69.38 69.60
Cash cost A 19,447 19,166 64,828 74,386 Treatment charges 934 (542) 1,044 (990) Refining charges 288 1,131 2,848 4,468
Cash cost applicable per payable ounce C 20,669 19,755 68,720 77,864 Payable ounces of silver equivalent production1 D 2,319,015 2,898,204 9,023,357 11,554,107 Cash cost per ounce of payable silver equivalent2 ($/oz) =C/D 8.91 6.82 7.62 6.74
Mining cost per tonne 36.64 36.25 36.01 36.27 Milling cost per tonne 16.02 16.59 16.33 17.17 Indirect cost per tonne 11.56 9.43 9.69 8.80 Community relations cost per tonne 6.36 1.70 4.81 1.56 Distribution cost per tonne 0.87 6.22 2.54 5.80
Total production cost per tonne 71.45 70.19 69.38 69.60 Notes: 1 Silver equivalent production for Q4 2020 is calculated using a silver to gold ratio of 76.7:1 (Q4 2019: 85.5:1) and for Year 2020: silver to gold ratio of 84.0:1 (Year 2019: 86:0) 2 Silver equivalents is calculated using the realized prices for gold and silver. Refer to Financial Results - Sales and Realized Prices

Fortuna Silver Mines Inc.
Management's Discussion and Analysis, page 43
Three months ended Years ended CAYLLOMA MINE December 31, December 31, (Expressed in $'000's, except unit costs) 2020 2019 2020 2019
Cost of sales 15,475 15,515 54,357 58,451 Changes in concentrate inventory 318 (298) 345 (142) Depletion and depreciation in concentrate inventory (229) 53 (2) 45 Inventory adjustment (13) (22) (13) (92) IFRS 16 embedded lease adjustment 721 595 2,395 2,316 Royalties and mining taxes (133) (618) (523) (749) Provision for community support - 128 101 282 Workers participation (488) (143) (899) (719) Depletion and depreciation (3,805) (3,768) (14,301) (13,621)
Cash cost A 11,846 11,442 41,460 45,771 Total processed ore (tonnes) B 136,132 133,270 510,048 531,307
Cash cost per tonne of processed ore ($/t) =A/B 87.02 85.86 81.29 86.15
Cash cost A 11,846 11,442 41,460 45,771 Treatment charges 5,705 2,817 19,835 11,050 Refining charges 413 143 1,494 543
Cash cost applicable per payable ounce C 17,964 14,402 62,789 57,364 Payable ounces of silver equivalent production1 D 1,168,326 1,233,875 4,308,239 5,252,643 Cash cost per ounce of payable silver equivalent2 ($/oz) =C/D 15.38 11.67 14.57 10.92
Mining cost per tonne 40.26 41.60 37.95 41.26 Milling cost per tonne 15.62 14.15 14.39 14.17 Indirect cost per tonne 23.21 20.23 21.62 22.35 Community relations cost per tonne 6.36 2.26 6.55 1.19 Distribution cost per tonne 1.57 7.62 0.78 7.18
Total production cost per tonne 87.02 85.86 81.29 86.15 Notes: 1 Silver equivalent production for Q4 2020 is calculated using a silver to gold ratio of 76.8:1 (Q4 2019: 85.6:1) , silver to lead ratio of 1:28.2 pounds (Q4 2019: 1:18.7), and silver to zinc ratio of 1:20.6 pounds (Q4 2019: 1:16.0). Year 2020: silver to gold ratio of 90.2:1 (Year 2019: 85.8:1), silver to lead ratio of 1:24.9 pounds (Year 2019: 1:17.9), and silver to zinc ratio of 1:20.0 pounds (Year 2019: 1:14.1) 2 Silver equivalents is calculated using the realized prices for gold, silver, lead, and zinc. Refer to Financial Results - Sales and Realized Prices

Fortuna Silver Mines Inc.
Management's Discussion and Analysis, page 44
All-in Sustaining Cash Cost and All-in Cash Cost per Payable Ounce of Silver Equivalent Production The Company believes that “all-in-sustaining cash cost silver equivalent” and “all-in cash cost silver equivalent” meet the needs of management, analysts, investors, and other stakeholders of the Company in understanding the costs associated with producing silver, the economics of silver mining, the Company’s operating performance and the Company’s ability to generate cash flow from current operations, and on an overall company basis. The Company, in conjunction with an initiative undertaken within the gold mining industry, has adopted an all-in-sustaining cost performance measure; however, this performance measure has no standardized meaning. The Company conforms its all-in-sustaining cost definition to that set out in the guidance issued by the World Gold Council (“WGC”). All-in-sustaining cash cost silver equivalent and all-in cash cost silver equivalent are intended to provide additional information only and do not have standardized definitions under IFRS and should not be considered in isolation or as a substitute for measures of performance prepared in accordance with IFRS. These measures are not necessarily indicative of operating profit or cash flow from operations as determined under IFRS. Although the WGC has published a standardized definition, companies may calculate these measures differently. All-in sustaining cash cost includes total production cash costs incurred at the Company’s mining operations. Sustaining capital expenditures, corporate selling, general and administrative expenses, and brownfield exploration expenditures are added to the cash cost to calculate the all-in-sustaining cost. The Company believes that this measure represents the total costs of producing silver from operations and provides the Company and its stakeholders with additional information on the Company’s operational performance and the ability to generate cash flows. Certain cash expenditures such as new project spending, tax payments, dividends, and financing costs are not included. We report this measure on a payable silver equivalent ounce produced basis. Silver equivalent production is calculated taking the total metal payable production of gold, lead and zinc multiplied by the realized prices of gold, lead, and zinc and divided by the realized silver price to calculate the silver equivalent production. The following tables show a breakdown of the all-in sustaining cash cost per silver equivalent ounce for the three and twelve months ended December 30, 2020 and 2019:
Three months ended Years ended SAN JOSE MINE December 31, December 31, (Expressed in $'000's, except unit costs) 2020 2019 2020 2019
Cash cost applicable 20,669 19,755 68,720 77,864 Royalties and mining taxes 3,113 2,252 9,829 8,605 Workers' participation 1,876 2,223 8,200 6,616 General and administrative expenses (operations) 2,186 1,919 6,414 6,475
Adjusted operating cash cost 27,844 26,149 93,163 99,560 Care and maintenance costs (Impact of COVID-19) - - 1,568 - Sustaining capital expenditures3 5,022 3,737 11,540 9,969 Brownfields exploration expenditures3 802 649 3,319 4,077
All-in sustaining cash cost 33,668 30,535 109,590 113,606 Non-sustaining capital expenditures3 568 - 942 -
All-in cash cost 34,236 30,535 110,532 113,606 Payable ounces of silver equivalent production1 2,319,015 2,898,204 9,023,357 11,554,107
All-in sustaining cash cost per ounce of payable silver equivalent2 14.52 10.54 12.15 9.83
All-in cash cost per ounce of payable silver equivalent2 14.76 10.54 12.25 9.83 Notes: 1 Silver equivalent production for Q4 2020 is calculated using a silver to gold ratio of 76.7:1 (Q4 2019: 85.5:1) and for Year 2020: silver to gold ratio of 84.0:1 (Year 2019: 86:0) 2 Silver equivalent is calculated using the realized prices for gold and silver. Refer to Financial Results - Sales and Realized Prices 3 Presented on a cash basis

Fortuna Silver Mines Inc.
Management's Discussion and Analysis, page 45
Three months ended Years ended CAYLLOMA MINE December 31, December 31, (Expressed in $'000's, except unit costs) 2020 2019 2020 2019
Cash cost applicable 17,964 14,402 62,789 57,364 Royalties and mining taxes 564 137 1,286 1,343 Workers' participation 559 179 1,036 864 General and administrative expenses (operations) 1,240 1,580 3,754 4,424
Adjusted operating cash cost 20,327 16,298 68,865 63,995 Care and maintenance costs - - 863 - Sustaining capital expenditures3 2,364 2,487 6,406 10,440 Brownfield exploration expenditures3 106 214 521 700
All-in sustaining cash cost 22,797 18,999 76,655 75,135 Non-sustaining capital expenditures1 - 259 - 705
All-in cash cost 22,797 19,258 76,655 75,840 Payable ounces of silver equivalent production1 1,168,326 1,233,875 4,308,239 5,252,643
All-in sustaining cash cost per ounce of payable silver equivalent2 19.51 15.40 17.79 14.30
All-in cash cost per ounce of payable silver equivalent2 19.51 15.61 17.79 14.44 Notes: 1 Silver equivalent production for Q4 2020 is calculated using a silver to gold ratio of 76.8:1 (Q4 2019: 85.6:1) , silver to lead ratio of 1:28.2 pounds (Q4 2019: 1:18.7), and silver to zinc ratio of 1:20.6 pounds (Q4 2019: 1:16.0). Year 2020: silver to gold ratio of 90.2:1 (Year 2019: 85.8:1), silver to lead ratio of 1:24.9 pounds (Year 2019: 1:17.9), and silver to zinc ratio of 1:20.0 pounds (Year 2019: 1:14.1) 2 Silver equivalents is calculated using the realized prices for gold, silver, lead, and zinc. Refer to Financial Results - Sales and Realized Prices 3 Presented on a cash basis
Free Cash Flow From Ongoing Operations
The Company uses the financial measure of “free cash flow from ongoing operations” to supplement information in its consolidated financial statements. Free cash flow from ongoing operations is defined as cash provided from operating activities, including Lindero commissioning, less changes in long-term receivable sustaining capital expenditures, less current income tax expense, add back impact from adoption of new or amended accounting standards, and add back income taxes paid. This measure is used by the Company and investors to measure the cash flow available to fund the Company’s growth through investments and capital expenditures. These performance measures are intended to provide additional information only and do not have standardized definitions under IFRS and should not be considered in isolation or as a substitute for measures of performance prepared in accordance with IFRS. These measures are not necessarily indicative of operating profits or cash flow from operations as determined under IFRS.

Fortuna Silver Mines Inc.
Management's Discussion and Analysis, page 46
The following table presents a reconciliation of free cash flow from ongoing operations for the three and twelve months ended December 31, 2020 and 2019:
Three months ended Years ended December 31, December 31,
(Expressed in $ millions) 2020 2019 2020 2019
(Restated) (Restated)
Net cash provided by operating activities 31.3 16.4 93.4 60.2 Adjustments
Change in long-term receivables 0.9 (1.5) (0.1) (1.5) Additions to sustaining capital (9.2) (7.6) (23.0) (26.0) Contractor advances for plant and equipment - - - (0.6) Advances applied to plant and equipment - - - 0.7 Adoption of Amendments to IAS 16(1) 21.9 2.8 21.9 2.8 Pre-production costs (2.7) - (2.7) - Current income tax expense (13.3) (8.2) (38.8) (32.6) Income taxes paid 5.6 4.5 28.2 31.5
Free cash flow from ongoing operations 34.5 6.4 78.9 34.5 Note 1 In the fourth quarter, the Company adopted the amendments to IAS 16, Property, Plant and Equipment – Proceeds before Intended Use, on a modified retrospective basis. Prior to the beginning of the fourth quarter, the Lindero Mine was under construction and was not classified as an ongoing operation for the purposes of the free cash flow calculation. The addback considers $21.9 million of costs incurred during the construction period for the first nine months of 2020 and $2.8 million of costs incurred during the fourth quarter of 2019 related to the production of ore stockpile and operating supplies both which were reclassified from capital works in progress to inventories under the amended standard and included in operating working capital.
Adjusted Net Income
The Company uses the financial measure of “adjusted net income” to supplement information in its consolidated financial statements. Adjusted net income is defined as net income (loss) for the period adding back foreign exchange losses and other expenses and subtracting investment income related to the Lindero Mine and other non-cash items. The Company believes that in addition to conventional measures prepared in accordance with IFRS, the Company and certain investors and analysts use this information and information obtained from conventional IFRS measures to evaluate the Company’s performance. The term “adjusted net income” does not have a standardized meaning prescribed by IFRS, and therefore the Company’s definitions are unlikely to be comparable to similar measures presented by other companies. The following table presents a reconciliation of the adjusted net income for the three and twelve months ended December 31, 2020 and 2019:
Three months ended Years ended December 31, December 31,
(Expressed in $ millions) 2020 2019 2020 2019
Net income 18.6 19.0 21.6 23.8 Adjustments, net of tax: Community support provision and accruals 0.2 (0.1) 0.2 (0.2) Foreign exchange loss, Lindero Mine 3.2 1.0 11.8 11.5 Income tax, Lindero Mine - - - (1.1) Income tax, convertible debentures - (1.9) - (1.9) Share of loss from associates - 0.1 0.1 0.2 Investment income - (11.0) (3.3) (11.0) Other non-cash items 1.0 3.8 1.4 7.1
Adjusted net income 23.0 10.9 31.8 28.4

Fortuna Silver Mines Inc.
Management's Discussion and Analysis, page 47
Adjusted EBITDA
The Company uses other financial measures whose presentation is not meant to be a substitute for other subtotals or totals presented in accordance with IFRS measures, but that rather should be evaluated in conjunction with IFRS measures. The item described and presented below does not have a standardized meaning prescribed by IFRS, and therefore the Company’s definitions are unlikely to be comparable to similar measures presented by other companies. The Company believes that its presentation provides useful information for investors. The following table presents a reconciliation of Adjusted EBITDA for the three and twelve months ended December 31, 2020 and 2019:
Three months ended Years ended December 31, December 31,
(Expressed in $ millions) 2020 2019 2020 2019
Net income 18.6 19.0 21.6 23.8 Adjustments: Community support provision and accruals (0.4) (0.1) (0.4) (0.3) Inventory adjustment - 1.3 - 1.3 Foreign exchange loss, Lindero Mine 3.2 1.0 11.8 11.5 Net finance items 0.2 (0.10) 1.2 (0.3) Depreciation, depletion, and amortization 13.9 11.6 45.7 46.0 Income taxes 9.1 1.1 37.4 20.2 Share of loss from associates - 0.1 0.1 0.2 Investment income - (11.0) (3.3) (11.0) Other non-cash items 0.2 2.2 (1.5) 4.0
Adjusted EBITDA 44.8 25.1 112.6 95.4 Figures may not add due to rounding
Qualified Person Eric Chapman, P.Geo (APEGBC #36328) is the Vice-President of Technical Services for the Company and is the Company’s Qualified Person (as defined by National Instrument 43-101). Mr. Chapman has reviewed and approved the scientific and technical information contained in this MD&A and has verified the underlying data. Other Information, Risks and Uncertainties For further information regarding the Company’s operational risks, please refer to the section entitled “Description of the Business - Risk Factors” in the Company’s most recent Annual Information Form that is available at www.sedar.com and www.sec.gov/edgar.shtml.
Cautionary Statement on Forward-Looking Statements This MD&A and any documents incorporated by reference into this MD&A contain forward-looking statements which constitute forward-looking statements within the meaning of the U.S. Private Securities Litigation Reform Act of 1995 and Section 21E of the United States Securities Exchange Act of 1934, as amended, and forward-looking information within the meaning of applicable Canadian securities legislation (collectively, “Forward-looking Statements”). All statements included herein, other than statements of historical fact, are Forward-looking Statements and are subject to a variety of known and unknown risks and uncertainties which could cause actual events or results to differ materially from those reflected in the Forward-Looking Statements. The Forward-looking Statements in this MD&A include, without limitation, statements relating to:
• mineral “reserves” and “resources” as they involve the implied assessment, based on estimates and assumptions that the reserves and resources described exist in the quantities predicted or estimated and can be profitably produced in the future;

Fortuna Silver Mines Inc.
Management's Discussion and Analysis, page 48
• the potential impact of COVID-19 on the Company’s business and operations, and financial condition, including the Company’s ability to operate or to continue operating at its sites;
• the Company’s ability to manage challenges presented by COVID-19;
• achieving the targets set out in the Company’s cost reduction programs;
• the effectiveness of the preventative measures and safety protocols put in place by the Company to curb the spread of COVID-19;
• escalation of travel restrictions resulted from COVID-19;
• production rates and forecasted production for 2021 at the Company’s mines;
• production rates at the Company’s properties;
• timing for delivery of materials and equipment for the Company’s properties;
• the sufficiency of the Company’s cash position and its ability to raise equity capital or access debt facilities;
• the Company’s planned greenfields exploration programs;
• the Company’s planned capital expenditures and brownfields exploration at the San Jose Mine;
• the Company’s planned capital expenditures and brownfields exploration at the Caylloma Mine;
• the Company’s planned capital expenditures and brownfields exploration at the Lindero Mine;
• the anticipated timing for the completion of the commissioning and the commencement of commercial production at the Lindero Mine;
• the final budgeted construction cost for the Lindero Mine;
• maturities of the Company’s financial liabilities, finance leases and other contractual commitments;
• expiry dates of bank letters of guarantee;
• litigation matters;
• estimated mine closure costs; and
• management’s expectation that any investigations, claims, and legal, labour and tax proceedings arising in the ordinary course of business will not have a material effect on the results of operations or financial condition of the Company.
Often, but not always, these Forward-looking Statements can be identified by the use of words such as “anticipates”, “believes”, “plans”, “estimates”, “expects”, “forecasts”, “scheduled”, “targets”, “possible”, “strategy”, “potential”, “intends”, “advance”, “goal”, “objective”, “projects”, “budget”, “calculates” or statements that events, “will”, “may”, “could” or “should” occur or be achieved and similar expressions, including negative variations. Forward-looking Statements involve known and unknown risks, uncertainties and other factors which may cause the actual results, performance or achievements of the Company to be materially different from any results, performance or achievements expressed or implied by the Forward-looking Statements. Such uncertainties and factors include, among others:
• operational risks relating to mining and mineral processing;
• uncertainty relating to Mineral Resource and Mineral Reserve estimates;
• uncertainty relating to capital and operating costs, production schedules and economic returns;
• uncertainty and risks related to the commissioning and commencement of commercial production at the Lindero Mine;
• uncertainty relating to new mining operations and development projects such as the Lindero Mine including the possibility that actual capital and operating costs and economic returns will differ significantly from those estimated for such projects prior to production;
• risks associated with mineral exploration and project development;
• uncertainty relating to the repatriation of funds as a result of currency controls;
• environmental matters including obtaining or renewing environmental permits and potential liability claims;
• uncertainty relating to nature and climate conditions;

Fortuna Silver Mines Inc.
Management's Discussion and Analysis, page 49
• risks associated with political instability and changes to the regulations governing the Company’s business operations;
• changes in national and local government legislation, taxation, controls, regulations and political or economic developments in countries in which the Company does or may carry on business;
• risks relating to the termination of the Company’s mining concessions in certain circumstances;
• risks related to International Labour Organization (“ILO”) Convention 169 compliance;
• developing and maintaining relationships with local communities and stakeholders;
• risks associated with losing control of public perception as a result of social media and other web-based applications;
• potential opposition of the Company’s exploration, development and operational activities;
• risks related to the Company’s ability to obtain adequate financing for planned exploration and development activities;
• substantial reliance on the Caylloma Mine, the San Jose Mine, and the Lindero Mine for revenues;
• property title matters;
• risks relating to the integration of businesses and assets acquired by the Company;
• impairments;
• risks associated with climate change legislation;
• reliance on key personnel;
• uncertainty relating to potential conflicts of interest involving the Company’s directors and officers;
• risks associated with the Company’s reliance on local counsel and advisors and the experience of its management and board of directors in foreign jurisdictions;
• adequacy of insurance coverage;
• risks related to the Company’s compliance with the United States Sarbanes-Oxley Act;
• risks related to the foreign corrupt practices regulations and anti-bribery laws;
• potential legal proceedings to which it is a party;
• the Company is subject to any adverse ruling in any of the litigation;
• uncertainties relating to general economic conditions;
• risks relating to a global pandemic, which until contained could continue to cause a slowdown in global economic growth and impact the Company’s business, operations, financial condition and share price;
• the duration of the COVID-19 pandemic and the impact of COVID-19 on the Company’s business, operations and financial condition, including the Company’s ability operate or continue to operate at its sites in light of government restrictions;
• possible future suspensions of operations at the mine sites or the Lindero Mine related to COVID-19;
• the Company’s ability to manage the various challenges (both anticipated and not) presented by COVID-19 to its business, operations and financial condition;
• competition;
• fluctuations in metal prices;
• risks associated with entering into commodity forward and option contracts for base metals production;
• fluctuations in currency exchange rates;
• failure to meet covenants under its Credit Facilities
• tax audits and reassessments;
• uncertainty relating to concentrate treatment charges and transportation costs;
• sufficiency of monies allotted by the Company for land reclamation;
• risks associated with dependence upon information technology systems, which are subject to disruption, damage, failure and risks with implementation and integration;

Fortuna Silver Mines Inc.
Management's Discussion and Analysis, page 50
• risks related to the volatility of the trading price of the Company’s common shares (“Common Shares”) and the Company’s Debentures (as defined herein);
• dilution from further equity or convertible debenture financings; and
• risks associated with dependence upon information technology systems, which are subject to disruption, damage, failure and risks with implementation and integration;
• risks related to future insufficient liquidity resulting from a decline in the price of the Common Shares or Debentures;
• uncertainty relating to the Company’s ability to pay dividends in the future;
• risks relating to the market for the Company’s securities;
• risks relating to the Debentures of the Company; and
• uncertainty relating to the enforcement of U.S. judgments against the Company. as well as those factors referred to in the “Risks and Uncertainties” section in this MD&A and in the “Risk Factors” section in our Annual Information Form filed with the Canadian Securities Administrators and available at www.sedar.com and filed with the U.S. Securities and Exchange Commission as part of the Company’s Form 40-F and available at www.sec.gov/edgar.shtml. Although the Company has attempted to identify important factors that could cause actual actions, events or results to differ materially from those described in Forward-looking Statements, there may be other factors that cause actions, events or results not to be as anticipated, estimated or intended. Forward-looking Statements contained in this MD&A are based on the assumptions, beliefs, expectations and opinions of management, including but not limited to:
• all required third party contractual, regulatory and governmental approvals will be obtained for the exploration, development, construction and production of its properties;
• there being no significant disruptions affecting operations, whether relating to labour, supply, power, damage to equipment or other matter;
• the world-wide economic and social impact of COVID-19 is managed, and the duration and extent of the coronavirus pandemic is minimized or not long-term;
• there being no material and negative impact to the various contractors, suppliers and subcontractors at the Company’s mine sites as a result of COVID-19 or otherwise that would impair their ability to provide goods and services;
• permitting, construction, development, expansion, and production continuing on a basis consistent with the Company’s current expectations;
• expected trends and specific assumptions regarding metal prices and currency exchange rates;
• prices for and availability of fuel, electricity, parts and equipment and other key supplies remaining consistent with current levels;
• production forecasts meeting expectations; and
• the accuracy of the Company’s current mineral resource and reserve estimates. These Forward-looking Statements are made as of the date of this MD&A. There can be no assurance that Forward-looking Statements will prove to be accurate, as actual results and future events could differ materially from those anticipated in such statements. Accordingly, readers are cautioned not to place undue reliance on Forward-looking Statements. Except as required by law, the Company does not assume the obligation to revise or update these forward looking-statements after the date of this document or to revise them to reflect the occurrence of future unanticipated events. Cautionary Note to United States Investors Concerning Estimates of Reserves and Resources The Company is a Canadian “foreign private issuer” as defined in Rule 3b-4 under the Exchange Act, and is permitted to prepare the technical information contained herein in accordance with the requirements of the securities laws in effect in Canada, which differ from the requirements of the securities laws currently in effect in the United States.

Fortuna Silver Mines Inc.
Management's Discussion and Analysis, page 51
Technical disclosure regarding our properties included herein and in the documents incorporated herein by reference, if applicable, has not been prepared in accordance with the requirements of U.S. securities laws. Without limiting the foregoing, such technical disclosure uses terms that comply with reporting standards in Canada and certain estimates are made in accordance with National Instrument 43-101 — Standards of Disclosure for Mineral Projects (“NI 43-101”). NI 43-101 is a rule developed by the Canadian Securities Administrators that establishes standards for all public disclosure an issuer makes of scientific and technical information concerning mineral projects. Unless otherwise indicated, all mineral reserve and mineral resource estimates contained in the technical disclosure have been prepared in accordance with NI 43-101 and the Canadian Institute of Mining, Metallurgy and Petroleum Definition Standards on Mineral Resources and Reserves ("CIM Definition Standards").
Canadian standards, including NI 43-101, differ significantly from the historical requirements of the Securities and Exchange Commission (the “SEC”), and mineral reserve and resource information contained or incorporated by reference herein may not be comparable to similar information disclosed by U.S. companies.
The SEC has adopted amendments to its disclosure rules to modernize the mineral property disclosure requirements for issuers whose securities are registered with the SEC. These amendments became effective February 25, 2019 (the “SEC Modernization Rules”) and, following a two-year transition period, the SEC Modernization Rules replaced the historical property disclosure requirements for mining registrants that are included in SEC Industry Guide 7. U.S. companies are required to provide disclosure on mineral properties under the SEC Modernization Rules for fiscal years beginning January 1, 2021 or later.
Under the SEC Modernization Rules, the definitions of “proven mineral reserves” and “probable mineral reserves” have been amended to be substantially similar to the corresponding CIM Definition Standards and the SEC has added definitions to recognize “measured mineral resources”, “indicated mineral resources” and “inferred mineral resources” which are also substantially similar to the corresponding CIM Definition Standards; however, there are still differences in the definitions and standards under the SEC Modernization Rules and the CIM Definition Standards. Therefore, the Company’s mineral resources and reserves as determined in accordance with NI 43-101 may be significantly different than if they had been determined in accordance with the SEC Modernization Rules.