Embed Size (px)
Citation preview

Richards Packaging Income Fund
MANAGEMENT’S DISCUSSION AND ANALYSIS
March 1, 2018
6
This management’s discussion and analysis of Richards Packaging Income Fund (“MD&A”) for the year should be read in conjunction with the attached audited financial statements for the year ended December 31, 2017, the quarterly reports for the periods ended March 31, June 30 and September 30, 2017 and the Annual Information Form dated March 1, 2018. Results are reported in Canadian dollars and have been prepared in accordance with International Financial Reporting Standards on a consistent basis with the annual financial statements.
North American Packaging Industry
Packaging is pervasive, as almost all products are delivered in some form of packaging. The properties of packaging fulfils not only the practical, transportability, protection functions and shelf life, but also serves to differentiate products and communicate branding messages such as quality, safety and consumer satisfaction. The latest ergonomically complex packaging components’ design reflects significant investment in market research and product development. To meet the needs of this changing marketplace, the packaging industry has segmented into different product types outlined in the adjacent chart. Markets overperformed in 2017 up 6% with GDP expansion.
As large product marketers have consolidated, packaging companies have embarked on a parallel industry consolidation strategy to meet their needs. Concentration is high in the glass, metal and paper segments with two to five companies controlling approximately 90% of their market and concentration is medium in the rigid plastic, flexible plastic and closure segments with 10 to 15 companies controlling 50% to 60% of their market. In 2017, there were over 307 acquisitions in the global packaging industry, up over the 294 acquisitions in 2016 at a median multiple of 8.9 times EBITDA1 (2016 8.0x). During 2017, the top 20 companies continued to spend on capital at the cautious rate of 5% of revenue. At the same time, excess capacity is continually being addressed with divestitures by conglomerates.
Description of the Business Richards Packaging Income Fund (the “Fund”) is a limited purpose, open-ended trust created on February 26, 2004 to invest in packaging distribution businesses throughout North America. The Fund commenced operations on April 7, 2004 when the Fund completed an initial public offering of 8,569,913 trust units of the Fund (“Units”) at a price of $10 per Unit and indirectly purchased 96% of the securities of Richards Packaging Inc. The remaining 4% represented the exchangeable shareholder ownership of which 2% has subsequently been converted to units. Within the North American Packaging Industry a $3 billion distributor-based market for rigid packaging exists to serve regional small- to medium-sized premium product marketers. Approximately 50 distributors provide marketing and package design expertise, source multiple packaging components from around the world, aggregate orders ensuring access to large manufacturers and provide inventory and logistics support to deliver a complete packaging solution. Concentration in this segment is growing with the top five companies now controlling over 60% of their market. Richards Packaging Inc. and its subsidiaries (“Richards Packaging”) are the largest packaging distributor in Canada and the third largest in North America. Other distributors consist mainly of local or regional family-owned companies who specialize to meet the unique needs of their customers.

Richards Packaging Income Fund
MANAGEMENT’S DISCUSSION AND ANALYSIS
March 1, 2018
7
Richards Packaging Locations
Richards Packaging serves a wide customer base that is comprised of approximately 14,000 regional food, beverage, cosmetic, specialty chemical, pharmaceutical, healthcare and other companies. The primary source of revenue is from the distribution of over 5,000 different types of packaging containers and related components sourced from over 600 suppliers and its three dedicated manufacturing facilities. Sales from these manufacturing facilities represent 10% of
Distribution Centre Agency Centre Manufacturing Plant
Halifax
New Jersey
Los Angeles
Portland
Tacoma
Edmonton Vancouver
Winnipeg Calgary
Montreal
Toronto
Norwalk
Kent
Memphis
Granby
Sacramento
Reno
Streator
Monterrey

Richards Packaging Income Fund
MANAGEMENT’S DISCUSSION AND ANALYSIS
March 1, 2018
8
the total revenues (2016 10%). In addition to providing its customers with a wide range of packaging solutions, Richards Packaging provides design and development services and comprehensive logistics management through 17 sales offices and one agency location. During 2017, management continued to strategically reposition Richards Packaging in the marketplace to optimize the concentration of large customers and focus on customers with the highest value for the unique product offering and services we provide. The concentration of our top 60 customers increased in 2017 by $10 million (2016 $6 million) while growth in small customers was minimal (2016 $31 million).
The cornerstones of Richards Packaging’s strategy include:
• Focusing on a diversified customer base dominated by small regional premium product marketers,
• Providing a complete one-stop source of packaging solutions,
• Being one of the largest distributors of European and Asian glass for the specialty food, wine and beer markets,
• Being the leading supplier of sterile IV, chemo and oral drug packaging and dispensing systems to health care service providers in Canada,
• Being the largest distributor of surplus packaging, and
• Being the only major distributor with dedicated in-house plastics manufacturing capability.
Changes in Financial Markets Global economic markets and the impending end to the current economic cycle reflect pressure on GDP growth, currency wars and divergent United States monetary policy from the rest of the first world. Policy shifts from austerity to government deficit spending, protectionism and US tax rate decreases will also impact currency valuations and GDP growth. Foreign Exchange
Exchange rates averaged U.S./Cdn. $0.77 leading to a negative impact on both revenue and EBITDA of $0.4 million and $0.3 million, respectively in the year. Volatility continued with the bounce back in oil prices in the third quarter 2017 and the exchange rates rising to U.S./Cdn. $0.80. Oil continued its recovery for the remainder of the year however the dollar did not follow.
0
10
20
30
40
50
60
70
80
90
100
2015 2016 2017
Diversified Customer Base
Top 10 Top 30 Top 60 Other
($ millions) 2015 2016 2017
INTEREST RATES 0.8% 0.9% 1.4%
Impact on Interest 0.1 — —
F/X - U.S./Cdn.$ 0.78 0.75 0.77
Impact on:
Revenue 19.8 6.3 (0.4)
EBITDA 3.2 0.8 (0.3)
% 13,300 14,000
68% 70% 67%
14,000

Richards Packaging Income Fund
MANAGEMENT’S DISCUSSION AND ANALYSIS
March 1, 2018
9
Energy Prices
Energy prices continue to be a major factor for the industry affecting glass furnace economics, resin costs and freight costs. In 2017, HDPE and PET resin prices began to diverge from natural gas, their main feedstock, on supply disruptions with prices stabilizing towards the end of the year. Financing structures in place at most packaging companies are similar to that of an income trust, with significant use of debt priced anywhere from 3% to 7% and free cash flow2 at 3%, which ensures that a disciplined approach to passing cost increases through will remain in place. Clear evidence is that for the top 20 companies, their EBITDA as defined within the packaging industry as a percent of sales has remained at a healthy 15% overall for 2017.
PET – Polyethylene terephthalate; HDPE – High Density Polyethylene
Gross Domestic Product
After experiencing consecutive quarters of negative growth in 2009, the gross domestic product growth rates in the United States and Canada remained mainly in positive territory for 2010 through 2017. In Canada, GDP grew 3.7% in the first quarter, 4.3% in the second quarter, 1.7% in the third and 2.0% for the fourth quarter. The United States GDP grew 1.2%, 3.1%, 3.2% and 2.5% in each of the respective quarters. Our US operations outpaced the United States’ pattern however our Canadian operations underperformed in Canada as most of the GDP growth was due to reflating oil prices and a runaway real estate market.
Credit Markets and Interest rates
Interest rates increased during the year by 0.5% resulting in short term BA’s at 1.4% by year end (2016 0.9%). The forecast for US Federal Reserve is to raise interest rates 3 times in 2018 while The Bank of Canada is not necessarily expected to follow.
Financial Highlights The MD&A covers the three and 12 months ended December 31, 2017 and 2016 (generally referred to in this MD&A as the “fourth quarter” and the “year” respectively).
• Revenue up 3.4% due to 3.5% organic growth offset by 0.1% from a 1.6¢ appreciation in U.S./Cdn.,
30
40
50
60
70
80
90
100
0
2
4
6
8
10
12
14
Jan-1
5
Jul-15
Jan-1
6
Jul-16
Jan-1
7
Jul-17
Jan-1
8
U.S
.¢/lb
U.S
.$/b
tu
Natural Gas
Gas PET HDPE
Resin
-6%
-1%
4%
9%
14%
19%
24%
29%
RPI Peers US GDP
20152014 2016
Organic growth
F/X
F/X impact
2017
Acquisition
Richards Packaging Income Fund
MANAGEMENT’S DISCUSSION AND ANALYSIS
March 1, 2018
10
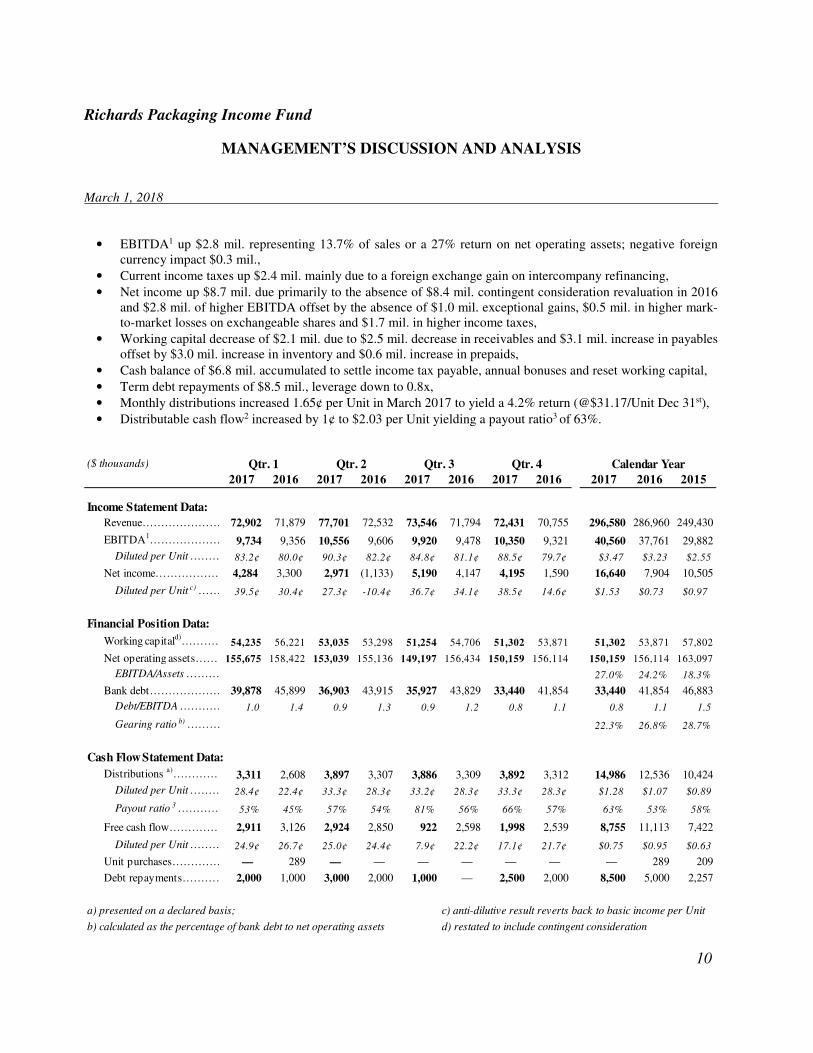
• EBITDA1 up $2.8 mil. representing 13.7% of sales or a 27% return on net operating assets; negative foreign currency impact $0.3 mil.,
• Current income taxes up $2.4 mil. mainly due to a foreign exchange gain on intercompany refinancing,
• Net income up $8.7 mil. due primarily to the absence of $8.4 mil. contingent consideration revaluation in 2016 and $2.8 mil. of higher EBITDA offset by the absence of $1.0 mil. exceptional gains, $0.5 mil. in higher mark-to-market losses on exchangeable shares and $1.7 mil. in higher income taxes,
• Working capital decrease of $2.1 mil. due to $2.5 mil. decrease in receivables and $3.1 mil. increase in payables offset by $3.0 mil. increase in inventory and $0.6 mil. increase in prepaids,
• Cash balance of $6.8 mil. accumulated to settle income tax payable, annual bonuses and reset working capital,
• Term debt repayments of $8.5 mil., leverage down to 0.8x,
• Monthly distributions increased 1.65¢ per Unit in March 2017 to yield a 4.2% return (@$31.17/Unit Dec 31st),
• Distributable cash flow2 increased by 1¢ to $2.03 per Unit yielding a payout ratio3 of 63%.
($ thousands)
2017 2016 2017 2016 2017 2016 2017 2016 2017 2016 2015
Income Statement Data:
Revenue………………………………………………..72,902 71,879 77,701 72,532 73,546 71,794 72,431 70,755 296,580 286,960 249,430
EBITDA1……………………………………………………………...9,734 9,356 10,556 9,606 9,920 9,478 10,350 9,321 40,560 37,761 29,882
Diluted per Unit ……………………………………..83.2¢ 80.0¢ 90.3¢ 82.2¢ 84.8¢ 81.1¢ 88.5¢ 79.7¢ $3.47 $3.23 $2.55
Net income……………………………………………..4,284 3,300 2,971 (1,133) 5,190 4,147 4,195 1,590 16,640 7,904 10,505
Diluted per Unit c) ………………………………………39.5¢ 30.4¢ 27.3¢ -10.4¢ 36.7¢ 34.1¢ 38.5¢ 14.6¢ $1.53 $0.73 $0.97
Financial Position Data:
Working capitald)……………………………………………54,235 56,221 53,035 53,298 51,254 54,706 51,302 53,871 51,302 53,871 57,802
Net operating assets……………………………………………155,675 158,422 153,039 155,136 149,197 156,434 150,159 156,114 150,159 156,114 163,097
EBITDA/Assets ……… 27.0% 24.2% 18.3%
Bank debt………………………………39,878 45,899 36,903 43,915 35,927 43,829 33,440 41,854 33,440 41,854 46,883
Debt/EBITDA ……………………………... 1.0 1.4 0.9 1.3 0.9 1.2 0.8 1.1 0.8 1.1 1.5
Gearing ratio b) ……… 22.3% 26.8% 28.7%
Cash Flow Statement Data:
Distributions a)……………………………3,311 2,608 3,897 3,307 3,886 3,309 3,892 3,312 14,986 12,536 10,424
Diluted per Unit …………………………………………28.4¢ 22.4¢ 33.3¢ 28.3¢ 33.2¢ 28.3¢ 33.3¢ 28.3¢ $1.28 $1.07 $0.89
Payout ratio 3 …………………………………………………………………………53% 45% 57% 54% 81% 56% 66% 57% 63% 53% 58%
Free cash flow……………………………2,911 3,126 2,924 2,850 922 2,598 1,998 2,539 8,755 11,113 7,422
Diluted per Unit …………………………………………24.9¢ 26.7¢ 25.0¢ 24.4¢ 7.9¢ 22.2¢ 17.1¢ 21.7¢ $0.75 $0.95 $0.63
Unit purchases……………………………— 289 — — — — — — — 289 209
Debt repayments……………….2,000 1,000 3,000 2,000 1,000 — 2,500 2,000 8,500 5,000 2,257
a) presented on a declared basis; c) anti-dilutive result reverts back to basic income per Unit
b) calculated as the percentage of bank debt to net operating assets d) restated to include contingent consideration
Qtr. 1 Qtr. 2 Qtr. 3 Qtr. 4 Calendar Year

Richards Packaging Income Fund
MANAGEMENT’S DISCUSSION AND ANALYSIS
March 1, 2018
11
Review of Operations Operations were one-half in the United States (“Richards Packaging US”) and one-half in Canada. Approximately forty percent of sales are concentrated in Los Angeles, Reno and Portland and 40% in Toronto, Montreal, Winnipeg and Vancouver. Revenue increased by $1.6 million, or 2.4% for the fourth quarter (2016 $2.1 million, or 3.1%), and by $9.6 million, or 3.4% for the year, (2016 $37.5 million, or 15.0%), from the same periods in 2016, respectively. During the fourth quarter, revenue increased on organic growth of $2.5 million, or 3.5%, (2016 $2.1 million, or 3.1%) slightly ahead of industry norms offset by the translation impact of Richards Packaging US, with the Canadian dollar appreciating 3.7¢ to U.S./Cdn. $0.79. For the year, the revenue increase was due to organic growth of $10.0 million, or 3.5%, (2016 $31.2 million, or 12.5%) offset by the translation impact of Richards Packaging US of $0.4 million due to a U.S./Cdn. 1.5¢ strengthening to U.S./Cdn. $0.77 (2016 $6.3 million). ($ thousands)
2017 2016 2017 2016 2017 2016 2017 2016 2017 2016 2015
Revenue…………………………………..……………..72,902 71,879 77,701 72,532 73,546 71,794 72,431 70,755 296,580 286,960 249,430
Cost of products sold…………………………………….60,232 59,477 63,952 60,090 60,480 59,242 59,268 58,654 243,932 237,463 208,108
Gross profit……………………………………………………………12,670 12,402 13,749 12,442 13,066 12,552 13,163 12,101 52,648 49,497 41,322
17.4% 17.3% 17.7% 17.2% 17.8% 17.5% 18.2% 17.1% 17.8% 17.2% 16.6%
Administrative expenses…………………………………………………2,893 3,016 3,098 2,824 3,054 2,893 3,158 2,869 12,203 11,602 11,262
Foreign currency loss (gain)………..43 30 95 12 92 181 (345) (89) (115) 134 178
EBITDA1…………………………………………………………….....9,734 9,356 10,556 9,606 9,920 9,478 10,350 9,321 40,560 37,761 29,882
13.4% 13.0% 13.6% 13.2% 13.5% 13.2% 14.3% 13.2% 13.7% 13.2% 12.0%
Amortization………………………………….942 999 949 968 943 991 478 973 3,312 3,931 3,132
Financial expenses………………………………………………501 640 558 652 661 665 586 591 2,306 2,548 2,214
Exceptional gains…………….. — — — — — (259) — (755) — (1,014) —
Contingent consideration…… 83 — — 4,000 — 1,500 — 2,939 83 8,439 —
Exchangeable shares…………………………………1,375 1,883 3,438 2,787 (894) (156) 2,438 1,361 6,357 5,875 6,140
Share of income - Vision…………………..(5) (7) (35) (35) 1 (26) 34 (10) (5) (78) (134)
Income tax expense……………………………………..……….…2,554 2,541 2,675 2,367 4,019 2,616 2,619 2,632 11,867 10,156 8,025
Net Income (loss)……………………………………………4,284 3,300 2,971 (1,133) 5,190 4,147 4,195 1,590 16,640 7,904 10,505
Calendar YearQtr. 4Qtr. 3Qtr. 2Qtr. 1
Cost of products sold (before amortization) increased $0.6 million for the fourth quarter or 1.0% (2016 $1.6 million, or 2.8%) and increased by $6.5 million for the year, or 2.7% (2016 $29.3 million, or 14.1%) from the same periods in 2016, respectively. During the fourth quarter gross profit margins were up 1.1% (2016 0.2%) from the same period in 2016, primarily due to the increased volumes and more favourable product mix. For the year, gross profit margins were up 0.6% (2016 0.6%) as higher volumes absorbed the impact of $2.1 million of inventory write-downs. The volatility in the price of resins continues to not have a material impact on margins as a result of management’s practice of immediately passing through increases and decreases to customers.

Richards Packaging Income Fund
MANAGEMENT’S DISCUSSION AND ANALYSIS
March 1, 2018
12
Administrative expenses (before amortization) increased $0.3 million for the fourth quarter (2016 $0.2 million) and increased $0.6 million for the year (2016 $0.3 million), over the same periods in 2016, respectively mainly due to inflation and the translation impact of expenses of Richards Packaging US. The foreign currency gain resulted from exchange rate changes applied to our U.S. denominated working capital position within our Canadian operations. The net liability position, which increased in the fourth quarter led to a gain with the strengthening of the Canadian dollar. EBITDA1 increased $1.1 million for the fourth quarter (2016 $0.8 million) and $2.8 million for the year (2016 $7.9 million), over the same periods in 2016, respectively. For the year the impact of the U.S./Cdn. 1.5¢ strengthening resulted in a decrease to EBITDA of $0.3 million (2016 $0.8 million increase). As a percent of sales, EBITDA was at 14.3% for the fourth quarter and 13.7% for the year (2016 13.2%). Amortization of $0.5 million for the fourth quarter and $3.3 million for the year was mainly comprised of $0.1 million for the quarter and $2.0 million for the year for intangible assets, which represents a charge for customer relationships and patents. Patents were fully amortized by the third quarter. The remaining amortization amounts consisted of plant and equipment depreciation of $0.4 million for the fourth quarter and $1.3 million for the year, which is approximately equal to the annual capital expenditure spending requirement. Financial expenses were flat for the fourth quarter from the same period in 2016 and decreased $0.2 million for the year from the same period in 2016, with lower term debt outstanding offsetting the increase in interest rates. Exchangeable shares include the mark-to-market loss and the dividends paid on the exchangeable shares. The mark-to-market loss for the year reflects a unit price increase during the year of $6.38 to $31.17 per Unit ($6.4 million) in addition to the monthly dividend on the exchangeable shares ($0.1 million) which was increased in March 2017 by 1.65¢ per Unit to 11¢ per Unit. For the year, taxes increased $1.7 million as current taxes increased $2.4 million mainly on the foreign exchange capital gain triggered by the intercompany refinancing offset by higher deferred tax income of $0.7 million mainly reflecting the rate decrease from US tax reform announced in late 2017. Net deferred tax liabilities are $4.5 million, which include $4.1 million of customer relationships, patents and trademarks, $0.7 million of plant and equipment net of $0.3 million of working capital. Net income for the fourth quarter was $4.2 million, and for the year was $16.6 million, which represented 38.5 ¢ and $1.53 per Unit on a diluted basis, respectively. A time-weighted average total of 10,875,082 Units and 817,931 exchangeable shares, exchangeable into Units on a one-for-one basis, were outstanding in 2017.
Distributable Cash Flow The distributable cash flow2 definition excludes changes in working capital and capital expenditures for expansion of the business, as they are necessary to drive organic growth and are expected to be financed by a $5.0 million revolving facility currently undrawn (2016 nil drawn). Distributable cash flow2 for the fourth quarter at $5.9 million was flat in comparison to the same period in 2016 as higher EBITDA1 of $1.0 million was offset by higher current income tax of $0.7 million and maintenance capital of $0.2

Richards Packaging Income Fund
MANAGEMENT’S DISCUSSION AND ANALYSIS
March 1, 2018
13
million. For the year, distributable cash flow increased $0.1 million with higher EBITDA of $2.8 million and lower interest of $0.2 million offset by $2.4 million of higher taxes and higher maintenance capital of $0.5 million. The monthly distribution increased 1.65¢ in April 2017 to 11¢ per Unit which represents an annual yield of 4.2% on a $31.17 price per Unit at December 31, 2017 and a payout ratio3 of 63% (2016 53%). Based upon the year, 100% of the distributions will represent return of capital to Unitholders while the exchangeable shareholders’ dividends will be fully taxable.
($ thousands)
2017 2016 2017 2016 2017 2016 2017 2016 2017 2016 2015
Cash provided by
operating activities……………………….10,779 7,798 3,292 6,285 5,475 7,809 11,626 12,729 31,172 34,621 14,770
Dividends - Vision…………. — — — — — — — (50) — (50) (50)
Exceptional gains………….... — — — — — (259) — (755) — (1,014) —
Working capital changes………………………………..(3,310) 150 2,512 (1,085) 2,238 (567) (3,507) (4,768) (2,067) (6,270) 5,806
Income tax payments……………….2,265 1,408 4,752 4,406 2,207 2,495 2,231 2,165 11,455 10,474 9,356
EBITDA1 9,734 9,356 10,556 9,606 9,920 9,478 10,350 9,321 40,560 37,761 29,882
Interest a)……………………………………………………501 640 534 652 661 665 610 591 2,306 2,548 2,183
Dividends - Vision………….. — — — — — — — (50) — (50) (50)
Current income tax………… 2,739 2,787 2,923 2,587 4,149 2,778 3,562 2,819 13,373 10,971 8,608
Maintenance capital…………………………………….272 195 278 210 302 128 288 110 1,140 643 1,295
Distributable cash flow2 ………………………………6,222 5,734 6,821 6,157 4,808 5,907 5,890 5,851 23,741 23,649 17,846
Diluted per Unit …………………………………………………………….53.2¢ 49.0¢ 58.3¢ 52.7¢ 41.1¢ 50.5¢ 50.4¢ 50.0¢ $2.03 $2.02 $1.52
Distributions……………………………………….3,311 2,608 3,897 3,307 3,886 3,309 3,892 3,312 14,986 12,536 10,424
Diluted per Unit ………………………………………………………..28.4¢ 22.4¢ 33.3¢ 28.3¢ 33.2¢ 28.3¢ 33.3¢ 28.3¢ $1.28 $1.07 $0.89
Payout ratio 3 ……………………………………………………………53% 45% 57% 54% 81% 56% 66% 57% 63% 53% 58%
Free cash flow2 …………………………………………………..2,911 3,126 2,924 2,850 922 2,598 1,998 2,539 8,755 11,113 7,422
Units outstanding (average)
Diluted basis 000's …………………………………………………..11,693 11,693 11,693 11,693 11,693 11,693 11,693 11,693 11,693 11,693 11,719
a) financial expenses less bank refinancing fees
Qtr. 1 Qtr. 2 Qtr. 3 Qtr. 4 Calendar Year
Liquidity and Financing Cash flows from operating activities
Cash flows from operating activities decreased $1.1 million for the fourth quarter and decreased $3.4 million for the year, over the same periods in 2016. The changes were due primarily to lower working capital changes over the same periods in 2016 along with the absence of one-time exceptional gains offset by higher EBITDA1.

Richards Packaging Income Fund
MANAGEMENT’S DISCUSSION AND ANALYSIS
March 1, 2018
14
Free Cash Flow Deployment The financial structure of the Fund allows for maximum distributions of cash flow from operations to the Unitholders and exchangeable shareholders as outlined above in the distributable cash discussion. Actual distributions paid during the year were $15.0 million with an additional $1.3 million declared for December, which was paid January 12th. Normal Course Issuer Bid
On March 14, 2017, the Fund initiated a normal course issuer bid to purchase up to 200,000 Units prior to March 13, 2018. No units were purchased during the bid period. On March 14, 2018, the Fund will reinstate a normal course issuer bid to purchase up to 500,000 Units prior to March 13, 2019. Current income taxes
The current income tax expense for the year was $13.4 million (2016 $11.0 million) and includes $2.2 million of taxes in connection with the gain on the refinancing of intercompany debt and $0.1 million of withholding taxes on dividends received from Richards Packaging US (2016 $0.5 million). The associated refundable dividend tax of $1.3 million was not recorded as it will only be realized on payment of future dividends. Future withholding taxes will be negligible as Management intends to repatriate funds from Richards US by way of repayment of intercompany financing. Capital expenditures Capital expenditures for the year were $1.6 million (2016 $1.5 million), of which $0.5 million (2016 $0.9 million) was on account of expansion capital primarily for the addition of manufacturing equipment for new customer programs. Maintenance capital expenditures of $1.1 million (2016 $0.6 million) were mainly comprised of the refurbishment of moulds. Acquisition
At December 31, 2016, Richards Packaging had accrued contingent consideration of $10,439 payable to the previous shareholders in connection with the acquisition of Healthmark Services Ltd. and had $97 due from the previous shareholders. Final adjustments in 2017 resulted in additional consideration of $83 reflected in the Statement of income and on March 31, 2017, $10,425 was paid as a net settlement.
Financing activities and instruments
Free cash flow for the year was deployed to pay down debt and invest in expansion capital. The lower leverage continues to keep bank margining down and future debt reductions will provide financing flexibility for our ongoing acquisition program. The remaining free cash flow is more permanent in nature due to our distribution policy and is used to fund working capital for organic growth. Credit facilities include a $33.5 million term loan (2016 $42.0 million) with maturity on September 30, 2019 and up to $5.0 million in revolving debt to fund working capital expansion. The term loan facility bears interest at BA’s plus a
($ millions) 2015 2016 2017
Free Cash Flow 7.4 11.1 8.8
Cash 0.5 11.2 1.9
Working Capital 5.8 (6.3) (2.1)
Expansion Capex 0.4 0.9 0.5
Unit Buyback 0.2 0.3 —
Debt Repayment 0.5 5.0 8.5
Richards Packaging Income Fund
MANAGEMENT’S DISCUSSION AND ANALYSIS
March 1, 2018
15
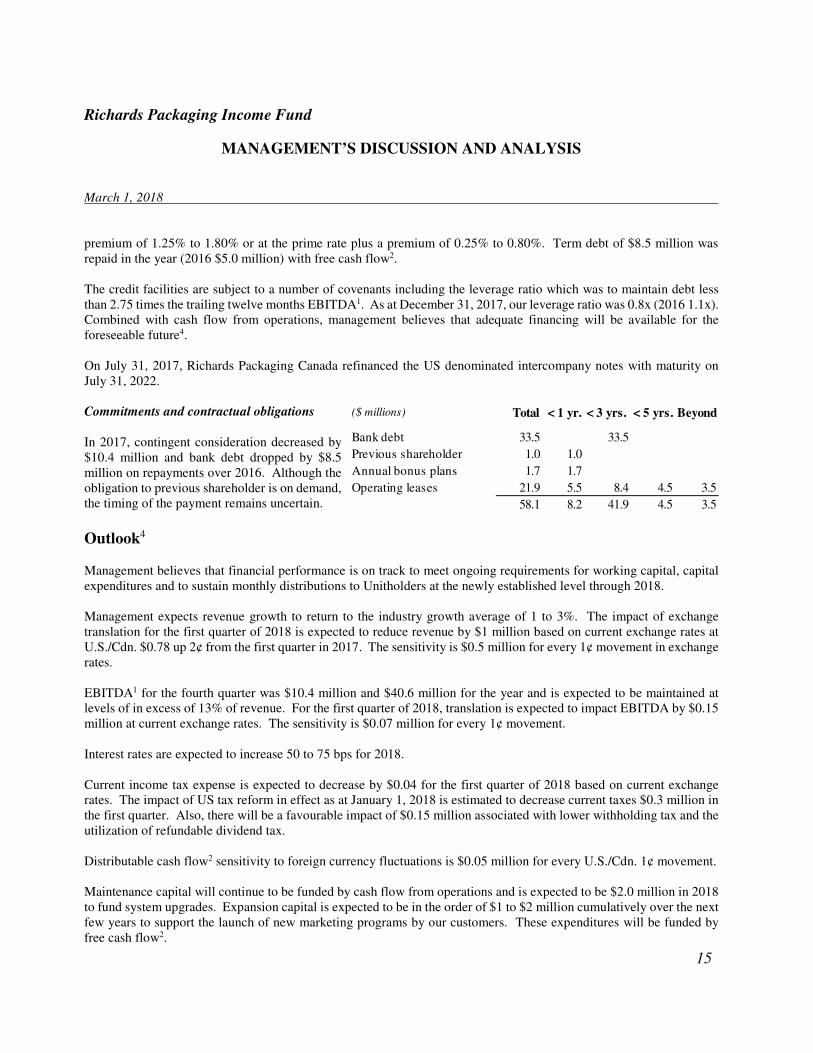
premium of 1.25% to 1.80% or at the prime rate plus a premium of 0.25% to 0.80%. Term debt of $8.5 million was repaid in the year (2016 $5.0 million) with free cash flow2. The credit facilities are subject to a number of covenants including the leverage ratio which was to maintain debt less than 2.75 times the trailing twelve months EBITDA1. As at December 31, 2017, our leverage ratio was 0.8x (2016 1.1x). Combined with cash flow from operations, management believes that adequate financing will be available for the foreseeable future4. On July 31, 2017, Richards Packaging Canada refinanced the US denominated intercompany notes with maturity on July 31, 2022. Commitments and contractual obligations In 2017, contingent consideration decreased by $10.4 million and bank debt dropped by $8.5million on repayments over 2016. Although the obligation to previous shareholder is on demand, the timing of the payment remains uncertain.
Outlook4 Management believes that financial performance is on track to meet ongoing requirements for working capital, capital expenditures and to sustain monthly distributions to Unitholders at the newly established level through 2018. Management expects revenue growth to return to the industry growth average of 1 to 3%. The impact of exchange translation for the first quarter of 2018 is expected to reduce revenue by $1 million based on current exchange rates at U.S./Cdn. $0.78 up 2¢ from the first quarter in 2017. The sensitivity is $0.5 million for every 1¢ movement in exchange rates. EBITDA1 for the fourth quarter was $10.4 million and $40.6 million for the year and is expected to be maintained at levels of in excess of 13% of revenue. For the first quarter of 2018, translation is expected to impact EBITDA by $0.15 million at current exchange rates. The sensitivity is $0.07 million for every 1¢ movement. Interest rates are expected to increase 50 to 75 bps for 2018. Current income tax expense is expected to decrease by $0.04 for the first quarter of 2018 based on current exchange rates. The impact of US tax reform in effect as at January 1, 2018 is estimated to decrease current taxes $0.3 million in the first quarter. Also, there will be a favourable impact of $0.15 million associated with lower withholding tax and the utilization of refundable dividend tax. Distributable cash flow2 sensitivity to foreign currency fluctuations is $0.05 million for every U.S./Cdn. 1¢ movement. Maintenance capital will continue to be funded by cash flow from operations and is expected to be $2.0 million in 2018 to fund system upgrades. Expansion capital is expected to be in the order of $1 to $2 million cumulatively over the next few years to support the launch of new marketing programs by our customers. These expenditures will be funded by free cash flow2.
($ millions) Total < 1 yr. < 3 yrs. < 5 yrs. Beyond
Bank debt 33.5 33.5
Previous shareholder 1.0 1.0
Annual bonus plans 1.7 1.7
Operating leases 21.9 5.5 8.4 4.5 3.5
58.1 8.2 41.9 4.5 3.5

Richards Packaging Income Fund
MANAGEMENT’S DISCUSSION AND ANALYSIS
March 1, 2018
16
Cash on hand of $6.8 million at year end will be deployed to pay accrued bonuses of $1.7 million, taxes payable of $3.0 million and fund working capital. Distributable cash flow from Richards Packaging US and the current tax profile of Richards Canada are expected to allow for a full return of capital to Unitholders. For 2018, surplus distributable cash is expected to be deployed to pay down debt, purchase units opportunistically under the normal course issuer bid and/or fund acquisitions.
Risks and Uncertainties Business risks
Investment in Units involves risks inherent in the ordinary course of business including: sustainability of customer and supplier relationships, financial stability of customers, lack of written customer and supplier agreements, competition from other packaging companies, the extent and duration of an economic downturn, inventory obsolescence, trade risks, resin price and exchange rate fluctuations, interest rate volatility, income taxes and reliance on key personnel. For a detailed description of these and other risks and uncertainties facing investors in the Fund please refer to the 2017 Annual Information Form dated March 1, 2018. Liquidity Risk The ability to make scheduled payments of interest or to refinance will depend on leverage and future cash flow, which is subject to operational performance, prevailing economic conditions, exchange rate fluctuations, interest rate levels, and financial, competitive and other factors, many of which are beyond Richards Packaging’s control. These factors might inhibit refinancing the debt at all, or on favourable terms. In addition, the credit facilities contain restrictive covenants that limit the discretion of management with respect to certain business matters and financial covenants that require Richards Packaging to meet certain financial ratios and financial condition tests. Failure to comply with obligations in the credit facilities could result in an event of default which, if not cured or waived, could permit acceleration of the relevant indebtedness. If the borrowings under the credit facilities were to be accelerated, there can be no assurance that assets on hand would be sufficient to repay in full that indebtedness. Richards Packaging’s approach is to ensure sufficient liquidity to meet its liabilities when due. Cash levels are monitored daily to ensure sufficient continuity of funding.
Transactions with Related Parties Two facilities were leased in 2017 from officers of Richards Packaging. Richards Packaging utilizes all of the production capability of Vision Plastics Inc., of which 50% is owned by the plant manager and 50% by Richards Packaging. All related party transactions are at rates that would be charged by arms-length parties.
Outstanding Share Data At March 1, 2018, the Fund had 10,893,365 Units and Holdings had 799,648 exchangeable shares outstanding, respectively. See note 17 of the attached consolidated financial statements for further discussion on the terms of the Units and exchangeable shares.

Richards Packaging Income Fund
MANAGEMENT’S DISCUSSION AND ANALYSIS
March 1, 2018
17
Critical Accounting Estimates Preparation of the consolidated financial statements in conformity with IFRS requires management to make estimates and assumptions which affect the amounts reported and disclosure of contingent amounts for assets and liabilities as at December 31, 2017 and revenue and expenses for the year then ended. Critical accounting estimates used in preparation of the consolidated financial statements are outlined below.
Allowance for doubtful accounts
An allowance for doubtful accounts is reviewed periodically on an account-by-account basis with a focus on the creditworthiness, aging and historical collection experience. Based on this review, management believes the allowance as at December 31, 2017 is sufficient to cover risks inherent in outstanding receivables. Inventory obsolescence
Management monitors future demand for its inventory on a product-by-product basis, inventory aging and prevailing demand in local markets to record an allowance for obsolescence. Management’s analysis resulted in a $2.1 million recognition of expense through inventory write down for the year (2016 $2.7 million). Based upon this review, management believes the obsolescence provision is adequate to cover risks inherent in inventory on hand as at December 31, 2017. Intangible assets Intangible assets have been recognized in connection with various acquisitions valued at $10.8 million as of December 31, 2017 pertaining to the future customer relationships. The basis of valuation assumed that the margin percent would remain constant and the duration of these relationships would be impacted by a retention rate of approximately 90% per year. The customer relationship intangible and associated $2.6 million future income tax liability as at December 31, 2017 will be amortized to income over 10 to 15 years from the date of acquisition. In addition, trademark intangible assets of $4.0 million and an associated $1.5 million future income tax liability have been recorded. Although previously recognized customer relationship intangible assets affect net income, they do not impact distributable cash flow2. Goodwill
Goodwill represents the excess purchase price of acquired businesses over the estimated fair value of the net assets acquired. Goodwill is not amortized but is reviewed for impairment annually or more frequently if impairment indicators arise. The Unit price was $31.17 as at December 31, 2017 (2016 $24.79), which is in line with the fair value of the Fund. To determine fair value, management relies upon a valuation method based on a discounted cash flow model that assumes revenue growth of 1.6% and inflation of 2% per annum respectively. Overall the carrying value of goodwill continues to be supported by the fair value of the Fund.
Contingent consideration
Contingent consideration represented the additional purchase price payable to the sellers of Healthmark at $10.4 million based on earnings for 2016 and was paid on March 31, 2017.

Richards Packaging Income Fund
MANAGEMENT’S DISCUSSION AND ANALYSIS
March 1, 2018
18
New Accounting Pronouncements The Fund will adopt IFRS 15, Revenue from Contracts with Customers for the annual period beginning on January 1, 2018 and IFRS 16, Leases for the annual period beginning on January 1, 2019. The revenue standard requires us to evaluate the timing of revenue recognition for customers with contracts and custom moulds. The leases standard requires us to capitalize and amortize the fair market value of most operating leases over the term of the leases. The impact of the adoption of these standards is not expected to have a material impact on future statements of net income. The likely future impact of the adoption of the leases standard is expected to increase long term assets and long term liabilities on the statements of financial position by approximately $19,000. See Commitments and contractual obligations for a summary of operating leases.
Disclosure Controls and Internal Controls over Financial Reporting The Fund has established and maintains disclosure controls and procedures as well as internal controls over financial reporting. Richards Packaging’s Chief Executive Officer and Chief Financial Officer have evaluated the effectiveness of the disclosure controls and procedures as well as the design and operating effectiveness of internal controls over financial reporting as of December 31, 2017 and have concluded that such controls and procedures are adequate and effective. Management determined that there were no material weaknesses in the Fund’s internal controls over financial reporting as of December 31, 2017 and there have been no changes in the internal controls over financial reporting during the year ended December 31, 2017 that have materially affected, or are reasonably likely to materially affect, its internal controls over financial reporting.
Cautionary Statement Additional information relating to the Fund is available on Richards Packaging’s website at www.richardspackaging.com, SEDAR at www.sedar.com or TSX at www.tmx.com.
1 Management defines EBITDA as earnings before amortization, exceptional gains, contingent consideration revaluation,
financial expenses, unrealized losses and dividends on exchangeable shares, share of income - Vision and taxes. EBITDA is the same as profit from operations as outlined in the annual financial statements after adding back amortization, exceptional gains and contingent consideration revaluation. Management believes that in addition to net income, EBITDA is a useful supplemental measure for investors of earnings available for distribution prior to debt service, capital expenditures and taxes. Management uses this measure as a starting point in the determination of earnings available for distribution to Unitholders and exchangeable shareholders. In addition, EBITDA is intended to provide additional information on the operating performance. This earnings measure should not be construed as an alternative to net income or as an alternative to cash flows from operating, investing and financing activities as a measure of liquidity and cash flows. EBITDA does not have a standardized meaning prescribed by IFRS and therefore the method of calculating EBITDA may not be comparable to similar measures presented by other companies.
2 Management defines distributable cash flow, in accordance with Richards Packaging’s credit agreement, as EBITDA less
interest, cash income tax expense and maintenance capital expenditures. Free cash flow is distributable cash flow less distributions. The objective of presenting these measures is to calculate the amount which is available for distribution to Unitholders or exchangeable shareholders and to determine the amount available to fund increases in working capital or expansion capital. Investors are cautioned that distributable cash flow should not be construed as an alternative to cash flow from operating, investing and financing activities as a measure of the liquidity and cash flows. Distributable cash

Richards Packaging Income Fund
MANAGEMENT’S DISCUSSION AND ANALYSIS
March 1, 2018
19
flow does not have a standardized meaning prescribed by IFRS and therefore the method of calculating distributable cash flow may not be comparable to similar measures presented by other companies.
3 Management defines payout ratio as distributions and dividends declared over distributable cash flow2. The objective of presenting this measure is to calculate the percentage of actual distributions in comparison to the amount available for distribution. Payout ratio does not have a standardized meaning prescribed by IFRS. The method of calculating the payout ratio may not be comparable to similar measures presented by other companies.
4 The Report to Unitholders and this MD&A contains forward-looking information within the meaning of applicable
securities laws. The forward-looking information reflects management’s current beliefs and expectations regarding the future growth, results of operations, performance and business prospects and opportunities of the Fund and Richards Packaging. We use words such as “may”, “will”, “should”, “anticipate”, “plan”, “expect”, “believe”, “predict”, “estimate” and similar terminology to identify forward-looking information. It is based on assumptions, estimates and analysis made by us in light of our experience and our perception of trends, current conditions and expected developments, as well as other factors we believe to be reasonable and relevant in the circumstances. Forward-looking information involves significant known and unknown risks, uncertainties and other factors which may cause our actual results, performance or achievements to be materially different from those predicted, expressed or implied by the forward-looking information. Readers should not place undue reliance on forward-looking information as a number of factors could cause actual events, results and prospects to differ materially from those expressed in or implied by the forward-looking information. The risks and uncertainties include, among other things, changes in customer and supplier relationships, competition in the industry, inventory obsolescence, trade risks in respect of foreign suppliers, fluctuations in foreign exchange and interest rates, product liability claims, reliance on key personnel, changes to applicable tax laws, as well as other risks and uncertainties, as more fully described herein under “Risks and Uncertainties” and in other reports and filings made by us with securities regulatory authorities and available at www.sedar.com. While management believes that the expectations expressed and the assumptions underlying same are reasonable, there can be no assurance that such expectations and assumptions will prove to be correct. In evaluating forward-looking information, readers should carefully consider the foregoing factors and various other factors which could cause actual results or events to differ materially from those indicated in the forward-looking information. Neither the Fund nor Richards Packaging assumes any obligation to publicly update or revise any such assumptions or any of the forward-looking information contained herein to reflect subsequent information, events, developments or changes in risk factors.