Embed Size (px)
Citation preview

This article was downloaded by: [Pontificia Universidad Javeria]On: 13 January 2014, At: 08:23Publisher: RoutledgeInforma Ltd Registered in England and Wales Registered Number: 1072954 Registeredoffice: Mortimer House, 37-41 Mortimer Street, London W1T 3JH, UK
Technology Analysis & StrategicManagementPublication details, including instructions for authors andsubscription information:http://www.tandfonline.com/loi/ctas20
A technology opportunities analysismodel: applied to dye-sensitised solarcells for ChinaTingting Maab, Alan L. Porterb, Ying Guoab, Jud Readyc, Chen Xud &Lidan Gaobe
a School of Management and Economics, Beijing Institute ofTechnology, Beijing, People's Republic of Chinab Technology Policy and Assessment Center, Georgia Institute ofTechnology, Atlanta, GA, USAc Microelectronic & Nanotechnology Technical Working Group,Georgia Institute of Technology, Atlanta, GA, USAd School of Materials Science and Engineering, Georgia Institute ofTechnology, Atlanta, GA, USAe Chengdu Library of the Chinese Academy of Sciences, Chengdu,People's Republic of ChinaPublished online: 18 Oct 2013.
To cite this article: Tingting Ma, Alan L. Porter, Ying Guo, Jud Ready, Chen Xu & Lidan Gao (2014) Atechnology opportunities analysis model: applied to dye-sensitised solar cells for China, TechnologyAnalysis & Strategic Management, 26:1, 87-104, DOI: 10.1080/09537325.2013.850155
To link to this article: http://dx.doi.org/10.1080/09537325.2013.850155
PLEASE SCROLL DOWN FOR ARTICLE
Taylor & Francis makes every effort to ensure the accuracy of all the information (the“Content”) contained in the publications on our platform. However, Taylor & Francis,our agents, and our licensors make no representations or warranties whatsoever as tothe accuracy, completeness, or suitability for any purpose of the Content. Any opinionsand views expressed in this publication are the opinions and views of the authors,and are not the views of or endorsed by Taylor & Francis. The accuracy of the Contentshould not be relied upon and should be independently verified with primary sourcesof information. Taylor and Francis shall not be liable for any losses, actions, claims,proceedings, demands, costs, expenses, damages, and other liabilities whatsoever or

howsoever caused arising directly or indirectly in connection with, in relation to or arisingout of the use of the Content.
This article may be used for research, teaching, and private study purposes. Anysubstantial or systematic reproduction, redistribution, reselling, loan, sub-licensing,systematic supply, or distribution in any form to anyone is expressly forbidden. Terms &Conditions of access and use can be found at http://www.tandfonline.com/page/terms-and-conditions
Dow
nloa
ded
by [
Pont
ific
ia U
nive
rsid
ad J
aver
ia]
at 0
8:23
13
Janu
ary
2014

Technology Analysis & Strategic Management, 2014Vol. 26, No. 1, 87–104, http://dx.doi.org/10.1080/09537325.2013.850155
A technology opportunities analysis model:applied to dye-sensitised solar cells for China
Tingting Maa,b, Alan L. Porterb, Ying Guoa,b∗, Jud Readyc, Chen Xud and Lidan Gaob,e
aSchool of Management and Economics, Beijing Institute of Technology, Beijing, People’s Republic of China;bTechnology Policy and Assessment Center, Georgia Institute of Technology, Atlanta, GA, USA; cMicroelectronic &Nanotechnology Technical Working Group, Georgia Institute of Technology, Atlanta, GA, USA; dSchool of MaterialsScience and Engineering, Georgia Institute of Technology, Atlanta, GA, USA; eChengdu Library of the ChineseAcademy of Sciences, Chengdu, People’s Republic of China
Technology opportunities analysis (TOA) can support policy-makers or managers in makingstrategic technical decisions so as to enhance their technological innovation capability andinternational competitiveness. This paper presents a multi-level framework to support and sys-tematically identify technological opportunities. Patent data as a key component of technologyinnovation are used to enable TOA within the framework in the present research.At the researchand development (R&D) level, we anticipate the directions of technology development basedon technology morphology. Countries’development emphases can also be investigated in orderto help identify their R&D strengths and weaknesses and to seek promising development path-ways. At the level of competition, we devise the assignee-technology analysis to obtain insightinto competitive participants’ technical emphases and intents. It is also used to explore possiblecollaboration opportunities among them.At the market level, we apply patent family analysis tounderstand countries’ target markets and to assess prospects for the commercialisation of theirtechnology. We pursue TOA to explore China’s opportunities and challenges in dye-sensitisedsolar cells. The empirical case analysis supports the effectiveness of the TOA model. We believeit can be adapted well to fit other emerging technologies.
Keywords: technology opportunity analysis; patent analysis; technology morphology; dye-sensitised solar cell
Introduction
As globalisation advances continuously, technology changes fast and improves each passing day.This has led to the frequent emergence of new technologies and, subsequently to their fast devel-opment. Compared to traditional technologies, the new and emerging sciences and technologies(NESTs) are newly invented, fast changing and developing, and have relatively limited appli-cations in the marketplace (Propp, unpublished). NESTs may provide a wealth of technicalopportunities. If countries or companies are considering developing a certain NEST, what theyshould do first is to explore what kind of potential opportunities they have and to measure if they
∗Corresponding author. Email: [email protected]
© 2013 Taylor & Francis
Dow
nloa
ded
by [
Pont
ific
ia U
nive
rsid
ad J
aver
ia]
at 0
8:23
13
Janu
ary
2014

88 T. Ma et al.
are promising. Technology opportunities analysis (TOA) can help competitors graph technologyinnovation pathways and figure out which is/are their own best opportunities, or limitations, toenhance their competitiveness.
TOA was first proposed by Porter and Detampela (1995), which combines monitoring and bib-liometric analyses to generate effective intelligence on emerging technologies. Hereafter, manyscholars are engaged in the research area, which mainly focuses on data mining and in identifyingtechnology opportunities (Huang and Yuan 2009; Zhu et al. 1999), relationship between technol-ogy opportunity and innovation (Becker and Peters 2005; Nagata and Shinozaki 2007; Nieto andQuevedo 2005; Vertova 2001), role of social networks in opportunity recognition (Lu 2009; Smithand Shalley 2003), and technology commercialisation opportunities identification (Frishammar,Lichtenthaler, and Rundquist 2012). Meanwhile, there have been ample research achievements onthe development of technology intelligence tools for identifying technology opportunity, which areliterature keywords discrimination (Robert and Gatheir 1997), large database analysis (Kostoff andSchaller 2001), semantic patent analysis (Yoon and Kim 2011), patent citation analysis (Anthonyand Patrick 2002), technical opportunity identification under the network environment (Callon2003), morphology analysis (MA) for identifying technology opportunity (Yoon 2008) and visu-alisation of technology opportunities (Escorsa 2000; Zhu and Porter 2002), to support TOA. Ourresearch here aims to explore opportunities based on patent mining to support innovation pathwayforesight.
The development of intelligence information, such as patent data, scientific and technologicalarticles, and technical reports, provides a possibility to tap the potential of technological innova-tion. However, opportunities for technological innovation are not presented in a pre-packaged formand need to be searched and mined with some effort (Li and Qiao 2007). Porter and Detampela(1995) firstly proposed TOA, this provides us with an approach to exploit patent and publicationinformation resources concerning NESTs to identify technology opportunities. Based on the TOAapproach, Zhu, Wu, and Mao (1998) developed a TOA approach based on data network environ-ment. Integrating database and network analysis, a systematic TOA approach, which includedestablishment of large-scale data collection, analysis and expert assessment, is explored (Zhu,Wu, and Mao 1998). Their research proposed a TOA framework on a vertical dimension, basedon which we devise a multi-level framework on horizontal dimensions to support and system-atically identify technological opportunities. The framework set up is based on the TechnologyDelivery System (TDS) modelling, which is a socio-technical systems model used to identify thepivotal elements involved in innovation (Wenk and Kuehn 1977).
According to the framework, we perform patent analysis and augment this analysis with expertopinion in order to anticipate and identify development opportunities and challenges for a targettechnological innovation. In contrast to publication data, patents imply more information about thecompetitive environment, application prospects, and marketing interests. Some previous researchput forward patent-based studies for technological opportunities. Yoon and Park have proposeda systematic approach for identifying potential technological types by exploiting keyword-basedMA (Yoon and Park 2005). Lee et al. analysed patent vacuums for identifying undeveloped techno-logical areas (Lee,Yoon, and Park 2009). Gerken, Moehrle, and Walter (2010) forecast products bytemporal analysis of patent maps, while Mann exploited system evolution patterns for generatingdiscontinuous ideas of product improvements (Mann 2002, 2003). These previous studies focuson exploring technological opportunities that have not been explored yet, so their outputs are tech-nological directions or technological areas from a broad view that are promising and undeveloped(Yoon and Kim 2011). These studies verified that patent data offer an important resource for TOA.From the perspective of technological competition, patents can yield insight into competitors’
Dow
nloa
ded
by [
Pont
ific
ia U
nive
rsid
ad J
aver
ia]
at 0
8:23
13
Janu
ary
2014

Technology opportunities analysis model 89
developmental trajectories and help to forecast others’ upcoming technology-based products andservices (Porter et al. 1991; Porter and Cunningham 2005). From a market perspective, patentscan reveal promising applications and prospective competitors’ potential strengths.
Based on patent analysis, the TOA model provides an effective way to monitor the developmentof a technology and evaluate the position of potential competitors (Trappey et al. 2011). The modelcan support policy-makers in making strategic technical decisions for a national ministry, but mayalso be used by managers to help companies understand the pertinent macro-technical environmentso as to make correct investments.
We applied the model to analyse China’s opportunities and challenges since that as the biggestdeveloping country in the world, China attaches great importance to developing new and emergingtechnologies to change the role of technology followers.With government support, China has madegreat development in the high-tech field, but it still faces intense competitions from technologypowers of the world. Therefore, real-time monitoring competitors and grasp its own technologyopportunity under competition is very important for China as well as other technical chasers inthe world. The paper starts with an introduction of our research background and then followswith a review of the concepts, theory and application of TOA. The second section developsthe methodological framework and introduces the data we use in our research. In this section,the research questions are formulated. In the third section, we model dye-sensitised solar cells(DSSCs) and China’s opportunities and challenges in this area. Analysis results are explained inthis section. In the last section, conclusions are given and future implications are discussed.
Data and methodology
In this research, we strive to offer a systematic approach to better exploiting patent resourcesconcerning NESTs to identify technology opportunities. The analysis model is devised basedon the ‘TDS’ approach (Wenk and Kuehn 1977), which reflects dynamic development processesfrom R&D to the market (Figure 1). A complete technology innovation process is rooted in R&Dactivity, developed by one or more organisations, and then delivered a product, process, or suchto the market. Distinguishing the key contextual factors affecting the success of that innovationprocess can suitably guide our opportunity analysis.
Based on the TDS approach, we have devised a three-level analytical framework to supportTOA modelling, which is the level of R&D analysis, competition analysis and market analysis. Atthe R&D level, we implement component technology analysis based on MA, which is a systematicanalysis of the current and future structure of technology and strong stimulus for the inventionof new alternatives (Glenn and Gordon 2003), in order to anticipate the directions of technologydevelopment. MA introduced a non-quantified modelling approach for structuring and analysingtechnological, organisational and social problems by breaking the subject down into a number offundamental dimensions (Wissema 1976). Here we applied it to structure a technological problemand break technology into several components and then analyse development directions for thosecomponent technologies. It can also help to forecast the most promising technology portfolio,which can be used to guide a nation’s developmental orientation in the near future. The R&D anal-ysis mainly focuses on the technological aspect. At the level of competition analysis, we analysethe links of technology to key players. Players can be a country or an organisation that partici-pates in R&D and/or in a related industry. Technology-Country analysis is implemented here toinvestigate countries’development emphases. Through comparing China with other countries, wecan identify China’s R&D strengths and weaknesses, which can support seeking possible efficientdevelopment pathways. We also devise the assignee-technology analysis at this level to obtain
Dow
nloa
ded
by [
Pont
ific
ia U
nive
rsid
ad J
aver
ia]
at 0
8:23
13
Janu
ary
2014

90 T. Ma et al.
Technology opportunities analysis
Technology portfolio forecasting
Technology-assigneeanalysis
Technology–country analysis
Market analysis of country
Market analysis of assignee
Patent database
Component technology analysis
Step 3R&D Analysis
Step 4Competitive analysis
Step 5 Market analysis
Technology Technology-Player Player
Step 1 Acquiring patent documents
Multi-stage Boolean search strategy
Patent assignees extraction & cleaning
Key terms extraction, cleaning & classification
Cleaning countries of patent assignees
Step 2
Figure 1. Framework for the TOA model.
insight into competitive participants’ technical emphases and intents as well as to explore possiblecollaboration opportunities among them. At the market level, we emphasise analysing players’market opportunities. We apply patent family analyses to understand countries’ target marketsand to help assess prospects for the commercialisation of the target technology. Furthermore, weinvestigate top assignees who applied for patents in the international market.
To operationalise the three-level analyses, we distinguish five steps (Figure 1). Patent data fromthe Derwent World Patents Index (DWPI), which collects public patent documents from 41 patentinstitutions, are selected to support the TOA.
Step 1 is to design our search strategy. Here we use a multi-stage Boolean search strategy toacquire patent documents. It involves four major tasks. First, we create search terms to capturea variety of technical terminology. This shows high retrieval and is defined as our main searchterm. Second, we enrich those search terms according to different expressions of this technology
Dow
nloa
ded
by [
Pont
ific
ia U
nive
rsid
ad J
aver
ia]
at 0
8:23
13
Janu
ary
2014

Technology opportunities analysis model 91
and closely related technical structures. Third, we check retrieval results of those complementarysearch terms by excluding their retrieval overlap with the main search. We revise the termsby adding limitations – such as adding restriction to select records only if they also appear incertain international patent classifications for the DWPI database. We add exclusion terms for thepublication databases. Finally, we combine the terms and evaluate them by randomly testing andassessing retrieval results, and then further revise our search terms. Using the search terms, wedownload the patent data, and then use an appropriate filter to import the raw data intoVantagePointsoftware1 that will be used later to help clean the data, tabulate patent activity, extract text phrasesoccurring in abstracts and claims, and visualise findings.
In Step 2, data cleaning methods, as described by Porter et al. (2008), are applied. We addressthree aspects of the data in order to support our analysis in the next steps.
Key terms extraction, cleaning and classification
In order to support our analysis in Steps 3 and 4, we need to prepare technical key terms which rep-resent specific component technologies.Although theVantagepoint software can provide extractedphrases, these include considerable noise and phrases that are too general or not related to com-ponent technologies. So we devise a systematic methodology to obtain the various technical keyterms from patents pertaining to each component technology.
(1) Technical experts will be involved to define the structure of such a morphology (Yoon 2008;Yoon, Yoon, and Park 2002; Yoon and Park 2004, 2005), so as to identify component tech-nologies. Usually we will prepare a technology dictionary by analysing extracted phrases fromWeb of Science (WOS) databases. According to the technology dictionary, domain experts canbreak down a technology into several subsystems. The principle of technology decompositionis meeting the technical architecture as well as matching technical phrases in the technologydictionary.
(2) We need to determine which phrases refer to these component technologies. In this step, suitablephrases are selected from technology dictionary and classified to corresponding componenttechnology groups.
(3) For each group, we input those component-related phrases, and then extract nearby phrasesto them from the patent abstracts and claims (Zhang, Porter, and Hu 2012). They are used toexplore various shapes of each component technology.
Experts check these nearby phrases and select those actually technically related and maybesupplement some important phrases that were missed up to that point. Phrases that refer to thesame thing are merged.
Based on those cleaned and classified key terms, we can continue R&D analysis in the nextsteps.
Patent assignees extraction and cleaning
We clean patent assignees in two steps. The first uses the Vantage Point List Clean-up functionto reduce a list by combining items that are likely to be the same. Second, we check the cleanedassignee list in terms of Derwent Assignee Codes and Web knowledge. The cleaning processcan exclude some mistakes caused by misspelling, different expressions, and varying names. Theassignee list is prepared to support analysis in Steps 4 and 5.
Dow
nloa
ded
by [
Pont
ific
ia U
nive
rsid
ad J
aver
ia]
at 0
8:23
13
Janu
ary
2014

92 T. Ma et al.
Cleaning countries of patent assignees
In the DWPI database, only a portion of the records provide assignees’ country, which requiresfurther cleaning to complete the information. So we acquire this information by recognising thecountry of assignees or inventers manually with the help of Web resource, and then clean it.For some assignees, which are companies that are part of wider groups, we classify them intothe countries where their headquarters are located. The patent assignees’ country can be used toimplement analysis both in Steps 4 and 5.
Step 3, R&D analysis is the first step to implement TOA, which mainly keeps eyes on profilingR&D activities in order to examine a technology of interest. ‘R&D profiling’ is an important partof TDS modelling. Here we employ the theory of keyword-based MA (Yoon and Park 2004), ofwhich the basic idea is that the subject is broken down into several dimensions, through whichthe subject can be described as comprehensively and detailed as possible (Wissema 1976). Thestrength of this technique lies in its ability to model complex problems in a non-quantitativemanner (Pidd 1996). Basically, technology is treated as a system that is composed of a number ofsubsystems, wherein each subsystem can be shaped in a number of different ways. Any technicalchange of a subsystem may advance the whole technology system. Based on that principle,we devised keyword-based component technology analysis. First, the morphology structure ofselected technology is defined to manifest the properties of the technology. And then, Step 2 isapplied to process key terms and to identify candidate technologies for each subsystem. Base onthe data prepared in Step 2, we profile those technologies by analysing corresponding key terms,which can help researchers and policy-makers understand the ‘research landscape’ to identifywhat are the hot topics and promising sub-technologies, to help ascertain the best opportunitiesfor one’s own research and to support policy formulation.
Step 4, Competitive Analysis is located here to link technologies to key actors. Key actors arethe most important players in technology development and act to deliver technology from R&D tothe market. Based on an R&D profile, we devise the technology-country analysis to obtain a macrosense of R&D emphases and capabilities of top countries or areas. A spider map is a good choiceto graph leading DSSC countries’ R&D activities on important component technologies since itefficiently demonstrates the patent shares of all the component technologies and performs well forcomparing countries’strength and weakness at the same time. Each axis in a spider map representsan important component in a technology system. The scales along each axis represent the percent-age patent shares of each country on the corresponding technology. The percentage is calculated asthe ratio of the patents applied for by assignees that belong to a country to the total patents on eachtechnology. If a country has more shares of a technology than other countries, we can anticipatethat the country has relatively strong capability. Or for a country, if a technology occupies moreshares compared to other technologies, this means that the technology may draw more attentionby the country. We should mention that because of differences in legislation and practice betweenthe regions and patent institutions (e.g. some argue that in China more patent applications arefiled per invention than is the case for other countries), the analyses might have biases. To reducethe biases, we restrict the sample to patents filed in more than a single, local patent office.
Furthermore, we devise the technology-assignee analysis to get an insight into competitiveparticipants’ technical emphases and intents. Network map is applied here to graph relationshipbetween technologies and assignees. If an assignee has more patents on certain technology, thelinked line is thicker. Since we can anticipate if two organisations have similar research interests,they more possibly have the chance and intent to collaborate with each other, this analysis can bealso used to explore possible collaboration opportunities.
Dow
nloa
ded
by [
Pont
ific
ia U
nive
rsid
ad J
aver
ia]
at 0
8:23
13
Janu
ary
2014
Technology opportunities analysis model 93
And in addition, co-assignee analysis is also applied to find out assignees that already havea co-applied patent. Vantagepoint extracts assignees’ names from each patent document, andthen creates a co-occurrence matrix. The columns and rows both list assignees’ names, and thenumbers in the matrix show the number of records containing both the row item and the columnitem. From the matrix, we can discern if any national or international collaboration opportunitiespresent themselves for those potential assignees.
In Step 5, we mainly focus on players’market analysis. In a TDS, the market is the ‘downstream’destination of technology development. Exploring market interests is an important part of TOAmodelling. As a major revenue source, patents provide rich market information. We apply patentfamily analyses to understand the target market. As we know, when applicants want to protecttheir inventions in different countries, a patent application needs to be filed in each patent officewhere protection is sought. As a result, the first patent filing made to protect the invention (thepriority filing) is followed by a series of subsequent filings, and together they form a patent family(Martínez 2010). Along these lines, the recently published OECD Patent Statistics Manual definespatent families as ‘the set of patents (or applications) filed in several countries which are relatedto each other by one or several common priority filings’ (OECD 2009). Thus, patent family datacan be well paired to analyse the international technology markets.
In this analysis, we create a home countries/family countries matrix to support market oppor-tunities analysis. We use home countries to identify the patent applications submitted by localapplicants. We use the family country to identify the patents that are protected in a specific countryno matter if the corresponding application was submitted by local applicants. By using the homecountries/family countries matrix, we can establish:
(1) How assignees from a given country consider their market opportunities?(2) In what ways do those assignees relate their technological assets to international markets?
This knowledge can help decision-makers employ competitive technical intelligence, which isthe action of defining, gathering, analysing, and distributing intelligence about technology tosupport executives and managers in making strategic decisions, to forecast market opportunitiesand assess prospects for commercialisation of their technology.
The paper yields a multi-level patent analysis for profiling an emerging technology of interest.The research in this paper is mainly focused on what patent analysis can do in TOA. However, wecannot ignore that patent data, as a powerful resource for technology and actor analysis, sufferfrom some fundamental constraints, having to do with the delays in publishing data and mattersof strategic behaviour in patenting. In empirical applications, we could involve more types ofinformation such as literature data, business data, and experts’ knowledge to make up for thelimitations of patent data in TOA. Our research in another paper (Guo et al. 2012) applies mul-tiple information sources (fundamental research and engineering-oriented publication abstracts,patent abstracts, and business-oriented abstracts) together in future-oriented technology analyses(FTAs).2 This study just focuses on patent analysis implemented in five steps.
Case study: DSSCs
As a third-generation solar cell solution, DSSCs were introduced by Oregan and Gratzel (1991).They are gradually drawing industry’s attention because of their high conversion efficiency, lowcost, and easy production, compared to other solar cells. We pursue TOA to explore China’s
Dow
nloa
ded
by [
Pont
ific
ia U
nive
rsid
ad J
aver
ia]
at 0
8:23
13
Janu
ary
2014

94 T. Ma et al.
Figure 2. Procedure of the keywords extraction, cleaning, and classification.
Table 1. Examples of keywords.
Component Keywords
Photoanode TiO2, ZnO, SnO2, ZrO2, Al2O3, WO3, NiO, Nb2O5, SrTiO3, etc.Sensitiser Ruthenium dye, organic dye, porphyrin-based dye, metal complex dye, etc.Electrolyte Liquid electrolyte, electrolyte liquid, gel electrolyte, solid electrolyte, quasi-solid
electrolyte, etc.Counter-electrode Platinum counter-electrode, carbon counter-electrode, alloy foil, etc.
opportunities and challenges in DSSCs based on patent analysis. Using Step 1, we download4245 DSSC patents records for the time period from 1991 to 2012 from the DWPI database.
R&D technical analysis
A systematic methodology to obtain the various technical key terms from patents pertaining toeach component technology.A DSSC is generally composed of four components: the photoanode,sensitiser, electrolyte, and counter-electrode. With DSSC experts’3 involvement, we pursue Step 2to get the corresponding key term lists for the four subsystems. Figure 2 shows the detail procedureof the dye-related keywords extraction, cleaning, and classification. Utilising a similar procedure,we also get the corresponding key term lists for the other three subsystems. Table 1 lists selectedkeywords related to the four components.
We see that the various nano-structured materials are used as a semiconductor layer in DSSCphotoanodes, such as TiO2, ZnO, SnO2, ZrO2, Al2O3, WO3, NiO, Nb2O5, and SrTiO3 (orderedby number of patents containing related keywords). TiO2 and ZnO show leading numbers as twomajor nano-structured materials. Out of the whole 4245 records, 717 involve TiO2 or ZnO. InFigure 3, development trends are charted to help determine the most promising technologies.
Dow
nloa
ded
by [
Pont
ific
ia U
nive
rsid
ad J
aver
ia]
at 0
8:23
13
Janu
ary
2014

Technology opportunities analysis model 95
Figure 3. Trend analysis of various technologies for four DSSC components.
Trends show the accumulated numbers of patents containing the keywords that refer to differ-ent technologies in each component of DSSCs, by application years; columns show the annualnumbers. From the top left of Figure 3, we see that both TiO2 and ZnO show increasing develop-ment, while TiO2 has recently attracted more attention and grown more quickly than ZnO. Thenumbers demonstrate a reduction in 2009 because the collection of such recent patents in theDWPI database is incomplete. However, it is worth mentioning that ZnO shows an increasingratio of semiconductor research in comparison with TiO2 materials in recent years. The ratio ofpatents noting ZnO divided by those noting TiO2 began at 0.08 in 2001, grew to 0.24 in 2004, andthen culminated at 0.54 in 2008. Meanwhile, we can see the technologies’ development trendsfor the other three component technologies. Dyes significantly influence the efficiency of lightabsorption. Experts classify them into two major types – metal complex dyes or organic dyes.The top right side of the Figure 3 shows similar development of them by 2005. While since 2007,organic dyes have developed faster than metal complex dyes.
The in-depth component analysis is based on technology morphology. By dividing a technologyinto components, patent trend analysis for each technology enables us to forecast technologydevelopment directions into the near future. We could fit growth models (e.g. logistic curves) tothe historical trend data to project several years forward (not done here).
As the most-used semiconductor material for photoanodes, TiO2 has the advantage of beingrelatively cheap, abundant, and non-toxic (Jose, Thavasi, and Ramakrishna 2009). DSSCs utilis-ing TiO2 demonstrate good photovoltaic performance when compared to others. Organic dye isbecoming more popular because of its low cost, tunable absorption, and electrochemical prop-erties, through suitable molecular design (Grätzel 2009). As the most-used electrolyte form, thegel electrolyte shows better stability than the liquid electrolyte and better conductivity than thesolid electrolyte. It is the transitional form since producing a solid electrolyte with high con-ductivity is the final object. Platinum, as compared to carbon, has good conductivity. Accordingto experts’ (Chen, Xu, and Jud Ready) opinions, although it is more expensive than carbon,
Dow
nloa
ded
by [
Pont
ific
ia U
nive
rsid
ad J
aver
ia]
at 0
8:23
13
Janu
ary
2014
96 T. Ma et al.
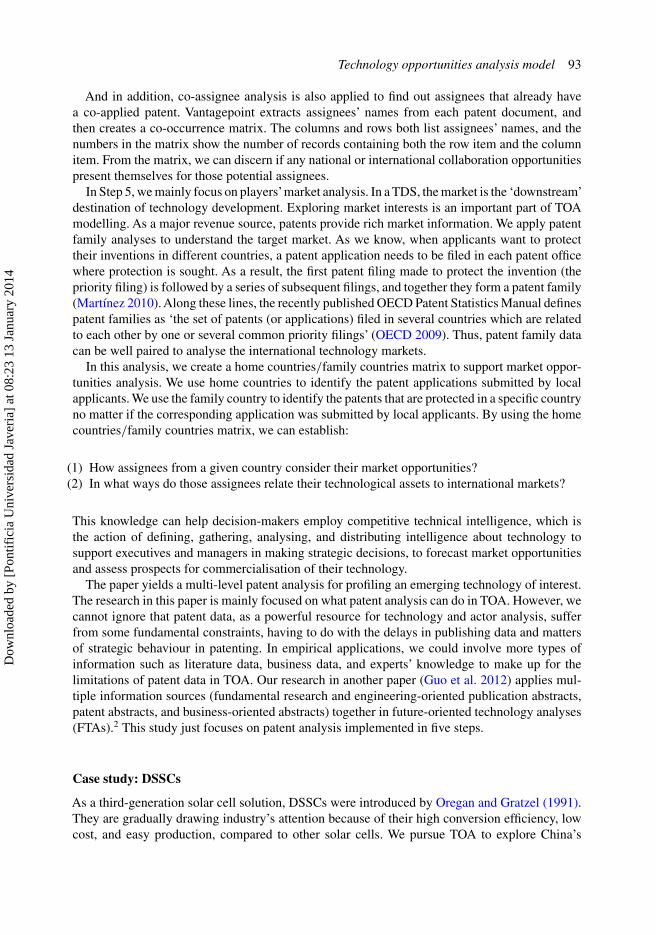
Figure 4. DSSC analysis for China.
platinum will remain popular in the near future because of the relative low conductivity of carboncounter-electrodes that still limits potential product commercialisation.
Since the case study focuses on analysing technology opportunities for China, we next graphChina’s patent shares for the two most recent periods (2006–2007, 2008–2009). Figure 4 showsthat China has a very low count of patent shares in each technology in 2006 and 2007, but a hugegrowth occurred in 2008–2009.Actually, although the data in 2009 are incomplete, China’s patentsshow a big growth in 2009 while others’ patent counts decreased. We can clearly see that eachof these components – TiO2, organic dye, the gel electrolyte, and platinum counter-electrodes –draws more attention in China than the alternative component types. China demonstrates a similarorientation as the global development in this regard (recall Figure 3).
Competitive analysis
To better understand China’s DSSC technology emphases and capabilities, we apply technology-country analysis. Figure 5 shows the percentage patent shares of Japan, China, South Korea, theUSA, and Europe on each technology by 2011. Japan held the highest share of countries on mostof the technologies,4 while China claimed the highest share on platinum electrodes.5 We also cansee that China is in the second position on the gel-type electrolyte and the organic dye, whileSouth Korea is in the second position on carbon electrodes and ZnO, followed by China. Onthe other technologies, China and South Korea show close positions, but significantly lower thanJapan. The analysis may help countries to identify their technical strengths and weaknesses, andfurther understand their technology development structures.
To further look into powerful organisations in DSSCs and their research emphases, we alsographed the top assignees of the component technologies in Figure 6. Blue nodes representassignees; yellow nodes represent technologies. Lines link assignees and technologies if theycoincide in patents. Thickness of lines represents occurrences – thicker lines represent a highercount of occurrences. In Figure 6, most of the organisations are Japanese companies (but recallNote 2); however, we find three Chinese organisations: Chinese Academy of Sciences (CAS)Changchun Applied Chemical Institution (CASX), Chinese Academic Science Physics Institution(CHSC), and IRICO Group Co. Ltd (IRIC) – CASX has a strong linkage with the organic dye andgel electrolyte; CHSC shows its contribution to research on the carbon counter-electrode; IRIC
Dow
nloa
ded
by [
Pont
ific
ia U
nive
rsid
ad J
aver
ia]
at 0
8:23
13
Janu
ary
2014

Technology opportunities analysis model 97
Figure 5. Countries’ patent ratio on important DSSC component technologies.
Figure 6. Top assignee-technology map.
Dow
nloa
ded
by [
Pont
ific
ia U
nive
rsid
ad J
aver
ia]
at 0
8:23
13
Janu
ary
2014

98 T. Ma et al.
Figure 7. Assignees-technology map on dye research.
manufactures soft wiper blades for automobiles and focuses on the platinum counter-electrodeand TiO2. Actually they are the top three patent assignees in China on DSSCs.
Technology –Assignee analysis can also provide a way to explore potential collaboration oppor-tunities. Organisations with similar or complementary technologies (and application interests) arebetter candidates for collaboration. So we try to find potential collaboration opportunities by profil-ing similar development emphases and interests. Figure 7 shows the top assignees who emphasisedye research. We can clearly see that organisations have different choices if they develop dye tech-nologies. However, some organisations research both, such as Fuji Photo Film Co. Ltd (FUJF),CAS Changchun Applied Chemical Institution (CASX), and Ecole Polytechnique Fédérale deLausanne (EPFL). We also conducted a co-assignee analysis for those organisations to determineif any collaboration already exists between them. We find that CASX and Ecole PolytechniqueFédérale de Lausanne collaborate on developing pure organic dye and organic ruthenium dye.Aishin Seiki Kabushiki Kaisha and Toyota Chuo Kenkyusho KK collaborate on metal complexdyes. Actually, the DSSC research team at EPFL is led by Michael Grätzel, who won the 2010Millennium Technology Prize for the invention of the DSSCs. If the CAS can collaborate withEPFL, that may imply that it is the technical leader of DSSCs’ sensitiser research in China andhas the potential to participate effectively in global competition.
Actually, by analysing China’s collaboration, we find that national or international collabo-rations are rare.6 Among the top 10 assignees in China, CASX, Wuhan University, and Peking
Dow
nloa
ded
by [
Pont
ific
ia U
nive
rsid
ad J
aver
ia]
at 0
8:23
13
Janu
ary
2014

Technology opportunities analysis model 99
Figure 8. Co-assignee map for China.
University have collaborated with others. Qinghua University and East China Normal Universityhave collaborated with small local companies.
Furthermore, the two most interesting international collaborations are the following: Sony Cor-poration and EPFL both collaborate with CAS (different affiliates within CAS) on dye research.They represent two major types of collaboration in China: collaboration between an academicinstitution and a company can push DSSC commercialisation, while collaboration among aca-demic institutions may advance DSSC technology. Since, in China, most of the research occursin academic institutions, encouraging these collaborations is important for advancing technologydevelopment and commercialisation Figure 8).
Market analysis
DSSCs, as a NEST, are just starting their commercialisation. By 2010, the total market amounts tosome 1 MW. Experts predict it to grow to 6.2 MW in 2011, to 25.3 MW in 2012, and to 261.6 MWby 2015.7 We can believe that DSSCs’ photovoltaic market is going to expand as the technologyfurther develops. The immense potential market drives the need for market forecasting.
Patent family analysis is used to understand the layout of countries’ potential markets. Incolumns of Table 2, we can see how many patents have been applied for by a country (or region
Dow
nloa
ded
by [
Pont
ific
ia U
nive
rsid
ad J
aver
ia]
at 0
8:23
13
Janu
ary
2014

100 T. Ma et al.
Table 2. Numbers of patent applied for by country (region).
Home countries
Family countries JP CN KR US EP
JP 1897 21 65 17 24CN 142 335 43 13 11US 246 53 111 65 24KR 83 14 310 5 6EP 186 13 49 23 44AU 58 5 3 10 21IN 10 0 1 3 3
Note: JP, Japan; CN, China; US, USA; KR, South Korea; EP, Europe; AU,Australia; IN, India.
Table 3. Top assignees of China that have applied for patents abroad.
NO. Records Patent Assignees Patent Topics
1 10 IND TECHNOLOGY RES Gel electrolyte, ruthenium dye, fabricatingINST (ITRI) method solar cell integrated in building
2 6 EVERLIGHT USA INC (EVER-N) LED Ruthenium dyes3 4 ACAD SINICA (SNIC) Ruthenium dyes, organic dyes4 3 ETERNAL CHEM CO LTD (ETER-N) Thiophene dyes5 3 ETHICAL INT TRADING & Ruthenium dyes
WAREHOUSING SHANGH (ETHI-N)6 3 TAIWAN TEXTILE RES Azo dyes, fabricating method, substrate
INST (TATE-N)7 3 TRIPOD TECHNOLOGY Counter-electrode, gel electrolyte
CORP (TRIP-N)
in the case of Europe) until 2011: Japan, China, USA, South Korea, Europe, Australia, and Indiaare represented. China’s assignees applied for most of the DSSC patents in their home country.Although China applied for patents in the USA, Japan, South Korea, Europe, and Australia, therecords are much lower than for applications from Japan and South Korea. It may imply thatChina’s future market is mainly located in the home country. In addition, patent families also canbe an indicator of patent value because filing patents abroad is associated with higher costs forthe applicant (in terms of patent office fees, patent attorney bills, and translation costs), whichmeans that applicants would only extend protection to foreign countries if the time, effort, and costassociated with it seems worthwhile. From patent family size, we gain a sense that Japan, SouthKorea, and Europe have relatively highly valued patents, possibly closer to commercialisation.China’s international market potential seems largely undeveloped to date.
Since patents applied for abroad are usually more highly valued, we look into further informa-tion on this. China started to apply for patents abroad in 2006. Table 3 lists China’s top assigneesabroad and their patent topics by 2011. We find many companies in Taiwan (included with Chinain these analyses). And, except for Tripo Technology Corporation, all the other organisations haveapplied for patents on dye research. It seems that China has an especially strong capability in dyeresearch as compared to other component technologies. And it is worth paying attention to INDTechnology Research Institution, since it developed the building integrated photovoltaic, which is
Dow
nloa
ded
by [
Pont
ific
ia U
nive
rsid
ad J
aver
ia]
at 0
8:23
13
Janu
ary
2014

Technology opportunities analysis model 101
an important potential application for China to supply power for the needs of remote countrysidelocations.
Discussion
This study provides a research framework to implement TOA. This TOA model has three levelsand five steps. Since technology opportunities always concerns technological push and/or marketpull, we base our TOA model based on a TDS model, which reflects dynamic developmentprocesses from R&D to the market, together with attention to external influences. The frameworkcovers R&D analysis, competitive actor analysis, and market analysis. R&D analysis can helpunderstand technological pushes, while the market analysis concerns the pull side.
The R&D analysis and competitive analysis of DSSCs, suggests that TiO2, organic dyes, gelelectrolytes, and platinum counter-electrodes are predicted to be the most promising componenttechnologies in the near future, Furthermore, China has relatively strong research capability onplatinum counter-electrodes, organic dyes, and gel electrolytes. This implies that China has moreopportunities on the three technologies and could look forward to a potential leading globalposition in these key components. In market analysis, since China seldom applies for patentsabroad and Japan occupies a high share of patents in China, we can speculate that China willmainly lay emphasis on local markets in the immediate future and the main foreign competition isfrom Japanese companies. The low foreign patent shares also indicate that China still has a longway to go for significant global commercialisation of DSSCs.
These results remind the Chinese government agencies to consider policy actions to promoteDSSC commercialisation. One target might be to devise incentives to attract companies to engagein DSSC R&D, since most Chinese patenting is not being done by the industry. Mechanisms toextend collaboration among Chinese universities, institutions, and companies could accelerateDSSC innovation. It might also be prudent to track the role played by Japanese companies in Chi-nese solar cell development. In this paper, we focus on patent data, but more information can alsobe brought into an enhanced TOA analysis model. In particular, incorporating R&D literature datain R&D analysis and competitive analysis, and business data in competitive and market analyses,would enrich the TOA. Actually in a real case, involving more types of information in analysis isa better choice since it can make up for the shortcomings of any single information resource.
In this case study, we just applied the model to identify DSSC opportunities and recognisechallenges for China. We believe this three-level, five-stage TOA approach should extend readilyto other NESTs and other countries. Certainly, issues will vary depending on the extent of theexisting market development and on the target countries’ capabilities and key issues. We believethat companies can also use the approach to investigate macro-technological development.
In addition, the TOA approach presented here implements an in-depth analysis of DSSC com-ponent technologies, rather than treating the technology (DSSCs) as a singular entity. This holdspromise for identifying more useful technology management and policy recommendations. In sodoing, it is important to carefully identify technology morphology with experts according to thepurpose of that analysis. Further research is warranted on developing methods to semi-automatethe key term selection and classification, and we are working on this (Zhang, Porter, and Hu 2012).
Acknowledgements
This research was undertaken at Georgia Tech drawing on support from the National Science Foundation (NSF) through theCenter for Nanotechnology in Society (Arizona State University; award numbers 0531194 and 0937591) and the Science
Dow
nloa
ded
by [
Pont
ific
ia U
nive
rsid
ad J
aver
ia]
at 0
8:23
13
Janu
ary
2014

102 T. Ma et al.
of Science Policy Programme – ‘Measuring and Tracking Research Knowledge Integration’ (Georgia Tech; award number0830207). The findings and observations contained in this paper are those of the authors and do not necessarily reflect theviews of the NSF. Also, this paper got the support from the Humanities and Social Sciences Research Funds for YoungScholars sponsored by the Ministry of Education of China (award number 13YJC630042).
Notes
1. www.theVantagePoint.com.2. FTAs, their main focus being on research and technology foresight, forecasting, and assessment. FTA addresses
directly the longer-term future through the active and continuous development of visions and pathways to realisethese visions. It is increasingly seen as a valuable management and policy tool complementing, and extending furtherinto the future, classical strategy, planning, and decision-making approaches.
3. Jud Ready and Chen Xu are DSSC experts who are closely involved in our research.4. This is apt to reflect both the actual Japanese strength in DSSC development and their relative inclination to patent in
Japan, where the number of patents tends to be far higher than in other patent authorities. Japan both ‘grants’ patentapplications without examination (unless the patent is challenged) and tends towards component patenting (whereasother authorities bundle related component advances into single patents).
5. China has the similar patent examination procedure, which also ‘grants’ patent applications without examination.6. We note that co-assignation is much rarer than co-authoring publications.7. http://www.solarnenergy.com/research_file/656983.pdf (accessed April 4, 2011).
Notes on contributors
Tingting Ma is a PhD candidate in School of Management and Economics, Beijing Institute of Technology of China. Now,she is also a visiting scholar in the School of Public Policy at Georgia Institute of Technology. Her specialty is science andtechnology management, particularly the study of technology forecasting and assessment. She is focusing on research onemerging science and technology topics.
Alan L. Porter is Director of R&D for Search Technology, Inc., Norcross, GA. He is also Professor Emeritus of Industrialand Systems Engineering, and of Public Policy, at Georgia Institute of Technology, where he continues as co-directorof the Technology Policy and Assessment Center. He is author of some 220 articles and books, including Tech Mining(Wiley 2005). He and co-authors are preparing a second edition of Forecasting and management of technology (Wiley).He is pursuing ways to exploit science and technology information to generate and visualise intelligence on emergingtechnologies.
Ying Guo is a faculty member in the School of Management and Economics, Beijing Institute of Technology of China. Hercurrent specialty is technology management and assessment, particularly focusing on how to forecast the likely innovationpathways for emerging nano-related technologies and applications.
Jud Ready is an Adjunct Professor in the School of Materials Science and Engineering and a Senior Research Engineer onthe research faculty of Georgia Tech Research Institute (GTRI). Dr Ready has published numerous refereed publicationson electronic and nano-scale materials and his research developments have been presented at over two dozen internationalconferences with recent invited talks in Berlin and Tokyo. He has served as an expert witness in criminal and civil casesand he has provided testimony to the Georgia State House Science & Technology Committee. He has patents awarded inthe USA (#6846370 and 6994757) and several others pending in the USA and abroad.
Chen Xu is a PhD candidate in the School of Materials Science and Engineering at Georgia Institute of Technol-ogy. His research mainly focuses on integration of nanowire-based devices, including piezoelectric-nanowire-baseddevices and nano-enabled photovoltaic devices and developing novel processes for the integration of top-downand bottom-up approaches in nano-scale devices. He received his BS in electrical engineering from FudanUniversity.
Lidan Gao is Associate Researcher of Chengdu Documentation and Information Center of the Chinese Academy ofSciences. She was a visiting scholar in the School of Public Policy at Georgia Institute of Technology. She is focusing onbibliometric analysis based on patents to explore information for research strategies and activities.
Dow
nloa
ded
by [
Pont
ific
ia U
nive
rsid
ad J
aver
ia]
at 0
8:23
13
Janu
ary
2014
Technology opportunities analysis model 103
References
Anthony, B., and T. Patrick. 2002. Technology powerhouse or diluted competence: Techniques for assessing mergers viapatent analysis. R&D Management 32, no. 1: 455–66.
Becker, W., and J. Peters. 2005. Innovation effects of science-related technological opportunities – theoretical consider-ations and empirical findings for firms in the German manufacturing industry. Jahrbucher Fur NationalokonomieUndstatistik 225: 130–50
Callon, C. 2003. Role of technical literature in science and technology development and exploitation. Journal ofInformation Science 29, no. 3: 223–8.
Escorsa, P. 2000. Technology mapping, business strategy and market opportunities. Competitive Intelligence Review 32,no. 1: 46–57.
Frishammar, J., U. Lichtenthaler, and J. Rundquist. 2012. Identifying technology commercialization opportunities:The importance of integrating product development knowledge. Journal of Product Innovation Management 29:573–89.
Gerken, J., M. Moehrle, and L. Walter. 2010. Patents as an information source for product forecasting: Insights from alongitudinal study in the automotive industry. The R&D management conference, Manchester.
Glenn, J.C., and T.J. Gordon. 2003. Futures research methodology. Washington, DC: American Council for the UNU.Grätzel, M. 2009. Recent advances in sensitized mesoscopic solar cells. Accounts of Chemical Research 42, no. 11:
1788–98.Guo,Y., T. Ma, A.L. Porter, and L. Huang. 2012. Text mining of information resources to inform forecasting of innovation
pathways. Technology Analysis & Strategic Management 24, no. 8: 843–61.Huang, L.C., and Y.H. Yuan. 2009. The discussion of data mining and technology opportunities analysis based on patent
information. Advances in Management of Technology 1: 501–8.Jose, R., V. Thavasi, and S. Ramakrishna. 2009. Metal oxides for dye-sensitized solar cells. Journal of the American
Ceramic Society 92, no. 2: 289–301.Kostoff, R.N., and R.R. Schaller. 2001. Science and technology road-maps. IEEE Transactions on Engineering
Management 48, no. 2: 132–43.Lee, S., B. Yoon, and Y. Park. 2009. An approach to discovering new technology opportunities: Keyword based patent
map approach. Technovation 29, nos. 6–7: 481–97.Li, H., and X. Qiao. 2007. The technology opportunity analysis based on science and technology document. Journal of
Information 5: 74–6.Lu, X. 2009.The recognition of technological entrepreneurial opportunity based on social networks. Zhengzhou conference
on management of technology (MOT), Zhenzhou, China.Mann, D. 2002. Hands-on systematic innovation. Leper: CREAX Press.Mann, D. 2003. Better technology forecasting using systematic innovation methods. Technological Forecasting and Social
Change 70, no. 8: 779–95.Martínez, C. 2010. Patent families: When do different definitions really matter? Scientometrics 86, no. 1: 39–63.Nagata, A., and K. Shinozaki. 2007. Determinant factors of innovation in Japan’s chemical industry: Analysis of its
technological opportunities. Conference of the Portland-International-Center-for-Management-of-Engineering-and-Technology (PICMET2007), August 5–9, Oregon, Portland
Nieto, M., and P. Quevedo. 2005. Absorptive capacity, technological opportunity, knowledge spillovers, and innovativeeffect. Technovation 25, no. 10: 1141–57.
OECD. 2009. Patent statistics manual. Paris: OECD.Oregan, B., and M. Gratzel. 1991. A low-cost, high-efficiency solar-cell based on dye-sensitized colloidal TiO2 films.
Nature 353, no. 6346: 737–40.Pidd, M. 1996. Tools for thinking – modeling in management science. Wiley: London.Porter, A.L., and S.W. Cunningham. 2005. Tech mining: Exploiting new technologies for competitive advantage. New
York: Wiley.Porter, A.L., and M.J. Detampela. 1995. Technology opportunities analysis. Technological Forecasting and Social Change
49, no. 3: 237–55.Porter, A.L., A.T. Roper, T.W. Mason, F.A. Rossini, and J. Banks. 1991. Forecasting and management of technology. New
York: Wiley.Porter, A.L., J. Youtie, P. Shapira, and D.J. Schoeneck. 2008. Refining search terms for nanotechnology. Journal of
Nanoparticle Research 10, no. 5: 715–28.Robert, D., and E. Gatheir. 1997. The state of nano-technology research. Report to the National Research Council of
Canada.
Dow
nloa
ded
by [
Pont
ific
ia U
nive
rsid
ad J
aver
ia]
at 0
8:23
13
Janu
ary
2014

104 T. Ma et al.
Smith, P., and C.E. Shalley. 2003. The social side of creative: A static and dynamic social network perspective. Academyof Management Review 28, no. 1: 89–110.
Trappey, C.V., H.Y. Wua, F. Taghaboni-Duttab, and A.J.C. Trappey. 2011. Using patent data for technology forecasting:China RFID patent analysis. Advanced Engineering Informatics 25, no. 1: 53–64.
Vertova, G. 2001. National technological specialisation and the highest technological opportunities historically.Technovation 21: 605–12.
Wenk, E., Jr, and T.J. Kuehn. 1977. Interinstitutional networks in technological delivery systems. In Science and technologypolicy, ed. J. Haberer, 153–75. Lexington, MA: Lexington Books.
Wissema, J.G. 1976. Morphological analysis: Its application to a company TF investigation. Futures 8, no. 2: 146–53.Yoon, B. 2008. On the development of a technology intelligence tool for identifying technology opportunity. Expert
Systems with Applications 35, nos. 1–2: 124–35.Yoon, B., and Y. Park. 2004. Morphology analysis approach for technology forecasting. 2004 IEEE international
engineering management conference 2, Singapore.Yoon, B., andY. Park. 2005. A systematic approach for identifying technology opportunities: Keyword-based morphology
analysis. Technological Forecasting and Social Change 72, no. 2: 145–60.Yoon, B., C. Yoon, and Y. Park. 2002. On the development and application of a self-organizing feature map-based patent
map. R&D Management 32, no. 4: 291–300.Yoon, J., and K. Kim. 2011. Detecting signals of new technological opportunities using semantic patent analysis and
outlier detection. Scientometrics 90: 445–61.Zhang, Y., A.L. Porter, and Z. Hu. 2012. An inductive method for ‘term clumping’: A case study on dye-sensitized solar
cells. The international conference on innovative methods for innovation management and policy (IM2012), May,Beijing, China.
Zhu, D., and A.L. Porter. 2002. Automated extraction and visualization of information for technological intelligence andforecasting. Technological Forecasting and Social Change 69: 495–506.
Zhu, D., A.L. Porter, S. Cunningham, J. Carlisie, and A. Nayak. 1999. A process for mining science and technologydocuments databases, illustrated for the case of ‘knowledge discovery and data mining’. Ciência Infusa 28, no. 1:7–14.
Zhu, D., C. Wu, and J. Mao. 1998. Technology opportunities analysis based on the data network environment. IndustrialEngineering 1, no. 4: 14–17.
Dow
nloa
ded
by [
Pont
ific
ia U
nive
rsid
ad J
aver
ia]
at 0
8:23
13
Janu
ary
2014