Embed Size (px)
Citation preview

Man
ag
em
en
t Rep
ort 2
00
8
The World’s leading Nutrition, Health and Wellness Company
Management Report 2008
© 2009, Nestlé S.A., Cham and Vevey (Switzerland)
The Management Report contains forward looking statements
which refl ect Management’s current views and estimates. The
forward looking statements involve certain risks and uncertainties
that could cause actual results to differ materially from those
contained in the forward looking statements. Potential risks
and uncertainties include such factors as general economic
conditions, foreign exchange fl uctuations, competitive product
and pricing pressures and regulatory developments.
In case of doubt or differences of interpretation, the English
version shall prevail over the French and German text.
Concept and design
Nestec Ltd., SGDU, Corporate Identity & Design,
with messi & schmidt
Photography
Nicole Bachmann, Gaëtan Bally/Keystone, Nathan Beck,
Patrick Brown/Panos Pictures, Markus Bühler-Rasom,
Goh Seng Chong/Keystone, Douglas Engle/Panos Pictures,
Sam Faulkner/NB Pictures, Jonathan Fong, Peter Ginter,
Georgina Goodwin, Marcel Grubenmann, Alain Herzog/EPFL,
Harmen Hoogland/Nestec, Wollodja Jentsch, Marc Latzel,
George Osodi/Panos Pictures, Philippe Prêtre/APG Image,
Sergio Santorio, Qilai Shen/Panos Pictures, Christian Vogt,
Cédric Widmer
Printing
Entreprise d’arts graphiques Jean Genoud SA (Switzerland)
Paper
This report is printed on Consort Royal, a paper produced from
well-managed forests and other controlled sources certifi ed by
the Forest Stewardship Council (FSC)
Table of contents
Letter to our shareholders 2
Board of Directors of Nestlé S.A. 6
Executive Board of Nestlé S.A. 8
Corporate Governance and Compliance 10
Creating Shared Value 12
The 4 x 4 x 4 roadmap 24
Four competitive advantages 26
Four growth drivers 34
Four strategic pillars 42
The 4 x 4 x 4 Nestlé roadmap in action – Chocolate 50
Pharmaceutical and cosmetics activities 56
Financial review 58
Geographic data: people, factories and sales 74
Creating Shared Value – Performance summary and
independent assurance – Preliminary fi ndings statement 76
The Nestlé story –
all the way to Nutrition, Health and Wellness 78
Shareholder information 80
Annexes
Corporate Governance Report 2008
2008 Financial Statements
Accompanying report
Nutritional needs and quality diets – Creating Shared Value Report 2008
The brands in italics are registered
trademarks of the Nestlé Group
Corporate Governance Report 2008
including Compensation Report 2008
2008 Financial Statements
Consolidated Financial Statements of the Nestlé GroupFinancial Statements of Nestlé S.A
Nutritional needs and quality dietsCreating Shared Value Report 2008
RA_report_cover.indd 1 3.3.2009 13:43:13

Key fi gures (consolidated)
In millions of CHF (except per share data)
Sales
EBIT (Group) Earnings Before Interest, Taxes, restructuring and impairments
as % of sales
EBIT (Food and Beverages) Earnings Before Interest, Taxes, restructuring and impairments
as % of sales (Food and Beverages)
Profi t for the period attributable to shareholders of the parent Net profi t
as % of sales
as % of average equity attributable to shareholders of the parent
Capital expenditure
as % of sales
Equity attributable to shareholders of the parent before proposed appropriation of profi t of Nestlé S.A.
Market capitalisation, end December
Operating cash fl ow
Free cash fl ow (a)
Net fi nancial debt
Ratio of net fi nancial debt to equity (gearing)
Per share (b)
Total earnings per share CHF
Underlying (c) CHF
Equity attributable to shareholders of the parent before proposed appropriation of profi t of Nestlé S.A. CHF
Dividend as proposed by the Board of Directors of Nestlé S.A. CHF(a) Operating cash fl ow less capital expenditure, disposal of tangible assets, purchase and disposal of intangible assets,
movement with associates as well as with minority interests.(b) 2007 comparatives have been restated following 1-for-10 share split.(c) Profi t for the period attributable to shareholders of the parent from continuing operations before impairments, restructuring costs,
results on disposals and signifi cant one-off items. The tax impact from the adjusted items is also adjusted for.
EBIT
In millions of CHF
15 000
13 000
11 000
Net profi t*
In millions of CHF
18 000
12 000
6 000
* Profi t for the period attributable to shareholders of the parent
Dividend per share (a)
In CHF
1.40
1.10
0.80
(a) restated following 1-for-10 share split
Capital expenditure
In millions of CHF
5 000
4 250
3 500
EBIT margin
In %
14
13
12
Earnings per share (a)
In CHF
4.50
3.00
1.50
Underlying
Total
(a) restated following 1-for-10 share split
Total cash returned to shareholders
In billions of CHF
12
8
4
Share Buy-Back
Dividend
Return on invested capital (based on segment reporting)
In %
22.5
17.5
12.5
Including goodwill
Excluding goodwill
10 760
2004
11 876
2005
13 302
2006
15 024
2007
15 676
2008
3 260
2004
0.80
2004
6 621
2004
3 375
2005
0.90
2005
8 081
2005
4 200
2006
1.04
2006
9 197
2006
4 971
2007
4 869
2008
1.22
2007
1.40
2008
10 649
2007
18 039
2008
12.7
2004
13.0
2005
13.5
2006
14.0
2007
14.3
2008
2.8
2004
1.3
3.1
2005
+57%+4%
2.7
3.5
2006
+41%
4.4
4.0
2007
8.7
4.6
2008
+35%
+58%
10.8
19.9
2004
11.4
20.8
2005
11.7
21.2
2006
12.2
22.2
2007
12.3
22.2
2008
2008
109 908
15 676
14.3%
13 103
12.8%
18 039
16.4%
34.9%
4 869
4.4%
50 774
150 409
10 763
5 033
14 596
28.7%
4.87
2.82
13.71
1.40
2007
107 552
15 024
14.0%
12 589
12.6%
10 649
9.9%
20.6%
4 971
4.6%
52 627
195 661
13 439
8 231
21 174
40.2%
2.78
2.80
13.75
1.22
1.88
1.70
2004
2.15
2.08
2005
2.41
2.39
2006
2.80
2.78
2007
2.82
4.87
2008
+14.8%
RA_report_cover.indd 2 3.3.2009 13:43:13
1
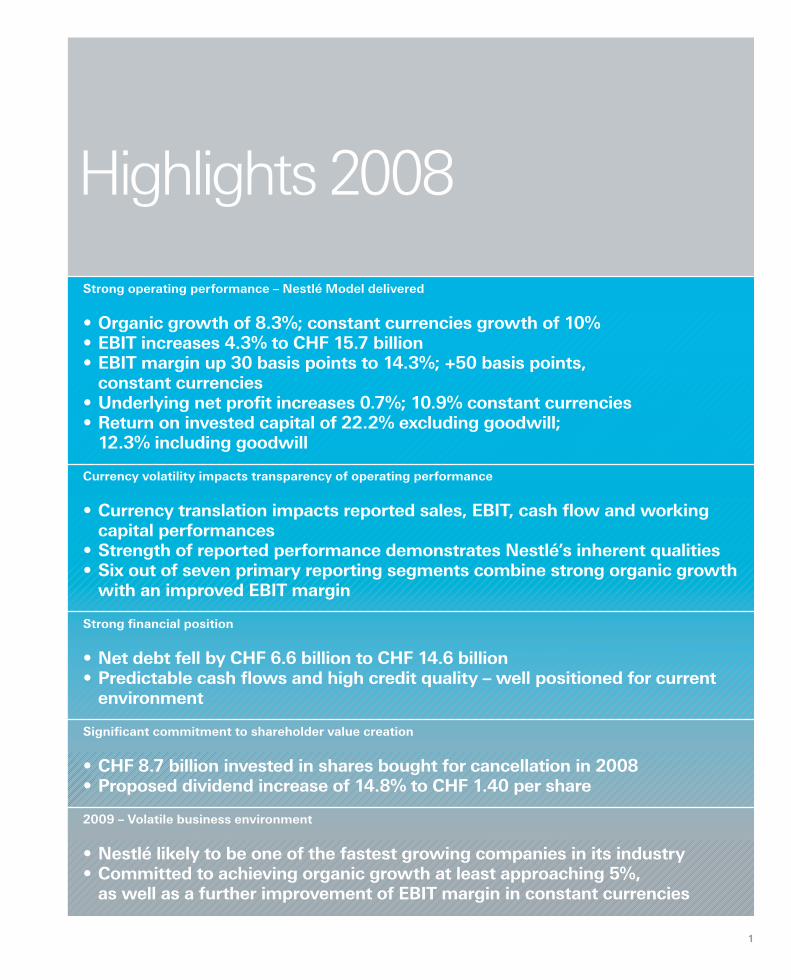
Highlights 2008
Strong operating performance – Nestlé Model delivered
• Organic growth of 8.3%; constant currencies growth of 10%• EBIT increases 4.3% to CHF 15.7 billion• EBIT margin up 30 basis points to 14.3%; +50 basis points,
constant currencies• Underlying net profi t increases 0.7%; 10.9% constant currencies• Return on invested capital of 22.2% excluding goodwill;
12.3% including goodwill
Currency volatility impacts transparency of operating performance
• Currency translation impacts reported sales, EBIT, cash fl ow and working capital performances
• Strength of reported performance demonstrates Nestlé’s inherent qualities• Six out of seven primary reporting segments combine strong organic growth
with an improved EBIT margin
Strong fi nancial position
• Net debt fell by CHF 6.6 billion to CHF 14.6 billion• Predictable cash fl ows and high credit quality – well positioned for current
environment
Signifi cant commitment to shareholder value creation
• CHF 8.7 billion invested in shares bought for cancellation in 2008• Proposed dividend increase of 14.8% to CHF 1.40 per share
2009 – Volatile business environment
• Nestlé likely to be one of the fastest growing companies in its industry• Committed to achieving organic growth at least approaching 5%, as well as a further improvement of EBIT margin in constant currencies
RA_report_01_23_GB.indd 1 3.3.2009 13:54:17

2 Nestlé Management Report 2008
Letter to our shareholders
Fellow shareholders,
2008 was a historic year that dramatically changed the world
and the business environment. Beginning in the fi nancial
sector, and then spreading quickly to the “real” economy,
higher levels of economic uncertainty combined with lower
levels of business confi dence have led the major economies
simultaneously into recession. Stock markets have fallen
sharply and consumers are increasingly wary to spend and
unwilling to take risks that just a short time ago would have
been considered quite acceptable and reasonable. Without
any doubt, the present crisis is unprecedented in scope and
it is hard to foresee what a post-crisis world will look like.
2009 will shape the new world, which, we hope, will be
more stable and sustainable and ultimately more just and
prosperous for everyone.
Central to this crisis is the notion of trust. Some once
highly reputable companies have collapsed and others now
depend for their survival on the largesse of the taxpayer.
Long-term, this is an untenable situation in a globalised
market economy.
Without trust, free market economic growth and
development collapse. In times of economic turbulence,
more than at any other times, an unwavering long-term
orientation, clear strategies and fi rm implementation
combined with strong values are essential for a company
to successfully weather the storm. Indeed, we believe that
Nestlé is better-placed than most, not only to ride the waves
of this crisis with confi dence, but also to benefi t from what
will be a period of rapid change and evolution.
In this global context, your Company has had its
specifi c challenges. In 2007, for example, we experienced
dramatic rises in the cost of many of our raw materials
as a combination of strong demand, poor harvests and
speculation drove prices to record levels. By 2008 we saw
some of those same prices falling sharply as supply rose
and demand fell, and the fi nancial crisis reduced speculative
trading. Nestlé was successful in managing its way through
this period of cost pressure, reporting strong results in 2007.
Despite the very different challenges in 2008, we have
once again not only achieved, but even outperformed
the Nestlé Model, with organic growth at 8.3%, combined
with an improvement in the EBIT margin, of 30 basis
points to 14.3%. In constant currencies, the EBIT margin
increased by 50 basis points. Our return on invested capital
was 12.3%, including goodwill or 22.2% excluding goodwill.
This performance refl ects the benefi t of having identifi ed
the challenges we faced early, of adapting our plans and of
being agile and fast-moving in the many different countries
where we are present.
In 2008 total sales increased by 2.2%, or CHF 2.4 billion,
to CHF 109.9 billion. The EBIT increased by 4.3%, or
CHF 0.7 billion, to CHF 15.7 billion. These numbers refl ect
the signifi cant negative impact of currencies due to the
strength of the Swiss Franc, our reporting currency.
Our net profi t increased by 69.4%, from CHF 10.6 billion,
to CHF 18 billion. Our earnings per share increased
75.2% to CHF 4.87 per share. The net profi t and earnings
per share refl ect the profi t on disposal of 24.8%
of Alcon. Our underlying earnings per share increased 10.9%
in constant currency.
Some important management changes took place in
2008. After fi fteen years of service Professor Peter Böckli
retired from our Board of Directors. We thank
Professor Böckli for his excellent contribution during his
tenure on the Board. At the 2008 Annual General Meeting
Dr Beat Hess was elected to the Nestlé Board of Directors.
A Swiss national, Dr Hess is Group Legal Director of Royal
Dutch Shell plc, and a member of the Shell Group Executive
Committee. The roles of Chief Executive and Chairman
were split, with Paul Bulcke appointed Chief Executive, and
Peter Brabeck-Letmathe remaining Chairman. During 2008
Executive Board members Lars Olofsson and Paul Polman
both left the Company. Luis Cantarell replaced Mr Polman
as Head of Zone Americas and Laurent Freixe, who joined
Nestlé in 1986 and was most recently Market Head for the
Iberian Region, was appointed successor to Mr Cantarell
as Head of Zone Europe.
The management team and all our people have been,
and remain, wholly focused on managing the business and
winning in the market-place, on delivering our strategic plan
and meeting our fi nancial objectives.
At Nestlé we have 283 000 people sharing the same
vision and aligned behind a clear strategy which is
expressed in a simple roadmap. Our ambition is for Nestlé
to be recognised as the world’s trusted leader in nutrition,
health and wellness, and to be the reference for fi nancial
performance in our industry. We have again reported strong
results in 2008 and we continue to drive for a higher level of
performance, even in diffi cult circumstances.
RA_report_01_23_GB.indd 2 3.3.2009 13:54:21

3Nestlé Management Report 2008
RA_report_01_23_GB.indd 3 3.3.2009 13:54:21

4 Nestlé Management Report 2008
The roadmap sets out the strategic and performance
framework that will allow us to achieve this. It combines four
competitive advantages with four growth drivers and four
strategic pillars.
Our competitive advantages are our unmatched product
and brand portfolio; our industry-leading R&D capability;
our unrivalled geographic spread; and our people, values
and culture.
• We have a unique product and brand portfolio that is
an important element of our consumers’ daily lives,
throughout all life stages. This portfolio, which includes
a host of billionaire brands, enables us to leverage our
investments fast and effectively.
• We have industry-leading resources and assets
through our extensive R&D network. This enables us to
translate our consumer insights swiftly into successful
commercialised products, leveraging the rapid progress
in science and technology.
• Our comprehensive global presence paired with
deep local consumer understanding give us a unique
opportunity to benefi t from the economic and
demographic trends for growth in both developed
and developing countries.
• Our people, our culture and our values remain our single
most important competitive advantage. Long-term
thinking, integrity, mutual respect, pragmatism, openness
to diversity and a passion for quality and delighting
consumers remain at the core of our company culture and
of our daily strivings.
Our four growth drivers are “nutrition, health and wellness”;
emerging markets and popularly positioned products (PPP);
out-of-home market; and premiumisation.
• Our nutrition, health and wellness strategy has two
facets. The fi rst is our drive to achieve taste and
nutritional superiority for all our products and brands
relative to their competitor products. This we do through
a proprietary process called 60/40+. The second
focuses on consumers with defi ned nutritional needs
who purchase our products for their specifi c nutritional
benefi ts; these make up the portfolio of Nestlé Nutrition, a
globally-managed division and the world leader with sales
in 2008 of CHF 10.4 billion.
• Popularly positioned products are designed to be
affordable on a daily basis for emerging consumers
entering into the cash economy and buying branded
goods. PPP take us to a new segment of the market,
one which combines fast growth with profi table
opportunities. Our total business in emerging markets
achieved organic growth of 15.4% in 2008 and represents
about CHF 35 billion in sales.
• The long-term growth trends for out-of-home food
consumption exceed those of in-home-food; we are the
leader in branded food and beverages in this fragmented
industry and have created Nestlé Professional, with sales
of CHF 6.2 billion, to enhance our presence in this market.
Our 2008 performance refl ects the benefi t of having identifi ed the challenges we faced early, of adapting our plans and of being agile and fast-moving in the many different countries where we are present... our people have been, and remain, wholly focused on managing the business and winning in the market-place, on delivering our strategic plan and meeting our fi nancial objectives... sharing the same vision and aligned behind a clear strategy.
Our strategy and our alignment on the 4 x 4 x 4 roadmap position us as winners, regardless of the environment. They do this by giving the Group excellent defensive characteristics, but also by creating a platform for profi table growth that has proven itself to be one of the most vigorous in the industry.
RA_report_01_23_GB.indd 4 3.3.2009 13:54:21
5Nestlé Management Report 2008
• In spite of the current economic environment, more and
more consumers have the ability to buy higher value,
premium and luxury products. Nestlé is already present
in some categories, with S.Pellegrino and Nespresso, for
example, and we have signifi cant growth potential across
many other categories.
Four strategic pillars guide our actions on a daily basis.
They are innovation and renovation; operational effi ciency;
product ubiquity; and consumer communication.
• Our strong pipeline of innovation combined with
renovation across our product portfolio has enabled
us to continue to excite consumers about their food
purchases as well as to differentiate our products from
our competitors’, whether branded or private label.
• Our Group-wide focus on operational effi ciency, enabled
by GLOBE, is ensuring competitiveness from a cost
standpoint, combined with product quality and improving
customer service levels.
• Our strategy of product ubiquity, “whenever, wherever,
however”, has given us a strong presence in a wide
variety of channels, from traditional retail to out-of-
home, from impulse to hard discount, from the internet
to local markets. The result is that we have an extensive
and diversifi ed distribution network and a wide range
of customers, with our top ten international retailers
representing about 20% of our sales.
• Consumer communication is key to building our
brands and our nutrition, health and wellness
credentials. In addition to stressing socially responsible
and environmentally sustainable facets, our brand
communication is strongly reinforcing its focus on
60/40+ advantages.
We believe that our strategy and our alignment on the
4 x 4 x 4 roadmap position us as winners, regardless of the
environment. They do this by giving the Group excellent
defensive characteristics, but also by creating a platform
for profi table growth that has proven itself to be one of the
most vigorous in the industry. Furthermore, we believe that
a tough economic environment is the ideal time to enhance
these characteristics. We will also invest in our future
through our commitment to our people, to the countries
where we operate, through capital expenditure, through
our products, brands and consumer focus, through our
marketing expenditure, and through R&D and innovation.
These investments further reinforce our fundamental
commitment to the principles of Creating Shared Value
(CSV), which is the Nestlé way of doing business.
CSV is based on the fi rm conviction that only by creating
value for society as a whole can we create long-term
value for our shareholders.
Nestlé’s portfolio is rich with opportunity, which is one
reason why there were no signifi cant acquisitions in 2008.
We invested CHF 4.9 billion in capital expenditure, whilst
our expenditure on research and development reached
CHF 2 billion, and we further increased our brand marketing
support. We also accelerated the pace of our share buy-
back, buying 183 609 000 shares for CHF 8.7 billion during
the course of 2008. Our ability to invest so signifi cantly
in our business, despite the credit crunch, refl ects the
strength both of our business model and of our “industry
gold standard” balance sheet, as well as confi dence in our
ability to continue to drive organic profi table growth. This
confi dence is also refl ected in the proposed 14.8% increase
in the dividend from CHF 1.22 to CHF 1.40 per share.
The on-going CHF 25 billion share buy-back and
increased dividend refl ect our commitment to create value
for shareholders, even in a period of depressed fi nancial
markets. Another driver of shareholder value creation
is Corporate Governance, so we are pleased to report
that the modernised Articles of Association proposed to
shareholders in 2008 were overwhelmingly accepted.
The global business environment in 2008 was affected by
a number of unforeseen events, especially in the latter part
of the year. Economies around the world have signifi cantly
weakened over the last few months and it is likely that
developments could further impact consumer demand.
However, Nestlé believes that it will once again be one of
its industry’s fastest growing companies this year, in line
with the long-standing Nestlé model. For 2009, Nestlé is
committed to achieving organic growth at least approaching
5%, as well as a further improvement of EBIT margin in
constant currencies.
We started this letter by discussing the tough business
environment, so it is appropriate to end by thanking all our
people, without whom we would not have been able to
achieve what we did in 2008. As we said, we believe that our
people, their qualities and values, are at the heart of what
makes Nestlé the company it is. We thank them for their
energy, enthusiasm and commitment that have contributed
so much to our performance in 2008.
Peter Brabeck-Letmathe
Chairman of the Board
Paul Bulcke
Chief Executive Offi cer
RA_report_01_23_GB.indd 5 3.3.2009 13:54:21

6 Nestlé Management Report 2008
Board of Directors of Nestlé S.A.at 31 December 2008
Helmut O. Maucher
Honorary Chairman
Board of Directors of Nestlé S.A.
Term expires 1
Peter Brabeck-Letmathe 2, 4 2012
Chairman
Paul Bulcke 2 2011
Chief Executive Offi cer
Andreas Koopmann 2, 3 2011
1st Vice Chairman
• CEO, Bobst Group
Rolf Hänggi 2, 4, 5 2011
2nd Vice Chairman
• Chairman, Rüd, Blass & Cie AG, Bankers
Edward George (Lord George) 2, 3 2011
• Former Governor of the Bank of England
Kaspar Villiger 4, 5 2009
• Former Swiss government minister
Daniel Borel 3 2009
• Co-founder and Board member, Logitech International S.A.
Jean-Pierre Meyers 5 2011
• Vice Chairman, L’Oréal S.A.
André Kudelski 5 2011
• Chairman and CEO, Kudelski Group
Carolina Müller-Möhl 2009
• President, Müller-Möhl Group
Günter Blobel 2009
• Professor, The Rockefeller University
Jean-René Fourtou 3 2011
• Chairman of the Supervisory Board, Vivendi
Steven G. Hoch 4 2011
• Founder and Senior Partner, Highmount Capital
Naïna Lal Kidwai 2011
• CEO, HSBC India and Country Head of
HSBC Group Companies in India
Beat Hess 2011
• Group Legal Director, Royal Dutch Shell plc
David P. Frick
Secretary to the Board
KPMG Klynveld Peat Marwick Goerdeler SA 2009
Zurich
Independent auditors
1 On the date of the Annual
General Meeting
2 Chairman’s and Corporate
Governance Committee
3 Compensation Committee
4 Nomination Committee
5 Audit Committee
For further information on the Board
of Directors please refer to the
Corporate Governance Report 2008,
enclosed
RA_report_01_23_GB.indd 6 3.3.2009 13:54:22

7Nestlé Management Report 2008
Peter Brabeck-Letmathe Andreas Koopmann
Rolf Hänggi Edward George (Lord George)
Paul Bulcke
Kaspar Villiger
Jean-Pierre Meyers André Kudelski Daniel Borel
Carolina Müller-Möhl Günter Blobel Jean-René Fourtou
Steven G. Hoch Naïna Lal Kidwai Beat Hess
RA_report_01_23_GB.indd 7 3.3.2009 13:54:22
8 Nestlé Management Report 2008
Executive Board of Nestlé S.A.at 31 December 2008
Paul Bulcke
Chief Executive Offi cer
Members Executive Board
Francisco Castañer
EVP, Pharmaceutical and Cosmetic Products,
Liaison with L’Oréal, Human Resources
Werner Bauer
EVP, Innovation, Technology, Research and Development
ad interim:
Strategic Business Units, Marketing and Sales
Frits van Dijk
EVP, Asia, Oceania, Africa, Middle East
Luis Cantarell
EVP, United States of America, Canada,
Latin America, Caribbean
José Lopez
EVP, Operations, GLOBE
John J. Harris
EVP, Nestlé Waters
Richard T. Laube
EVP, Nestlé Nutrition
James Singh
EVP, Finance and Control, Global Nestlé Business Services,
Legal, Intellectual Property, Tax
Laurent Freixe
EVP, Europe
Marc Caira
Deputy EVP, Nestlé Professional
David P. Frick
SVP, Corporate Governance, Compliance
and Corporate Services
(EVP: Executive Vice President; SVP: Senior Vice President)
Yves Philippe Bloch
Corporate Secretary
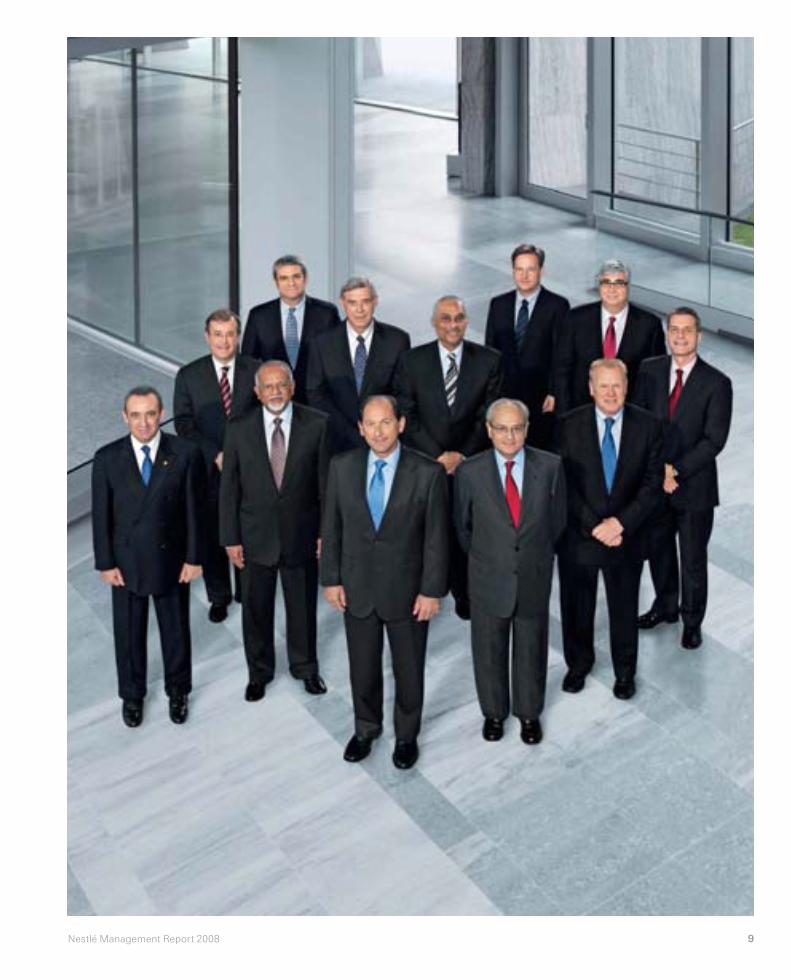
Executive Board
(from left to right):
José Lopez
Luis Cantarell
James Singh
Laurent Freixe
Frits van Dijk
Paul Bulcke
John J. Harris
Francisco Castañer
David P. Frick
Werner Bauer
Marc Caira
Richard T. Laube
For further information on the
Executive Board, please
refer to the Corporate Governance
Report 2008, enclosed
RA_report_01_23_GB.indd 8 3.3.2009 13:54:22
9Nestlé Management Report 2008
RA_report_01_23_GB.indd 9 3.3.2009 13:54:22

10 Nestlé Management Report 2008
Corporate Governance and Compliance
Corporate Governance
Nestlé pursues a strategy of best practice of corporate
governance. In 2008, the Annual General Meeting
approved a complete revision of the Company’s Articles
of Association. 99% of the votes represented at the
meeting were cast in favour of the revision. This brought
to a close a process that started with a shareholder
survey in 2005 and the decision of our shareholders
to mandate the Board with a complete revision of the
Articles. The survey, as well as our subsequent dialogue
with many investors, revealed that opinions were divided
on these issues, with our signifi cant group of (largely
Swiss) private investors in one camp and the (often
foreign) institutional investors in the other. The new
Articles take into account the interests and concerns
of both groups, refl ect the changed composition of
our shareholders as shown on page 11 and consider
developments in the legislative and corporate governance
environment. Above all, they are in the best interests
of the Company to aim for long-term, sustainable value
creation, a statement which was expressly added to
the new Articles.
Also in 2008, the Company revised its governance
structure and appointed Mr. Paul Bulcke, previously
Executive Vice President responsible for Zone
Americas, as Chief Executive Offi cer. With the
shareholders’ approval he was appointed by the Board
as “Administrateur délégué”. Mr. Brabeck-Letmathe
remains Chairman of the Board.
In accordance with our strategy of continuous
improvement of the information provided to shareholders,
Nestlé in 2008 produced for the fi rst time a special
annual compensation report describing the Company’s
compensation principles and the compensation granted
to the Board and the Executive Board. The report was
approved by the shareholders as part of the approval
of the annual fi nancial statements, in line with the
Swiss Code of Best Practice for Corporate Governance.
The Chairman of the Board commented on the report
and answered pertinent questions prior to the vote,
allowing shareholders to voice their opinion about the
compensation granted.
Our governance strategy includes a continued
engagement with our investors and also adaptation of our
governance documentation in line with the evolving legal
and governance environment. We also take an active role
in shaping these developments in particular in our home
market in Switzerland.
Compliance
We believe complying with laws and internal regulations
protects the Company’s reputation and provides the
basis for the creation of sustainable shared value. We
pursue a zero tolerance strategy, yet a principles-based
approach to Compliance. The Company has adopted a
cross-functional set up of Compliance where a number
of functions contribute to an integrated Compliance
management. While responsibility and accountability
for Compliance are assigned to the markets as per the
Company’s Custodian Concept, a corporate Compliance
function and a cross-functional Group Compliance
Committee defi ne the framework, facilitate the
coordination between the relevant support functions and
drive key Compliance initiatives. In addition, the Company
has established a Compliance network in the major
markets and has replicated the Committee structure
where appropriate.
Nestlé’s Corporate Business Principles and our new
Code of Business Conduct are our non-negotiable
worldwide minimum standards which we observe in
addition to complying with locally applicable legislation.
While the Corporate Business Principles, which include
our commitment to the ten principles of the UN Global
Compact, will continue to evolve and adapt to a changing
world, they contain our basic foundation unchanged
from the origins of our Company. Together with our
Management and Leadership Principles, they refl ect the
basic ideas of fairness, honesty and a general concern for
people. Many other policies and standards complement
this system.
The roll-out of the new Code of Business Conduct
marked a major milestone of the Group’s Corporate
Compliance Programme in 2008, which also included
the adoption of the Group’s Supplier Code and the
implementation of various focussed compliance
initiatives, including the launch of a corporate compliance
e-learning tool, an antitrust learning tool, our anti-fraud
programme, as well as a new self-assessment of the
Group’s internal control system and an annual risk
assessment, both as required by the new Swiss company
RA_report_01_23_GB.indd 10 3.3.2009 13:54:23
11Corporate Governance and Compliance
law. The Group Compliance function selects such
initiatives on an ongoing basis to support the efforts at
market level. It sets the tone, provides a framework and
know-how and supports the coordination and functional
leadership by the various relevant functions, all as needed
to create trust and to protect our reputation in a changed
legal and regulatory environment.
CARE (Compliance Assessment of Human Resources,
Safety & Health, Environment and Business Integrity) is
Nestlé’s audit programme to verify that our operations
comply with the Corporate Business Principles. In 2008 a
new module was added covering business integrity.
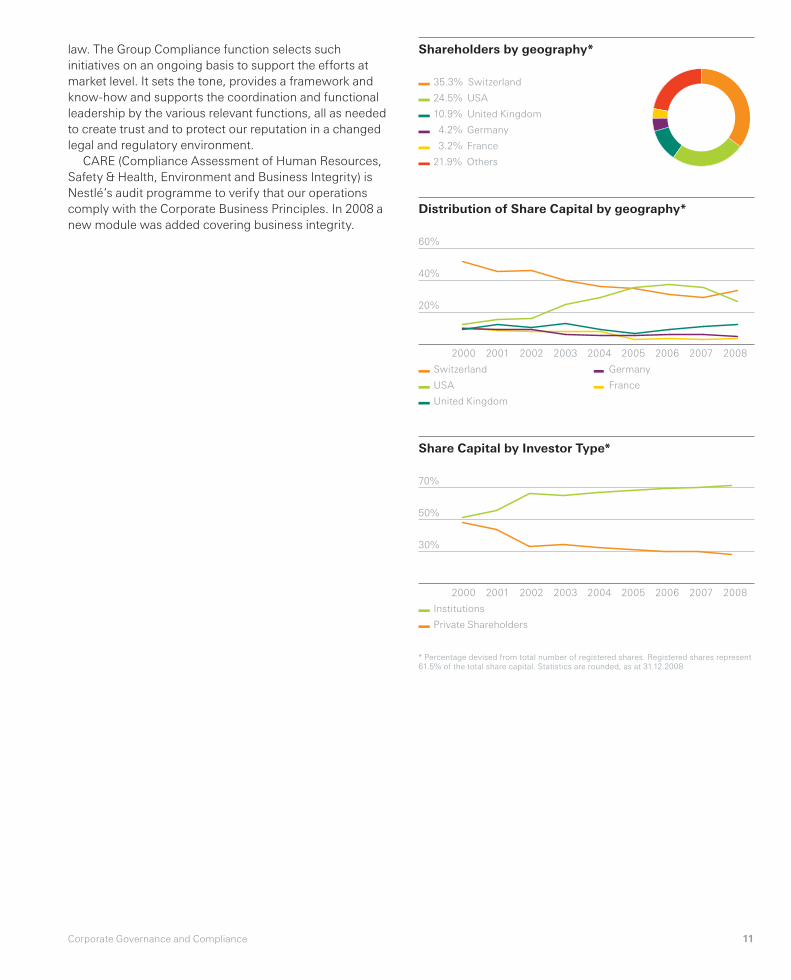
Shareholders by geography*
Distribution of Share Capital by geography*
35.3% Switzerland
24.5% USA
10.9% United Kingdom
4.2% Germany
3.2% France
21.9% Others
60%
40%
20%
2000 2001 2002 2003 2004 2005 2006 2007 2008
Share Capital by Investor Type*
70%
50%
30%
2000 2001 2002 2003 2004 2005 2006 2007 2008
Institutions
Private Shareholders
* Percentage devised from total number of registered shares. Registered shares represent
61.5% of the total share capital. Statistics are rounded, as at 31.12.2008
Switzerland
USA
United Kingdom
Germany
France
RA_report_01_23_GB.indd 11 3.3.2009 13:54:23
12 Nestlé Management Report 2008
Creating Shared Value
Creating Shared Value is a principle for doing business founded on the conviction that shareholder interests and the interests of society must be aligned in order to achieve long-term business success. Creating Shared Value which is integrally linked to our core business strategies and operations means going beyond sustainability, to create value for shareholders and society.
Creating value for shareholders
Creating value for society
RA_report_01_23_GB.indd 12 3.3.2009 13:54:23
13Creating Shared Value
RA_report_01_23_GB.indd 13 3.3.2009 13:54:43

14 Nestlé Management Report 2008
by refi ning and developing key
indicators. Last but not least, we
have provided more examples
to demonstrate how we comply
with all relevant industry regulations
and standards. We have further to
go with our reporting, particularly
in quantifying the societal outcomes
of our Creating Shared Value
initiatives, and this will form part
of our future plans.
Highlights
• We made signifi cant improvement
in workplace safety performance
across the Company (page 20);
• Our supply chain initiatives were
strengthened with the launch of our
new Supplier Code (page 16);
• We continued to expand
programmes that benefi t farmers
and their families (page 16);
• We met our target for total water
withdrawal by tonne of product
(page 18).
Challenges
• We fell short of our target for
energy consumption per tonne of
product, due to higher volumes in
more energy intensive categories
(page 18);
• We continue to communicate
the proven consumer and health
benefi ts of bottled water while
also making progress on our
environmental commitments
(pages 20 and 44).
Nestlé also funded social and
environmental projects worth
CHF 50.7 million globally this year,
and we loaned CHF 30 million in
microcredit to farmers worldwide.
Suppliers
Nestlé does business with around
165 000 suppliers, and purchased
CHF 22.5 billion of raw materials
in 2008.
Governments
We paid CHF 3.2 billion in
income taxes.
Creating Shared Value
Three Areas of Focus
While we create shared value in many
ways, there are three areas of focus
which distinguish Nestlé from other
companies:
• Nutrition: Nestlé is the world’s
foremost Nutrition, Health and
Wellness company, and the primary
value created for consumers is
better nutrition. The companion
report, Creating Shared Value:
Nutritional needs and quality diets,
describes the extensive work
which Nestlé does in improving
nutrition globally;
• Water: Water is key to ensuring the
future of our business, and for global
food security. It is a key focus for
our operations;
• Rural development: Nestlé works
directly with almost 600 000 farmers
to increase their productivity,
thereby raising their standard
of living and our access to
quality raw materials. Most of
our factories are in rural areas,
which serve as platforms for
economic development in the
surrounding region.
Nestlé seeks ongoing feedback on its
Creating Shared Value reporting and
we make improvements in suggested
areas. For example, in this section
we provide more detail on our main
sustainability challenges and describe
our risk management process more
fully. Furthermore, we continue to
improve our performance monitoring
Nestlé conducts its business according
to the Nestlé Corporate Business
Principles and the Nestlé Code of
Business Conduct, as well as
complying with external legislation.
We also voluntarily support the ten
principles of the UN Global Compact
(page 21) and international certifi cation
standards such as ISO 14001 for
environmental management, and
OHSAS 18001 for occupational safety.
By operating in line with the goals of
sustainable development, we aim
to ensure that our actions today do not
compromise the needs of tomorrow.
But we believe our role can go further,
in generating value for society at
the same time as we generate value
for our shareholders.
Nestlé’s compliance with external
and internal laws and principles, and our
social and environmental commitments,
are the basis for Creating Shared Value
for stakeholders at each stage of the
value chain, including:
Shareholders
Nestlé’s fi nancial performance is
detailed throughout this report.
Employees
Nestlé employs 283 000 people
worldwide, of whom approximately
half are in developing countries.
In 2008, we paid salaries amounting
to CHF 16 billion.
Communities
Nestlé’s total capital expenditure is
CHF 4.9 billion, of which CHF 1.7 billion
is in developing countries. In China,
for example, Nestlé’s investment
began two decades ago. Since then
the Company has opened 19 factories
in 18 different sites across the
country and now employs around
13 000 people. In 2008 we opened a
new R&D centre in Beijing focused
on food safety and quality with an
investment of over CHF 11 million.
This brings the company’s total
R&D investment in China to
CHF 21 million and the number of
Nestlé Research employees in
China to over one hundred.
RA_report_01_23_GB.indd 14 3.3.2009 13:54:59

15Creating Shared Value
Reducing our environmental footprint
and reducing operational costs
Helping farmers improve earnings and ensuring
our supply of quality raw materials
68%Increase in production volume
since 1999
58%Water saved since 1999
per tonne of product
594 223Number of farmers receiving
technical assistance
20%Reduction of packaging
material for bottled water
in the fi ve years to end 2008
48%Reduction of greenhouse gas
emissions per tonne of product
since 1999
30 millionValue of microcredits to
farmers in 2008, in CHF
Improving workers’ earning capacity and creating
a skilled workforce
Improved nutrition for the consumer
and increasing sales and profi tability for Nestlé
42%In developing countries, local
Management Committee
members who are nationals
of the country
25%Leadership positions held
by women
6254Number of products renovated
for nutrition and health
considerations in 2008
70 167Number of employees in
developing countries who
received formal classroom
training
11 millionPredicted number of additional
low-income consumers using
Nestlé fortifi ed milk products
by end 2011
Creating Shared Value Highlights
Creating Shared Value at each stage of the value chain
Agriculture and rural development Environment, manufacturing
and people
Products and consumers
Farmers and
communities:
Helping improve
yields, incomes
and quality of life
Securing supplies
of high-quality
raw ingredients
Value for society
Value for Nestlé
Food and beverage
production:
Supplier standards:
Encouraging
responsible
practices among
suppliers
Promoting more
sustainable
methods in the
supply chain
Conserving
natural resources
Lowering
manufacturing
and distribution
costs
Providing job
opportunities in
safe, high-quality
workplaces
Helping
employees reach
their potential
Widening access
to nutritional
products
consumers prefer
Building brands
and entering
new markets
Achieving
competitive
shareholder
returns
Generating local
investment for
economic growth
Workforce
development:
Sales and growth:Responsible
marketing:
RA_report_01_23_GB.indd 15 3.3.2009 13:54:59

16 Nestlé Management Report 2008
prices for the highest-quality coffee
produced in line with sustainability
criteria, benefi ting farmers and
consumers and providing Nestlé with
higher-quality coffee (page 40).
Nestlé also actively participates
in programmes in the cocoa supply
chain. With the International Cocoa
Initiative (ICI) and the World Cocoa
Foundation we are working to improve
small growers’ incomes, eliminate
unacceptable child labour, and give
children better access to education.
In Côte d’Ivoire (producer of about
40% of the world’s cocoa) farmers’
yields and crop quality have been
declining. Nestlé is working with
three cooperatives in a pilot project to
improve yields and social conditions.
Nestlé has also joined UTZ, a leading
certifi cation initiative in which several
industries are participating. All these
initiatives are designed to contribute to
more sustainably produced cocoa, so
safeguarding the availability of quality
cocoa for the long term, and improving
farming communities’ earnings and
quality of life.
maximum effi ciency for suppliers:
Nestlé is an active member of the
PROGRESS taskforce of AIM (the
European Brands Association) and
GMA (The Association of Food,
Beverage and Consumer Products
Companies) dedicated to improving
the effectiveness and effi ciency of the
evaluation process in the supply chain.
Nestlé manages suppliers’ compliance
using common industry standards
and protocols. This approach helps to
achieve broad improvements and avoid
multiple assessments for suppliers.
Supporting farmers
Nestlé’s long-term commitment to
working directly with small farmers
continued in 2008. Today, Nestlé works
with almost 600 000 farmers globally,
providing free technical assistance and
around CHF 30 million of microloans
each year. This approach is central
to Nestlé’s milk strategy, ensuring a
stable, safe and high-quality supply
without involving middlemen. By
adapting the systematic approach
of the Swiss Milk District System
to dairy farming in developing
countries around the world, Nestlé
contributes to poverty reduction and
improved nutrition on a large scale,
and creates signifi cant, long-term
business success. The result has
been a signifi cant improvement in the
income of small dairy farmers, who
generated 5 million tonnes of locally
sourced milk through milk districts in
2007. Nestlé’s experience in assisting
farmers and creating a dairy industry
has been replicated in 29 countries to
date, from Inner Mongolia in China to
East Africa – where new plans are in
place to support the development of
the dairy industry in Kenya and Uganda
(page 33). In each case, as Nestlé has
prospered, so has the community.
Nestlé works with tens of
thousands of coffee growers as well,
to help them improve the quality and
quantity of their production, protect
the environment, and bring about
better social conditions. For example,
Nescafé Partners’ Blend and Nespresso
incentivise growers by paying premium
Key initiatives
Creating Shared Value initiatives
include:
• Helping to develop the dairy industry
in East Africa (page 33);
• Supporting cocoa farmers (pages 17
and 53);
• Nespresso AAA coffee:
sustainability in the brand DNA
(page 40);
• Häagen-Dazs: helping prevent the
decline of honey bees (page 49);
• Responsible agricultural sourcing
(page 47);
• Creating jobs in emerging
economies (page 33);
• Improving nutrition with Popularly
Positioned Products (page 38);
• Bringing clean water to communities
(page 21);
• Packaging eco-design (page 20);
• Innovations in bottled water
packaging: examples from the USA
(page 44);
• Measuring the corporate water
footprint (page 46);
• Capturing energy and avoiding
waste: “Java Log®” (page 46);
• Out-of-home leadership (page 38).
Nestlé’s initiatives in health and
nutrition – on topics including obesity
and malnutrition – are covered in depth
in our companion report, Creating
Shared Value: Nutritional needs and
quality diets.
Agriculture and rural development
Responsible Sourcing
Beyond our own sites, we are
increasingly focusing on social and
environmental standards in our supply
chain. In July 2008 we launched the
Nestlé Supplier Code to communicate
and reinforce our expectations.
Our Code covers all suppliers and
is accessible in multiple languages
via our website (www.nestle.com/
suppliers). More than 120 000 suppliers
have received the Code to date and
acknowledged it by fulfi lling purchase
orders or contracts that refer to the
Supplier Code.
With regard to ensuring compliance
with the requirements of the Code,
Nestlé is committed to achieve
RA_report_01_23_GB.indd 16 3.3.2009 13:55:08

17Creating Shared Value
1
Vietnam
Picking coffee near
Dak Lak, that will be
used to supply the
Nescafé factory
in Ho Chi Minh City.
2
Côte d’Ivoire –
Harvesting cocoa
Nestlé is funding a
three-year sustainable
cocoa project with
three cooperatives of
about 3000 farmers.
3
Erguna, Inner
Mongolia, China
Dairy farmers
delivering their milk
to the new Nestlé
collection station.
1
2 3
RA_report_01_23_GB.indd 17 3.3.2009 13:55:08

18 Nestlé Management Report 2008
consumption targets by product
categories as we seek to achieve
energy effi ciency improvements of at
least 5% in each of our key product
categories over the next fi ve years.
We published 2007 data on both
direct and indirect energy consumption
and CO2 emissions for the fi rst time in
2008. While this was an important step
forward, we initially met challenges
with defi nitions and data collection,
which have now been rectifi ed.
Nestlé’s direct carbon footprint
comes mainly from its factories.
Although transport and logistics
account for less than 10% of total
direct CO2 emissions, we will survey
these areas in order to identify future
potential reductions in cost, fuel
consumption and GHG emissions.
At present, we estimate that our
transport fl eet drove approximately
300 million km in 2008, producing
about 250 000 tonnes CO2.
Externally, Nestlé continued to
participate in the Carbon Disclosure
Project (CDP), the leading international
forum for reporting progress and
sharing good practice. As a founder
member of the CDP’s Supply Chain
Leadership Collaboration group we are
working to extend this group’s scope
to include water issues. In order to
help develop relevant metrics for the
industry, we are also participating in
the Global Reporting Initiative (GRI)
Food Processing Sector Supplement
Working Group.
water used in the washing and pulping
of coffee cherries – one of the most
potentially wasteful uses of water.
Through community partnerships
this year, we helped provide access
to clean water to 22 000 in Rwanda.
We are completing a project with
the International Federation of Red
Cross and Red Crescent Societies
(IFRC) in Côte d’Ivoire, developing the
Ivorian Red Cross water and sanitation
response capacity and providing clean
water and sanitation for 50 000 people.
Another IFRC water and sanitation
project for schools in the country’s
cocoa-growing belt will be carried out
in 2009.
Our Chairman, Peter Brabeck-
Letmathe, has consistently
championed water sustainability
issues. This effort contributed to water
being discussed at the January 2008
World Economic Forum’s meeting
in Davos. Nestlé has also repeatedly
called for water to be given a higher
priority and has drawn attention to
the serious impact on water resources
from biofuels. We have also called for
more investment in water infrastructure
at country and city level, and better
management, governance and pricing
of water.
In July 2007, our Chairman was
one of several founder signatories of
the UN Global Compact CEO Water
Mandate, and by August 2008 this had
been endorsed by 32 business leaders.
The Group has recently held working
conferences on water footprinting and
supply chain, and made a submission
to the G8 calling for priority to be given
to managing water resources.
Energy effi ciency
and climate change
Nestlé’s energy management strategy
is based on continuous improvement
and innovation and seeks to achieve
reductions in energy usage, cost and
greenhouse gas emissions. In 2008
energy consumption differences in
our product mix meant we did not
achieve our expected overall energy
performance target. Going forward,
we will investigate setting energy
Environment, manufacturing
and people
Our key environmental sustainability
challenges are water conservation
(our top environmental priority),
energy effi ciency and climate change,
and packaging. For a full set of
environmental indicators, see page 76.
Water conservation
and management
Nestlé’s approach starts with good
water management in our own
operations. We achieved our water
targets for 2008 and reduced water
withdrawal per tonne of production by
6% – part of a long-term approach that
has seen us reduce water withdrawals
per tonne of product by 58% since
1999. We aim to achieve a further
water effi ciency improvement of at
least 10% over the next fi ve years. In
relation to bottled water, it now takes
1.76 litres of water to produce 1 litre,
a fall of 26% since 1999. This
compares favourably with other
packaged beverages.
Establishing the water footprint of
companies and products is a complex
science in its infancy. This year we
began participating with industry, NGO
and academic partners to develop a
sound basis for measurement that
can lead to further performance
improvements (page 46).
From as early as 1929, Nestlé has
installed water treatment plants in its
operations. 68% of our factories now
operate such plants, which often go
beyond local legislation, with 98%
treating their water on-site or via off-site
facilities. In line with international water
quality standards, we remove 96%
of the organic load in the water used
in our production processes before
returning it to the environment.
Agriculture accounts for 70% of
global fresh water withdrawals and
Nestlé agronomists are supporting
farmers to adopt good practices. In
Shuangcheng, China, we are helping
dairy farmers to manage effl uent
correctly. In Ethiopia, El Salvador,
Mexico and Nicaragua, we have helped
coffee growers save up to 90% of the
RA_report_01_23_GB.indd 18 3.3.2009 13:55:08

19Creating Shared Value
1
Peter Brabeck-
Letmathe
Our Chairman
contributed to water
being discussed at
the World Economic
Forum, in Davos,
Switzerland.
2
Brazil, Feira de
Santana
In the context of
increased production,
we have reduced our
global energy use
by 42% per tonne of
product over the past
ten years.
3
Shuangcheng,
China
Nestlé has installed
water treatment
plants in its
operations, which
often go beyond
local legislation.
3
1 2
RA_report_01_23_GB.indd 19 3.3.2009 13:55:09
20 Nestlé Management Report 2008
in our injury rates and continue to
invest in training and best practices to
accelerate this trend. Our aim is to be
among the leaders in our industry peer
group by 2012, which implies no more
than one lost time injury per million
hours worked.
Products and consumers
Responsible consumer
communications
Our approach is enshrined in the Nestlé
Corporate Business Principles
(www.nestle.com/AllAbout) and
Consumer Communication Principles,
supported by compliance guidelines
for marketing staff and advertising
agencies. In July 2007, Nestlé
strengthened its commitments towards
children with two provisions to be
implemented in all countries by the end
of 2008: (1) no advertising or marketing
activity to be directed at children under
6 years old; (2) advertising for children
from 6 to 12 years to be restricted to
products with a nutritional profi le that
helps achieve a healthy balanced diet.
Nestlé also participates in industry
initiatives including the European
Advertising Standards Alliance
(EASA). In 2008, all the 84 Nestlé
advertisements monitored by
EASA complied. In addition, Nestlé
has, to date, joined fi ve voluntary,
independently monitored initiatives at
a national and regional level. These are
the “EU Pledge”, the “Thai Pledge”,
and the Children’s Food and Beverage
Advertising Initiatives in Australia,
Canada and the United States.
Read more at
www.nestle.com/SharedValueCSR/
ProductsAndConsumers/
MarketingAndCommunications/
MarketingAndAdvertising.htm
with applicable regulations and our
own internal standards.
In 2008 Nestlé was fi ned seven
times for infringement of environmental
regulations, amounting to CHF 34 312.
Remedial action has been instigated to
prevent future occurences.
241 Nestlé factories (53%) are now
certifi ed to ISO 14001, the leading
international environmental standard
(2007: 101/22%).
Employee and contractor
health and safety
Nestlé has achieved very important
reductions in workplace accidents
for more than a decade by
systematically improving safety culture,
attitudes and behaviours, achieving
factory certifi cations to OHSAS 18001
(the leading occupational safety
standard), and monthly monitoring
of safety indicators at corporate,
market and site level. In the last fi ve
years alone the Lost Time Injury
rate has fallen by 70%.
An updated Nestlé Policy on
Safety and Health at Work
(www.nestle.com/people/safety) was
issued in 2008 to reiterate that employee
safety is our top priority and to promote
higher standards in our supply chain.
Our large-scale operations make it
necessary to give particular attention
to safe driving. In order to reduce the
risk of traffi c accidents for employees
and contractors, we rolled out a global,
Company-wide safe driving programme
covering all operating regions.
Workplace safety performance
• Notwithstanding our constant
attention to safety, Nestlé was the
object of 7 health & safety fi nes for a
total amount of CHF 79 200 in 2008;
• Despite our best efforts to prevent
accidents and to our deepest
regret, 13 fatalities occurred in 2008
(2007: 15). 4 employees and
2 contractors were fatally injured
on site. In addition, 6 employees
died in road traffi c accidents; and
another in a fall off-site.
Our constant goal is zero accidents.
We have made important reductions
Eco-effi cient packaging
Packaging is essential for food safety.
It also helps to avoid wastage before
and after purchase by maintaining
freshness for the consumer. Our
strategy is based on optimising
materials, developing eco-effi cient
packaging, and providing meaningful
information to consumers on recycling
and disposal. A key initiative this
year was our collaboration on PIQET,
an important new packaging eco-
design tool adopted by Nestlé. Design
and technology innovations go hand
in hand in order to reduce
environmental impacts without
compromising consumer needs.
Our new Nestlé NaturNes babyfood
pot is not only convenient and easy
to use but requires less energy
and produces fewer CO2 emissions
over its life cycle than the previous
glass jar (page 45).
Nestlé Waters’ lightweight
EcoShape bottle is another step
forward in reducing packaging
materials, and is just one example
of progress made since 1991, when
Nestlé began a continuous review
of packaging reduction opportunities
in all its businesses. As a result, we
have reduced the volume of packaging
material used per litre of bottled
water by 19.6% over the last fi ve years,
saving 43 792 tonnes of packaging
material in 2008 alone. Worldwide,
the Goup’s total packaging material
savings from 1991 to 2008 amounted
to 392 000 tonnes and CHF 683 million.
Complying with environmental
standards
An updated Nestlé Policy on
Environmental Sustainability
(www.nestle.com/csv/environment),
fi rst published in 1991, was
launched in 2008 to expand Nestlé’s
environmental commitments. This
policy and the Nestlé Environmental
Management System, which is
aligned with ISO 14001 requirements,
defi ne our commitments, principles
and procedures for environmental
protection and performance
improvement, including compliance
RA_report_01_23_GB.indd 20 3.3.2009 13:55:09

21Creating Shared Value
UN Global Compact Principles
Examples of progress 2008
Human Rights
Initiated a Human Rights Compliance
Assessment with the Danish Institute
for Human Rights (DIHR), in order to
evaluate potential human rights and
labour rights risks in corporate policies
or monitoring systems.
Labour
In addition, we launched the new Nestlé
Supplier Code, which has provisions on
working hours, compensation and non-
discrimination; prohibits prison labour,
forced labour and child labour; and states
Nestlé’s rights to audit, request corrective
measures and terminate contracts.
Environment
Updated Nestlé Policy on Environmental
Sustainability to expand commitments.
Enhanced measurement of carbon
footprint and energy effi ciency by
reporting indirect energy consumption and
CO2 emissions for the fi rst time.
Anti-corruption
Rolled out a new e-learning tool on anti-
trust to reinforce the principles of the
Nestlé Code of Business Conduct among
employees. We also translated and
disseminated the Code in six languages
and started developing concepts
for an e-learning module specifi cally
on anti-corruption.
UN Millennium Development Goals
Examples of progress 2008
Poverty and hunger
Invested CHF 50.7 million in
community projects.
Education
Cote d’Ivoire cocoa supply chain:
sponsored programmes to improve
children’s access to education and raise
awareness in local communities to prevent
the worst forms of child labour.
Water conservation and education:
continued to share expertise and good
practice with almost 600 000 farmers
worldwide; continued to support Project
WET, which to date has trained over
400 000 teachers and reached several
million children in over twenty countries.
Gender equality
In rural Pakistan, we continued a joint
initiative with the United Nations
Development Programme to empower
4000 female dairy farmers with the skills
and knowledge needed to improve the
quality and value of their milk yields.
HIV/AIDS, malaria and other diseases
Continued fi nancial support for the
development of the IFRC’s global HIV/AIDS
training materials.
Environment
Provided funding and support for projects
to deliver clean water to villages in Rwanda
and Côte d’Ivoire.
Global partnerships
Nestlé supports international sustainable
development initiatives including the IFRC,
Common Code for the Coffee Community
(4C), International Cocoa Initiative, and the
UNGC CEO Water Mandate.
1
Pakistan
Some of the
4000 women
livestock workers
trained as part of
this UNDP-Nestlé
partnership learn
about correct water
management on
their dairy farms.
2
Côte d’Ivoire
A Nestlé-sponsored
farmer fi eld school
in Norbertkro
teaches responsible
labour practices,
the importance of
schooling for children
and sustainable
farming methods.
3
Rwanda
A Nestlé-sponsored
community based
clean drinking water
project in partnership
with the Lutheran
World Federation
and Interfaith Action
for Peace in Africa at
Kirehe, which reaches
approximately
22 000 villagers.
31, 2
RA_report_01_23_GB.indd 21 3.3.2009 13:55:09

Nestlé Management Report 200822
Public engagement principles
We engage in ongoing dialogue with
a wide variety of stakeholders. This
includes: government and regulatory
authorities in order to promote
and implement sound legislation
and regulation; non-governmental
organisations that are committed
to constructive engagement and
principled behaviour; academic and
professional bodies to foster new
knowledge; and local communities to
promote their well-being.
In addition, the Operations
Sustainability Council and the Issues
Round Table, both of which are chaired
by members of the Executive Board,
identify and manage challenges
in the medium to longer term. Key
issues which have been identifi ed
through these fora are: environmental
sustainability – particularly water
conservation, energy effi ciency
and climate change; the sustainability
of agricultural raw materials; and
supply chain standards including
human rights and working conditions.
There are examples throughout this
report of how we are responding
to these challenges.
Complying with Nestlé Corporate
Business Principles
CARE is Nestlé’s group-wide
integrated programme which verifi es,
through three leading, independent
international certifi cation bodies,
that our operations comply with
local legislation and with the Nestlé
Corporate Business Principles. CARE
audits are carried out on a three-
yearly basis. Since July 2005, when
the programme was initiated, over
490 sites have completed CARE audits.
We aim to extend CARE to all Nestlé
employees and all sites owned or
operated by Nestlé by the end of 2010.
CARE fi ndings are classifi ed in three
categories: “minor” (isolated and non-
repetitive); “major” (systematic and
repetitive); and “critical” (exceptional
requiring immediate notifi cation to
Nestlé Compliance Committee).
Out of 490+ sites reports (as of end
December 2008), there were no critical
fi ndings in any of the assessment
criteria. 91% of fi ndings were classifi ed
as minor and 9% as major. The CARE
action plans are followed up and
monitored through line management.
Group Internal Audit then follows up
on CARE corrective actions when it
visits the sites.
Widening access to affordable food
Through Popularly Positioned Products
(PPPs) we continue to widen access to
high-quality, nutritious and affordable
food. It is estimated that micronutrient
defi ciencies account for over 7% of
the global incidence of disease. By
adding micronutrients to our PPPs
we are helping to address the most
prevalent defi ciencies. In emerging
markets, for example, Nestlé is making
safe, nutritionally fortifi ed milks readily
accessible to lower-income families.
Please see our companion report,
Nutritional needs and quality diets, for
many other examples of how Nestlé is
Creating Shared Value for consumers.
Compliance and Engagement
UN Global Compact Principles and
Millennium Development Goals
Nestlé Corporate Business Principles
have incorporated the 10 UN Global
Compact (UNGC) Principles since
2002. In partnership with others
(for example, the International Cocoa
Initiative), we also contribute
towards the UN Millennium
Development Goals.
Risk management and compliance
Nestlé’s established risk management
process supports early risk anticipation,
identifi es mitigating actions to manage
emerging issues and enables sound
business decisions to be made. The
process identifi es for the Executive
Board those risks which require
closer attention and management
in the short term. Scenarios such as
climate change and shifts in farming
practice are analysed, together with
other external factors that might lead
to signifi cant fl uctuations in the price
and availability of raw ingredients
and packaging materials. The risk
management process also covers
major capital expenditure and other
important projects.
RA_report_01_23_GB.indd 22 3.3.2009 13:55:09

23Creating Shared Value
1
Colombia,
educating workers
on quality
and safety
An employee checks
his clothing before
entering a sanitised
area in the Dos
Quebradas factory.
2
Brazil
Our Direct Store
Delivery system
ensures that
affordable, nutritious
Popularly Positioned
Products are available
to consumers from
lower income groups.
3
Germany, Mainz
Co-generation
plant where spent
coffee grounds are
used as fuel.
1
2 3
RA_report_01_23_GB.indd 23 3.3.2009 13:55:10

24 Nestlé Management Report 2008
The 4 x 4 x 4 roadmap
Unmatched
product
and brand
portfolio
Nutrition,
health and
wellness
Innovation
& renovation
Unmatched
geographic
presence
Out-of-home
leadership
Whenever,
wherever,
however
Unmatched
R&D capability
Emerging
markets and
popularly
positioned
products
Operational
effi ciency
People,
culture, values
and attitude
PremiumisationConsumer
communication
The recognised reference for Nutrition, Health and Wellness, and
Financial Performance
Competitive advantages
Growth drivers
Strategicpillars
RA_report_24_41_GB.indd 24 3.3.2009 14:00:27
25Nestlé Management Report 2008
Nestlé’s aim is to be the recognised leading Nutrition, Health and Wellness company in the world and the reference for fi nancial performance in our industry Over the last few years, we have consistently delivered the Nestlé Model, which is the combination of a high level of organic growth with an annual improvement in the EBIT margin, whilst also delivering our strategy to transform Nestlé from a food and beverage company into a Nutrition, Health and Wellness company. This has enabled us to deliver shorter-term performance whilst securing the foundations for longer-term profi table growth.
The opportunity today is to capitalise on these achievements and build gaps with our competitors by accelerating our operational performance. The path we have chosen is our 4 x 4 x 4 roadmap, comprising four competitive advantages, four growth drivers and four strategic pillars.
The 4 x 4 x 4 roadmap will enable a continued strong performance, relative to our peers, measured by the creation of shareholder value. It combines the right strategy and the necessary defensive qualities for the current environment with dynamic growth potential as economies recover.
At Nestlé, we are committed to a way of doing business which we call “Creating Shared Value”. The cornerstone belief is that the only way for business to create long-term value for its shareholders is by also creating value for those societies in which it operates. You will come across creating shared value again and again over the next few pages. Some might describe it as an approach to corporate social responsibility. We describe it as an approach to doing business.
The 4 x 4 x 4 roadmap to deliver growth and enhance performance The different elements of the 4 x 4 x 4 roadmap overlap, interact and complement each other.
Competitive advantagesIndividually and together, our four competitive advantages uniquely differentiate our Company.Growth driversFour key opportunities, applicable across our product categories, offer potential for enhanced growth.Strategic pillarsEach of our four strategic pillars represents an area of core competence in which we seek to excel.
For example, our industry leading R&D capability enables us to innovate and renovate our unmatched portfolio of “billionaire” brands at the necessary pace to ensure differentiation from and consumer preference over competitors’ products. Our unmatched geographic presence meanwhile in terms of history, depth and coverage, enables us to drive our PPP (Popularly Positioned Products) strategy deeper and quicker into the world’s emerging markets.
RA_report_24_41_GB.indd 25 3.3.2009 14:00:28

26 Nestlé Management Report 2008
Nestlé has a unique set of inherent strengths to help fulfi l its nutrition, health and wellness vision, meet the challenge of intense competition, and deliver the Nestlé Model of shareholder value creation. A key objective is to leverage these strengths to build gaps between us and our competitors.
Four CompetitiveAdvantages
Unmatchedproduct
and brand portfolio
Unmatchedgeographic presence
Unmatched R&D capability
People,culture, values and attitude
RA_report_24_41_GB.indd 26 3.3.2009 14:00:28

27Four competitive advantages
RA_report_24_41_GB.indd 27 3.3.2009 14:00:43
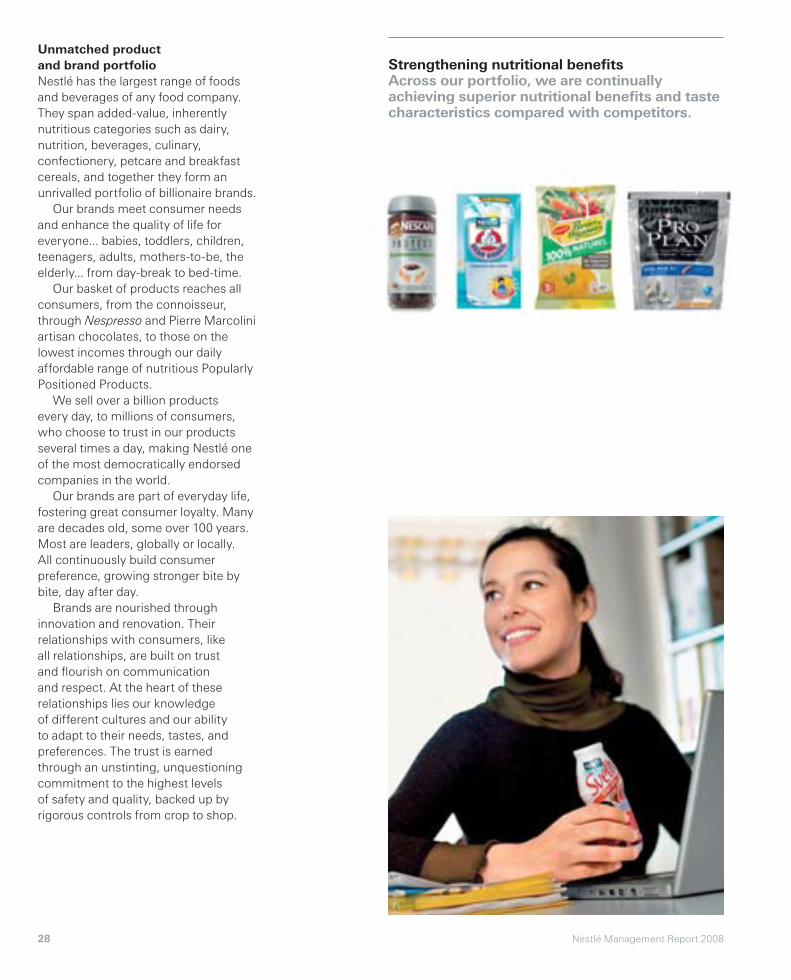
28 Nestlé Management Report 2008
Strengthening nutritional benefi tsAcross our portfolio, we are continually achieving superior nutritional benefi ts and taste characteristics compared with competitors.
Unmatched product
and brand portfolio
Nestlé has the largest range of foods
and beverages of any food company.
They span added-value, inherently
nutritious categories such as dairy,
nutrition, beverages, culinary,
confectionery, petcare and breakfast
cereals, and together they form an
unrivalled portfolio of billionaire brands.
Our brands meet consumer needs
and enhance the quality of life for
everyone... babies, toddlers, children,
teenagers, adults, mothers-to-be, the
elderly... from day-break to bed-time.
Our basket of products reaches all
consumers, from the connoisseur,
through Nespresso and Pierre Marcolini
artisan chocolates, to those on the
lowest incomes through our daily
affordable range of nutritious Popularly
Positioned Products.
We sell over a billion products
every day, to millions of consumers,
who choose to trust in our products
several times a day, making Nestlé one
of the most democratically endorsed
companies in the world.
Our brands are part of everyday life,
fostering great consumer loyalty. Many
are decades old, some over 100 years.
Most are leaders, globally or locally.
All continuously build consumer
preference, growing stronger bite by
bite, day after day.
Brands are nourished through
innovation and renovation. Their
relationships with consumers, like
all relationships, are built on trust
and fl ourish on communication
and respect. At the heart of these
relationships lies our knowledge
of different cultures and our ability
to adapt to their needs, tastes, and
preferences. The trust is earned
through an unstinting, unquestioning
commitment to the highest levels
of safety and quality, backed up by
rigorous controls from crop to shop.
RA_report_24_41_GB.indd 28 3.3.2009 14:00:54

29Four competitive advantages
Fast profi table growth Our “billionaire” brands, each with annual sales of more than CHF 1 billion, account for about 70% of our Food and Beverages sales. Generally, they are growing faster than market average, and most have higher than Group average margins.
Prepared dishes and cooking aids
Beverages
Water
PetCare Pharmaceutical products
Nutrition
Confectionery Ice cream
Milk products
®
RA_report_24_41_GB.indd 29 3.3.2009 14:00:54

30 Nestlé Management Report 2008
Unmatched geographic presence
The competitive advantage created by
our unmatched geographic presence,
with our products marketed in about
130 countries, is not simply our
global spread, as many companies
can claim a similar reach, nor is it just
our scale, with over CHF 35 billion
of sales in emerging countries. It is
the fact that we have been in most
countries for many decades, many for
over a hundred years. It means that
our products have been enjoyed by
generations of families, that many of
our brands are perceived as local by
our consumers, and that we have
an unmatched reputation for quality,
taste and nutrition. It also means
that we’ve had plenty of time to learn
and understand local cultures and
habits, and benefi t local economies
and communities.
A signifi cant part of that benefi t
comes from our manufacturing asset
base, with 456 factories located
all over the world. These factories
represent our long-term commitment
to contribute to economic prosperity
in the communities where we
are present through investment,
profi table growth and increasing
employment opportunities.
Although our products are available
all over the world, we do not believe
in a standard worldwide taste. We go
to great lengths to adapt our products
to local tastes. Although Maggi is a
global brand, its soup products are
very different, for example, in Poland
from Indonesia. Nescafé, meanwhile,
has over 200 formulations around the
world. That said, our long-standing
presence in countries all over the world
has enabled us to learn about the
shared opportunities that our product
categories have in different countries,
as well as the need to tailor and adapt.
This means that we are able to drive
growth by quickly rolling out our
products across many countries.
Although Nestlé is a global giant
and the world’s largest food and
beverage company, it is a closely knit
network of local companies, each
with suffi cient scale to leverage its
Pioneering science-based researchOur relentless pursuit of innovation is
spearheading research that feeds into our
whole portfolio of products. It focuses on
eight consumer benefi t areas. (For each,
we have included some product examples.)
Protection
Nido growing up milk with immune
enhancing properties; Nescafé Protect,
rich in polyphenols and antioxidants.
Weight management
Jenny Craig personalised nutrition
programmes; Sveltesse low fat,
fi bre enriched drinking yoghurt; Lean
Cuisine calorie controlled meals.
Healthy recovery
Clinutren Protect decreases the side
effects of chemo/radiotherapy and
aids digestion pre/post surgery.
Growth & development
Cerelac infant cereal with Prebio 1
facilitates babies’ digestion of critical
nutrients and supports the development
of healthy gut fl ora.
Digestive comfort
Nesvita and Svelty functional milks and
yoghurts have soluble fi bres to support
regularity and help reduce bloating.
Performance
PowerBar has a special blend of
carbohydrates for optimum sustained
energy delivery.
Healthy ageing
Proprietary Nestlé BABs (Branded Active
Benefi ts) such as Omega 3-6 and ActiCol
contribute to cardio-vascular health.
Skin health & beauty
innéov products address skin anti-ageing,
UV protection and hair quality.
Unmatched R&D capability
Nestlé has a long nutritional science
heritage. The fi rst product to carry the
name of the company’s founder, Henri
Nestlé, was an innovative infant cereal
developed to nurture babies, giving
them a healthy start in life. His ambition
even in 1866 was to market his product
and its benefi ts across the world.
Since then, Nestlé has gone from
strength to strength but always
following in the footsteps of Henri
Nestlé, ensuring its products meet
consumer needs by inventive research
to provide positive benefi ts for millions
of people.
For example, our Nestlé Nutrition
business is pioneering new ground
in specialised nutrition by developing
and delivering innovative, effective,
scientifi cally proven products with
functional benefi ts. For babies, the
development of Infant Formulas with
probiotics which can support the
immune system is one example. For
the elderly, we are investigating the
role of nutrition in maintaining mobility
and independence during old age.
Nestlé spent CHF 2 billion on R&D
in 2008 – more than any other food
company. We have about 5000 people
from over 50 countries working
in our R&D network of Research
Centres, Product Technology Centres
and Application Groups around the
world. This is greatly expanded by our
open innovation that taps into some
300 external research institutions,
including universities, start-ups, and
key suppliers, as well as our own
venture funds.
Consumer insights and Nutrition,
Health and Wellness benefi ts are
the starting points for our R&D and
the fuel for our innovation pipeline
across all categories. But R&D extends
beyond the product itself, developing
new technologies, for example for
packaging and vending machines,
and researching specifi c areas such as
ingredient and product safety, sensory
quality and metabolics.
Decades of local experience
Nestlé has always been the most
multi national food company, and has been
present in most countries far longer than
competitors.
Australia over 100 years
Africa over 80 years
Brazil over 80 years
China over 130 years
Germany over 130 years
India over 90 years
Mexico over 70 years
Switzerland over 140 years
UK over 130 years
USA over 110 years
RA_report_24_41_GB.indd 30 3.3.2009 14:01:17

31Four competitive advantages
Second R&D Centre in China The R&D Centre in Beijing, opened in November 2008, complements our existing research centre in Shanghai and our 19 factories in Greater China.
1
Innovative science
and technology
The Nestlé Research
Centre in Lausanne,
Switzerland is home
to more than 300 PhD
scientists committed
to discovering
new ways for nutrition
to contribute
to good health.
2
Pioneering
innovation
We are inventing the
future. For example,
one of our external
collaborations,
with EPFL (Ecole
Polytechnique
Fédérale de
Lausanne) is
developing the
world’s leading
diet and brain
research programme.
1, 2
RA_report_24_41_GB.indd 31 3.3.2009 14:01:17

32 Nestlé Management Report 2008
Extending our values beyond
our own people
We run more than 150 projects worldwide
to ensure more stable, sustainable incomes
for farmers and long-term high quality
supplies for Nestlé. Our 771 agronomists
and 7787 technical experts work with
almost 600 000 farmers. For example,
in developing countries we are helping
dairy farmers to improve milk quality and
quantity through livestock management
and genetics. Our Swiss ‘milk district’
system of cooling and collection stations,
fi rst introduced by Nestlé to Brazil and
South Africa in the 1920s and now in
30 countries, has helped farmers improve
their earnings by an average of 2%-5%
each year.
Nutrition Training in Nestlé
The NQ (Nutritional Quotient) Nutrition
Training programme is part of our
WellNes in Action strategy. Nutrition
is everybody’s business at Nestlé, and
NQ encourages a healthier lifestyle and
healthier eating among employees, who
in turn are able to develop better products
and infl uence their family and friends.
79 353 employees have already taken
part. Before the course, a test determines
the employee’s NQ – i.e. their level of
health and nutrition knowledge. After the
training, a further test shows qualitative
and quantitative progress.
to life by our people. They are applied
globally in each of our markets to
ensure that our behaviour and our
way of doing business is consistent
everywhere. This creates a powerful
force of 283 000 people with one set
of values, aligned behind our vision,
focused on achieving our objectives.
own synergies, yet agile and nimble
in spotting opportunities and tackling
challenges. Our principle is “centralise
what we can, but decentralise as much
as possible”.
People, culture, values and attitude
Our emphasis on both leveraging
our scale and being agile in our
approach to business opportunities
and challenges is part of our cultural
DNA. Our people thrive within this
environment. Their strengths, talent
and energy are the life blood of our
organisation. Our culture places a high
value on long-term thinking, integrity,
mutual respect, pragmatism, openness
to diversity and a passion for quality
and for pleasing our consumers.
We are highly disciplined. We are
aligned on our vision. We have the
tools, best practices and skills to allow
us to translate vision to action. We
respond to challenges thoughtfully and
with the benefi t of experience. We are
never satisfi ed with the status quo, and
are constantly challenging ourselves
for greater speed, effi ciency, learning
and achievement.
Our approach to decision making is
based on pragmatism and fl exibility.
We delegate to those best qualifi ed
to make the best decisions regardless
of hierarchy. We are experts in team
work, fully aligned behind common
objectives, with a clear focus on
individual responsibility and action.
We are open to ideas and willing to
learn. We provide individuals with the
opportunity to add value in whatever
way they can.
We are a truly international
company that enjoys a rich diversity
of nationalities. This provides us with
a unique competitive advantage.
For example, diverse local insights
are a catalyst for better innovation.
Multi-functional, multi-cultural teams
optimise product launches. Multi-
cultural leadership ensures a rich blend
of ideas and opinions. Decision making
is strengthened through critical cultural
insights and local knowledge.
Our principles are clearly articulated
on our website, but they are brought
RA_report_24_41_GB.indd 32 3.3.2009 14:01:17

33Four competitive advantages
1
Strong commitment
to training
Classroom and
e-learning involves
260 000 employees
each year.
In the last six years,
3000 key people
participated in
Leadership Training
at the London
Business School.
2
Talent has no
nationality
Over 100 nationalities
work at Nestlé. This
diversity is clearly a
benefi t. Each year
many of our people
move from country
to country, sharing
their experience.
3
Food is local
To meet local needs,
there are many
thousands of Nestlé
products produced
in 456 factories
in more than
80 countries.
Helping to develop the dairy industry
in East Africa
Over the next two years, Nestlé is
supporting the East African Dairy
Development Board through a programme
designed to increase the income of dairy
farmers in Kenya and Uganda. Farmers
will be trained to improve breeding and
feeding practices so they can obtain
better, higher quality yields, and help
increase the quantity and quality of fresh
milk supply with a view to secure delivery
of instant full cream milk powder bulk.
Nestlé has provided extensive technical
assistance in the areas of Production &
Quality Assurance to bring product quality
from New Kenya Cooperative Creameries
and Sameer Agriculture and Livestock Ltd
up to required standards to initiate this
sourcing arrangement, and we expect
volumes to increase in line with the growth
of our businesses. Producing more full
cream milk powder in these countries
enables Nestlé to export milk products
to other COMESA (Common Market for
Eastern and Southern Africa) countries
with reduced tariffs and duties, increasing
both availability and affordability in the
Equatorial African Region.
Benefi ting local communities
by creating jobs in emerging economies
Nestlé’s capital expenditure for the last
few years has been between 3.5% and
5% of sales, reaching CHF 4.9 billion
in 2008 alone. Much of this investment
has been for increased capacity to support
growth, and much has been in emerging
countries, where 48% of Nestlé’s factories
are located. This growth has led to
increased employment at Nestlé, as well as
greater opportunities for Nestlé’s partners,
suppliers and contractors.
1, 2
3
RA_report_24_41_GB.indd 33 3.3.2009 14:01:18

34 Nestlé Management Report 2008
Nestlé’s track record demonstrates that we are one of the fastest growing companies in our industry. This refl ects the dynamics of those categories that we have chosen to be in, as well as the success of our strategy to focus on added value products and, in particular, on nutrition, health and wellness. We believe that we will continue to set the pace for growth in our industry, and we have four specifi c but broad reaching areas that offer particularly exciting potential across many categories and countries. They are as relevant to consumers today, in a tough economic environment, as they are in happier times and, as such, will enhance our shorter-term defensive characteristics as well as providing growth momentum in the future.
Four Growth Drivers
Nutrition, health and wellness
Out-of-home leadership
Emergingmarkets and
popularly positioned products
Premiumisation
RA_report_24_41_GB.indd 34 3.3.2009 14:01:18

35Four growth drivers
RA_report_24_41_GB.indd 35 3.3.2009 14:01:41

36 Nestlé Management Report 2008
Taste and nutritional superiority
Our 60/40+ initiative is unique in ensuring
that nutritionally-enhanced products
always meet consumers’ taste preferences.
60/40+ is accelerating growth, driving
innovation and renovation, and is at the
heart of our ambition to be recognised as
the leading Nutrition, Health and Wellness
company. It works in two ways. First it
measures a product’s taste performance
against its key competitors – our aim is
to win by at least a 60 to 40 preference.
Second, it measures nutritional superiority,
the “+”. It is the largest initiative of its kind
in the industry. In 2008, products with
sales of CHF 13.6 billion were analysed.
100% natural
NaturNes is the fi rst wholly natural baby
food to be launched in Europe. Maggi
Panier de Légumes is the fi rst 100%
natural sachet soup in France. Maggi
Cream of Mushroom soup in the Middle
East, made with natural bolet mushrooms,
is free of preservatives and scored a
taste preference of 74%. Milkybar in the
UK is a mainstream confectionery brand
positioned as “all natural”.
Sharing science-based knowledge
The Nestlé Nutrition Institute is the world’s
largest publisher of nutritional information
for scientists, and contributes signifi cantly
to the nutritional education of doctors
and other healthcare professionals.
Last year, a book, “Paediatric Nutrition
in Practice” was launched at the World
Paediatric Congress. With a targeted
distribution of 50 000, it’s likely to be one
of the most widely used reference books
for paediatricians, medical students,
nutritionists, pharmacists, dieticians
and midwives working in preventive and
curative services in both affl uent and
poorer populations around the world.
company as well as strengthening its
market positions.
Our opportunity for bigger, better
bolder innovation is enormous. We
pioneered the use of probiotics, and
today are applying them in products
worth more than CHF 3 billion.
Looking ahead, to cite just two
examples, we’re involved in research
into brain development and
deterioration, and personal
diagnostics for health and nutrition.
Nutrition, Health and Wellness
People’s desire for nutrition, health and
wellness runs deep. It’s a fundamental
need regardless of geography, culture,
or income.
A healthy and balanced diet must
be enjoyable in order to be sustainable.
That’s why we focus on “positive
nutrition”, delivering superior nutrition
with superior taste. It’s not to do
with not eating certain foods, but
having good products in the right
quantities. Reducing calories can be
good, but improving the nutritional
profi le and adding fl avour and pleasure
are important.
If we offer better taste than our
competitors, we sell more products.
If we offer better nutrition, we sell
more products. If we combine both
better taste and better nutrition, we
create a compelling proposition for
consumers and ensure accelerated
profi table growth. This is what we call
achieving 60/40+. We are doing this
across our portfolio by reducing trans
fatty acids, salt and sugar or increasing
micronutrients such as vitamins and
minerals or adding our proprietary
BABs (Branded Active Benefi ts).
We are improving nutritional
density, adding whole grains, calcium,
Omega-3s and antioxidants. 6027
of our products were renovated for
nutrition or health considerations
in 2008: 2998 now provide increased
contents of nutrition ingredients or
essential nutrients, and 3029 contain
less sodium, sugars, trans fatty acids,
total fat or artifi cial colourings.
Our Nestlé Nutrition business
enhances quality of life for people with
specifi c needs. Its range of specialist
products address weight management,
optimise athletes’ performance, help
patients suffering from illness or
disease – or who are in intensive care –
and help premature babies and babies
with digestive problems.
The successful integration of recent
acquisitions Gerber, Novartis Medical
Nutrition and Jenny Craig has brought
additional valuable nutritional expertise
to the world’s leading Nutrition
RA_report_24_41_GB.indd 36 3.3.2009 14:02:02

37Four growth drivers
1
Our 60/40+
initiative is unique
More than 300
60/40+ managers,
Nutrition, Health and
Wellness managers
and nutritionists are
devoted to making the
60/40+ programme
deliver tasty nutrition
around the world.
2, 3
Nutrition education
For years, Nestlé
has run programmes
reaching over
10 million school
children to give
them a better
understanding of the
basics of nutrition.
Fast roll-out
delivers faster
incremental sales
Nestlé NAN with
probiotics was
launched in 2005,
has been rolled out
to over 70 countries,
and is now a
billionaire brand.
Its 2008 organic
growth was 24.5%.
2 3
1
RA_report_24_41_GB.indd 37 3.3.2009 14:02:02

38 Nestlé Management Report 2008
PPP and ethnic
products in
developed countries
Many people buy
products related to
their countries of
origin, for example
Maggi Arôme and
Bouillons in France,
imported from Africa,
and certifi ed halal
food, selected and
prepared according
to Islamic law.
Nescafé Clasico
for the Hispanic
population in the
USA is another very
successful example.
Tackling
malnutrition
In the developing
world, micronutrient
malnutrition is
a common risk
factor for disease.
Nestlé partners
health authorities,
enabling many PPPs
to be fortifi ed with
micronutrients to
address local needs.
Emerging markets and PPP
Our food and beverage sales in
emerging countries achieved
15.4% organic growth in 2008 and
accounted for over 30% of sales,
or about CHF 35 billion. We are
well placed to benefi t from the
projected population increase in the
developing world (estimated to grow
by 3.3 billion between 2000 and 2050)
as well as rising incomes. We are also
successfully targeting CHF 1.3 trillion
of sales made in the traditional grocery
trade in the ten largest emerging
countries. Indeed we expect at least
to double our sales in emerging
markets in the next ten years
(in constant currencies).
Our Popularly Positioned Products
(PPP) appeal to the lower income
segment (the world has 2.8 billion
consumers earning less than USD 10
a day) by offering relevant and
good quality nutritious products,
particularly beverages, dairy, culinary
and confectionery, at price points
that enable these consumers to buy
them on a daily basis. In so doing,
they help deliver a balanced nutritional
diet for consumers, profi table growth
for Nestlé, and contribute to the
economies of emerging countries
and their people. PPP accounted for
about 6% of our food and beverage
sales and achieved organic growth
of 27.4% in 2008.
Our PPP strategy is built on a low-
cost business model that relies on
local sourcing, local manufacture and
local distribution to take cost out of all
areas of the business. We train micro-
distributors, often fi nanced by our
micro-loans, and provide vending
carts that can reach market stalls
and small shops that account for
much of the retail space in emerging
countries. In this way, PPP are a
source of income for street traders
and individual distributors.
We sell many products at
signifi cantly less than a dollar – without
sacrifi cing taste or nutrition. For
example, Bear Brand fortifi ed milk sells
for Php 10 in the Philippines, equivalent
to about USD 0.20. A study found that
around a third of Philippines children
aged 1 to 5 were under weight and/or
under height, and identifi ed specifi c
micronutrient defi ciencies. These were
then addressed by adding iron, zinc
and vitamin C to Bear Brand. In 2008
we sold 56 000 tons via 237 micro-
distributors and over 400 000 “sari-
sari” stores.
Our multi-tier strategy targets all
income levels, but has specifi c
solutions for the two areas where
population growth is highest, with
PPP providing nutritional sustenance
for the Affordability segment and
Premiumisation providing indulgence
for the top end.
Our PPP business targets consumers
for whom the food spend is not
discretionary and who are reassured
by the quality and pleasure that they
associate with Nestlé brands. It also
offers a “safe haven” of recognised
quality and safety for consumers who
may fi nd themselves forced to trade
down in tough economic conditions.
Out-of-home leadership
Today, in North America, almost 50%
of the consumer food and beverages
spend is out-of-home. Brazil, Russia,
India and China show similar trends,
and many Western European countries
are not far behind. With sales of
CHF 6.2 billion and 10 000 employees
in 97 countries, Nestlé Professional is
the world’s leading manufacturer in this
highly fragmented out-of-home market.
In order to accelerate our
development and further capitalise on
the out-of-home growth opportunity,
we transitioned Nestlé Professional to
a globally managed business, effective
from 1 January 2009. The scale of
the opportunity is demonstrated
by our ambition to double Nestlé
Professional’s sales in the next
ten years (in constant currencies).
Nestlé Professional is advantaged
over its competitors by its ability to call
upon Nestlé’s R&D resources, brands
such as Nescafé and Maggi, and
our expertise in Nutrition, Health and
Wellness. It is well positioned
to become a solution-driven,
RA_report_24_41_GB.indd 38 3.3.2009 14:02:02

39Four growth drivers
One example
of a multi-tier strategyAvailable in more than 50 countries, Nestlé
Nido is one of our biggest brands. For over
60 years, Nido has been providing mothers with
a complete range of nutritious milk products to
help raise healthy, well nourished children.
1
Affordable
Nido Everyday
Added protein, calcium, vitamin D, iron and
other micronutrients help to make children
more resistant to sickness by addressing
major nutritional defi ciencies.
2
Mainstream
Nido Fortifi ed
A nutritionally complete solution for
healthy growth of children of all ages.
Fortifi ed with nutrients to support
the “10 Signs of Good Nutrition”. The
“10 Signs” include clear skin and shiny
hair, regular bowel movement, good
muscle development and correct weight
to height ratio.
3
Premium
Nido Nutrition System 1+ 3+ 5+
The Growing Up Milk solution that
provides protection and relevant nutritional
benefi ts by age range, such as gut
protection, brain development and bone
strength, specifi cally developed to adapt
to children’s growth needs with the right
nutrition at each stage of development.
Enhanced with our proprietary immune-
booster probiotic Lactobacillus Protectus.
4
Nido NutriLight
A non-fat, low calorie, fi bre enriched
milk designed for children’s weight
management.
5
Super Premium
Nido Excella Gold
The most scientifi cally advanced product
in the Nido range, Nido Excella Gold
supports children’s holistic development
with a brain development ingredient and an
exclusive immunity formula.
Making the most of every opportunity Across the world, population growth is greater at the top and base of the income pyramid. Those with annual per capita income above USD 22 000 are forecast to grow by 40% (from 2005–2015) and those with incomes between USD 3 000–13 000 by 31%, whereas the middle income group between USD 13 000–22 000 by only 11%.
Annual per capita income growth % 2005-2015
Above USD 22 000
Between USD 13 000–22 000
Between USD 3 000–13 000
+40%
+11%
+31%
1
2
3
4
5
RA_report_24_41_GB.indd 39 3.3.2009 14:02:02

40 Nestlé Management Report 2008
Benefi ting Nestlé, consumers and farmers
Highest quality coffee beans and
sustainable methods benefi t everybody
and are vital for Nespresso. By 2010, we
are committed to increasing the volume
of green coffee purchased through the
Nespresso AAA Sustainable Quality
programme to 50% of Nespresso’s total
requirements, up from the 2008 level
of 40%. This is despite the expected
signifi cant organic growth in the business
during that period, nearly 40% in 2008.
The Nespresso AAA programme is
independently verifi ed by Rainforest
Alliance, and contributes to economic
viability, sustainability and social equity
on coffee farms.
are the world’s largest dark chocolate
manufacturer and launched over
200 dark chocolate products in the
last two years, including a range for
Nespresso, created by the chocolatier
Pierre Marcolini. In coffee, Nescafé
Dolce Gusto, launched in 2006, was
rolled out to fi fteen European countries
by the end of 2008, and is also in USA
and Japan. In total, it has captured
33% market share, sold over a million
machines and notched up capsule
sales of about CHF 200 million in 2008.
In ice cream, Mövenpick of
Switzerland, Häagen-Dazs and Antica
Gelateria del Corso have all shown good
growth. In waters, in some countries,
Perrier is referred to as the champagne
of waters, and commands super-
premium prices, as does S.Pellegrino.
Acqua Panna bottled water has
the same pH-value as red wine,
which makes it the best complement
to a fi ne dinner.
Premiumisation is equally applicable
in our other categories. In PetCare,
Purina Beneful has further premiumised
the premium dog food segment,
and achieved organic growth of 38%
in 2008.
Our premium products offer a
moment of pleasure to mainstream
consumers who want to treat
themselves, or the assurance of the
highest quality raw materials and
sensory pleasure for the discerning
high end consumer. Even in tough
times, premium food remains an
affordable treat, a little taste of luxury.
customer-centric force in the
out-of-home industry.
Service is an integral part of
the Nestlé Professional customer
experience. In addition to supplying
customers with leading products
and brands, value-added services
help develop and ensure long-term
customer intimacy. Services include
sharing consumer trends and insights,
point-of-sale and systems support,
menu planning and nutrition, health
and wellness advice.
Customers seeking to provide
their consumers with healthier
options, appreciate the out-of-home
application of 60/40+ as well as the
Nestlé Professional Performance
Testing Programme. These initiatives
ensure our solutions deliver consumer
preference as well as competitive and
nutritional advantage to operators.
Premiumisation
Luxury and premium products are a
key opportunity for above-average
growth and returns. The premium
food and beverage sector is forecast
to grow by over 13% per annum
through to 2020.
Whereas “value” products are
priced 15% or more below average,
and “mainstream” products range
between –15% to +20% of average,
premium products can command more
than 20% above category norms – and
luxury products can soar by three to
ten times the average.
The higher income group, the core
premium market, is forecast to grow
faster than other income segments,
and comprise about 850 million people
by 2015. It’s estimated that there will
soon be more potential consumers of
luxury and premium products in China
than in the whole of Europe.
We are extremely well positioned
across our product portfolio, including
mainstream products. An example
is Nido Excella Gold, launched in
Mexico in late 2007 and rolling out
to Asia in 2009.
In confectionery, the growth of
dark, premium chocolate is the most
visible sign of “premiumisation”. We
RA_report_24_41_GB.indd 40 3.3.2009 14:02:03
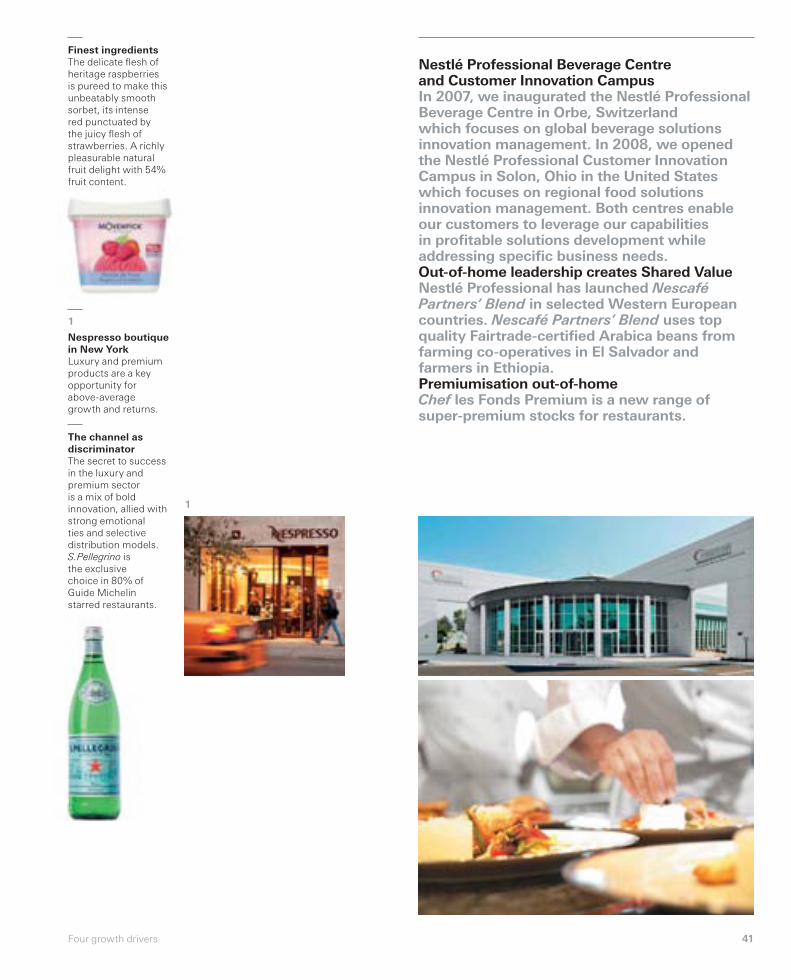
41Four growth drivers
Finest ingredients
The delicate fl esh of
heritage raspberries
is pureed to make this
unbeatably smooth
sorbet, its intense
red punctuated by
the juicy fl esh of
strawberries. A richly
pleasurable natural
fruit delight with 54%
fruit content.
1
Nespresso boutique
in New York
Luxury and premium
products are a key
opportunity for
above-average
growth and returns.
The channel as
discriminator
The secret to success
in the luxury and
premium sector
is a mix of bold
innovation, allied with
strong emotional
ties and selective
distribution models.
S.Pellegrino is
the exclusive
choice in 80% of
Guide Michelin
starred restaurants.
Nestlé Professional Beverage Centre and Customer Innovation CampusIn 2007, we inaugurated the Nestlé Professional Beverage Centre in Orbe, Switzerland which focuses on global beverage solutions innovation management. In 2008, we opened the Nestlé Professional Customer Innovation Campus in Solon, Ohio in the United States which focuses on regional food solutions innovation management. Both centres enable our customers to leverage our capabilities in profi table solutions development while addressing specifi c business needs.Out-of-home leadership creates Shared Value Nestlé Professional has launched Nescafé Partners’ Blend in selected Western European countries. Nescafé Partners’ Blend uses top quality Fairtrade-certifi ed Arabica beans from farming co-operatives in El Salvador and farmers in Ethiopia.Premiumisation out-of-homeChef les Fonds Premium is a new range of super-premium stocks for restaurants.
1
RA_report_24_41_GB.indd 41 3.3.2009 14:02:03
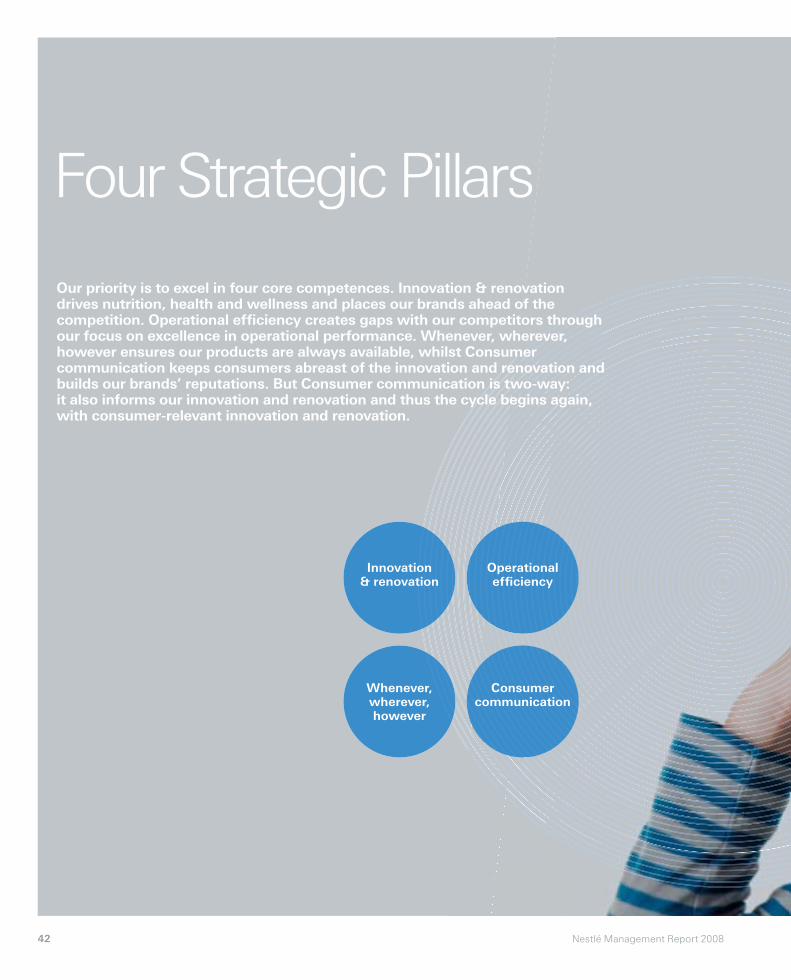
42 Nestlé Management Report 2008
Our priority is to excel in four core competences. Innovation & renovation drives nutrition, health and wellness and places our brands ahead of the competition. Operational effi ciency creates gaps with our competitors through our focus on excellence in operational performance. Whenever, wherever, however ensures our products are always available, whilst Consumer communication keeps consumers abreast of the innovation and renovation and builds our brands’ reputations. But Consumer communication is two-way: it also informs our innovation and renovation and thus the cycle begins again, with consumer-relevant innovation and renovation.
Four Strategic Pillars
Innovation & renovation
Whenever, wherever,however
Operational effi ciency
Consumer communication
RA_report_42_57_GB.indd 42 3.3.2009 13:47:07

43Four strategic pillars
RA_report_42_57_GB.indd 43 3.3.2009 13:47:20

44 Nestlé Management Report 2008
and wellness benefi ts that lead to
signifi cant business success. Bigger,
better, bolder innovations at Nestlé
have to meet a confi rmed consumer
need, be technologically feasible and
have robust commercial potential.
The complexity of modern-day
innovation demands strict alignment
between all business functions to
maximise the potential in new products
and processes. Cross functional
innovation teams include R&D, the
Strategic Business Units and the
Markets. As our product launch dates
approach, our Innovation Acceleration
Teams ensure fast, fl awless roll-out to
priority countries.
Innovation & renovation
Just to stay where we are, we have to
change – at least as fast as consumer
expectations – and that means
constant renovation. To grow our
leadership positions means moving
quicker, leap-frogging and going
beyond what consumers tell us.
And that requires innovation, leading
the consumer forward, so that we
are not simply a consumer-driven
company, but a company that drives
the consumer.
Continual small improvements
keep our products fresh and up-to-
date. Major innovations create
fundamental changes. Both add value
for consumers, accelerate growth
and deliver sustainable shareholder
value. Increasingly, science-driven
research and development is creating
more added-value products and in turn
creating higher profi tability.
Innovation has created successful
brands and products that today
account for billions of additional sales
from products that did not exist only a
few years ago (eg – Beneful, Nescafé
Dolce Gusto, Nan H.A.). Our project-
rich innovation pipeline will generate
similar growth in future years.
Innovation goes beyond the product
itself. Innovation opens up new routes
to market – for example by designing
small ice cream vending machines.
Innovative packaging is saving energy
and resources – we have reduced
the weight of bottled water plastic
packaging by 19.6% per litre over
the last fi ve years. Indeed, Nestlé
has introduced the lightest-weight
bottle in the industry and will go
lighter still in 2009. Innovative
engineering technology improves
production line effi ciency and cuts
manufacturing costs.
Bigger, better, bolder innovation
depends on having open-minded
and passionate inventors in R&D who
bridge science, technology, business
and consumer needs. Major pioneering
innovations hit the “innovation sweet-
spot” where best-in-class science
and technology combine to deliver
precisely targeted nutrition, health
Innovations in bottled water packaging:
examples from the USA
Nestlé Waters North America (NWNA)
continues to invest in improving its
environmental performance, with the
objective of having the industry’s lightest
environmental footprint per unit of
product. One priority is the bottle itself,
and the company has made progress
in reducing the bottle’s environmental
footprint by introducing innovative, lighter-
weight packaging. The carbon embedded
in the purchased PET resin for the bottle
accounted for 55% of NWNA’s greenhouse
gas emissions, so in the fi fteen years to
2007, NWNA reduced the amount of PET
plastic in its bottles by 40%. The EcoShape
bottle, launched in 2007, achieved a further
14% reduction in plastic used, and weighs
only 12.5 grams on average. It remains the
lightest branded half-litre bottle on the
US market. We estimate that it will save
more than 88 million kilograms of resin
and help avoid more than 356 000 tonnes
of CO2 equivalent emissions from its
launch to the end of 2009. The company
plans to reduce plastic in its half-litre
bottles by an additional 15% by 2010.
In addition, since 1994, NWNA has
manufactured 98% of its PET packaging
in its plants, saving the energy required to
ship 160 000 truckloads of empty bottles
to its sites. This investment in packaging
technology is backed up by a commitment
to recycling. The returnable bottles for its
US Direct-to-Home & Offi ce business get
used thirty-fi ve times. When their useful
life is up, the majority are recycled into
products such as lawn furniture, synthetic
lumber and outdoor sheds. In terms of
public recycling, the USA only have about
a 25% plastic recycle rate and about half
of Americans have access to kerbside
recycling. A lot is about education and
changing habits. NWNA is advancing the
goal of a minimum 60% recycling rate for
PET beverage bottles by 2018 through
partnerships, coalition-building, consumer
education, improved kerbside recycling
programmes and policy initiatives.
RA_report_42_57_GB.indd 44 3.3.2009 13:47:44

45Four strategic pillars
1, 2
State-of-the-art
knowledge
in food science
and nutrition
Nutritional profi les
are continuously
assessed, and recipes
and formulations
updated. State-of-the-
art knowledge in food
science and nutrition
leads to on-going
improvements and
the best products
in the market.
Safety, meanwhile,
is non-negotiable.
Proprietary technology for improved nutrition and energy saving Science-driven proprietary technology is driving our nutrition, health and wellness strategy. As a result of proprietary process technology, Nescafé Protect is rich in antioxidants – helping to defuse free radicals that are a main cause of ageing. Our proprietary and revolutionary aseptic process means that NaturNes baby foods retain nutrients more effectively and capture more of the taste of natural ingredients than competitor products. NaturNes also benefi ts the environment by using plastic rather than glass jars, thereby reducing primary energy consumption by up to 27% and greenhouse gas emissions by up to 31%.
1, 2
RA_report_42_57_GB.indd 45 3.3.2009 13:47:44

46 Nestlé Management Report 2008
Improving transportation effi ciency
and reducing accidents
Dairy Partners America (DPA) is cutting
costs and improving reliability of
supplies by providing its milk collection
contractors’ truck drivers in Brazil with
accident prevention training. Coupled
with an incentive scheme and modern
data logging, this resulted in 58% fewer
accidents in the fi rst half of 2008,
compared with the entire previous year,
and a rate at least ten times lower than
national average. DPA has been sharing its
approach with other companies in Brazil
in the interests of safer driving for all,
whilst we are starting similar programmes
in other Latin American countries as well
as Pakistan and Central Europe.
Capturing energy
and avoiding waste: “Java Log®”
Nestlé USA is helping to safeguard the
environment through pollution prevention
and control, energy conservation and
recycling/solid waste management
practices. For example, our Freehold,
New Jersey beverage factory has found
a unique way to capture available energy
and avoid waste, capitalising on the fact
that coffee grounds can have as much
as 25% more energy capacity than wood
when combusted. The factory works
with a producer of fi replace logs, “Java
Log®”, who use Nestlé’s spent coffee
grounds to produce and market “coffee
fi relogs” for use in domestic fi replaces.
This is an effi cient, cost-effective and
environmentally sound waste management
solution for Nestlé, a source of raw
materials for the “Java Log®” manufacturer,
and an alternative energy choice for
“Java Log®” consumers.
More information on this product can
be found at http://www.java-log.com
More effi cient water accountability
and use
Together with leading companies,
universities and experts (including WWF,
UNESCO and The Nature Conservancy) we
are sharing knowledge and participating
in the Water Footprint Working Group
to establish a scientifi c basis for water
footprint accounting, eventually via ISO,
and to agree common metrics. We will test
methodology, covering the entire life cycle
of one of our products.
Water foot-printing is vital for long-term
conservation efforts. Accurate accounting
of the volume of fresh water used by
companies and embedded in products will
provide a more holistic view of impacts,
alongside energy use and greenhouse gas
emissions, and improve our capacity to
conserve natural resources.
NCE pilot results have shown its
potency as well as the scale of
opportunity: Waste reduced by
50%; Consumer complaints down
33%; Unplanned stoppages down
70%; Quality defects down 70%;
Inventory down 50%; Production line
changeovers down from three hours to
less than ten minutes; Line effi ciency
up 15%; Productivity up 27%.
GLOBE (Global Business Excellence)
is enabling savings and economies
of scale on a regular, on-going basis
throughout the company. It was
designed to harmonise our systems,
analyse our business more effectively,
optimise economies of scale and
share best practices. It has proven to
be an enabler of extraordinary power,
leveraging effi ciency, skills and know-
how, and has now been effectively
integrated in our most recent
acquisitions, Novartis Medical Nutrition
and Gerber. GLOBE itself will benefi t
from NCE. GLOBE is also proving to
be an enabler of growth by freeing
up our people to spend more time
on customer-focused and consumer-
targeted projects.
Operational effi ciency
Operational effi ciency is essential to
remaining competitive. It also offers
the potential for competitive advantage
if we are able to achieve break-through
improvements in effi ciency. Over the
past ten years we have made average
annual savings of over CHF 1 billion.
Our approach has tended to be
project-driven and to target specifi c
areas, for example manufacturing
or supply chain, with time-based
goals. The new centre-piece of our
cost-cutting strategy is NCE (Nestlé
Continuous Excellence). Unlike
previous programmes, this is an
on-going initiative that covers the
entire value chain from raw materials,
manufacturing, packaging, distribution
and the customer to the consumer. It
takes us from our effi ciency project
approach to a new lean thinking mind-
set approach.
The overriding goal of NCE is to
accelerate operational performance
and create gaps with the competition
and thus to support delivery of the
Nestle Model year after year. It
will maximise value and minimise
waste by engaging the hearts and
minds of all employees, aiming
for 100% engagement and “Zero
Defect and Zero Waste”. It is
centred on our Nestlé Integrated
Management System (NIMS), our
leadership development process
and goal alignment. It introduces
Total Performance Management and
“lean thinking” into all manufacturing
and supply chain operations. It
nurtures a sustainable improvement
culture for fast, disciplined, fl awless
execution. It empowers our people at
all levels to make them responsible
and autonomous in their daily work.
For example, a shop fl oor machine
operator will manage important
productivity enhancing decisions.
The programme includes new
best practices for manufacturing,
people development and performance
management. Some 700 standards
are applied in our factories covering
aspects including product quality,
health and safety and the environment.
RA_report_42_57_GB.indd 46 3.3.2009 13:47:45
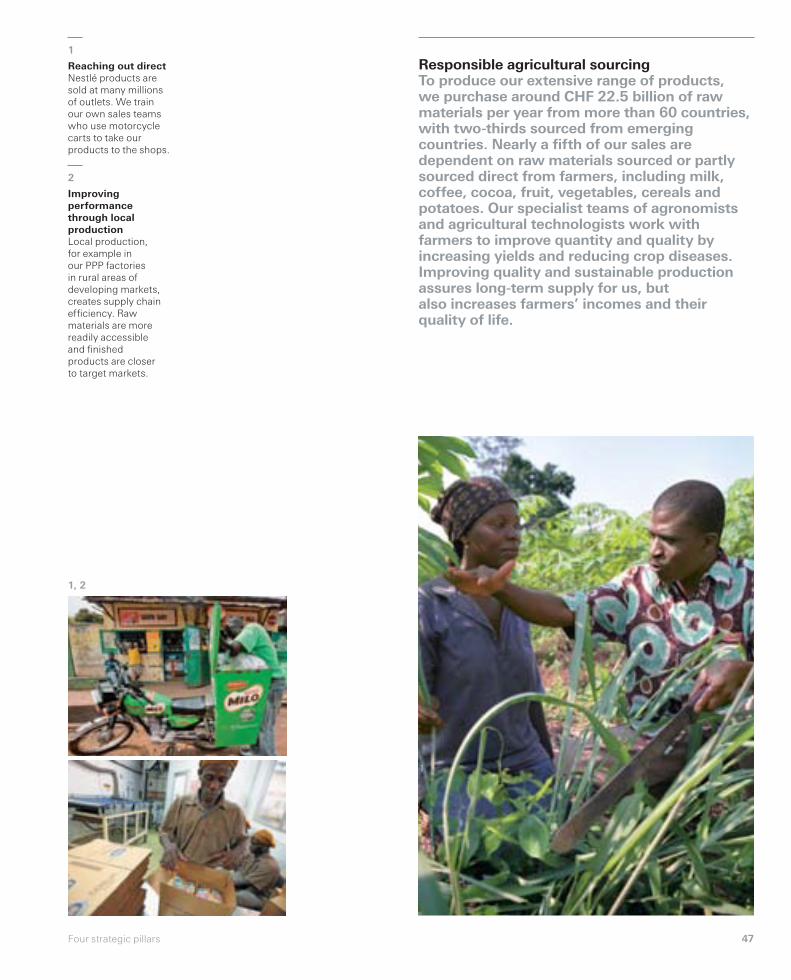
47Four strategic pillars
1
Reaching out direct
Nestlé products are
sold at many millions
of outlets. We train
our own sales teams
who use motorcycle
carts to take our
products to the shops.
2
Improving
performance
through local
production
Local production,
for example in
our PPP factories
in rural areas of
developing markets,
creates supply chain
effi ciency. Raw
materials are more
readily accessible
and fi nished
products are closer
to target markets.
Responsible agricultural sourcingTo produce our extensive range of products, we purchase around CHF 22.5 billion of raw materials per year from more than 60 countries, with two-thirds sourced from emerging countries. Nearly a fi fth of our sales are dependent on raw materials sourced or partly sourced direct from farmers, including milk, coffee, cocoa, fruit, vegetables, cereals and potatoes. Our specialist teams of agronomists and agricultural technologists work with farmers to improve quantity and quality by increasing yields and reducing crop diseases. Improving quality and sustainable production assures long-term supply for us, but also increases farmers’ incomes and their quality of life.
1
1, 2
RA_report_42_57_GB.indd 47 3.3.2009 13:47:45

48 Nestlé Management Report 2008
It is this second aspect of
communication, listening to our
consumers, that enables us to start
the cycle again, returning to innovation
and renovation with feedback from
consumers about what they want
from us. This feedback ensures that
our innovation and renovation remains
consumer-relevant and enhances the
likelihood of success of our product
launches and renovations.
Whenever, wherever, however
We want our products and brands
to be available wherever consumers
want them. Broadening availability
attracts more consumers, increases
consumption moments, and
contributes to profi table growth.
For our consumer business, this
means a multiple channel strategy,
ranging from traditional retailers
– hyper- and supermarkets, hard
discounters, “mom and pop” stores
and street markets – to all the impulse
opportunities, especially street
vendors, kiosks and vending machines
that are so vital to ice cream and
confectionary sales. Then there’s the
growing in-home channel where, via
the internet, Nespresso and Jenny
Direct have built fl ourishing home-
delivery businesses, and in some
countries we sell PPP door-to-door.
Out-of-home provides Nestlé
Professional, our specialist
FoodServices business, with
endless opportunities from cruise
ships, airlines, and long-haul trains
to schools, universities, hospitals,
hotels and restaurants. The objective
is to have our products available for
any occasion, any place – railway
and service stations, offi ces, sports
centres, ski slopes, at fairs, exhibitions
and cinemas, in fact wherever people
go for work, leisure and pleasure.
Given our extensive product
portfolio, distribution is complex. Many
channels, many products, different
recipes and formulations, different
pack sizes, all exacerbate what is
inherently a logistical challenge.
Transporting ice-cream in hot
climates, or ambient foods in sub-zero
temperatures, adds to the complexity
and requires technologies that ensure
that the product – either in transit, on
shelf or in-home – retains the same
freshness and quality as when it came
off the production line.
Making what is complex, simple is
a Nestlé skill. Enabled by GLOBE, and
built on specifi c business models, we
have been able to reduce costs and
deepen distribution in all channels.
Consumer communication
Consumer communication is about
forging relationships between
consumers and our brands to create
strong “loyalty fortresses”. Above
all, it’s about generating demand and
building market share to accelerate
growth and profi t. An example is
Nespresso, which in 2008 – supported
by highly effective communication –
out-grew the world coffee market
twenty fold. For instance, in France and
Switzerland, its volume share of the
market was 3%, its value share 20%
and its profi t share 35%.
Our fl agship brands with strong
nutritional credentials are the carriers
and communicators of our vision and
strategy. Through them, consumers
experience for themselves the benefi ts
of nutrition, health and wellness. The
brands also provide demonstrable
evidence of quality and safety.
The way we communicate through
our brands infl uences our corporate
reputation and brand image. In effect,
consumer communication is the
way our brands behave in public,
whether in mass media or increasingly
in one-to-one digital and telephone
communication – for example,
our 1000 advisors in 80 Consumer
Service Centres in 70 countries
have over 10 million consumer
contacts each year.
For effective communication we
need to know our audience. It’s not
enough simply to listen to them. Our
job is to achieve deeper levels of
consumer understanding than our
competitors. One way is to spend
time living and shopping with them,
and getting fi rst-hand understanding
of their needs, motivations, routines,
purchasing habits, decision-making
and the everyday aspects of their lives.
RA_report_42_57_GB.indd 48 3.3.2009 13:47:45

49Four strategic pillars
Nesfrappé Nesfrappé is a brand new concept targeted at young adults, the “on the go” generation, drinking and snacking any time anywhere. Launched in Mexico, South Korea, Singapore and the UK, it aims to disrupt their current beverage drinking habits and establish ready-to-drink coffee as a new category. Nesfrappé is convenient, refreshingly ice cold and made with the goodness of milk and best quality coffee from Nescafé. In Mexico, its biggest market, Nesfrappé achieved leadership within three months, driving category growth by 81%.
Communicating nutritional advantages
Factual information, such as GDA
(Guideline Daily Amount) is complemented
with the Nestlé Nutritional Compass.
This innovative nutrition labeling system
took three months from idea to concept,
four months from concept to shelf, and
eighteen months to be on 80% of packs
worldwide. It is now on 98% of packs.
Funding research into the decline
of honey bees
Häagen-Dazs is funding research by
Pennsylvania State University and the
University of California into causes and
prevention of the sharp decline in honey
bee populations.
Website “Croquons la Vie”
In France, over one million consumers
have joined the “Croquons la Vie” Club.
It includes 3 500 recipes aimed at helping
people to eat better and live healthier.
RA_report_42_57_GB.indd 49 3.3.2009 13:47:45

50 Nestlé Management Report 2008
Driving profi table growth
Delivering nutrition, health and wellness
In this section we demonstrate how our Competitive advantages, Growth drivers and Strategic pillars are driving growth in one of our traditional product categories. Our chocolate business is a clear example of delivering the Nestlé Model and contributing to leadership in nutrition, health and wellness in the important sweet foods category.
We are driving overall chocolate growth of 7.6% per annum in a business with sales of CHF 9.8 billion, with our unique mix of strong global brands and well-loved local brands. We are No 1 in dark chocolate, the fastest growth sector worldwide. We are the most globally far-reaching of all the chocolate manufacturers. We are able to leverage centralised research and strategies, and apply them to all our brands in terms of chocolate excellence and innovation and renovation, while respecting local tastes, habits and cultures.
The 4 x 4 x 4 Nestlé roadmap in action – Chocolate
RA_report_42_57_GB.indd 50 3.3.2009 13:47:46

51The 4 x 4 x 4 Nestlé roadmap in action
RA_report_42_57_GB.indd 51 3.3.2009 13:47:58
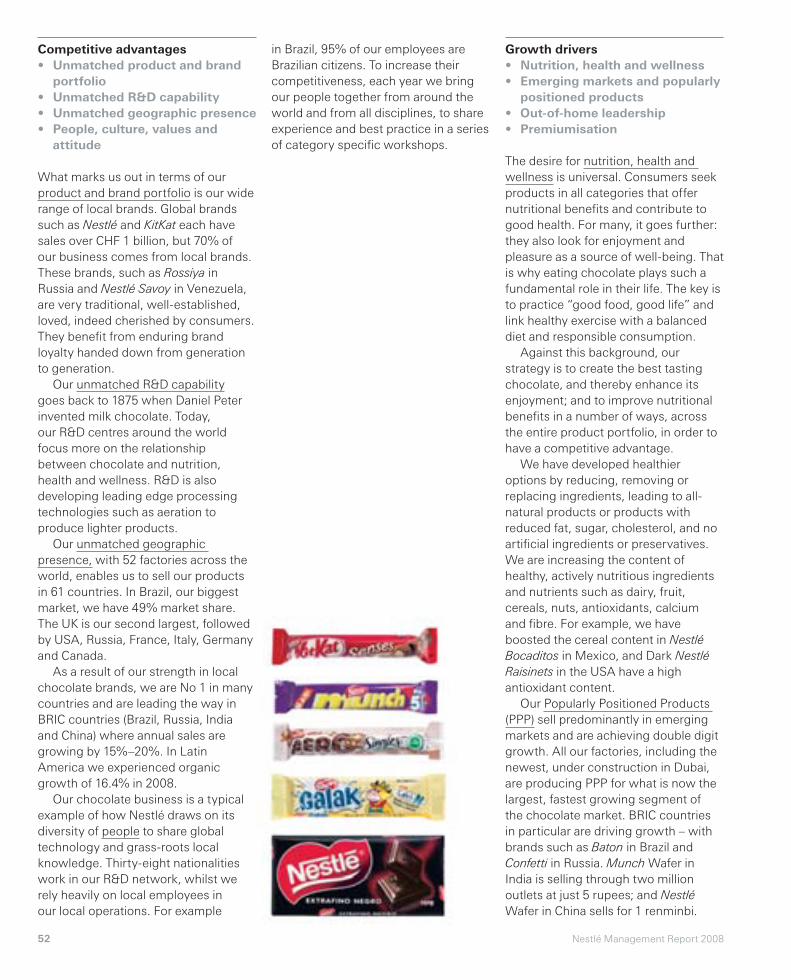
52 Nestlé Management Report 2008
Growth drivers
• Nutrition, health and wellness
• Emerging markets and popularly
positioned products
• Out-of-home leadership
• Premiumisation
The desire for nutrition, health and
wellness is universal. Consumers seek
products in all categories that offer
nutritional benefi ts and contribute to
good health. For many, it goes further:
they also look for enjoyment and
pleasure as a source of well-being. That
is why eating chocolate plays such a
fundamental role in their life. The key is
to practice “good food, good life” and
link healthy exercise with a balanced
diet and responsible consumption.
Against this background, our
strategy is to create the best tasting
chocolate, and thereby enhance its
enjoyment; and to improve nutritional
benefi ts in a number of ways, across
the entire product portfolio, in order to
have a competitive advantage.
We have developed healthier
options by reducing, removing or
replacing ingredients, leading to all-
natural products or products with
reduced fat, sugar, cholesterol, and no
artifi cial ingredients or preservatives.
We are increasing the content of
healthy, actively nutritious ingredients
and nutrients such as dairy, fruit,
cereals, nuts, antioxidants, calcium
and fi bre. For example, we have
boosted the cereal content in Nestlé
Bocaditos in Mexico, and Dark Nestlé
Raisinets in the USA have a high
antioxidant content.
Our Popularly Positioned Products
(PPP) sell predominantly in emerging
markets and are achieving double digit
growth. All our factories, including the
newest, under construction in Dubai,
are producing PPP for what is now the
largest, fastest growing segment of
the chocolate market. BRIC countries
in particular are driving growth – with
brands such as Baton in Brazil and
Confetti in Russia. Munch Wafer in
India is selling through two million
outlets at just 5 rupees; and Nestlé
Wafer in China sells for 1 renminbi.
in Brazil, 95% of our employees are
Brazilian citizens. To increase their
competitiveness, each year we bring
our people together from around the
world and from all disciplines, to share
experience and best practice in a series
of category specifi c workshops.
Competitive advantages
• Unmatched product and brand
portfolio
• Unmatched R&D capability
• Unmatched geographic presence
• People, culture, values and
attitude
What marks us out in terms of our
product and brand portfolio is our wide
range of local brands. Global brands
such as Nestlé and KitKat each have
sales over CHF 1 billion, but 70% of
our business comes from local brands.
These brands, such as Rossiya in
Russia and Nestlé Savoy in Venezuela,
are very traditional, well-established,
loved, indeed cherished by consumers.
They benefi t from enduring brand
loyalty handed down from generation
to generation.
Our unmatched R&D capability
goes back to 1875 when Daniel Peter
invented milk chocolate. Today,
our R&D centres around the world
focus more on the relationship
between chocolate and nutrition,
health and wellness. R&D is also
developing leading edge processing
technologies such as aeration to
produce lighter products.
Our unmatched geographic
presence, with 52 factories across the
world, enables us to sell our products
in 61 countries. In Brazil, our biggest
market, we have 49% market share.
The UK is our second largest, followed
by USA, Russia, France, Italy, Germany
and Canada.
As a result of our strength in local
chocolate brands, we are No 1 in many
countries and are leading the way in
BRIC countries (Brazil, Russia, India
and China) where annual sales are
growing by 15%–20%. In Latin
America we experienced organic
growth of 16.4% in 2008.
Our chocolate business is a typical
example of how Nestlé draws on its
diversity of people to share global
technology and grass-roots local
knowledge. Thirty-eight nationalities
work in our R&D network, whilst we
rely heavily on local employees in
our local operations. For example
RA_report_42_57_GB.indd 52 3.3.2009 13:48:10
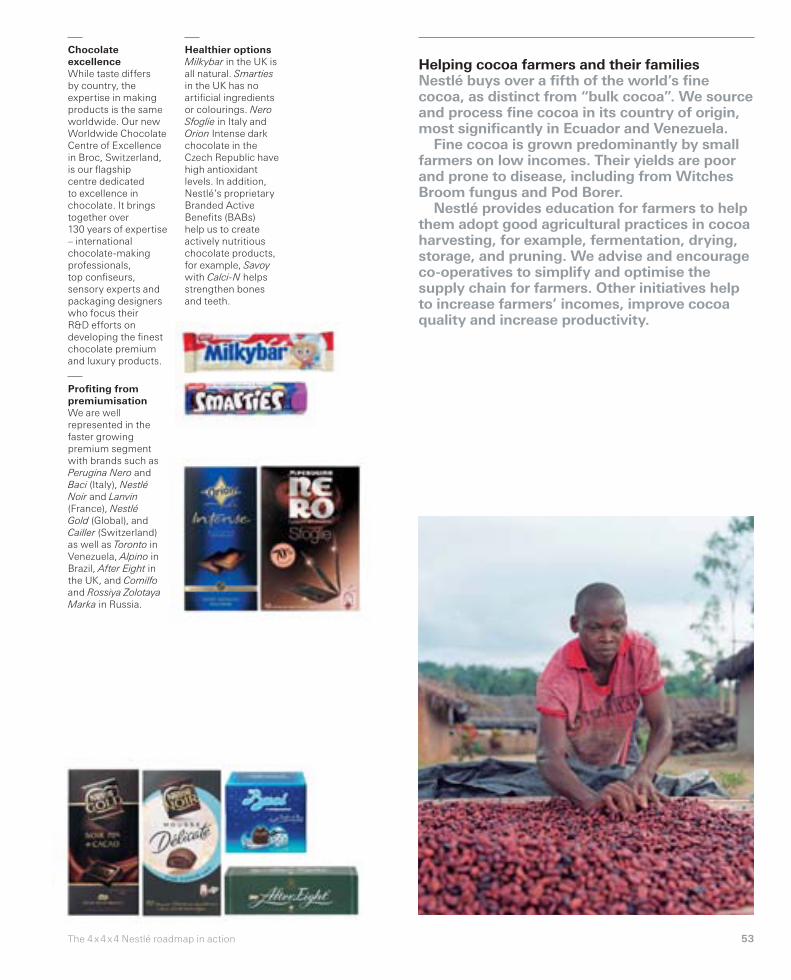
53The 4 x 4 x 4 Nestlé roadmap in action
Helping cocoa farmers and their familiesNestlé buys over a fi fth of the world’s fi ne cocoa, as distinct from “bulk cocoa”. We source and process fi ne cocoa in its country of origin, most signifi cantly in Ecuador and Venezuela.
Fine cocoa is grown predominantly by small farmers on low incomes. Their yields are poor and prone to disease, including from Witches Broom fungus and Pod Borer.
Nestlé provides education for farmers to help them adopt good agricultural practices in cocoa harvesting, for example, fermentation, drying, storage, and pruning. We advise and encourage co-operatives to simplify and optimise the supply chain for farmers. Other initiatives help to increase farmers’ incomes, improve cocoa quality and increase productivity.
Chocolate
excellence
While taste differs
by country, the
expertise in making
products is the same
worldwide. Our new
Worldwide Chocolate
Centre of Excellence
in Broc, Switzerland,
is our fl agship
centre dedicated
to excellence in
chocolate. It brings
together over
130 years of expertise
– international
chocolate-making
professionals,
top confi seurs,
sensory experts and
packaging designers
who focus their
R&D efforts on
developing the fi nest
chocolate premium
and luxury products.
Profi ting from
premiumisation
We are well
represented in the
faster growing
premium segment
with brands such as
Perugina Nero and
Baci (Italy), Nestlé
Noir and Lanvin
(France), Nestlé
Gold (Global), and
Cailler (Switzerland)
as well as Toronto in
Venezuela, Alpino in
Brazil, After Eight in
the UK, and Comilfo
and Rossiya Zolotaya
Marka in Russia.
Healthier options
Milkybar in the UK is
all natural. Smarties
in the UK has no
artifi cial ingredients
or colourings. Nero
Sfoglie in Italy and
Orion Intense dark
chocolate in the
Czech Republic have
high antioxidant
levels. In addition,
Nestlé’s proprietary
Branded Active
Benefi ts (BABs)
help us to create
actively nutritious
chocolate products,
for example, Savoy
with Calci-N helps
strengthen bones
and teeth.
RA_report_42_57_GB.indd 53 3.3.2009 13:48:10

54 Nestlé Management Report 2008
Consumer communication in the
chocolate category requires special
skills. Point of sale is particularly
important, as such a high proportion of
sales are made on impulse. A different
communication style and packaging
is required for chocolate as a gift.
Packaging itself can be a valuable
communication medium, especially
to impart nutritional information
and healthy eating tips. We use
the Nestlé Nutritional Compass to
communicate nutritional and health
benefi ts. However, we go further,
and take particular care to indicate
how chocolate fi ts into a balanced diet,
and to recommend portion size as
part of the recognised GDA (Guideline
Daily Amounts).
Strategic pillars
• Innovation & renovation
• Operational effi ciency
• Whenever, wherever, however
• Consumer communication
Our focus on innovation and renovation
is driving superior quality, taste and
texture and our quest for healthier,
lighter eating. One example is KitKat
where we have optimised every aspect
of the product including formulation
and packaging, leading to 10% growth
across Europe. Another example of our
speed in innovation is the Nespresso
chocolate launch that went “from bean
to box” in under a year.
The La Penilla chocolate factory in
Spain was chosen to run the pilot for
NCE (Nestlé Continuous Excellence)
and test “lean thinking” in order to
achieve even greater operational
effi ciency. The overall aim was to
harness a force of “lean thinkers”
to create a “lean journey” – from
cocoa bean to chocolate bite in only
30 days, rather than the previous
60 days. Reducing lead times demands
interrogation of every step in the supply
chain, from simplifying or unifying
recipes to reducing stock cover, from
the number of inks used in packaging
to cutting production line downtime
and improving truck loading logistics.
The pilot showed how reduction of
stocks and working capital worked
hand in hand to give better service
to customers as well as maximising
product freshness on-shelf.
In chocolate, widespread
distribution and excellent in-store
visibility are key to sales growth.
70% of purchases are on impulse, so
we strive to ensure our products are
available whenever, wherever, however
in outlets such as convenience stores,
petrol stations, independent “Mom
and Pop” stores and street kiosks.
Our focus is on strategies that range
from Direct Store Delivery in Latin
America, to traditional main-shelf
category management in supermarkets
in Europe.
At the other end of the market,
premium chocolate grew by 7.5% and
luxury chocolate by 8.0% last year,
both well above category average.
Our strategic partnership with one of
the world’s leading luxury chocolate
makers, Pierre Marcolini, enables us
to harness his skills, inspiration and
artistic talent for premiumisation of
brands and development of new
luxury chocolate products. Nespresso
chocolate is a range of luxury
chocolates, launched in 2008 in
Switzerland and France, and sold
exclusively in its boutiques. Ten
fl avours were specially developed
to harmonise with the different
Nespresso coffees.
RA_report_42_57_GB.indd 54 3.3.2009 13:48:11

55The 4 x 4 x 4 Nestlé roadmap in action
Nestlé nutritional brands extended to chocolateChocolate has intrinsic nutritional values. Dark chocolate, in particular, is a rich source of polyphenols with benefi cial antioxidising effects. We also develop new chocolate products for other Nestlé brands that are good carriers of nutritional benefi ts. For example, our Milo beverage brand is available in a chocolate ball format in Peru and Nesquik as a chocolate bar in Ukraine, Russia and many other countries. In the Philippines, our Milkybar is made with Nido milk.
Tackling cocoa crop
disease
Our research centre
in Tours, France, is
developing disease
resistant high yielding
plants to help cocoa
farmers enhance
their crops.
Lighter eating
Harnessing innovative
technologies such
as wafer, sintering,
extrusion and aeration
leads to lighter,
healthier products.
75 years ago KitKat
was one of the fi rst
chocolate products
made with a light
wafer. Its fi nger
format makes it easily
portionable. The
KitKat ritual to “Have
a break, Have a
KitKat” is itself an
invitation to a moment
of well-being.
Eating responsibly
More and more of our
chocolate products
are made to break
easily into portions or
packed in resealable
packs. It enables
easier sharing and
makes it simpler
for consumers
to ration their
consumption as part
of a balanced diet.
The fi nest Swiss
chocolate
Switzerland is
world famous for
its chocolate. The
original Nestlé factory
in Broc, Switzerland
sources fresh milk
from Gruyère. Our
best-known Swiss
brand, Cailler, grew
sales by 22% in 2008
as a result of new
product launches,
distribution gains,
new packaging and
effective consumer
communication.
Superior taste
and nutrition
60/40+ ensures
superior taste as
well as nutritional
advantage. For
example, Trencito
Milki has 44% milk
content. It achieved
high 60/40+ scores
as a result of its
Nutritional Foundation
and Nutritional
Competitive
Advantage. The
product is now being
successfully rolled
out from Chile
and Mexico to
other countries.
RA_report_42_57_GB.indd 55 3.3.2009 13:48:11

56 Nestlé Management Report 2008
the year and approved in the United-
States at the end of the year. Differin
0.1% gel was launched in Japan, the
2nd biggest dermatology market in
the world – where it is the fi rst topical
retinoid approved for acne.
For further information, see
www.galderma.com
Laboratoires innéov
innéov benefi ts from a unique synergy
between Nestlé’s Advanced Research
in Nutrition and L’Oréal’s Skin & Hair
Biology Research.
The products are based on an
innovative and patented association
of nutrients to protect, correct
and stimulate skin and hair cellular
processes from within, for daily
beautifi ed benefi ts.
With eight products, innéov is
present in seventeen countries and
is a leading brand of oral cosmetics,
distributed in Europe through
pharmacies and parapharmacies.
For further information, see
www.inneov.com
the new markets of Eastern Europe
and Asia.
2008 has been a year of major
technological innovations, such as
Excell 10’ from L’Oréal Paris which is
revolutionising hair colouration, and
Oscillation from Lancôme, the fi rst
powermascara by micro-oscillation.
Vichy has introduced the fi rst
“biological lifting”, Liftactiv CxP. In
luxury products, the end of the year
has been marked by the launch of
several fragrances: Notorious by Ralph
Lauren, the men’s fragrance Emporio
Armani Diamonds for Men, and fi nally
Magnifi que, the women’s fragrance
by Lancôme.
Consolidated since June 30th 2008,
the acquisition of Yves Saint Laurent
Beauté complements the group’s
portfolio of luxury brands, and is
strengthening L’Oréal’s ambition
to become the world’s leader in
luxury cosmetics.
For further information,
see L’Oréal annual report
or www.loreal-fi nance.com
Galderma
Galderma pursued its ascent with an
increase of 12.1% in net sales in 2008
to CHF 1.4 billion.
Several global strategic brands
Differin (acne), Rozex/Metro (rosacea),
Clobex (psoriasis), Oracea (rosacea), a
key product from the 2008 acquisition
of CollaGenex, Tri-Luma (pigmentary
disorders), Cetaphil (therapeutic skin
care) and Dysport (hyperfunctional
facial lines) – contributed to the double-
digit growth rate and resulted in
substantial market-share gains.
In addition, Epiduo, the new
combination treatment for acne, was
introduced in several countries during
Alcon
Alcon, the world’s leading eye
care company, experienced sales
growth of 2.1% to CHF 6.8 billion and
EBIT grew 4.7% to CHF 2.4 billion.
Unprecedented growth in international
markets, especially those in emerging
countries, was a large contributor to
Alcon’s performance in 2008. The
strength of the surgical category was
enhanced with the launch of AcrySof
ReSTOR +3.0 Add and AcrySof Phakic
intraocular lenses outside of the
USA, as well as the AcrySof ReSTOR
Aspheric and AcrySof Toric lenses in
Japan. The company also introduced
the Constellation vitrectomy system,
the next generation platform for
vitreoretinal surgery. Growth in the
pharmaceutical segment was driven by
global share gains in glaucoma by the
Travatan family and Azopt ophthalmic
solutions. Consumer category growth
was attributed to sustained global
market share for OPTI-FREE RepleniSH
and Express multipurpose disinfecting
solutions and the global growth of
Systane lubricant eye drops, supported
by the launch of Systane ULTRA
in the USA.
For further information, see Alcon’s
annual report or www.alcon.com
L’Oréal
Sales reached EUR 17.5 billion, with
like-for-like growth of 3.1% and 6.6% at
constant exchange rates. Net earnings
per share amounted to EUR 3.49, an
increase of 3.8% and 6.8% at constant
exchange rates.
World leader in cosmetics, L’Oréal
once again grew faster than the
cosmetics market in 2008. As a result,
the group continues to strengthen
its worldwide position, particularly in
Pharmaceutical and cosmetics activities
RA_report_42_57_GB.indd 56 3.3.2009 13:48:11

57Pharmaceutical and cosmetics activities
1
Launched in 2008,
Alcon’s Systane
ULTRA lubricant eye
drops is a high-
performance dry
eye therapy that sets
a new standard for
over-the-counter dry
eye relief.
2
Differin 0.1% gel,
the fi rst retinoid
for acne approved
in Japan.
3
Launch of innéov
homme anti-chute:
a new product
designed to fi ght the
four causes of male
hairloss. Launch
of the innéov
brand in Brazil.
4
In 2008,
Lancôme launched
Oscillation, the fi rst
powermascara by
micro-oscillation,
for which four patents
have been fi led.
Further to an agreement early 2008 between Nestlé S.A. and Novartis AG, Novartis AG owns now a minority stake in Alcon of approximately 25% of Alcon’s outstanding shares, while Nestlé remains Alcon’s majority shareholder with approximately 52% of Alcon’s outstanding shares.
Nestlé owns about 30% of L’Oréal with whom it has two joint ventures: Galderma and Laboratoires innéov.
1
3
2
4
RA_report_42_57_GB.indd 57 3.3.2009 13:48:11

58 Nestlé Management Report 2008
Financial review
Sales
Organic growth
Real internal growth
EBIT margin constant currencies
EBIT margin
EBIT margin Food and Beveragesconstant currencies
EBIT margin Food and Beverages
Net profi t
Underlying earnings per shareconstant currencies
Operating cash fl ow
Free cash fl ow
Proposed Dividend
+ 2.2% CHF 109.9 bio
+ 8.3%
+ 2.8%
+ 50 bps
+ 30 bps 14.3%
+ 40 bps
+ 20 bps 12.8%
CHF 18.0 bio
+10.9%
CHF 10.8 bio
CHF 5.0 bio
+14.8% CHF 1.40 per share
RA_report_58_80_GB.indd 58 3.3.2009 13:59:11
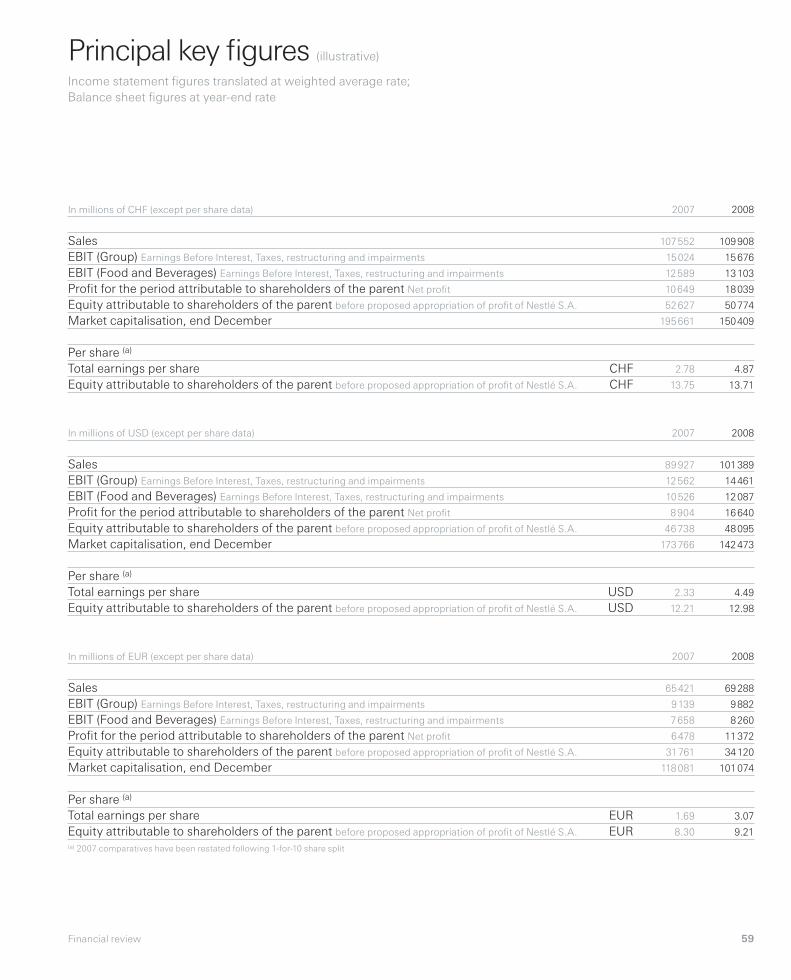
59Financial review
Principal key fi gures (illustrative)
Income statement fi gures translated at weighted average rate;
Balance sheet fi gures at year-end rate
In millions of CHF (except per share data)
Sales
EBIT (Group) Earnings Before Interest, Taxes, restructuring and impairments
EBIT (Food and Beverages) Earnings Before Interest, Taxes, restructuring and impairments
Profi t for the period attributable to shareholders of the parent Net profi t
Equity attributable to shareholders of the parent before proposed appropriation of profi t of Nestlé S.A.
Market capitalisation, end December
Per share (a)
Total earnings per share CHF
Equity attributable to shareholders of the parent before proposed appropriation of profi t of Nestlé S.A. CHF
In millions of USD (except per share data)
Sales
EBIT (Group) Earnings Before Interest, Taxes, restructuring and impairments
EBIT (Food and Beverages) Earnings Before Interest, Taxes, restructuring and impairments
Profi t for the period attributable to shareholders of the parent Net profi t
Equity attributable to shareholders of the parent before proposed appropriation of profi t of Nestlé S.A.
Market capitalisation, end December
Per share (a)
Total earnings per share USD
Equity attributable to shareholders of the parent before proposed appropriation of profi t of Nestlé S.A. USD
In millions of EUR (except per share data)
Sales
EBIT (Group) Earnings Before Interest, Taxes, restructuring and impairments
EBIT (Food and Beverages) Earnings Before Interest, Taxes, restructuring and impairments
Profi t for the period attributable to shareholders of the parent Net profi t
Equity attributable to shareholders of the parent before proposed appropriation of profi t of Nestlé S.A.
Market capitalisation, end December
Per share (a)
Total earnings per share EUR
Equity attributable to shareholders of the parent before proposed appropriation of profi t of Nestlé S.A. EUR(a) 2007 comparatives have been restated following 1-for-10 share split
2008
109 908
15 676
13 103
18 039
50 774
150 409
4.87
13.71
2008
101 389
14 461
12 087
16 640
48 095
142 473
4.49
12.98
2008
69 288
9 882
8 260
11 372
34 120
101 074
3.07
9.21
2007
107 552
15 024
12 589
10 649
52 627
195 661
2.78
13.75
2007
89 927
12 562
10 526
8 904
46 738
173 766
2.33
12.21
2007
65 421
9 139
7 658
6 478
31 761
118 081
1.69
8.30
RA_report_58_80_GB.indd 59 3.3.2009 13:59:20

60 Nestlé Management Report 2008
This section should be read in connection with the
2008 Financial Statements.
Overview: a strong performance
in a tough environment
The last twelve months will likely be remembered for
the unprecedented and rapid changes in the economic
environment, the sharply falling stock markets, a global
crisis of confi dence, the rising unemployment and volatile
currencies and raw material prices. In this environment,
Nestlé delivered a performance that combined very strong
sales growth, driven by organic growth well above the
Group’s target run rate of 5% to 6%, with the achievement
of a sustainable improvement in the EBIT margin (Earnings
Before Interest, Taxes, restructuring and impairments).
This performance was broad-based with almost all
primary reporting segments contributing positively. The
Group continued its share buy-back and also increased its
investment in research & development and marketing, the
key building blocks for future profi table growth.
Raw material cost pressures began to increase
signifi cantly back in 2007 and prevailed well into 2008. After
some softness in the middle of the year, these pressures
look like re-emerging to some degree in 2009. Their impact
in 2008 is very visible in the high level of pricing achieved
by the Group, as well as the impact on the Group’s cost of
goods sold. Our ability to take such necessary pricing action,
and to do so whilst continuing to achieve a good positive
level of RIG (real internal growth) is testimony to the strength
of our brands, particularly our host of billionaire brands,
as well as to the very active programme of innovation and
renovation that was running through the course of the year.
Evidence of the signifi cant infl uence of renovation, keeping
well-established brands relevant to consumers can be found
in two brands, both over 50 years old: Nescafé that achieved
almost 10% organic growth in 2008 and KitKat that achieved
well over 10%. Both benefi ted over the course of 2007
and 2008 from renovation of existing lines and innovation,
with the launch of new variants. The same is true of brands
across the other categories.
Pricing and RIG were signifi cant factors in our ability to
deliver an improvement in EBIT margins. Just as important,
however, was our continued improvement in the product
mix, as we continue to drive our nutrition, health and
wellness strategy across all our product categories, and
our accelerated drive for effi ciencies from farm gate to
consumer. Operational effi ciency incorporates areas
such as the supply chain, our factories, administrative &
headquarters costs, SKU rationalisation and improved
returns on our marketing and trade spends. GLOBE
continues to enable these effi ciencies, as well as our drive
for reduced complexity, including our Global Nestlé Business
Services initiative, realising opportunities for shared services
and outsourcing of non-differentiated services.
Sales (Group)
In millions of CHF
110 000
100 000
90 000
109 908
2008
107 552
2007
98 458
2006
91 115
2005
84 690
2004
RA_report_58_80_GB.indd 60 3.3.2009 13:59:20

61Financial review
Nestlé’s billionaire brands
Organic growth (%)
39.0
37.5
27.0
25.5
24.0
22.5
21.0
19.5
18.0
16.5
15.0
13.5
12.0
10.5
9.0
7.5
6.0
4.5
3.0
1.5
–1.5
–3.0
–4.5
®
RA_report_58_80_GB.indd 61 3.3.2009 13:59:20

62 Nestlé Management Report 2008
The Nestlé Model, defi ned as the achievement of
organic growth of between 5% and 6% combined with
an improvement in the EBIT margin, was achieved again
in 2008. Over the last ten years, Nestlé has reported an
average annual organic growth of 6.2% and an average
annual improvement in the EBIT margin of 30 basis points.
Over that time, the Group’s sales have increased from
CHF 74.7 billion to CHF 109.9 billion and the EBIT from
CHF 8.3 billion to CHF 15.7 billion. The challenge now is to
achieve the Nestlé Model again in 2009, recognising that the
business environment has deteriorated signifi cantly over the
last twelve months.
2008 Sales – above target organic growth
Organic growth was 8.3%, with RIG of 2.8% and pricing of
5.5%. The impact of acquisitions (+2.4%), net of disposals
(–0.7%) was +1.7%. The main contributors to acquisitions
were Gerber and Novartis Medical Nutrition, acquired in
2007. The main disposals were the Family Frost ice cream
distribution business in Germany and the Buitoni dried pasta
business in Italy, as well as some other frozen and ambient
culinary businesses. Foreign exchange reduced our reported
Swiss franc sales by 7.8%, refl ecting another strong year
for the Swiss franc, particularly against the US dollar and
Euro. Overall, the Group’s sales increased 2.2% in 2008 to
CHF 109.9 billion.
The Food and Beverages business had sales of
CHF 102.4 billion, with organic growth of 8.2%, consisting
of RIG of 2.3% and pricing of 5.9%. The high level
of pricing refl ected the signifi cant raw material cost
pressure experienced both in the second half of 2007 and
for much of 2008. The RIG held up well despite the
pricing, refl ecting the strength of our brands and market
positions, a consistent fl ow of consumer-relevant product
innovation and renovation, supported by effective consumer
communication. Our total Food and Beverages business,
including the Zones, the Globally Managed Businesses and
the joint ventures, achieved 5.3% organic growth in Europe,
8.8% in the Americas and 13.1% in Asia, Oceania and Africa.
Our developing markets around the world achieved organic
growth of 15.4% on sales of CHF 35 billion.
The difference between the Group and the Food and
Beverages sales numbers is accounted for by our
Pharmaceutical activities, being Alcon and our two joint
ventures with L’Oréal, Galderma and Laboratoires innéov.
This segment recorded 8.8% organic growth and 8.4% RIG.
Food and Beverages
Sales and organic growth by continent (OG)
OG (%)
14
10
6
0 5 10 15 20 25 30 35 40 CHF bio
In billions of CHF
Europe*
Americas*
Asia, Oceania and Africa*
* each region includes sales of the Zones, Nestlé Waters, Nestlé Nutrition, Nespresso and Food and Beverages joint ventures
EBIT
In millions of CHF
15 000
13 000
11 000
EBIT margin
In %
14
13
12
Sales
39.1
43.8
19.5
OG (%)
5.3
8.8
13.1
10 760
2004
11 876
2005
13 302
2006
15 024
2007
15 676
2008
12.7
2004
13.0
2005
13.5
2006
14.0
2007
14.3
2008
RA_report_58_80_GB.indd 62 3.3.2009 13:59:45

63Financial review
Profi tability – EBIT margin improves despite
currency pressure
The Group’s EBIT increased 4.3% from CHF 15 billion to
CHF 15.7 billion, resulting in a 30 basis point increase in the
EBIT margin from 14% to 14.3%. In constant currencies,
the EBIT margin improved by 50 basis points. The Food
and Beverages EBIT margin increased by 20 basis points to
12.8%, by 40 basis points in constant currencies.
The improved EBIT margin performance was achieved
despite signifi cant raw material pressure, which resulted
in a 120 basis point increase in our cost of goods sold to
43.1% of sales. This increase was despite the offset of our
effi ciency initiatives which contributed over CHF 1 billion
of gross savings. The effi ciency drive is also refl ected in
lower distribution costs, down 30 basis points to 8.2% of
sales. This improvement also refl ects the different growth
rates in our product categories, with Nestlé Waters, for
example, which is distribution intensive, having negative
organic growth in 2008. The Marketing and Administrative
expenditure fell by 130 basis points to 32.6% of sales.
Again, effi ciencies played a role, with 50 basis points of this
improvement achieved in administrative costs. We have
also continued to focus on improving our return on our
marketing and trade spends. We have, however, continued
to support our brands and lay the foundations for future
growth, demonstrated by the fact that our 2008 marketing
expenditure increased by 7.5% in constant currencies.
Another pillar for future growth, Research & Development,
increased by 10 basis points to 1.8% of sales, and reached
CHF 2 billion. This performance demonstrates Nestlé’s
ability to continue to achieve profi table growth whilst
absorbing cost pressure, driving effi ciencies and investing
for future growth.
Primary segment reporting:
Zones and Globally Managed Businesses
The three geographic Zones all performed well relative
to their markets.
Zone Europe reported 5.6% organic growth, including
1.4% RIG. The Zone’s EBIT margin increased by 20 basis
points to 12.2% of sales. Organic growth was mid-single
digit in Western Europe and 14% in Eastern Europe. All the
major markets in the West achieved positive organic growth,
with Germany, United Kingdom and Switzerland, as well as
the pan-European PetCare business, particularly strong.
Zone Americas achieved 10.3% organic growth, including
2.7% RIG, and a 20 basis points improvement in its EBIT
margin to 16.5% of sales. There was high single-digit organic
growth in North America, and about 15% in Latin America.
Most regions contributed well to the organic growth, and
the regional PetCare business grew in the mid teens.
Primary segment reporting: Food and Beverages
Sales and organic growth (OG)
OG (%)
24
20
16
12
8
4
0
–4
0 5 10 15 20 25 30 35 40 CHF bio
In billions of CHF
Zone Europe
Zone Americas
Zone Asia, Oceania and Africa
Nestlé Waters
Nestlé Nutrition
Other Food and Beverages*
* mainly Nespresso and Food and Beverages joint ventures
managed on a worldwide basis
Primary segment reporting: Food and Beverages
EBIT margin
In %
Zone Europe
Zone Americas
Zone Asia, Oceania and Africa
Nestlé Waters
Nestlé Nutrition
Other Food and Beverages*
* mainly Nespresso and Food and Beverages joint ventures
managed on a worldwide basis
12.2
16.5
16.5
6.0
17.3
17.5
Sales
28.2
33.1
17.1
9.6
10.4
4.0
OG (%)
5.6
10.3
12.2
–1.6
7.7
23.5
RA_report_58_80_GB.indd 63 3.3.2009 13:59:46

64 Nestlé Management Report 2008
Zone Asia, Oceania and Africa reported 12.2% organic
growth, including 3.7% RIG. Its EBIT margin also increased
by 20 basis points to 16.5% of sales. There were strong
performances from all the emerging markets, with almost
all of them achieving double-digit organic growth. Japan
also achieved positive organic growth.
The two large Globally Managed Businesses are Nestlé
Waters and Nestlé Nutrition.
Nestlé Waters saw its RIG and organic growth become
negative, –3.9% and –1.6% respectively, and experienced
a 220 basis point decline in EBIT margin to 6% of sales.
The growth was impacted by a combination of external
factors, being mainly the consumer down-trading due to
the economic environment, and the somewhat emotional
debate about the perceived environmental issues around the
category. The decline in EBIT margin is a direct result of the
reduced sales, exacerbated by cost pressures, particularly
oil-related, as well as under-performance in parts of the
European Home and Offi ce Delivery (HOD) business. A key
contributor to the European HOD under-performance was
sold early in 2009.
Nestlé Nutrition achieved organic growth of 7.7% with
RIG of 1.8% and improved its EBIT margin by 10 basis points
to 17.3% of sales. The biggest division, Infant Nutrition, had
another very strong year with near double-digit organic
growth, driven in particular by Infant Formula. The weight
management division, Jenny Craig, achieved double-digit
organic growth, although the pace of growth slowed
signifi cantly during the course of the year. The other two
divisions were slower, particularly Performance Nutrition,
where we have been going through a signifi cant programme
of product rationalisation.
The remaining smaller businesses, primarily Nespresso
and the two joint ventures, Cereal Partners Worldwide (with
General Mills) and Beverage Partners Worldwide (with Coca
Cola), are grouped together as Other Food and Beverages.
They achieved organic growth of 23.5% with RIG of 20.1%,
and improved their EBIT margin by 170 basis points to 17.5%
of sales. The constituent businesses all performed well, and
Nespresso continued to achieve near 40% organic growth.
Secondary segment reporting: Product groups
EBIT margin
In %
Powdered and liquid beverages
Nestlé Waters
Milk products and Ice cream
Nestlé Nutrition
Prepared dishes and cooking aids
Confectionery
PetCare
Pharmaceutical products
Secondary segment reporting: Product groups
Sales and organic growth (OG)
OG (%)
15
12
9
6
3
0
–3
0 5 10 15 20 CHF bio
In billions of CHF
Powdered and liquid beverages
Nestlé Waters
Milk products and Ice cream
Nestlé Nutrition
Prepared dishes and cooking aids
Confectionery
PetCare
Pharmaceutical products
22.1
6.0
11.5
17.3
12.8
13.1
15.7
34.1
Sales
18.9
9.6
20.5
10.4
18.1
12.4
12.5
7.5
OG (%)
12.8
–1.6
9.2
7.7
6.1
8.0
12.1
8.8
RA_report_58_80_GB.indd 64 3.3.2009 13:59:46

65Financial review
Secondary segment reporting: Product groups
Powdered and Liquid Beverages had an excellent year,
with organic growth of 12.8% and RIG of 7.4%. The EBIT
margin fell 30 basis points to 22.1% of sales. Soluble
coffee’s organic growth was about 10% due to a strong
performance by Nescafé in all three Zones. There have been
launches and roll-outs of health focused products in Asia
under brands such as Nescafé Body Partner, Nescafé Protect
and Nescafé Greenblend. The European roll-out of Nescafé
Dolce Gusto has continued, with the brand achieving
leadership in a number of markets. The roll-out has now
moved to Mexico, Japan and the USA. Powdered Beverages
achieved near 10% organic growth, whilst Liquid Beverages
exceeded 10%. There were strong performances from the
billionaire brands, Nesquik, Nestea and Milo. Again, the
focus on nutrition, health and wellness has paid dividends,
connecting with consumers through simple, effective and
imaginative communication, bringing to life benefi ts such as
lower sugar and fat or enhanced energy management.
Milk products and Ice cream, reported organic growth
of 9.2% with RIG of 1.2%. The EBIT margin increased
40 basis points to 11.5% of sales. The ambient dairy
business had a strong year for organic growth, still partly
refl ecting the effects of the steep rise in milk prices back
in 2007. The business has benefi ted from its strategy of
market segmentation, both by price and by consumer need,
for example through the Nestlé Nido Nutrition System. In
common with the Beverages product group, it is able to
offer consumers products at every price point, meaning
that they are able to trade up or down within the category
without trading out of Nestlé products. Ice cream achieved
positive organic growth. The segment suffered from
poor European weather, as well as cost pressures in the
North American market, which led to market contraction
as consumers reacted poorly to the necessary increased
pricing. There were good performances at the premium
end of the market, however, from brands such as
Mövenpick of Switzerland and Häagen-Dazs, as well
as from products targeted at the “better for you”
segment, such as Skinny Cow.
Prepared dishes and cooking aids achieved organic
growth of 6.1% with RIG of 1.1%. The EBIT margin fell
20 basis points to 12.8% of sales. Maggi was once again the
outstanding brand in this product group with high single
digit organic growth. The emerging markets continued to
be the driver of growth for the brand. The US Frozen Food
business accelerated during the year, with all three billionaire
brands, Stouffer’s, Lean Cuisine and Hot Pockets achieving
positive organic growth. Herta also achieved positive
organic growth in Europe, whilst Buitoni benefi ted from the
disposal of its dry pasta business in Italy.
Confectionery delivered organic growth of 8% with RIG
of 1.4%. The EBIT margin increased 150 basis points to
13.1% of sales. KitKat achieved double-digit organic growth,
with a strong performance in Europe and emerging markets.
The core four fi nger KitKat was renovated, with improved
crispiness, whilst an extension was launched, KitKat Senses,
targeted at female consumers. We continued to focus on
the premium segment, with launches in dark chocolate,
and in super-premium with a new range of chocolates,
designed by Pierre Marcolini and sold exclusively through
Nespresso boutiques.
PetCare had very strong organic growth of 12.1% with
RIG of 5.2%. The EBIT margin increased 20 basis points
to 15.7% of sales. There was good growth in all three
Zones. The RIG held up well despite the necessary pricing,
refl ecting the strength of brands such as Friskies, Beneful,
Dog Chow, Gourmet and Fancy Feast, and continued
innovation around health and wellness for dogs and cats,
with products such as Cat Chow Healthful Life, Beneful
Playful Life, ONE Natural Balance and Bakers 2 in 1.
Pharmaceutical products reported organic growth of
8.8% with RIG of 8.4%. The EBIT margin increased 80 basis
points to 34.1% of sales.
RA_report_58_80_GB.indd 65 3.3.2009 13:59:46

66 Nestlé Management Report 2008
Net Profi t and earnings per share
Other income include profi t on disposal of the 24.8% share
of Alcon by Nestlé to Novartis, amounting to CHF 9.2 billion.
Other expenses include mainly restructuring costs, mostly
related to European rationalisation projects, and impairments
of goodwill, of which CHF 442 million relates to the Nestlé
Waters Home and Offi ce Delivery (HOD) business.
Net fi nancing cost increased from CHF 0.9 billion in 2007
to CHF 1.1 billion in 2008. This increase is mostly explained
by some one-off fair value losses in trading securities, of
which a signifi cant portion is related to Alcon.
The Group’s effective tax rate fell from 25.3% in 2007
to 17.3% in 2008, an evolution essentially due to the tax
free gain resulting from the disposal of the 24.8% share of
Alcon. The underlying tax rate increased to slightly above
27%, an evolution resulting mostly from the market mix.
The Group’s share of results of associates comprises
for the most part L’Oréal, representing CHF 938 million
(2007: CHF 1302 million). The decrease in L’Oréal’s results
is mainly explained by the one-off gain on disposal made
in 2007 in relation to Sanofi Synthelabo.
Our Net profi t was CHF 18 billion or 16.4% of sales, up
69.4% or 650 basis points from CHF 10.6 billion or 9.9% of
sales. Our earnings per share, restated for the 1-for-10 share
split, increased by 75.2% to CHF 4.87 from CHF 2.78.
The increase is mainly explained by the one-off gain
realised on the partial disposal of Alcon. The underlying
earnings per share increased by 0.7% and by 10.9%
in constant currencies.
Earnings per share (a)
In CHF
4.50
3.00
1.50
Underlying
Total
(a) restated following 1-for-10 share split
Capital expenditure
In millions of CHF
5 000
4 250
3 500
Return on invested capital (based on segment reporting)
In %
22.5
17.5
12.5
Including goodwill
Excluding goodwill
3 260
2004
3 375
2005
4 200
2006
4 971
2007
4 869
2008
1.88
1.70
2004
2.15
2.08
2005
2.41
2.39
2006
2.80
2.78
2007
2.82
4.87
2008
10.8
19.9
2004
11.4
20.8
2005
11.7
21.2
2006
12.2
22.2
2007
12.3
22.2
2008
RA_report_58_80_GB.indd 66 3.3.2009 13:59:46

67Financial review
Cash fl ow
In millions of CHF
Operating cash fl ow
Cash fl ow from investing activities
Cash fl ow from fi nancing activities
Currency retranslations
Increase/(decrease) in cash and cash equivalents
The Group’s operating cash fl ow decreased by 19.9%
despite the strong operating performance and improved
profi tability of the Group. This refl ects the decline in the
value of most currencies relative to the Swiss franc in 2008.
Additionally there was a higher level of working capital
compared to last year, mainly in inventories as a result of
the increased cost of certain raw materials and the decision
to increase inventories of some products. Operating cash
fl ow decreased by CHF 2.6 billion from CHF 13.4 billion
to CHF 10.8 billion, whilst the free cash fl ow decreased
from CHF 8.2 billion to CHF 5 billion. The Group’s capital
expenditure remained stable at CHF 4.9 billion at the end of
2008 (2007: CHF 5 billion).
The major movement within the Group’s investing
activities in 2008 was the CHF 10.7 billion received from the
sale of 24.8% share of Alcon to Novartis, whereas in 2007
it was the payment of CHF 9.5 billion to Novartis for the
acquisition of Gerber and Novartis Medical Nutrition.
In respect of shareholder returns, the Group’s fi nancing
activities comprise the Share Buy-Back Programme in which
CHF 8.7 billion was invested in 2008 (2007: CHF 4.4 billion),
an increase of about CHF 2 billion compared to the original
plan, and prior-year dividends up 14.2% to CHF 4.6 billion
(2007: CHF 4 billion).
The Group’s net fi nancial debt dropped from
CHF 21.2 billion at the end of 2007 to CHF 14.6 billion
at the end of 2008.
Financial position further strengthened
In millions of CHF
Current assets
Non-current assets
Total assets
Current liabilities
Non-current liabilities
Equity
Total liabilities and equity
Trade working capital represented 10.5% of sales at the end
of 2007 and decreased to 10% of sales at the end of 2008.
This evolution is mainly due to the favourable currency
impact resulting from the strength of the Swiss franc.
Non-current assets also decreased globally as a result of
the evolution of currencies against the Swiss franc and the
impairment of goodwill for the Nestlé Waters HOD business.
The proceeds of the sale of a 24.8% share of Alcon,
CHF 10.7 billion, were used to reduce the Group’s exposure
to the short-term commercial paper market. Nestlé enjoys
predictable cash fl ows which, combined with its high credit
quality, have positioned it well in recent market conditions,
enabling it to continue to make below-market rate debt
offerings. Nestlé’s strong fi nancial position is refl ected in the
fact that it has invested CHF 8.7 billion in its Share Buy-Back
Programme in 2008. By the end of 2008, it had completed
CHF 13.1 billion of the planned CHF 25 billion Share Buy-
Back Programme and, subject to market conditions, the
Group remains on schedule to complete it within the
planned thirty-six month period. There were no signifi cant
acquisitions in 2008.
The equity ratio increased from 47.5% of the total
balance sheet to 51.7%. This is the direct consequence of
the partial sale of Alcon, but also of the EBIT improvement.
The Group’s strong balance sheet and its high standing
with debt investors are clearly an advantage in the current
diffi cult credit market conditions, and Nestlé intends to
continue to prioritise a strong balance sheet.
2008
10 763
4 699
(16 884)
663
(759)
2008
33 048
73 167
106 215
33 223
18 076
54 916
106 215
2007
13 439
(15 753)
3 897
(267)
1 316
2007
35 770
79 591
115 361
43 326
17 259
54 776
115 361
RA_report_58_80_GB.indd 67 3.3.2009 13:59:47

68 Nestlé Management Report 2008
Return on invested capital
The return on invested capital remained at 22.2% excluding
goodwill, as the invested capital increased in line with the
returns. Thanks to a favourable foreign currency impact, the
return on invested capital including goodwill improved by
10 basis points to 12.3%.
Principal risks and uncertainties
Group Risk Management
The Nestlé Group Enterprise Risk Management Framework
(ERM) is designed to identify, communicate, and mitigate
risks in order to minimise their potential impact on the
Group. A “Top-Down” assessment occurs annually and
focuses on the Group’s global risk portfolio. It involves
the aggregation of individual “Top-Down” assessments of
Zones, Globally Managed Businesses, and selected markets.
It is intended to provide a high-level mapping of Group risk
and allow Group Management to make sound decisions
on the future operations of the Company. Risk assessments
are the responsibility of line management; this applies
equally to a business, a market or a function, and any
mitigating actions identifi ed in the assessments are the
responsibility of the individual line management. If a Group-
level intervention is required, responsibility for mitigating
actions will generally be determined by the Executive Board.
The results of the Group ERM are presented to the Executive
Board and Audit Committee annually. In the case of an
individual risk assessment identifying a risk which requires
action at Group level, an ad hoc presentation is made to the
Executive Board.
Factors affecting results
Nestlé’s reputation is based on consumers’ trust. Any
major event triggered by a serious food safety or other
compliance issue could potentially impact upon Nestlé’s
reputation or brand image. The Group has all required
policies, processes and controls in place to prevent against
such an event.
Nestlé is dependant on sustainable supply of a number
of raw materials, packaging materials and services/utilities.
Any major event triggered by natural hazards (drought,
fl ood, etc.), change in macro-economic environment (shift in
production patterns, “biofuels”, excessive trading) resulting
in input price volatilities and/or capacity constraints could
potentially impact upon Nestlé’s fi nancial results. The Group
has necessary policies, processes and controls in place to
mitigate against such an event.
The Group’s liquidities/liabilities (currency, interest rate,
derivatives, and/or hedging, pension funding obligations,
commercial credit) could potentially be impacted by any
major event in the fi nancial markets. Nestlé has necessary
policies, processes and controls in place to mitigate against
such an event.
Evolution of the Nestlé registered share in 2008
J F M A M J J A S O N D
In CHF
55.00
47.50
40.00
Registered share
Nestlé relative to Swiss Market Index
Dividend per share (a)
In CHF
1.40
1.10
0.80
(a) restated following 1-for-10 share split
Total cash returned to shareholders
In billions of CHF
12
8
4
Share Buy-Back
Dividend
0.80
2004
0.90
2005
+14.8%
1.04
2006
1.22
2007
1.40
2008
120%
100%
80%
+57%+4%
+41%
+35%
+58%
2.8
2004
1.3
3.1
2005
2.7
3.5
2006
4.4
4.0
2007
8.7
4.6
2008
RA_report_58_80_GB.indd 68 3.3.2009 13:59:47

69Financial review
Nestlé is dependant on sustainable supply of fi nished
goods for all product categories. A major event in one of
Nestlé’s key plants, at a key supplier, contract manufacturers,
co-packers, and/or key warehouse facility could potentially
lead to a supply disruption and impact upon Nestlé’s
fi nancial results. Necessary business continuity plans are
established and regularly maintained in order to mitigate
against such an event.
Nestlé has operations in 84 different countries and
its products are sold in more than 120 countries in the
world. Security, political stability, legal & regulatory,
macroeconomic, foreign trade, labour, and/or infrastructure
risk(s) could potentially impact upon Nestlé’s ability to do
business in a country or region. Events such as a human
pandemic could potentially also impact upon the Group’s
ability to operate. Any of these events could potentially lead
to a supply disruption and impact upon Nestlé’s fi nancial
results. Regular monitoring and ad hoc business continuity
plans are established in order to mitigate against such an
event. The Group’s wide geographical and product category
spreads represent a tremendous natural hedge.
The Nestlé share – relative out-performance
in a negative year for markets
At the 2008 Annual General Meeting, shareholders voted
in favour of a 1-for-10 share split. In common with fi nancial
markets the world over, the Nestlé share price fell in 2008.
Having closed 2007 at CHF 52.– (adjusted for the split), it
ended 2008 at CHF 41.60. However, the Nestlé share has
performed well relative to the market during the period, out-
performing the Swiss Market Index by 14.7%, as well as the
Dow Jones Stoxx Food and Beverage Index by 17.1%.
Dividend
The Board is proposing to shareholders an increase in the
dividend of 14.8%, from CHF 1.22 per share (restated for
the 1-for-10 share split) to CHF 1.40 per share. This proposal
refl ects the Group’s strong performance in 2008, the
Board’s expectations for 2009, as well as its understanding
of the importance of dividends in the context of depressed
fi nancial markets.
Outlook
The global business environment in 2008 was affected by
a number of unforeseen events, especially in the latter part
of the year. Economies around the world have signifi cantly
weakened over the last few months and it is likely that
developments could further impact consumer demand.
However, Nestlé believes that it will once again be one of
its industry’s fastest growing companies this year, in line
with the long-standing Nestlé Model. For 2009, Nestlé is
committed to achieving organic growth at least approaching
5%, as well as a further improvement of EBIT margin in
constant currencies.
RA_report_58_80_GB.indd 69 3.3.2009 13:59:47

70 Nestlé Management Report 2008
Management responsibilitiesFood and Beverages
In millions of CHF
Zone Europe
Western
Eastern and Central
Beverages
Milk products and Ice cream
Prepared dishes and cooking aids
Confectionery
PetCare
Total sales
EBIT
Capital expenditure
Zone Americas
USA and Canada
Latin America and Caribbean
Beverages
Milk products and Ice cream
Prepared dishes and cooking aids
Confectionery
PetCare
Total sales
EBIT
Capital expenditure
2007
24 476
3 988
6 168
3 556
9 254
5 593
3 893
28 464
3 412
932
20 824
12 093
4 007
10 159
6 534
4 678
7 539
32 917
5 359
1 371
84.1%
15.9%
22.2%
12.0%
31.9%
19.9%
14.0%
100%
12.2%
3.2%
61.2%
38.8%
12.4%
30.9%
18.7%
14.4%
23.6%
100%
16.5%
4.1%
2006
23 241
3 411
5 598
3 436
8 858
5 174
3 586
26 652
3 109
812
20 603
10 684
3 770
9 470
6 395
4 420
7 232
31 287
4 946
1 125
RIG (%)
1.4
2.7
OG (%)
5.6
10.3
2008
23 690
4 463
6 254
3 376
8 989
5 604
3 930
28 153
3 446
904
20 294
12 840
4 115
10 234
6 212
4 769
7 804
33 134
5 469
1 359
RA_report_58_80_GB.indd 70 3.3.2009 13:59:47

71Financial review
In millions of CHF
Zone Asia, Oceania and Africa
Oceania and Japan
Other Asian markets
Africa and Middle East
Beverages
Milk products and Ice cream
Prepared dishes and cooking aids
Confectionery
PetCare
Total sales
EBIT
Capital expenditure
Nestlé Waters
Europe
USA and Canada
Other regions
Total sales
EBIT
Capital expenditure
Nestlé Nutrition
Europe
Americas
Asia, Oceania and Africa
Total sales
EBIT
Capital expenditure
Other Food and Beverages
Total sales
EBIT
Capital expenditure
Nestlé Professional*
Total sales
* Nestlé Professional’s sales and results are included in the Zones. From 2009 this globally managed business will be reported within Other Food and Beverages
2007
4 571
6 983
5 002
5 685
5 572
2 714
1 886
699
16 556
2 697
675
4 551
5 118
735
10 404
851
1 043
2 807
3 897
1 730
8 434
1 447
271
3 458
548
269
26.1%
42.8%
31.1%
35.1%
32.5%
17.0%
11.1%
4.3%
100%
16.5%
3.9%
44.4%
47.6%
8.0%
100%
6.0%
8.0%
28.8%
52.8%
18.4%
100%
17.3%
3.4%
100%
17.5%
7.6%
100%
2006
4 624
6 466
4 414
5 436
5 365
2 370
1 731
602
15 504
2 571
588
4 179
4 805
652
9 636
834
923
2 314
2 236
1 414
5 964
1 009
194
2 728
371
141
RIG (%)
3.7
–3.9
1.8
20.1
0.4
OG (%)
12.2
–1.6
7.7
23.5
6.1
2008
4 476
7 328
5 327
6 019
5 562
2 913
1 902
734
17 130
2 826
663
4 261
4 562
766
9 589
573
768
2 986
5 475
1 914
10 375
1 797
355
3 983
696
304
6 159
RA_report_58_80_GB.indd 71 3.3.2009 13:59:48

72 Nestlé Management Report 2008
Leading positions in dynamic categories
In millions of CHF
Beverages
Soluble coffee
Nestlé Waters
Other
Total sales
EBIT
Capital expenditure
Milk products, Nutrition and Ice cream
Milk products
Nestlé Nutrition
Ice cream
Other
Total sales
EBIT
Capital expenditure
Prepared dishes and cooking aids
Frozen and chilled
Culinary and other
Total sales
EBIT
Capital expenditure
Confectionery
Chocolate
Sugar confectionery
Biscuits
Total sales
EBIT
Capital expenditure
2007
10 371
10 404
7 470
28 245
4 854
1 409
11 742
8 434
7 521
1 409
29 106
3 744
933
10 705
7 799
18 504
2 414
305
9 754
1 207
1 287
12 248
1 426
316
37.5%
33.7%
28.8%
100%
16.7%
39.4%
33.5%
22.5%
4.6%
100%
13.4%
56.6%
43.4%
100%
12.8%
79.2%
9.3%
11.5%
100%
13.1%
2006
9 477
9 636
6 769
25 882
4 475
1 105
10 820
5 964
7 424
1 227
25 435
3 003
702
10 307
7 328
17 635
2 323
272
9 103
1 204
1 092
11 399
1 309
258
RIG (%)
3.3
1.4
1.1
1.4
OG (%)
7.5
8.7
6.1
8.0
2008
10 688
9 589
8 197
28 474
4 756
1 159
12 189
10 375
6 969
1 403
30 936
4 158
896
10 247
7 870
18 117
2 311
387
9 802
1 145
1 423
12 370
1 620
329
RA_report_58_80_GB.indd 72 3.3.2009 13:59:48
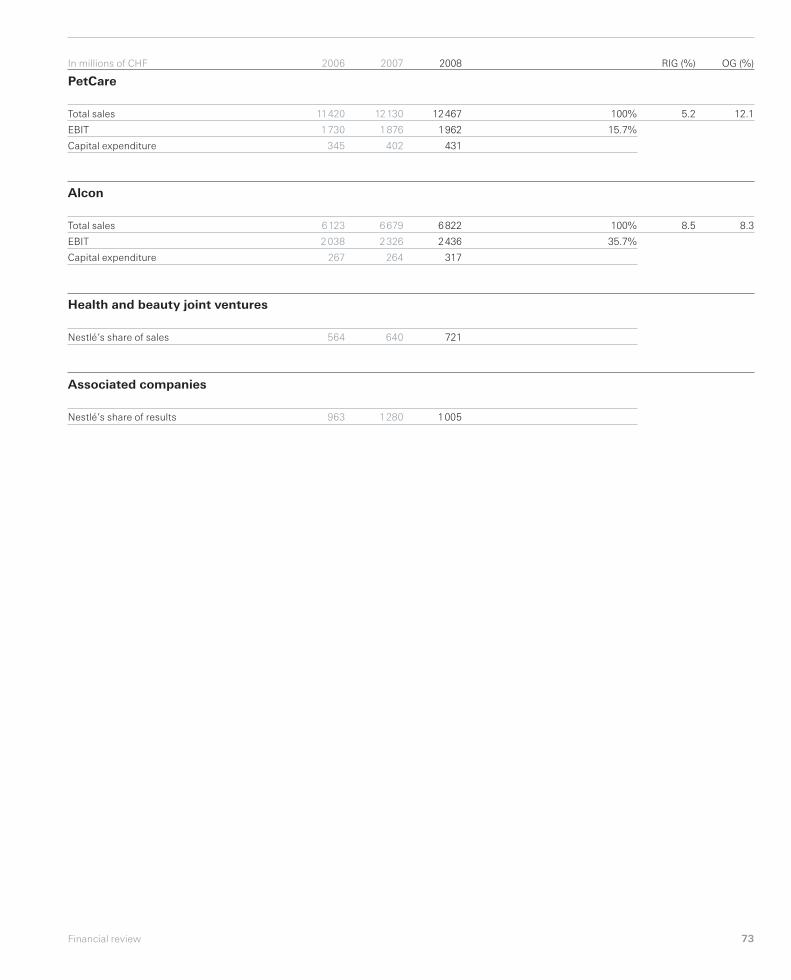
73Financial review
In millions of CHF
PetCare
Total sales
EBIT
Capital expenditure
Alcon
Total sales
EBIT
Capital expenditure
Health and beauty joint ventures
Nestlé’s share of sales
Associated companies
Nestlé’s share of results
2007
12 130
1 876
402
6 679
2 326
264
640
1 280
100%
15.7%
100%
35.7%
2006
11 420
1 730
345
6 123
2 038
267
564
963
RIG (%)
5.2
8.5
OG (%)
12.1
8.3
2008
12 467
1 962
431
6 822
2 436
317
721
1 005
RA_report_58_80_GB.indd 73 3.3.2009 13:59:48

74 Nestlé Management Report 2008
Geographic data: people, factories and sales
Nestlé has 456 factories in 84 countries around the world.
This is a reduction from 480 in 2007. During the year,
10 factories were acquired or opened and 30 were closed
or divested. Furthermore the reorganisation of our factories
resulted in 4 factories being satellised.
Factories by geographic area
Europe
Americas
Asia, Oceania and Africa
Total
Employees by geographic area
Europe*
Americas
Asia, Oceania and Africa
Total
* 8 957 employees in Switzerland in 2008
Employees by activity
In thousands
Factories
Administration and sales
Total
Sales
In millions of CHF
By principal market
USA
France
Germany
Brazil
Italy
United Kingdom
Mexico
Spain
Canada
Australia
Russia
Japan
Greater China Region
Switzerland
Philippines
Other markets
By continent
Europe
USA + Canada
Latin America + Caribbean
Asia
Africa
Oceania
Total Group
(a) Not applicable
2007
184
166
130
480
2008
165
168
123
456
Differences 2008/2007
in CHF in local currency 2008
29 922
8 558
6 511
5 668
4 440
4 140
3 569
3 039
2 549
2 490
2 465
2 274
2 230
2 066
1 856
28 131
41 265
32 470
15 523
14 701
2 992
2 957
109 908
+11.1%
+2.7%
+1.7%
+11.2%
+0.1%
+5.7%
+15.1%
+4.5%
+4.4%
+2.4%
+28.5%
+7.4%
+10.3%
+24.0%
+12.9%
(a)
(a)
(a)
(a)
(a)
(a)
(a)
(a)
+0.7%
–0.9%
–1.9%
+7.1%
–3.4%
–12.1%
+2.4%
+0.8%
–6.1%
–6.4%
+19.1%
+12.6%
+8.9%
+24.0%
+5.6%
+6.0%
+0.6%
+0.1%
+8.3%
+7.5%
+1.6%
–6.4%
+2.2%
2007
34.5%
38.3%
27.2%
2007
144
132
276
2008
34.0%
38.7%
27.3%
2008
147
136
283
RA_report_58_80_GB.indd 74 3.3.2009 13:59:48

75Financial review
Asia, Oceania and Africa
Algeria 1 � � � � � �Australia 13 � � � � � � � � � � �Bahrain 1 � � � � � �Bangladesh 1 � � � � � � �Cameroon 1 � � � � � �Côte d’Ivoire 2 � � � � � �Egypt 4 � � � � � � �Fiji 1 � � � � � � �Ghana 1 � � � � � � �Greater China Region 19 � � � � � � � � � � �Guinea 1 � � � � � �India 6 � � � � � �Indonesia 3 � � � � � � � � � �Iran 2 � � � � � � �Israel 8 � � � � � � � � �Japan 3 � � � � � � � � � �Jordan 1 � � � � � �Kenya 1 � � � � � � � �Lebanon 1 � � � � � �Malaysia 6 � � � � � � � � � �Morocco 1 � � � � � � � �New Caledonia 1 � � � � � � �New Zealand 2 � � � � � � � � �Nigeria 1 � � � � � � � �Pakistan 3 � � � � � � �Papua New Guinea 1 � � � � � � � �Philippines 4 � � � � � � � �Qatar 1 � � � � � �Republic of Korea 2 � � � � � � �Saudi Arabia 4 � � � � � � � �Senegal 1 � � � � �Singapore 1 � � � � � � � �South Africa 10 � � � � � � � � � � �Sri Lanka 1 � � � � � �Syria 1 � � � � � � �Thailand 6 � � � � � � � � �Tunisia 1 � � � � � �United Arab Emirates 1 � � � � � � �Uzbekistan 1 � � � � � � �Vietnam 3 � � � � � � �Zimbabwe 1 � � � � � � � �
Europe
Austria 1 � � � � � � �Belgium 3 � � � � � � � �Bulgaria 2 � � � � � � � �Czech Republic 3 � � � � � � � �Finland 2 � � � � � � �France 30 � � � � � � � � � � �Germany 21 � � � � � � � � � � � �Greece 4 � � � � � � � �Hungary 3 � � � � � � � � �Italy 19 � � � � � � � � � � �Netherlands 2 � � � � � � � �Poland 8 � � � � � � � � � �Portugal 4 � � � � � � � �Republic of Ireland 1 � � � � � � �Republic of Serbia 1 � � � � � �Romania 1 � � � � � � � �Russia 12 � � � � � � � � � � �Slovak Republic 1 � � � � � � �Spain 13 � � � � � � � � � � � �Sweden 2 � � � � � � �Switzerland 12 � � � � � � � � � � �Turkey 5 � � � � � � �Ukraine 2 � � � � � � � �United Kingdom 13 � � � � � � � � �
Americas
Argentina 8 � � � � � � � � �Brazil 23 � � � � � � � � � � �Canada 10 � � � � � � � � � � � �Chile 6 � � � � � � � � � �Colombia 4 � � � � � � � � � � �Costa Rica 1 � � �Cuba 3 � � � � � � �Dominican Republic 2 � � � � � � � �Ecuador 2 � � � � � � � � � �Guatemala 1 � � � � � � �Jamaica 1 � � � � � � � �Mexico 13 � � � � � � � � � � � �Nicaragua 1 � � � � � � �Panama 1 � � � � � � � �Peru 1 � � � � � � � � �Trinidad and Tobago 1 � � � � � � � �United States 82 � � � � � � � � � � � �Uruguay 1 � � � � � � �Venezuela 7 � � � � � � � � � � �
The fi gure in black after the country denotes the number of factories
� Local production (may represent production in several factories)
� Imports (may, in a few particular cases, represent purchases
from third parties in the market concerned)
Beverages
Milk products, Nutrition and Ice cream
Prepared dishes and cooking aids
Confectionery
PetCare
Pharmaceutical products
RA_report_58_80_GB.indd 75 3.3.2009 13:59:49

76 Nestlé Management Report 2008
Nestlé Creating Shared Value performance indicators
Manufacturing and our environmental footprint
Materials Raw materials and ingredients (except water [see below], million tonnes)
Packaging materials (million tonnes)
By-products (for recycling, million tonnes)
Reduction of by-products (per tonne of product) over 10 years
Waste (for fi nal disposal, million tonnes)
Reduction of waste (per tonne of product) over 10 years
Energy Direct energy consumption (Peta Joules)
Indirect energy consumption (Peta Joules)
Energy saved (per tonne of product) over 10 years
Greenhouse gases Direct CO2 emissions (million tonnes)2
Indirect CO2 emissions (million tonnes)
Reduction of direct CO2 emissions (per tonne of product) over 10 years
Reduction of indirect CO2 emissions since 2007 (per tonne of product)
Water Total water withdrawal (million m3)
Water saved (per tonne of product) over 10 years
Total water discharge (million m3)
Quality of water discharged (average mg COD/l)
Packaging Source reduction (thousand tonnes): since 1991
Source reduction (CHF million): since 1991
Reduction of packaging weight (per l of product – Nestlé Waters) over 5 years
Governance ISO 14001/OHSAS 18001-certifi ed sites (number of certifi cates)
Sites audited through CARE programme (since July 2005)
Our people
Workforce size (total number of employees)
Lost Time Injuries (per million hours worked)
Total Injury Rate (per million hours worked)
Leadership positions3 held by women
Local Management Committee members native to country in developing countries
Formal classroom training received in developing countries (number of employees)
Key Business Positions
Employees with potential to fi ll Key Business Positions
Agriculture and rural development
Farmers trained through capacity-building programmes
Markets covered by Sustainable Agriculture Initiative Nestlé (SAIN) programmes
Suppliers audited for safety, quality and processing
1 GRI = Global Reporting Initiative2 Includes CO2 from fuel usage, refrigerants and Ozone Depletion Potential (ODP) substances3 Defi ned as positions with people management responsibilities
Creating Shared Value – Performance summary
Nestlé has developed performance indicators to provide a focus for measuring and reporting Creating Shared
Value. The summary below forms part of our communication on progress on the UN Global Compact Principles.
Unless stated otherwise, performance indicators are for the year ending 31 December 2008.
2007
20.48
4.08
1.07
58%
0.372
58%
85.3
63.7
45%
4.13
3.1
53%
n/a
157
59%
101
62
326.3
583.7
22%
171
403
276 050
3.7
7.5
24%
42%
65 647
917
3 247
111 800
28
3 400
2008
21.43
4.00
1.11
54%
0.410
49%
86.9
65.3
42%
4.10
3.0
48%
3%
147
58%
96
95
392.0
683.0
20%
455
490
283 000
2.8
6.1
25%
42%
70 167
970
3 919
158 837
32
3 417
GRI reference1
EN1
EN1
EN22
n/a
EN22
n/a
EN3
EN4
EN5
EN16
EN16
EN18
EN4
EN8
n/a
EN21
EN21
n/a
n/a
n/a
n/a
n/a
LA1
LA7
LA7
LA4
n/a
LA10
n/a
n/a
n/a
n/a
n/a
RA_report_58_80_GB.indd 76 3.3.2009 13:59:50

77Creating Shared Value – Preliminary fi ndings statement
Introduction
Bureau Veritas UK has been
engaged to provide external
assurance to the stakeholders
of Nestlé SA (Nestlé), over the
Creating Shared Value (CSV)
content (presented on pages 12 to
23) and CSV actions as indicated
in the Nestlé Management
Report 2008 (the Report). The
preparation of the Report is the
sole responsibility of Nestlé. Our
overall aim is to provide reasonable
assurance to stakeholders over the
accuracy and reliability of the CSV
information included in the Report.
Scope and methodology
The scope of the assurance included
1. a review of related activities
undertaken by Nestlé over the
reporting period January 2008
to December 2008;
2. a limited review of information
from external partners relating
to materiality assessment and
stakeholder convenings;
3. a review of information relating
to Nestlé’s issues, responses,
performance data, case studies
and underlying systems to
manage such information
and data;
4. an evaluation of Safety, Health
and Environment (SHE) data
and systems;
5. a pilot assessment of the
implementation of CSV related
policies and processes at the
market level.
As part of the scope outlined above,
Bureau Veritas undertook the
following:
• interviews with key
management at Nestlé’s
head offi ce;
• review of processes for
identifi cation and collation of
relevant information, report
content and performance data
from Group operations globally;
• verifi cation of performance
data and factual information
within the Report;
• visits to approximately 3% of
operational sites across nine
countries to evaluate the SHE
data management systems and
data reliability and accuracy;
• a visit to Nestlé South Africa
to review the understanding
and implementation of market
level CSV related processes as
presented within the Report.
Preliminary fi ndings
Based on our review, it is our
opinion that the Report:
• includes information that is
reliable, understandable and
clearly presented;
• provides a reasonable account
of relevant activities and
performance over the reporting
period;
• presents a continuation of
discussions around issues
established during the last CSV
report (albeit in a précis format),
and as such does not omit
any subject area considered
to be of material importance
although more commentary
on performance relating to
“Our People” KPIs should have
been included;
• demonstrates an improvement
on previous reporting by
the inclusion in the text of
the issues and challenges
that Nestlé faces. Additional
information provides context
and a better understanding
of Nestlé’s responses to
such issues;
• provides an account that is
inclusive of related Nestlé
activities, although it should
be noted that due to the
brevity of the CSV content
within the Report, all relevant
stakeholders concerns cannot
be addressed in full.
Pilot assessment
of policy implementation
in Nestlé Markets
A pilot assessment of the
implementation of CSV related
policies and programmes within a
sample market indicate that Nestlé
is taking a proactive approach
to issues of material concern.
There exists in South Africa a
strong regulatory environment in
relation to employment and social
issues, and Nestlé South Africa
is undertaking its activities under
Statement of independence,
impartiality and competence
Bureau Veritas is an independent
professional services company
that specialises in quality, health,
safety, social and environmental
management advice and
compliance with almost
180 years history in providing
independent assurance services
and an annual turnover
in 2007 of EUR 2.1 billion.
Bureau Veritas has
implemented a code of ethics
across its business which is
intended to ensure that all our
staff maintain high standards
in their day-to-day business
activities. We are particularly
vigilant in the prevention of
confl icts of interest. We believe
our assurance assignment does
not raise any confl icts of interest.
Competence: our assurance
team completing the work
for Nestlé S.A. has extensive
knowledge of conducting
assurance over environmental,
social, health, safety and
ethical information, systems
and processes, and with over
20 years combined experience
in this fi eld an excellent
understanding of good practice
in corporate responsibility
reporting and assurance.
the sphere of Broad Based Black
Economic Empowerment at each
stage of its value chain as defi ned
by its CSV approach.
Assurance fi ndings are
reported in the full assurance
statement on nestle.com/csv
Key areas for improvement
are reported in the full assurance
statement on nestle.com/csv
Considerations and limitations
Excluded from the scope of our
work is information relating to:
• activities outside the defi ned
reporting period;
• statements of commitment to,
or intention to, undertake action
in the future;
• statements of opinion, belief
and/or aspiration.
Our assurance does not extend to
the information hyperlinked from
the Report.
Our review was carried out
to provide reasonable, rather
than absolute assurance and
we believe the scope above
provides a reasonable basis for
our conclusions.
This independent statement
of preliminary fi ndings should not
be relied upon to detect all errors,
omissions or misstatements.
Detailed considerations and
limitations are included in the full
statement on www.nestle.com/csv
Our statement of
independence, impartiality and
competence can be found in
the full assurance statement on
www.nestle.com/csv
Bureau Veritas UK Ltd.,
London, February 2009
Independent assurance –Preliminary fi ndings statement
RA_report_58_80_GB.indd 77 3.3.2009 13:59:50

78 Nestlé Management Report 2008
The Nestlé story – all the way to Nutrition, Health and Wellness
In 1866 the American brothers George and Charles Page
founded the Anglo-Swiss Condensed Milk Co. in Cham (the
Canton of Zug in Switzerland), Europe’s fi rst condensed milk
factory, thereby satisfying the need for pure, long-life milk,
especially in the cities. One year later in Vevey (the Canton
of Vaud in Switzerland), Henri Nestlé from Frankfurt am
Main (Germany) developed a baby formula that offered a
safe and more nutritious alternative to other existing breast-
milk substitutes for mothers who were unable to provide
breast milk. At the same time, he could offer convalescent
and elderly people an easily digestible, ready-made food,
which became one of the cornerstones of what is now
Nestlé Nutrition. After many years of tough competition, the
two companies merged in 1905 to form the new company
“Nestlé & Anglo-Swiss Condensed Milk Co.”
The same year also saw the launch of the fi rst Nestlé
branded chocolate which, following years of collaboration,
ultimately led to Nestlé’s takeover of the long-established
Swiss chocolate manufacturer Peter, Cailler and Kohler.
Having previously been active exclusively in the dairy
industry, Nestlé now also had a foothold in confectionery.
The crisis years in the wake of the First World War
prompted Nestlé to restructure. The company streamlined
its organisational structure and also strengthened its organic
growth by focusing on developing new products. The
research department was completely reorganised in the
1930s to this end, allowing for the considerable expansion
of the existing range of milk products and baby foods with
Nestogen in 1930, Sinlac in 1932, Nescao in 1932, Pelargon in
1934 and Milo Tonic in 1934, and the fi rst, initially somewhat
tentative foray (together with Roche) into the pharmaceutical
sector with Nestrovit in 1936, as well as a much more
decisive one into the coffee business with Nescafé in 1938.
The latter has since been marked by constant innovation and
further expansion, most recently with the winning formula of
Nespresso and the successful launch of Nescafé Dolce Gusto
in Europe as well as Nescafé Protect, mainly in Asia.
The challenges faced once the Second World War
was over included integrating Maggi, acquired in 1947.
The founder, Julius Maggi, had been one of the fi rst
entrepreneurs, in 1884, to offer working-class families
affordable, high-protein and quick-to-prepare soup products.
Maggi took Nestlé into the culinary sector.
In the 1960s, external growth via acquisitions accelerated,
facilitating the company’s entry into new areas of the
food industry: canned goods (Crosse & Blackwell 1960,
Libby 1963), ice cream (France Glaces and Jopa 1960,
Delasa 1963), chilled and frozen products (Findus 1962,
Chambourcy 1968) and mineral water (Vittel and
Deer Park 1969).
The 1970s saw Nestlé’s foray into the hospitality and
winemaking industries (Eurest and Cahills 1970, Beringer
1971, Stouffer 1973) – areas that were later resold – whilst
the purchase of Ursina-Franck (1971) expanded the
traditional business. Economic turbulence (oil crises, high
infl ation, strong currency fl uctuations) had an impact on
the growth of the Group, and for the fi rst time signifi cant
moves were made to diversify outside the food industry.
The purchase of a minority stake (now 30%) in the world’s
largest cosmetics company L’Oréal (1974) was followed by
the acquisition of the ophthalmology fi rm Alcon Laboratories
(1977), also world leader in its area, of which about 25%
was fl oated on the New York Stock Exchange in 2002 and
another 25% was sold to Novartis in 2008.
Following a period of consolidation at the beginning
of the 1980s in which the product portfolio was streamlined,
unprofi table areas of the business sold and the fi nancial
basis of the Group improved, Nestlé’s task was to develop
a greater geographical presence and to be the No. 1 in all
areas of activity. In order to strengthen its market share in
the USA, in 1985 Nestlé acquired Carnation, which was
active in the dairy industry, pet food and the catering trade.
In order to improve its position in chocolate and
confectionery, as well as in the culinary sector, Nestlé
bought Rowntree (KitKat, Smarties, After Eight) and Buitoni-
Perugina in 1988. The company created the conditions for
further organic growth by expanding its research capability,
notably by founding the Nestlé Research Center in Lausanne
in 1987, the world’s leading private research institution in the
food and nutrition sectors.
Following the fall of the Berlin Wall and the opening
of previously inaccessible markets, Nestlé’s task in the
1990s was to gain a stronger foothold in Eastern Europe
and Asia. In addition to expanding geographically, Nestlé
focused specifi cally on strengthening the three product
areas promising the best possible opportunities for growth:
water (Perrier 1992, Sanpellegrino 1998, Henniez 2007),
pet food (Alpo 1994, Spillers 1998, Purina 2001) and ice
cream (Finitalgel 1993, Schöller 2002, Mövenpick and
Dreyer’s Grand Ice Cream 2003, Valio 2004, Delta Ice Cream
RA_report_58_80_GB.indd 78 3.3.2009 13:59:50

79The Nestlé story
1866 Anglo-Swiss Condensed Milk Co.
1867 Henri Nestlé’s Infant cereal
1905 Nestlé & Anglo-Swiss Condensed Milk Co.
(New name after merger)
1929 Peter, Cailler, Kohler, Chocolats Suisses S.A.
1938 Nescafé launch
1947 Nestlé Alimentana S.A.
(New name after merger with Maggi)
1960 Crosse & Blackwell
1969 Vittel
1971 Ursina-Franck
1973 Stouffer
1974 L’Oréal (Minority interest)
1977 Nestlé S.A. (new name)
Alcon
1985 Carnation, Friskies
1986 Herta
1988 Buitoni-Perugina, Rowntree
1992 Perrier
1993 Finitalgel
1994 Alpo
1998 Sanpellegrino, Spillers Petfoods
2000 PowerBar
2001 Ralston Purina
2002 Schöller, Chef America
2003 Mövenpick (Ice cream business)
Dreyer’s Grand Ice Cream, Powwow
2004 Valio (Ice cream business)
2005 Wagner, Protéika, Musashi (Nutrition businesses)
2006 Jenny Craig, Uncle Tobys
2007 Novartis Medical Nutrition, Gerber, Henniez
2005). In 2000, the launch of the GLOBE initiative (Global
Business Excellence) with its group-wide, standardised
best practices, data standards and information systems
created the organisational basis for Nestlé’s focused,
strategic transformation into a nutrition, health and wellness
company. Nestlé reinforced its performance nutrition
business with its acquisition of PowerBar in 2000 and
Sporting Sportlernahrung GmbH in 2002. Its subsequent
purchases of Musashi Pty in 2005, Jenny Craig in 2006,
and Novartis Medical Nutrition and Gerber in 2007, also
from Novartis, made Nestlé the world’s leading nutrition
company, with sales of about CHF 109.9 billion in 2008.
During this period, Nestlé also introduced new
organisational structures. Following Nestlé Waters,
which has been run as of 1993 as a globally managed
division, in 2005, the Nestlé Nutrition division was made
an independent entity within the Group with global
responsibility for the areas of infant nutrition, healthcare
nutrition, weight management and performance nutrition.
The existing strategic business unit for out-of-home catering
(FoodServices), Nestlé Professional, will be transformed
into a globally managed business from 2009. These major
changes serve to consolidate the considerable progress
already made and will – together with an acceleration
of internal processes – facilitate further profi table growth.
More information about Nestlé’s history can be found
at www.nestle.com and in the book by Albert Pfi ffner
and Hans-Jörg Renk: “Transformational Challenge. Nestlé
1990-2005”, Nestlé, 2007.
Henri Nestlé
When Henri Nestlé
(1814 to 1890)
developed his Infant
Food, he created
the cornerstone for
the largest Nutrition,
Health and Wellness
Company.
RA_report_58_80_GB.indd 79 3.3.2009 13:59:51
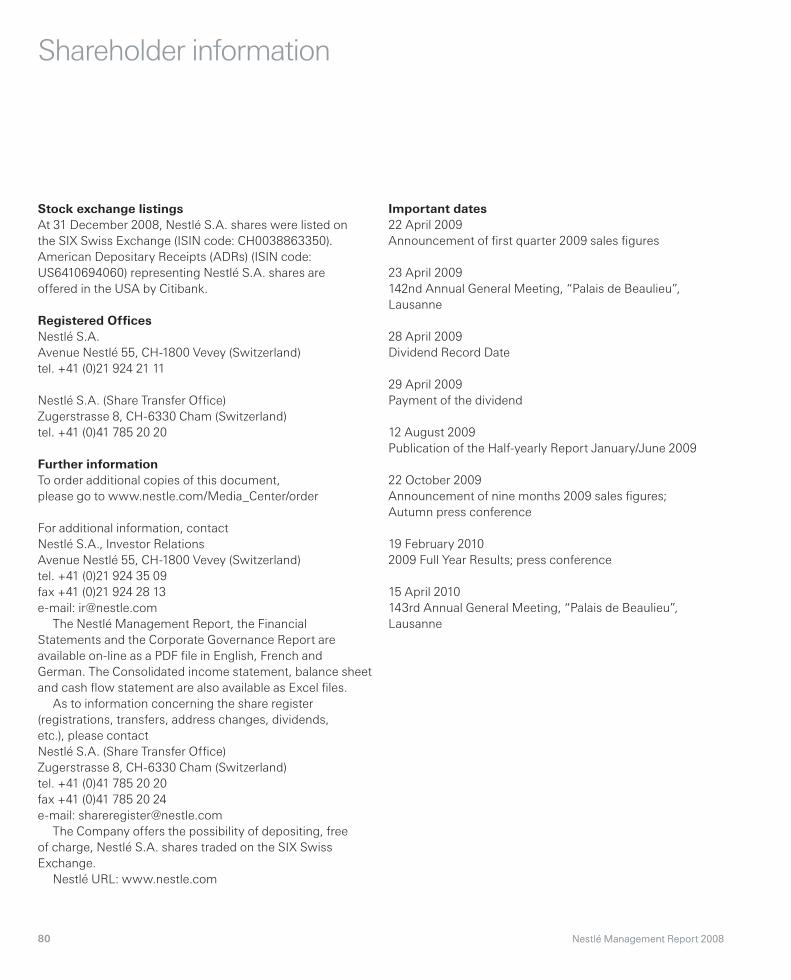
80 Nestlé Management Report 2008Nestlé Management Report 2008
Shareholder information
Stock exchange listings
At 31 December 2008, Nestlé S.A. shares were listed on
the SIX Swiss Exchange (ISIN code: CH0038863350).
American Depositary Receipts (ADRs) (ISIN code:
US6410694060) representing Nestlé S.A. shares are
offered in the USA by Citibank.
Registered Offi ces
Nestlé S.A.
Avenue Nestlé 55, CH-1800 Vevey (Switzerland)
tel. +41 (0)21 924 21 11
Nestlé S.A. (Share Transfer Offi ce)
Zugerstrasse 8, CH-6330 Cham (Switzerland)
tel. +41 (0)41 785 20 20
Further information
To order additional copies of this document,
please go to www.nestle.com/Media_Center/order
For additional information, contact
Nestlé S.A., Investor Relations
Avenue Nestlé 55, CH-1800 Vevey (Switzerland)
tel. +41 (0)21 924 35 09
fax +41 (0)21 924 28 13
e-mail: [email protected]
The Nestlé Management Report, the Financial
Statements and the Corporate Governance Report are
available on-line as a PDF fi le in English, French and
German. The Consolidated income statement, balance sheet
and cash fl ow statement are also available as Excel fi les.
As to information con cern ing the share register
(registrations, transfers, address changes, dividends,
etc.), please contact
Nestlé S.A. (Share Transfer Offi ce)
Zuger strasse 8, CH-6330 Cham (Switzerland)
tel. +41 (0)41 785 20 20
fax +41 (0)41 785 20 24
e-mail: [email protected]
The Company offers the possibility of depositing, free
of charge, Nestlé S.A. shares traded on the SIX Swiss
Exchange.
Nestlé URL: www.nestle.com
Important dates
22 April 2009
Announcement of fi rst quarter 2009 sales fi gures
23 April 2009
142nd Annual General Meeting, “Palais de Beaulieu”,
Lausanne
28 April 2009
Dividend Record Date
29 April 2009
Payment of the dividend
12 August 2009
Publication of the Half-yearly Report January/June 2009
22 October 2009
Announcement of nine months 2009 sales fi gures;
Autumn press conference
19 February 2010
2009 Full Year Results; press conference
15 April 2010
143rd Annual General Meeting, “Palais de Beaulieu”,
Lausanne
RA_report_58_80_GB.indd 80 3.3.2009 13:59:51

Man
ag
em
en
t Rep
ort 2
00
8
The World’s leading Nutrition, Health and Wellness Company
Management Report 2008
© 2009, Nestlé S.A., Cham and Vevey (Switzerland)
The Management Report contains forward looking statements
which refl ect Management’s current views and estimates. The
forward looking statements involve certain risks and uncertainties
that could cause actual results to differ materially from those
contained in the forward looking statements. Potential risks
and uncertainties include such factors as general economic
conditions, foreign exchange fl uctuations, competitive product
and pricing pressures and regulatory developments.
In case of doubt or differences of interpretation, the English
version shall prevail over the French and German text.
Concept and design
Nestec Ltd., SGDU, Corporate Identity & Design,
with messi & schmidt
Photography
Nicole Bachmann, Gaëtan Bally/Keystone, Nathan Beck,
Patrick Brown/Panos Pictures, Markus Bühler-Rasom,
Goh Seng Chong/Keystone, Douglas Engle/Panos Pictures,
Sam Faulkner/NB Pictures, Jonathan Fong, Peter Ginter,
Georgina Goodwin, Marcel Grubenmann, Alain Herzog/EPFL,
Harmen Hoogland/Nestec, Wollodja Jentsch, Marc Latzel,
George Osodi/Panos Pictures, Philippe Prêtre/APG Image,
Sergio Santorio, Qilai Shen/Panos Pictures, Christian Vogt,
Cédric Widmer
Printing
Entreprise d’arts graphiques Jean Genoud SA (Switzerland)
Paper
This report is printed on Consort Royal, a paper produced from
well-managed forests and other controlled sources certifi ed by
the Forest Stewardship Council (FSC)
Table of contents
Letter to our shareholders 2
Board of Directors of Nestlé S.A. 6
Executive Board of Nestlé S.A. 8
Corporate Governance and Compliance 10
Creating Shared Value 12
The 4 x 4 x 4 roadmap 24
Four competitive advantages 26
Four growth drivers 34
Four strategic pillars 42
The 4 x 4 x 4 Nestlé roadmap in action – Chocolate 50
Pharmaceutical and cosmetics activities 56
Financial review 58
Geographic data: people, factories and sales 74
Creating Shared Value – Performance summary and
independent assurance – Preliminary fi ndings statement 76
The Nestlé story –
all the way to Nutrition, Health and Wellness 78
Shareholder information 80
Annexes
Corporate Governance Report 2008
2008 Financial Statements
Accompanying report
Nutritional needs and quality diets – Creating Shared Value Report 2008
The brands in italics are registered
trademarks of the Nestlé Group
Corporate Governance Report 2008
including Compensation Report 2008
2008 Financial Statements
Consolidated Financial Statements of the Nestlé GroupFinancial Statements of Nestlé S.A
Nutritional needs and quality dietsCreating Shared Value Report 2008
RA_report_cover.indd 1 3.3.2009 13:43:13