Embed Size (px)
Citation preview

For The Year Ended July 31, 2008
Management Report of Fund Performance
Covington Venture Fund Inc.Series ISeries IISeries III

M RFP for th e Year En ded July 31, 20081
TABLE OF CONTENTS
Table of Contents ................................................................................................................................................................................................................ 1
Investment Objective and Strategies.......................................................................................................................................................................... 2
Risk Factors ............................................................................................................................................................................................................................. 2
Results of Operations .................................................................................................................................................................................................. 3 - 4
Recent Developments ................................................................................................................................................................................................. 4 - 5
Related Party Transactions ............................................................................................................................................................................................... 5
Financial Highlights ..................................................................................................................................................................................................... 6 - 8
Past Performance ................................................................................................................................................................................................................ 8
Annual Compound Returns ............................................................................................................................................................................................ 9
Summary of Investment Portfolio ........................................................................................................................................................................ 9 - 11
Notes ............................................................................................................................................................................................................................... 12 - 13
Corporate Information..................................................................................................................................................................................................... 14
This annual management report of fund performance contains financial highlights but does not contain the complete annual financial statements of the investment Fund. You can get a copy of the annual financial statements at your request, and at no cost, by calling 1-866-244-4714, by writing to us at Covington Capital Corporation, 200 Front St. West, Suite 3003, Toronto, Ontario M5V 3K2 or by visiting our website at www.covingtonfunds.com or on SEDAR at www.sedar.com.
Shareholders may also contact us using one of these methods to request a copy of the Fund’s proxy voting polices and procedures or proxy voting disclosure record.
M RFP for th e Year En ded July 31, 2008
CLASS A SHARES, SERI ES I , I I , I I I
(in $000’s except for per share amounts, number of shares and percentages)
Covi ngton Venture Fun d Inc.
2
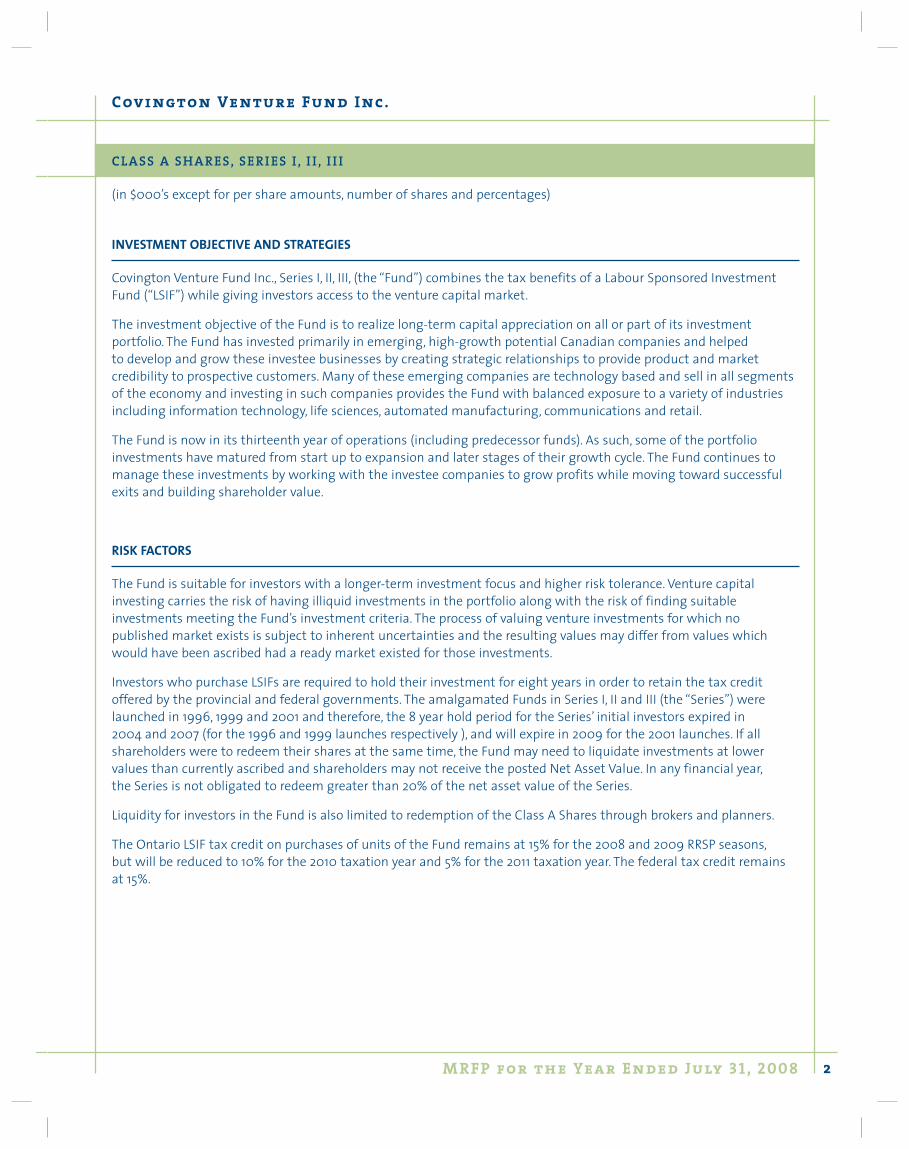
INVESTMENT OBJECTIVE AND STRATEGIES
Covington Venture Fund Inc., Series I, II, III, (the “Fund”) combines the tax benefits of a Labour Sponsored Investment Fund (“LSIF”) while giving investors access to the venture capital market.
The investment objective of the Fund is to realize long-term capital appreciation on all or part of its investment portfolio. The Fund has invested primarily in emerging, high-growth potential Canadian companies and helped to develop and grow these investee businesses by creating strategic relationships to provide product and market credibility to prospective customers. Many of these emerging companies are technology based and sell in all segments of the economy and investing in such companies provides the Fund with balanced exposure to a variety of industries including information technology, life sciences, automated manufacturing, communications and retail.
The Fund is now in its thirteenth year of operations (including predecessor funds). As such, some of the portfolio investments have matured from start up to expansion and later stages of their growth cycle. The Fund continues to manage these investments by working with the investee companies to grow profits while moving toward successful exits and building shareholder value.
RISK FACTORS
The Fund is suitable for investors with a longer-term investment focus and higher risk tolerance. Venture capital investing carries the risk of having illiquid investments in the portfolio along with the risk of finding suitable investments meeting the Fund’s investment criteria. The process of valuing venture investments for which no published market exists is subject to inherent uncertainties and the resulting values may differ from values which would have been ascribed had a ready market existed for those investments.
Investors who purchase LSIFs are required to hold their investment for eight years in order to retain the tax credit offered by the provincial and federal governments. The amalgamated Funds in Series I, II and III (the “Series”) were launched in 1996, 1999 and 2001 and therefore, the 8 year hold period for the Series’ initial investors expired in 2004 and 2007 (for the 1996 and 1999 launches respectively ), and will expire in 2009 for the 2001 launches. If all shareholders were to redeem their shares at the same time, the Fund may need to liquidate investments at lower values than currently ascribed and shareholders may not receive the posted Net Asset Value. In any financial year, the Series is not obligated to redeem greater than 20% of the net asset value of the Series.
Liquidity for investors in the Fund is also limited to redemption of the Class A Shares through brokers and planners.
The Ontario LSIF tax credit on purchases of units of the Fund remains at 15% for the 2008 and 2009 RRSP seasons, but will be reduced to 10% for the 2010 taxation year and 5% for the 2011 taxation year. The federal tax credit remains at 15%.

M RFP for th e Year En ded July 31, 2008
CLASS A SHARES, SERI ES I , I I , I I I
(in $000’s except for per share amounts, number of shares and percentages)
Covi ngton Venture Fun d Inc.
3
RESULTS OF OPERATIONS
The consolidated net assets of the Fund for the year ended July 31, 2008 was $86,225*. This represents a decline of $15,036 from $101,261 at July 31, 2007. The overall decrease in net assets is due primarily to net redemptions of $21,495 and a net loss of $10,484, offset by realized gains of $15, 679 and unrealized gains of $1,442 which were offset by positive net results of operations of $6,637.
The Fund realized $15,679 in gains on sale of investments during the year. Of this, $15,888 relates to gains on the venture portfolio offset by a realized loss of $209 on marketable securities. The Fund sold its holdings in the following investments during the year:
Cloakware Inc. Firsthand Technologies Inc.PlateSpin Ltd. Golf Town Income FundVentus Energy Inc. Bioscrypt Inc.Encelium Technologies Inc. Photo-Thermal Diagnostics Inc.Halogen Software Inc.
In addition, the Fund made $21,489 in new and follow-on investments. New companies to the portfolio include:
Mo Products Inc. Bedlam Games Inc.NeoEdge Networks Inc. Powerband Canada Inc.Signal Hill Equity Partners II, LP New Carbon Economy Venture Management Inc.Counterpath Corporation
Each of Series I, II and III are identical to one another in that they share a common pool of assets. The differences between the series relate only to how commissions and trailer fees are charged. Series I has been closed to new subscriptions since December 2003 and pays a service fee to registered dealers of 0.5% of NAV annually. Series II pays dealers a 10% commission at time of issue but does not pay any service fees before the eighth anniversary of date of issue while Series III pays dealers a 6% commission at time of issue and a service fee of 0.5% of net asset value on an annual basis. As such, the results of operations of $0.72/share for Series I, $0.59/share for Series II and $0.67/share for Series III relate only to the impact of the different dealer compensation structures on the Series.
Redemptions during this fiscal year were up by $16,216 over the same period in 2007 and are due to the large number of Class A shares which became eligible for redemption. Shareholders who purchased units in the predecessor funds to the Series in the 1999-2000 RSP season were eligible to redeem their shares in early 2008.
Investment Performance
In March, 2008, one of the Fund’s key holdings, PlateSpin Ltd., was acquired by Novell Inc. in a transaction worth $205 Million US. CVF held a significant share of the PlateSpin investment within Series I, II, III, and in Series IV which held an investment in the company through two of its wholly-owned CSBIFs. This transaction represented a key win for the Fund and resulted in a realized gain of $4,351. This helped to bolster the Fund’s 1 year returns at July 31, 2008 to 6.94%, 5.47% and 6.4% for Series I through III respectively, which is well ahead of the returns for the same period for the BMO Nesbitt Burns Canadian Small Cap Index of -17.02% and the Retail Venture Capital Index of -6.65% as posted on globefund.com.

M RFP for th e Year En ded July 31, 2008
CLASS A SHARES, SERI ES I , I I , I I I
(in $000’s except for per share amounts, number of shares and percentages)
Covi ngton Venture Fun d Inc.
4
Other notable exits include the sale of the Fund’s holding in Ventus Energy to Suez Canada Acquisition Corp., an affiliate of Suez Energy North America Inc. for $5.21/share; and Cloakware Inc., which was acquired by Irdeto, a software company based in the Netherlands.
The Series MER is 13.16%, 16.04% and 14.9% for Series I, II and III respectively, which has increased substantially over the prior year. Excluding the IPA, the MER for Series I, II and III would be 5.23%, 7.84%, and 7.43% respectively.
The Manager is entitled to an incentive participation amount (the “IPA”) based on the performance of CVF Class A Shares Series I, II, III since July 31, 2007 as disclosed in the Fund’s annual prospectus. For the year ended July 31, 2008, the Manager has recorded IPA of $7,408 of which $4,351 has been realized. There is a contingent liability of $3,057 for IPA based on what would be payable to the Manager if the venture portfolio were disposed of at its year-end carrying value. As at July 31, 2008, the conditions to pay the contingent IPA have not been met. As such, the MER has increased substantially over the prior year, since no IPA was recorded in 2007.
Covington Venture Fund Inc. is registered as a labour-sponsored investment fund corporation (“LSIF”) under the Community Small Business Investment Funds Act (Ontario) (the “Ontario Act”) and is a prescribed labour-sponsored venture capital corporation under the Income Tax Act (Canada) (the “Tax Act”). These acts set levels of qualifying venture investments required to be made by the Fund as a whole. If the required minimum level of qualifying venture investments is not met under each statute, the Fund will be subject to defined taxes and penalties. As at July 31, 2008, the Fund and therefore, Series I, II and III are in compliance with these requirements.
* On August 1, 2007, the Series adopted CICA Section3855 on a retrospective basis with out restatement of prior periods – see “Recent Developments”. As such, the opening balances of net assets many not equal the July 31, 2007 closing net assets.
RECENT DEVELOPMENTS
Adoption of new accounting standards
The Canadian Institute of Chartered Accountants (“CICA”) has issued section 3855, “Financial Instruments – Recognition and Measurement” effective for interim and annual financial statements relating to fiscal years beginning on or after October 1, 2006. This section sets out standards for the fair valuation of investments and the way transaction costs are recorded for financial reporting purposes. Specifically, it stipulates that the fair value of financial instruments which are traded in active markets be measured based on the bid price for long securities and the ask price for securities sold short.
National Instrument 81-106 (“NI 81-106”), which governs continuous disclosure requirements for investment funds, requires the Fund’s financial statements to be prepared in accordance with Canadian GAAP. While Section 3855 defines specific measurement parameters for fair valuation of financial instruments which are traded in active markets, NI 81-106 allows daily net asset values of investment funds to be calculated using the fair value of the fund’s assets and liabilities. The valuation rules and techniques used by the Fund are in accordance with the Fund’s prospectus but are not necessarily in accordance with Section 3855. NI 81-106 has been amended to allow the daily Net Asset Value (“NAV”) of an investment fund to be calculated in a manner that is not in accordance with Canadian GAAP for other than financial statement purposes. The adoption of Section 3855 therefore, results in a different valuation method for determining the Fund’s net assets as described in the Fund’s valuation methodologies in Note 2 to the financial statements. Consequently, the Fund has applied section 3855 for financial statement reporting purposes only.
M RFP for th e Year En ded July 31, 2008
CLASS A SHARES, SERI ES I , I I , I I I
(in $000’s except for per share amounts, number of shares and percentages)
Covi ngton Venture Fun d Inc.
5
RECENT DEVELOPMENTS (Continued)
A reconciliation between the net asset value calculated in accordance with GAAP (referred to as “Net Assets” or “net assets for GAAP purposes”) and the price used for subscriptions and redemptions (referred to as “Net Asset Value” or “net assets for pricing purposes”) is provided in Note 3 to the financial statements.
Independent Review Committee
National Instrument 81-107 Independent Review Committee for Investment Funds (“NI 81-107”), came into force on November 1, 2006. NI 81-107 requires all publicly offered investment funds, such as the Fund, to establish an independent review committee (the “IRC” or the “Independent Review Committee”). The manager must refer certain conflict of interest matters between the Fund and its manager for review or approval to the IRC. NI 81-107 also imposes obligations upon the manager to establish written policies and procedures for dealing with conflict of interest matters, to maintain records, in respect of these matters and to provide the IRC with guidance and assistance in carrying out its functions and duties. According to NI 81-107, the IRC must be comprised of a minimum of three independent members, and is required to conduct regular assessments of its members and to provide reports, at least annually, to the Fund and to its shareholders in respect of those functions. The Fund’s IRC commenced operations October 11, 2007 and the report prepared by the Fund will be available, in November 2008, on the Fund’s website www.covingtonfunds.com, or at a shareholders’ request at no cost, by contacting the Fund at 200 Front Street W., Suite 3003, P.O. Box 10, Toronto, Ontario M5V 3K2 or at [email protected].
RELATED PARTY TRANSACTIONS
The Fund Manager and Advisor, the Sponsor, and the Transfer Agent and Registrar are deemed to be related parties. Please refer to the section titled “Management Fees” which outlines the fees paid to these related parties.

M RFP for th e Year En ded July 31, 2008
CLASS A SHARES, SERI ES I , I I , I I I
(in $000’s except for per share amounts, number of shares and percentages)
Covi ngton Venture Fun d Inc.
6
FINANCIAL HIGHLIGHTS
The following tables show selected key financial information about the Fund and are intended to help you understand the Fund’s financial performance.
All references to “net assets” or “net assets per share” are determined in accordance with Canadian GAAP as presented in the audited financial statements of the Series. All references to “net asset value” or “net asset value per share” are determined in accordance with the net asset value calculated for pricing purposes.
THE FUND’S NET ASSETS PER SHARE
Year ended July 31, 2008 Year ended July 31, 2007 Year ended July 31, 2006 (3)
Series I Series II Series III Series I Series II Series III Series I Series II Series III Net assets, beginning of year (1) $ 10.09 $ 10.21 $ 10.27 $ 9.27 $ 9.64 $ 9.69 $ 9.49 $ 10.00 $ 10.00
Increase (decrease) from operations: Total revenue 0.20 0.22 0.21 0.19 0.21 0.20 0.09 0.09 0.09Total expenses (1.33) (1.65) (1.55) (0.49) (0.63) (0.60) (0.38) (0.52) (0.48)Realized and unrealized gains (losses) on investments (0.81) 2.15 2.17 1.11 1.12 1.15 0.08 0.08 0.08Total increase (decrease) from operations (2) 0.72 0.72 0.83 0.81 0.70 0.75 (0.21) (0.35) (0.31)Net assets, end of year (1) $ 10.90 $ 10.90 $ 11.09 $ 10.10 $ 10.36 $ 10.45 $ 9.27 $ 9.64 $ 9.69
(1) This information is derived from the Series’ audited annual financial statements. The net assets per security presented in the financial statements differs from the asset value calculated for fund pricing purposes. On August 1, 2007, the Series’ adopted CICA Section 3855 on a retrospective basis without restatement of prior periods. As such, the beginning balance of net assets per share for the year ended July 31, 2008 may not equal the closing balance on July 31, 2007.
(2) Net assets are based on the actual number of shares outstanding as at the stated year-end. The increase/(decrease) from operations is based on the weighted average number of shares outstanding over the fiscal period.
(3) For the period from January 6 to July 31, 2006.

M RFP for th e Year En ded July 31, 2008
CLASS A SHARES, SERI ES I , I I , I I I
(in $000’s except for per share amounts, number of shares and percentages)
Covi ngton Venture Fun d Inc.
FINANCIAL HIGHLIGHTS (Continued)
RATIOS AND SUPPLEMENTAL DATA
Year ended July 31, 2008 Year ended July 31, 2007 Year ended July 31, 2006 (5)
Series I Series II Series III Series I Series II Series III Series I Series II Series III Net asset value (1) $ 84,016 $ 664 $ 1,773 $ 99,007 $ 602 $ 1,652 $ 96,110 $ 569 $ 1,549Number of shares outstanding (1) 7,690,449 60,757 159,478 9,801,107 58,139 158,091 10,365,400 58,995 159,847Management expense ratio (2)* 13.16% 16.04% 14.90% 5.24% 6.70% 6.35% 6.82% 9.39% 8.37%Portfolio turnover rate (3) 26.01% 26.01% 26.01% 35.33% 35.33% 35.33% 4.15% 4.15% 4.15%Trading expense ratio (4) - - - - - - - - -Closing net asset value per share (1) $ 10.92 $ 10.93 $ 11.12 $ 10.21 $ 10.36 $ 10.45 $ 9.64 $ 9.64 $ 9.69
* The management expense ratio before contingent IPA was 5.23%, 7.84% and 7.43% for Series I, II and III respectively for the year-ended July 31, 2008.
(1) This information is provided as at July 31 of the year shown.
(2) Management expense ratio includes all fees, expenses, capital taxes, Goods and Services Tax, and the Manager’s contingent Incentive Participation Amount (“IPA”), and excludes commissions and transaction costs; and is expressed as annualized percentage of the average net assets administered during the year. Contingent IPA is the determination of the bonus that would be payable to the Manager if the Series’ were to dispose of its venture investment at its carrying value as at July 31 in the year shown. The Manger is entitled to this bonus only upon realization of certain conditions as outlined in the Fund’s prospectus.
(3) The Fund’s portfolio turnover rate indicates how active the Fund’s portfolio advisor manages its portfolio investments. A portfolio turnover rate of 100% is equivalent to the Fund buying and selling all of the securities in its portfolio once in the course of the period. The higher a fund’s portfolio turnover rate in a period, the greater the trading costs payable by the fund in the period, and the greater the chance of an investors receiving taxable capital gains in the period. There is not necessarily a relationship between a high turnover rate and the performance of a Series.
(4) The trading expense ratio represents total commissions and other portfolio transaction costs expressed as an annualized percentage of daily average net assets during the period.
(5) For the period January 6 to July 31, 2006.
Management Fees
The Series’ management expense ratio (“MER”) consists of all of its operating expenses, including sales commissions, certain ongoing marketing costs of the Series, audit and legal expenses, fees paid to any independent valuator, certain consultancy costs. The largest component of the MER are fees that are calculated as a percentage of the Net Asset Value of the Series and these fees are the Management fees, the Dealer Services fees, the Sponsor’s fees, the Transfer Agent’s fees, and the Distribution Services fees.
7

M RFP for th e Year En ded July 31, 2008
CLASS A SHARES, SERI ES I , I I , I I I
(in $000’s except for per share amounts, number of shares and percentages)
Covi ngton Venture Fun d Inc.
8
Highlights of the key components of the Fund’s MER are listed in the table below:
Year ended Year ended July 31, 2008 July 31, 2007Description - % of NAV $ $
Manager - annual rate of 2.5% 2,391 2,267 Transfer agent fee - annual rate of 0.6% 557 946 Dealer service fee, Series I and III - annual rate of 0.5% 473 460 Sponsor - annual rate of 0.25% 234 231 Distribution service fees, Series II and III, annual rate 1.92% and 1.152% of original issue price of Class A Shares 36 29
The Manager is responsible for directing the business, operations and affairs of the Series and also responsible for implementing the investment strategy, monitoring the Series’ investments and providing management assistance to portfolio companies. Because the portfolio companies of the Series are generally small in size and in an earlier stage of development relative to conventional mutual funds, the Series requires a greater level of management involvement in the analysis, monitoring support and development activities. The Manager uses its management fees to finance its general and administrative expenses.
PAST PERFORMANCE
The performance information shown does not take into account sales, redemption, distribution or other optional charges that would have reduced returns on performance. The Series’ past performance is no guarantee of how it will perform in the future.
Year by Year Non-Cumulative Returns
The following charts show how the performance of each series of Class A Shares of the Series has varied for the year ended July 31. It also shows, in percentage terms, how an investment made in the Series would have increased or decreased over the Series’ reporting period.

M RFP for th e Year En ded July 31, 2008
CLASS A SHARES, SERI ES I , I I , I I I
(in $000’s except for per share amounts, number of shares and percentages)
Covi ngton Venture Fun d Inc.
ANNUAL COMPOUND RETURNS
The table below summarizes the Fund’s past performance for the five, three and one year periods ended July 31 of the periods indicated. As a basis of comparison, we have provided the Retail Venture Capital Index as posted on www.globefund.com as of July 31, 2008.
The Retail Venture Capital Peer Index is the most representative broad-based securities market index as it accumulates all the Ontario based LSIF’s.
BMO Retail Venture Nesbitt Burns Capital Peer Cdn Small CapCompound Returns Series I Series II Series III Index* Index**
1 Year 6.95% 5.50% 6.41% -6.65% -17.02%3 Years N/A N/A N/A -0.74% 6.24%5 Years N/A N/A N/A -0.13% 13.45%Since Inception 3.49% 3.52% 4.22% *** ***
* Source: globefund.com
** The inclusion of the BMO Nesbitt Burns Cdn Small Cap Index is only intended to give perspective to general market activity.
*** This has not been included because there is no comparable index quotation for the same period.
SUMMARY OF INVESTMENT PORTFOLIO
Below is a summary of the Fund’s portfolio as at July 31, 2008. This is a summary only and may change due to on-going portfolio activity in the Fund. An update is available quarterly on Covington’s website at www.covingtonfunds.com Debt at cost Equity at cost Total at cost $ $ $ 1293551 Ontario Inc. - 2,467 2,467 6700951 Canada Inc. - 3,030 3,030 Adventus Bioremediation Technologies - 1,292 1,292 Agile Systems Inc. - 6,555 6,555 Alchemix Energy Corporation - 250 250 Bedlam Games Inc. 3,000 - 3,000 Black Bull Resources Inc. - 775 775
9

M RFP for th e Year En ded July 31, 2008
CLASS A SHARES, SERI ES I , I I , I I I
(in $000’s except for per share amounts, number of shares and percentages)
Covi ngton Venture Fun d Inc.
Debt at cost Equity at cost Total at cost $ $ $ Bridgewater Systems Corporation - 4,272 4,272 BTE Technologies Inc. 349 1,431 1,780 Business Propulsion Systems Inc. 4,541 995 5,536 Claymore Capital Management Inc. 3,920 - 3,920 CounterPath Corporation - 5,507 5,507 Cyence International Inc. 2,018 - 2,018 Diaphonics Inc. 2,013 - 2,013 Enerworks Inc. 350 1,558 1,908 Firan Technology Group Corporation - 4,438 4,438 Greenarm Development Partners Inc. 25 - 25 Iron Bridge Partners I, LP - 856 856 Ivey Robarts CSBIF I - 550 550 Ivey Robarts CSBIF II - 550 550 Mist Mobility Integrated System Technology Inc. 3,100 2,300 5,400 Mo Products Inc. 1,125 - 1,125 MP Western Properties Inc. - 7 7 NeoEdge Networks, Inc. 343 647 990 New Carbon Economy Venture Management Inc. 2,350 150 2,500 Oxegen Incorporated 558 541 1,099 PowerBand Canada Inc. - 850 850 PrinterOn Corporation - 4,304 4,304 Protus IP Solutions Inc. - 2,129 2,129 Realex Properties Corp. - - -Rtica Corporation 1,174 205 1,379 RuggedCom Inc. - 8,786 8,786 Signal Hill Equity Partners II, LP - 40 40 SimEx Inc. - 59 59 Software Innovation Inc. 1,685 100 1,785 Soliton Inc. - - -Toxin Alert Inc. - 510 510 Tropic Networks Inc. - 4,559 4,559 Trilliant Inc. - 831 831 YM Biosciences Inc. - 2,385 2,385 Zoom And Go Services Inc. - - - 26,551 62,929 89,480
10

M RFP for th e Year En ded July 31, 2008
CLASS A SHARES, SERI ES I , I I , I I I
(in $000’s except for per share amounts, number of shares and percentages)
Covi ngton Venture Fun d Inc.
SUMMARY OF INVESTMENT PORTFOLIO (Continued)
% Total Venture % Total Venture Number of Cost of Investments Fair Value of Investments Companies Investments at Cost Investments at Fair Value $ % $ % Stage of DevelopmentStart-Up / Early 15 17,455 19.5 14,687 20.6Expansion 17 45,289 50.6 36,056 50.7Later 12 26,736 29.9 20,387 28.7 44 89,480 100.0 71,130 100.0 Industry ClassEntertainment/Retail 3 4,214 4.7 6,155 8.7Health Sciences 3 4,675 5.2 1,896 2.7Financial Services 8 12,926 14.4 13,260 18.6Technology 25 53,126 59.4 43,909 61.7Manufacturing 5 14,539 16.3 5,909 8.3 44 89,480 100.0 71,130 100.0 Fair Value of % of Net Investments Asset ValueComposition of Net Assets $ %
Marketable securities 12,297 14.3Venture investments 71,130 82.5Other assets, net of liabilities 2,798 3.2Net assets, at fair value 86,225 100.0
11
M RFP for th e Year En ded July 31, 2008
Covi ngton Venture Fun d Inc.
NOTES
12

M RFP for th e Year En ded July 31, 2008
Covi ngton Venture Fun d Inc.
NOTES
13
M RFP for th e Year En ded July 31, 2008
Covi ngton Venture Fun d Inc.
CORPORATE I N FORMATION
14
Fund Symbols
Series I CIG987Series II CIG988Series III CIG989
Fund Manager
Covington Capital Corporation200 Front Street West, Suite 3003Toronto, ON M5V 3K2
Sponsor
Canadian Federal Pilots Association350 Sparks Street, Suite 400Ottawa, ON K1R 7S8
Auditor
Ernst & Young LLPErnst & Young TowerP.O. Box 251Toronto-Dominion CentreToronto, ON M5K 1J7
Transfer Agent and Registrar
CI Investments Inc.151 Yonge Street, 8th FloorToronto, ON M5C 2W7Customer Service: 1 888 746 4751
Legal Counsel
Gowling Lafleur Henderson LLPSuite 16001 First Canadian Place100 King Street WestToronto, ON M5X 1G5
200 Front Street WestSuite 3003Toronto, ON M5V 3K2Telephone: 416 365 0060Facsimile: 416 365 9822Email: [email protected]: www.covingtonfunds.com
SKU CGOF 1065A 10/08