Embed Size (px)
Citation preview


1
MANAGEMENT PLAN FOR THE SOUTH AUSTRALIAN COMMERCIAL ABALONE FISHERY
Approved by the Minister for Agriculture, Food and Fisheries pursuant to section 44 of the Fisheries Management Act 2007. Hon Gail Gago MLC 1 September 2012

2
PIRSA Fisheries & Aquaculture (A Division of Primary Industries and Regions South Australia) GPO Box 1625 ADELAIDE SA 5001 www.pir.sa.gov.au/fisheries
Tel: (08) 8226 0900 Fax: (08) 8226 0434
© Primary Industries and Regions South Australia 2012
Front cover image courtesy of Ben Stobart
Disclaimer: This management plan has been prepared pursuant to the Fisheries Management Act 2007 (South Australia) for the purpose of the administration of that Act. The Department of Primary Industries and Regions SA (and the Government of South Australia) make no representation, express or implied, as to the accuracy or completeness of the information contained in this management plan or as to the suitability of that information for any particular purpose. Use of or reliance upon information contained in this management plan is at the sole risk of the user in all things and the Department of Primary Industries and Regions SA (and the Government of South Australia) disclaim any responsibility for that use or reliance and any liability to the user. Copyright Notice: This work is copyright. Copyright in this work is owned by the Government of South Australia. Apart from any use permitted under the Copyright Act 1968 (Commonwealth), no part of this work may be reproduced by any process without written permission of the Government of South Australia. Requests and enquiries concerning reproduction of this work should be addressed to the Chief Executive, Department of Primary Industries and Regions SA, 25 Grenfell Street, Adelaide, SA, 5000 (marked attention Executive Director, Fisheries and Aquaculture Division).
The South Australian Fisheries Management Series Paper number 60: Management Plan for the South Australian Commercial Abalone Fishery ISBN 978-0-9807387-5-9 ISSN 1322-8072

3
CONTENTS
1 FISHERY TO WHICH THIS PLAN APPLIES ....................................................... 8
2 CONSISTENCY WITH OTHER MANAGEMENT PLANS ..................................... 8
3 TERM OF PLAN ................................................................................................... 9
4 DESCRIPTION OF FISHERY ............................................................................... 9
4.1 Historical overview ........................................................................................ 9 4.2 Ecosystem and habitat .................................................................................11 4.3 Biology of key species .................................................................................11 4.4 Current biological status of abalone in South Australia ................................14 4.5 Economic characteristics .............................................................................15 4.6 Social characteristics ...................................................................................25
5 CO-MANAGEMENT ARRANGEMENTS .............................................................28
6 ALLOCATION OF ACCESS AMONG SECTORS ...............................................29
6.1 Current allocated shares of the resource .....................................................29 6.2 Sectors of the South Australian Abalone Fishery .........................................29 6.3 Information used to allocate shares .............................................................30 6.4 Review of allocations ...................................................................................31 6.5 Method for adjusting allocations of access in future .....................................31
7 ECOSYSTEM IMPACTS .....................................................................................32
7.1 Policy drivers ...............................................................................................32
8 GOALS AND OBJECTIVES ................................................................................34
8.1 Goal 1 – Ensure the abalone resource is sustainably harvested ..................34 8.2 Goal 2 – Optimum economic utilisation and equitable distribution of the abalone resource .....................................................................................................35 8.3 Goal 3 – Minimise impacts on the ecosystem ..............................................35 8.4 Goal 4 – Cost effective and participative management of the fishery ...........36
9 HARVEST STRATEGY .......................................................................................41
9.1 Management Implications of abalone fisheries ecology ...............................41 9.2 Principles of the abalone harvest strategy ....................................................41 9.3 Spatial scale of fishery management ...........................................................41 9.4 Framework for annual decision-making process ..........................................42
10 EXPLORATORY AND DEVELOPMENT FISHING .............................................52
10.1 Permits for research fishing .........................................................................52 10.2 Exploratory and development fishing ...........................................................52
11 STOCK ASSESSMENT AND RESEARCH .........................................................53
11.1 Research services .......................................................................................53 11.2 Data collection and analysis .........................................................................53 11.3 Reporting .....................................................................................................54 11.4 Strategic research plan ................................................................................55
12 COMPLIANCE AND MONITORING ....................................................................57
12.1 Objectives ....................................................................................................57 12.2 Cost recovery ...............................................................................................57 12.3 Planning .......................................................................................................57

4
12.4 Compliance status report ............................................................................ 58
13 REGULATORY ARRANGEMENTS ................................................................... 59
13.1 Licensing..................................................................................................... 59 13.2 Current management arrangements ........................................................... 60 13.3 Fish processing ........................................................................................... 61
14 REVIEW OF PLAN ............................................................................................. 62
14.1 Section 49—Review of management plans ................................................. 62
15 RESOURCES REQUIRED TO IMPLEMENT THE PLAN ................................... 63
15.1 Cost recovery - overview ............................................................................. 63 15.2 Cost recovery – South Australian commercial Abalone Fishery .................. 63
16 REFERENCES ................................................................................................... 64
17 GLOSSARY ....................................................................................................... 67
18 ACRONYMS....................................................................................................... 75
19 APPENDICES .................................................................................................... 76
19.1 Appendix 1 – Methodology of esd risk assessment. .................................... 76 19.2 Appendix 2 – Overveiw of the SOuth Australian Abalone Fishery Ecological Risk Assessment. ................................................................................................... 82 19.3 Appendix 3 – Spatial assessment of the South Australian commercial Abalone Fishery. .................................................................................................... 85 19.4 Appendix 4 – An example of a spreadsheet used to apply the harvest strategy to determine the TACC for each class of abalone#. ................................... 89

5
LIST OF FIGURES Fig. 1 Map of South Australia showing the three fishery management zones of the
South Australian commercial Abalone Fishery. ...................................................... 8
Fig. 2 Total commercial catch (in shell weight) of abalone landed state-wide in South
Australia and within the three fishery management zones from 1968 to 2010.
The green bars represent the catch in Greenlip Abalone while the black bars
represent the Blacklip Abalone catch. ................................................................... 14
Fig. 3 Average income per licence holder in the South Australian commercial Abalone
Fishery from 1997/98 to 2009/10 (source: EconSearch 2011). ............................. 16
Fig. 4 Cost shares in the South Australian commercial Abalone Fishery from 1997/98
to 2009/10 (source: EconSearch 2011). .................................................................. 17
Fig. 5 Management fee per licence holder and as a proportion of Gross Value of
Production (GVP) for the South Australian commercial Abalone Fishery from
1997/98 to 2009/10 (source: EconSearch 2011). .................................................... 17
Fig. 6 Average total costs in the South Australian commercial Abalone Fishery from
1997/98 to 2009/10 (source: EconSearch 2011). .................................................... 18
Fig. 7 Price and cost indices for the South Australian commercial Abalone Fishery
from 1997/98 to 2009/10 (in this figure the year 1997/98 = 100; source:
EconSearch 2011). .................................................................................................... 19
Fig. 8 Exchange rate of United States dollar (USD) and abalone price from 1997/98 to
2009/10 (source: EconSearch 2011)........................................................................ 19
Fig. 9 Average income and profit per boat in the South Australian commercial
Abalone Fishery from 1997/98 to 2009/10 (source: EconSearch 2011). .............. 20
Fig. 10 Return on investment in the South Australian commercial Abalone Fishery from
1997/98 to 2009/10 (source: EconSearch 2011). .................................................... 21
Fig. 11 Total gross state product, output and household income impact of the South
Australian commercial Abalone Fishery on the South Australian economy from
1997/98 to 2009/10 (source: EconSearch 2011). .................................................... 21
Fig. 12 Total direct and indirect employment impact of the South Australian
commercial Abalone Fishery on the economy from 1997/98 to 2009/10 (Source:
EconSearch 2011). .................................................................................................... 22
Fig. 13 Economic rent (expressed in nominal terms) in the South Australian
commercial Abalone Fishery from 1997/98 to 2009/10 ($’000) (source:
EconSearch 2011). .................................................................................................... 22
Fig. 14 Economic rent as a proportion of GVP in the South Australian commercial
Abalone Fishery from 1997/98 to 2009/10 (source: EconSearch 2011). .............. 23
Fig. 15 Aggregate value of licences and return to capital in the South Australian
commercial Abalone Fishery from 1997/98 to 2009/10 (source EconSearch
2011)a. ......................................................................................................................... 24

6
Fig. 16 The three main components of the abalone harvest strategy. Abbreviations:
SAUs, spatial assessment units; PIs, performance indicators; TACC, total
allowable commercial catch. ................................................................................... 43
Fig. 17 An example for determining relative importance of each SAU. Note: each SAU
is ranked twice, once for Greenlip Abalone and once for Blacklip Abalone. ..... 45
Fig. 18 Schematic showing the reference period (grey bars) and associated reference
points, the year being assessed (orange bar), and the scores applied to
measure fishery performance. ULRP, UTRP, LTRP and LLRP refer to upper limit
reference point, upper target reference point, lower trigger reference point and
lower target reference point, respectively. ............................................................. 46
Fig. 19 Histograms showing the probability distributions of obtaining total scores
across (a) 6 performance indicators (PIs) for spatial assessment units (SAUs) of
high importance and (b) 3 PIs for SAUs of medium importance (distribution
generated by Monte Carlo simulations, n = 5000). The numbers next to the bars
indicate the probability (as a %) of obtaining that total score by chance alone. 48
Fig. 20 Summary of the Ecologically Sustainable Development (ESD) reporting
framework processes (source: ESD Reporting How To Guide; Fletcher et al.
2002). .......................................................................................................................... 78
Fig. 21 South Australian commercial Abalone Fishery Component Tree Structure (for
General Ecosystem Effects of the Fishery). ........................................................... 79

7
LIST OF TABLES Table 1 A chronology of important management changes in the South Australian
commercial Abalone Fishery since its inception in 1964. .................................... 10
Table 2 Total catch and value of abalone landed state-wide in South Australia and
within the three fishery management zones from 1990/91 to 2009/10 (source:
EconSearch 2011). .................................................................................................... 15
Table 3 Abalone exports from South Australia, by country of destination from 2007/08
to 2009/10 (source: unpublished ABS data).a ........................................................ 25
Table 4 The economic impact of the South Australian commercial Abalone Fishery in
the Eyre/Western region for 2009/10 (source: Econseach 2011).abc
.................... 26
Table 5 Average annual local investment expenditures by licence holders in the South
Australian commercial Abalone Fishery from 2003/04 to 2007/08 (source:
EconSearch 2011). .................................................................................................... 27
Table 6 Shares of abalone species allocated to each fishing sector ............................... 29
Table 7 Summary of moderate or higher risks identified in the South Australian
commercial Abalone Fishery ESD risk assessment (all risks to the fishery are
presented in Appendix 2) ......................................................................................... 33
Table 8 Goals, objectives and strategies for the management of the South Australian
commercial Abalone Fishery. .................................................................................. 37
Table 9 Range of harvest decision rules in relation to the risk of overfishing identified
by the scientific assessment. .................................................................................. 50
Table 10 Proposed monitoring and reporting schedule for the research underpinning the
South Australian commercial Abalone Fishery by fishery management zone and
species for the 2012/13 to 2015/16 financial years.a ............................................. 56
Table 11 Summary of management measures for the commercial sector of the South
Australian commercial Abalone Fishery in 2011*. ................................................ 60
Table 12 Summary of management measures for the recreational sector of the South
Australian Abalone Fishery. .................................................................................... 61
Table 13 Annual schedule for cost recovery in relation to commercial fisheries includes
the following key dates. ........................................................................................... 63
Table 14 Primary Ecologically Sustainable Development (ESD) Components. ................ 77
Table 15 Risk ranking definitions and suggested reporting outcomes ............................. 80
8
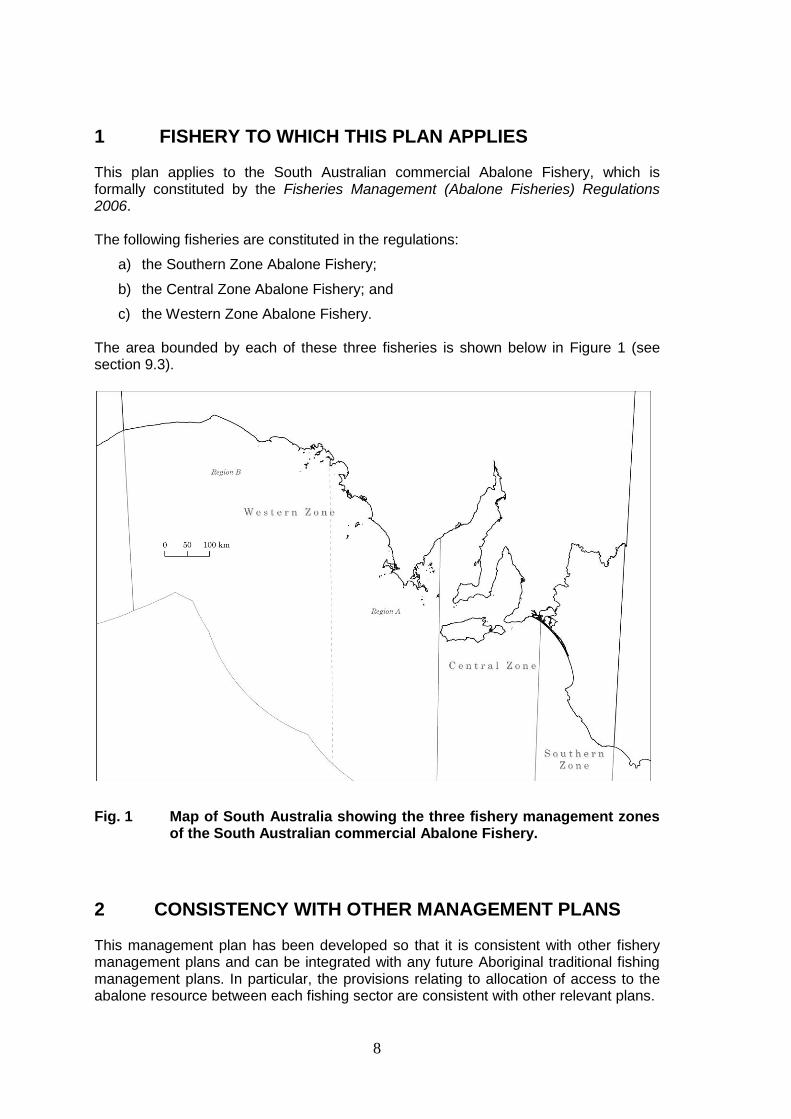
1 FISHERY TO WHICH THIS PLAN APPLIES This plan applies to the South Australian commercial Abalone Fishery, which is formally constituted by the Fisheries Management (Abalone Fisheries) Regulations 2006. The following fisheries are constituted in the regulations:
a) the Southern Zone Abalone Fishery;
b) the Central Zone Abalone Fishery; and
c) the Western Zone Abalone Fishery.
The area bounded by each of these three fisheries is shown below in Figure 1 (see section 9.3).
Fig. 1 Map of South Australia showing the three fishery management zones of the South Australian commercial Abalone Fishery.
2 CONSISTENCY WITH OTHER MANAGEMENT PLANS This management plan has been developed so that it is consistent with other fishery management plans and can be integrated with any future Aboriginal traditional fishing management plans. In particular, the provisions relating to allocation of access to the abalone resource between each fishing sector are consistent with other relevant plans.

9
3 TERM OF PLAN This management plan applies from 1 September 2012 for a period of 10 years. A comprehensive review of this management plan for the purpose of determining whether the plan should be amended, replaced or reinstated without amendment, will be undertaken after the fifth anniversary of the commencement of the plan (during 2017; see Section 14). A review on how input from industry is incorporated into the harvest strategy will commence during the 2014/15 financial year.
4 DESCRIPTION OF FISHERY The South Australian commercial Abalone Fishery targets the Blacklip Abalone Haliotis rubra (Leach 1814) and Greenlip Abalone Haliotis laevigata (Donovan 1808). Other species of abalone, such as Haliotis cyclobates, Haliotis scalaris and Haliotis roei, can be taken by the fishery, but as they rarely reach the legal minimum size, they are seldom landed. Abalone divers operate from small boats using hookah gear (a long hose delivering air to the diver from a deck-mounted compressor). Divers harvest abalone by hand with a metal blade known as an ―abalone iron‖ and sometimes use self-propelled cages that provide protection from sharks and enable divers to fish (by driving) large areas with minimal effort. The flesh of the abalone‘s large muscular foot is the basis for this fishery, and is sold in a variety of ways including live, frozen, dried, parboiled and canned.
4.1 Historical overview
4.1.1 Commercial fishing sector A review of the management arrangements to control catch and effort levels in the South Australian commercial Abalone Fishery is provided by Shepherd and Rodda (2001). A chronology of some of the more important management changes initiated is described below, and summarised in Table 1. Soon after its inception in the mid 1960s, the number of entrants in the commercial fishery had exceeded 100. In 1971, licences were made non-transferable to reduce the number of operators and minimum legal lengths (MLL) of 130 mm shell length (SL) were imposed on all abalone species to help conserve egg production. In the same year, the fishery was divided into three separate fishery management zones, in recognition of the significant differences in geological and ecological character between the western, central and southern borders of the South Australian coast. These fishery management zones are constituted as the Western, Central and Southern Zone Abalone fisheries, and are still in operation today. The policy of non-transferability decreased the number of licence holders with commercial access to abalone to 30 by 1976, when five new licences were issued. This brought the total number of licences to 35. Sub-zones and fishing blocks were replaced by map numbers and codes in 1978 and licences became transferable in 1980. In 1984, the Western Zone Abalone Fishery was divided into Regions A and B, the MLL of Greenlip Abalone in the Western Zone Abalone Fishery was increased from 130 mm to 145mm SL and the MLL for Blacklip Abalone in the Southern Zone Abalone Fishery was decreased to 120 mm SL.

10
Table 1 A chronology of important management changes in the South Australian commercial Abalone Fishery since its inception in 1964.
Year Management change
1964 Fishing commenced in the Southern Zone Abalone Fishery.
1971 Licences made non-transferable and MLL of 130 mm SL were imposed on all abalone species for both commercial and recreational sectors.
1976 5 additional licences issued, making a total of 35.
1978 Sub-zones and fishing blocks were replaced by map numbers and codes.
1980 Licences became transferable.
1984 Western Zone Abalone Fishery divided into Regions A and B, and MLL of Greenlip Abalone increased to 145mm SL. MLL for Blacklip Abalone was decreased to 120 mm SL in the Southern Zone Abalone Fishery.
1985 Quotas introduced into the Western Zone Abalone Fishery.
1988 Quotas introduced into the Southern Zone Abalone Fishery and Blacklip Abalone MLL increased to a shell length of 125 mm.
1989 Quotas introduced into the Central Zone Abalone Fishery.
1991 Combined TACC for Greenlip and Blacklip Abalone introduced into Region B of the Western Zone Abalone Fishery.
1993 Owner-operator regulation was abolished.
1994 Four fishdown areas defined in the Southern Zone Abalone Fishery, where abalone between 110 and 125 mm SL could be taken.
1997 1st Management Plan for the South Australian Abalone Fishery.
2003 Separate TACCs for fishdown (known as Area S) and non-fishdown areas into Southern Zone Abalone Fishery with.
2004 2nd Management Plan for the South Australian Abalone Fishery.
Due to concerns of overexploitation, individual quotas were introduced into the Western Zone in 1985 and the Southern Zone in 1988. Also in 1988, the MLL for Blacklip Abalone in the Southern Zone was increased to 125 mm SL. One year later, individual quotas were also implemented into the Central Zone. A combined total allowable commercial catch (TACC) for both Greenlip and Blacklip Abalone was introduced into Region B of the Western Zone in 1991 and the owner-operator regulation was abolished in 1993. Four fishdown areas were defined in 1994 in the Southern Zone, where abalone between 110 and 125 mm SL could be legally taken. In 1997, the first Management Plan for the South Australian Abalone Fishery was prepared (Zacharin 1997). Separate TACCs for fishdown and non-fishdown areas were introduced in the Southern Zone during 2003. The second Management Plan for the South Australian Abalone Fishery was prepared in 2004 (Nobes et.al. 2004).
4.1.2 Recreational fishing sector Recreational fishing for abalone has traditionally been undertaken either by snorkelling or by SCUBA diving. The first comprehensive survey of recreational catch and effort levels for abalone in South Australia was provided by the National Recreational and Indigenous Fishing Survey (Henry and Lyle 2003). This survey was undertaken for the period May 2000 to April 2001 and estimated that the total recreational catch of abalone consisted of 17,780 animals, weighing ~9 tonnes (~1% of total state-wide catch). A more recent survey was undertaken for the period October 2007 to September 2008 by Jones (2009). The latter survey estimated that the total catch of abalone by recreational fishers in South Australia was 5,147 animals (3,462 Greenlip and 1,685 Blacklip Abalone), with a catch weight of 2.348 tonnes (1,690 kg Greenlip and 658 kg Blacklip Abalone). This represented less than 0.27% of the total state-wide catch taken over the same period.
11
4.1.3 Aboriginal traditional fishing sector Many Aboriginal communities have a long history of fishing in what are now known as South Australian waters. Each community‘s fishing activities and cultural practices are distinct. Presently, there is limited information available on the take of abalone by the Aboriginal traditional fishing sector. Further information about these activities and practices will be described in Aboriginal traditional fishing management plans. These plans are developed through the process of negotiating Indigenous Land Use Agreements with native title claimants and will be available as those agreements are concluded.
4.2 Ecosystem and habitat
Abalone (Family: Haliotidae; Genus; Haliotis) are univalve marine gastropods that inhabit near-shore reefs throughout the waters of South Australia. Abalone are found in a range of habitats, but have a preference for cold water masses with salinities of 35.0-35.6 psu and temperatures ranging between 9-14°C. The South Australian commercial Abalone Fishery is a selective fishery, using hand-collection of abalone. Because of this, by-catch is limited to the unavoidable removal of encrusting and boring organisms such as limpets and algae that use the shell of the abalone as habitat. By-catch is less problematic in the Central and Western Zone abalone fisheries because the abalone meat collected in these two zones is removed from the shell at sea (by shucking) and the empty shells are usually discarded overboard in the vicinity from where they were harvested. In contrast, all abalone harvested in the Southern Zone Abalone Fishery are sent to the fish processors whole, including all encrusting and boring organisms. Nevertheless, the removal of these ―piggyback‖ species in the Southern Zone appears to be a negligible impact from this fishery. Given this, management responses for by-catch species are not a priority for the South Australian commercial Abalone Fishery, nor is it necessary for the management of the fishery to closely monitor fishing practices. The latter is deemed unnecessary because the relatively benign method of fishing used to catch abalone results in very little or no interaction with the environment. A number of threatened, endangered and protected species (TEPS) occur in the fishery area, including seals and sea lions, sharks, and leafy sea dragons. A review of the data in TEPS interactions logbook since its introduction in 2007 indicates that the activities of the South Australian commercial Abalone Fishery are conducted in a manner that avoids mortality of, or injuries to, endangered, threatened or protected species and avoids or minimises impacts on threatened ecological communities.
4.3 Biology of key species
The planktonic larval period of both the Blacklip and Greenlip Abalone lasts between 4-7 days, depending on water temperature. During this period, the free-swimming larvae (called a veliger) do not feed and are transported by water currents. Larval dispersal studies (reviewed by Morgan and Shepherd 2006) have shown that larvae can drift many kilometres from their natal site, but are often retained within the same bay or the same reef system (Miller et al. 2008). In their review, Morgan and Shepherd (2006) concluded that larvae of shallow-water species such as Blacklip and Greenlip Abalone tended to be philopatric (i.e. they settled near their parental reefs), whereas larvae of deeper water species were dispersed far more widely.

12
When a larva is ready to settle, it swims up and down near the bottom, testing different surfaces, until it encounters the surface of an appropriate species of encrusting coralline alga, or an alternative settlement substrate (Roberts 2001). It then undergoes metamorphosis, induced by a chemical signal present in the coralline or due to extended developmental time in the water column, and changes into a juvenile abalone (Shepherd and Turner 1985; Shepherd and Daume 1996). The tiny (<1mm) abalone lives on the coralline until it is ~5mm long. It is thought that the mucus trails of other abalone of the same species are an important cue for inducing the settlement of veligers - called the slime trail hypothesis (Morgan and Shepherd 2006). According to this hypothesis, if a local population is depleted from a given area, veligers are less likely to settle there, despite the presence of suitable corallines. This has serious implications for an abalone fishery, where localised over-fishing can occur. Growth is highly variable amongst individuals and populations living short distances apart (< 1 km) and across the geographic range of each species (Prince 2005; Saunders et al. 2008). Blacklip and Greenlip Abalone typically reach ~20mm in the first year. Thereafter, growth is linear for up to 4 more years, before slowing dramatically and reaching a maximum size, with year classes becoming indistinguishable by size. Abalone can grow to a shell length of 243 mm and live up to 30 years in unfished populations. The primary determinants of growth rate are water temperature, water movement and the quantity and species of macro-algae available for consumption (Day and Fleming 1992). The period from settlement to sexual maturity is one in which the animals are largely cryptic, with smaller animals feeding in crevices or emerging to feed at night. The emergence from the interstitial spaces within the reef into more open areas on the surface of the reef coincides generally with the onset of sexual maturity, which is age- rather than size-dependent (Shepherd 1988). Thus, breeding commences at the same age over broad regions, while size-at-maturity and maximum size attained varies widely across all geographic scales. For instance, size at the onset of maturity for Blacklip Abalone has been found to vary anywhere from 60 to 200mm+ SL (Prince 2005). Abalone typically reach sexual maturity at about three years of age and grow to a harvestable size in 4 to 10 years. They are dioecious broadcast spawners, i.e., eggs and sperm are released into the water column where fertilization takes place (Shepherd 2008). Studies on the fertilisation process show that fertilisation success is strongly influenced by adult density. When males and females are more than about a metre apart the successful fertilisation of eggs falls off very sharply (Babcock and Keesing 1999). Recruitment may vary widely from year to year and relationship between stock size and subsequent recruitment are ambivalent (Prince et al. 1988; Shepherd 1990; McShane and Smith 1991). Abalone do not disperse through the environment, but form dense feeding and breeding aggregations at fixed locations. These aggregations are highly visible, making it easy for divers to learn their location and effectively target them for collection (Prince 2006). Larval dispersal and adult movements are generally limited to spatial scales of less than one kilometre (Prince 2005; Miller et al 2008). This leads to patchily-distributed aggregations, or meta-populations (also referred to as micro-stocks by Prince 2005), with distinct genetic differentiation (Miller et al. 2008). These clusters of largely self-recruiting meta-populations are separated from other similar clusters over a broad range of spatial scales (Brown and Murray 1992, Hancock 2000).

13
The lack of connectivity among meta-populations increases the risk that localised over-fishing can occur, without being reflected in the fishery-dependent data sets. When a meta-population is overfished, recruitment becomes more variable and less dependable, and the productive capacity of the stock declines, thus hastening the fishery‘s decline (Shepherd 2008). This may be because over-fishing puts a population in double jeopardy: too low densities (i.e. <0.1 - 0.3 individuals per m2) mean that successful fertilisation of eggs can fail because abalone are too far apart, and settlement cues such as adult slime trails may be lacking, so that larvae settle in inferior places. This, combined with variability in morphology and biological characteristics, emphasizes the need in these sedentary stocks to monitor at a fine-scale (Prince et al. 2008, Mayfield & Saunders 2008). There are differences in habitat preferences, distribution and biological characteristics between the main commercial species, some of which are discussed below.
4.3.1 Greenlip Abalone Greenlip Abalone are found throughout southern Australia from Corner Inlet in Victoria to Cape Naturaliste in Western Australia, with the bulk of the population found in South Australia (Shepherd 2008). For most of their distribution, they occur in two types of habitats. One type consists of low reef areas (often in a part sand/ part rock environment) at depths ranging from 5 to 40 metres. Such areas, with reef outcropping from the sand, are common off the central and west coasts of South Australia and provide the main commercial fishing grounds. Abundance in this type of habitat is usually highest on the leeward side of reefs, headlands, and islands, where the abalone are protected from the full force of wave action. Drift algae (preferably red algae) also tends to gather in these locations and provides a good supply of food. Greenlip Abalone also occur in rough water at the base of steeply sloping granite cliffs, and usually along the sides of gutters or clefts from depths of 10 to 25 metres. In areas of calm water, they may occur in shallower water on rocky habitat near seagrass beds. In South Australia, Greenlip Abalone tend to spawn in a short synchronous period from late spring to early summer. The number of eggs spawned by this species typically ranges from 100,000 to 1 million eggs and is largely dependent upon size (Shepherd et al. 1992). Size at maturity varies substantially among areas, but Greenlip Abalone are usually sexually mature at 3+ years of age, when the shell measures 100-105 mm in length (Shepherd 2008). Greenlip Abalone grow more rapidly and have a higher recorded maximum age and size than Blacklip Abalone. In the waters of South Australia, they typically reach a maximum size of 150-200mm SL in 10-15 years, but this varies considerably along the coast (Shepherd 1988). Their differences in growth rates are primarily related to food availability and water temperature (Shepherd 1988).
4.3.2 Blacklip Abalone Blacklip Abalone are found throughout southern Australia from Coffs Harbour in New South Wales to Rottnest Island in Western Australia. They are typically found on sheltered reefs, hidden in caves, fissures and narrow crevices, generally in waters ranging between 5 and 20 metres in depth. Unlike the single spawning season of Greenlip Abalone, Blacklip Abalone have two seasonal spawning periods, one in spring (October to December) and the other in autumn between February and April (Shepherd 2008).

14
4.4 Current biological status of abalone in South Australia
The abalone resource of South Australian is one among only a few worldwide that have yielded sustainable wild catch commercial harvests since 1964 (Mayfield et al. 2011). Through the early phase of the fishery, when there were no restrictions on the number of licence holders that could harvest abalone, between 900 and 1400 tonnes of abalone were removed from this fishery per year (Fig. 2). Since the introduction of quota management systems with TACCs in the mid- to late-1980s, harvest levels have remained relatively steady at around 900 tonnes per year (Fig. 2).
Fig. 2 Total commercial catch (in shell weight) of abalone landed state-wide in South Australia and within the three fishery management zones from 1968 to 2010. The green bars represent the catch in Greenlip Abalone while the black bars represent the Blacklip Abalone catch.

15
Detailed information on the stock status of Greenlip and Blacklip Abalone in each fishery management zone is provided in stock assessment and stock status reports prepared by the South Australian Research and Development Institute (SARDI) Aquatic Sciences. All completed reports are available on the PIRSA Fisheries & Aquaculture and SARDI Aquatic Sciences websites at www.pir.sa.gov.au/fisheries and www.sardi.sa.gov.au, respectively.
4.5 Economic characteristics
4.5.1 Catch and value While the catch of abalone state-wide (and within the three fishery management zones) has remained relatively steady since 1997/98, the total value of catch in the fishery increased rapidly between 1997/98 and 2000/01 (Table 2). In subsequent years, the total value of the catch has followed a declining trend. Variations in gross value of production have closely followed changes in average price. The nominal price of abalone peaked at $46.15/kg (meat weight) in 2000/01 but declined to $32.83/kg in 2009/10. Between 1997/98 and 2009/10, the 1 per cent decrease in nominal price was equivalent to a 31 per cent decline in real price.
Table 2 Total catch and value of abalone landed state-wide in South Australia and within the three fishery management zones from 1990/91 to 2009/10 (source: EconSearch 2011).
(tonnes) ($m) (tonnes) ($m) (tonnes) ($m) (tonnes) ($m)
1990/91 121 2.0 187 3.0 555 9.1 863 14.0
1991/92 131 2.2 191 3.3 563 9.5 885 15.1
1992/93 176 4.0 168 4.9 525 14.9 869 23.7
1993/94 141 5.4 151 5.1 510 16.8 802 27.2
1994/95 154 4.4 205 5.5 492 12.8 851 22.8
1995/96 155 3.8 177 4.5 570 14.1 902 22.5
1996/97 146 3.8 195 5.7 562 15.7 903 25.2
1997/98 123 4.0 180 5.7 509 17.2 812 26.9
1998/99 171 4.7 170 5.0 592 17.4 933 27.2
1999/00 149 5.2 190 7.2 550 20.0 889 32.4
2000/01 145 6.7 188 9.1 534 24.1 867 40.0
2001/02 141 5.9 193 9.0 516 19.9 850 34.8
2002/03 146 5.8 171 8.0 573 22.5 890 36.3
2003/04 143 4.3 177 6.6 559 20.6 879 31.6
2004/05 157 5.9 180 7.4 565 20.5 902 33.8
2005/06 136 5.1 181 7.2 579 21.5 896 33.9
2006/07 164 6.1 168 6.2 551 19.2 883 31.4
2007/08 146 4.5 193 7.0 550 19.6 889 31.0
2008/09 151 4.8 151 5.7 535 22.1 837 32.5
2009/10 147 3.5 164 5.5 544 19.1 855 28.1
YearSouthern Zone Central Zone South AustraliaWestern Zone

16
4.5.2 Income and costs The total number of licence holders in each of the fishery management zones has not changed since 1976. Accordingly, changes in the average income per licence holder directly relate to the total Gross Value of Production (GVP) for the fishery. The average income per licence holder increased from approximately $751,000 in 1997/98 to $1.14 million in 2000/01. Average income has generally followed a declining trend in subsequent years as a result of a decrease in value of catch in the fishery. As catch has been relatively stable over this period, the decline in GVP is largely a result of falling prices. In 2009/10, the average income per licence holder was around $790,000 (Figure 3).
Fig. 3 Average income per licence holder in the South Australian commercial Abalone Fishery from 1997/98 to 2009/10 (source: EconSearch 2011).
A breakdown of major cost items as a proportion of total cash costs shows that labour costs account for the largest share of total cash costs in the South Australian commercial Abalone Fishery (Figure 4). The labour costs are comprised of payments to licence owners and crew as well as an imputed wage to those licence owners and other family members who are not paid a wage directly by the business. Other significant cash costs in the South Australia commercial Abalone Fishery are licence fees and repairs and maintenance (Figure 4).
0
5
10
15
20
25
30
35
40
0
200,000
400,000
600,000
800,000
1,000,000
1,200,000
1,400,000
Lice
nce
ho
lde
rs (
no
.)
Ave
rage
bo
at g
ross
inco
me
($
pe
r b
oat
)
Boat Gross Income Number of Licence Holders

17
Fig. 4 Cost shares in the South Australian commercial Abalone Fishery from 1997/98 to 2009/10 (source: EconSearch 2011).
The average management fee per licence holder and the licence fee as a proportion of GVP are illustrated in Figure 5.
Fig. 5 Management fee per licence holder and as a proportion of Gross Value of Production (GVP) for the South Australian commercial Abalone Fishery from 1997/98 to 2009/10 (source: EconSearch 2011).
0%
10%
20%
30%
40%
50%
60%
70%
80%
90%
100%
Pro
po
rtio
n o
f to
tal c
ash
co
sts
(%)
Labour Fuel Repairs & Maintenance
Licence Fee Interest Legal & Accounting
Travel Office & Admin Other
0%
2%
4%
6%
8%
10%
12%
$0
$10,000
$20,000
$30,000
$40,000
$50,000
$60,000
$70,000
$80,000
Fee
as
a p
rop
ort
ion
of
GV
P (
%)
Fee
pe
r lic
en
ce h
old
er
($)
Fee/Licence Holder Fee/GVP

18
One of the objectives of management of the South Australian commercial Abalone Fishery is full cost recovery. To achieve this objective, licence fees are set at a level sufficient to recover the costs of managing the fishery that are attributable to the commercial sector (see Section 15). At the same time the management programs and associated costs are developed with an aim to ensure that licence fees do not exceed the trigger point of 10 per cent of the GVP of the fishery. Licence fees as a percentage of GVP decreased between 1997/98 and 2000/01 from 10 per cent to 4 per cent. This fall was a result of a decrease in the total cost of management of the fishery and an increase in fishery GVP. Fees as a percentage of GVP have increased in subsequent years, reaching 9 per cent in 2009/10 (EconSearch 2011). This rise was a result of both an increase in the cost of managing the fishery and a decline in the overall fishery GVP (Figure 5). The total number of licence holders in each of the three fishery management zones has not changed since 1976. Accordingly, changes in the average fee per licence holder correlate with changes in the total cost of managing the fishery. The management cost per licence holder peaked at $74,519 in 1997/98 and then fell to $45,817 in 2000/01. Since 2000/01, the cost per licence holder has increased and was $71,782 in 2009/10 (Figure 5). The cash costs detailed in Figure 4 can be categorised as either variable or fixed costs. Total variable costs and total fixed costs are illustrated in Figure 6 on an average per boat basis. Total variable costs have fluctuated between years but generally followed an increasing trend over the period 1997/98 to 2002/03 and a decreasing trend from 2003/04 to 2009/10.
Fig. 6 Average total costs in the South Australian commercial Abalone Fishery from 1997/98 to 2009/10 (source: EconSearch 2011).
Figure 7 shows that between 1997/98 and 2009/10 the 1 per cent decrease in nominal price was equivalent to a 31 per cent decline in real price.
0
50,000
100,000
150,000
200,000
250,000
300,000
350,000
400,000
450,000
500,000
Ave
rage
pe
r b
oat
($
)
Total Fixed Costs Total Variable Costs

19
Fig. 7 Price and cost indices for the South Australian commercial Abalone Fishery from 1997/98 to 2009/10 (in this figure the year 1997/98 = 100; source: EconSearch 2011).
A large proportion of the abalone caught in South Australia is exported overseas. Accordingly, the value of the Australian dollar relative to the United States dollar (USD) has had a significant influence on abalone price and the value of catch in the fishery. The relationship between abalone price and the exchange rate over the past 10 years is displayed in Figure 8.
Fig. 8 Exchange rate of United States dollar (USD) and abalone price from 1997/98 to 2009/10 (source: EconSearch 2011).
60
70
80
90
100
110
120
130
140
150
Pri
ce in
dic
es
(19
97
/98
= 1
00
)
Price (nominal) Price (real)
$0.00
$0.10
$0.20
$0.30
$0.40
$0.50
$0.60
$0.70
$0.80
$0.90
$1.00
$0
$5
$10
$15
$20
$25
$30
$35
$40
$45
$50Ex
chan
ge r
ate
(U
SD)
Pri
ce (
$/k
g)
Price (nominal) Exchange Rate (USD)

20
The coefficient of correlation between the exchange rate (USD) and the nominal price for abalone for the period 1997/98 to 2009/10 is –0.51. This indicates that there is a strong inverse relationship between the two variables. Thus, when the Australian dollar appreciates, as it did between 2001/02 and 2007/08 and again in 2009/10, there is, generally, a corresponding decline in the average price of abalone (Figure 7).
4.5.3 Profitability Selected measures of profitability for the South Australian commercial Abalone Fishery are summarised in Figure 9 for the years 1997/98 to 2009/10. Changes in each of the profitability measures for the fishery were closely related to the average income earned. Profits increased between 1997/98 and 2000/01 when the average income per licence increased (largely as a result of an increase in abalone price). Profitability measures generally followed a declining trend in subsequent years as a result of a decrease in average income driven by a decline in average product price (Figure 9).
Fig. 9 Average income and profit per boat in the South Australian commercial Abalone Fishery from 1997/98 to 2009/10 (source: EconSearch 2011).
4.5.4 Contribution to the South Australian economy Figures 10, 11 and 12 illustrate the total economic impact of the fishery on the South Australian economy for the period 1997/98 to 2009/10. Total economic impact refers to the direct fishing industry impacts (fishing, processing, etc.) and the indirect impacts on other sectors of the economy.
0
200,000
400,000
600,000
800,000
1,000,000
1,200,000
1,400,000
Ave
rage
pe
r b
oat
($
)
Gross Income Gross Margin
Gross Operating Surplus Profit at Full Equity

21
Fig. 10 Return on investment in the South Australian commercial Abalone Fishery from 1997/98 to 2009/10 (source: EconSearch 2011).
The change in total output and Gross State Product (GSP) impacts are closely related to changes in price and fishery GVP (Fig. 11). There has been some increase in the direct and indirect employment impact of the fishery since 1997/98, as illustrated in Figure 12.
Fig. 11 Total gross state product, output and household income impact of the South Australian commercial Abalone Fishery on the South Australian economy from 1997/98 to 2009/10 (source: EconSearch 2011).
0.0%
2.0%
4.0%
6.0%
8.0%
10.0%
12.0%
14.0%
0.0
1.0
2.0
3.0
4.0
5.0
6.0
7.0
8.0
9.0
Re
turn
on
to
tal i
nve
stm
en
t (%
)
Ave
rage
lice
nce
val
ue
($
m p
er
lice
nce
)
Licence Value Return on Investment
0
10
20
30
40
50
60
70
80
90
100
$ m
illio
n (
no
min
al)
GSP Output Household Income

22
Fig. 12 Total direct and indirect employment impact of the South Australian commercial Abalone Fishery on the economy from 1997/98 to 2009/10 (Source: EconSearch 2011).
4.5.5 Economic rent The economic rent generated in the South Australian commercial Abalone Fishery increased from $13.5 million in 1997/98 to $23.1 million in 2000/01 but declined to $11.4 million by 2009/10 (Fig. 13).
Fig. 13 Economic rent (expressed in nominal terms) in the South Australian commercial Abalone Fishery from 1997/98 to 2009/10 ($’000) (source: EconSearch 2011).
0
50
100
150
200
250
300
350
400
450ft
e jo
bs
Direct Employment Indirect Employment
0
5,000
10,000
15,000
20,000
25,000
30,000
35,000
40,000
45,000
($'0
00
)
Gross Income Labour Cash Costs
Depreciation Opportunity Cost of Capital Economic Rent

23
Economic rent expressed as a percentage of GVP is a useful indicator for analysing a fishery over time and for comparing different fisheries. This indicator is illustrated in Figure 14 and shows an increase between 1997/98 and 2000/01, but a general decline in subsequent years.
Fig. 14 Economic rent as a proportion of GVP in the South Australian commercial Abalone Fishery from 1997/98 to 2009/10 (source: EconSearch 2011).
The aggregate value of licences in the South Australian commercial Abalone Fishery and the return to capital value of the fishery is illustrated in Figure 15. The return to the capital value of the fishery has declined steadily over the last nine years as a result of a decrease in the economic rent generated by the fishery (Figure 13) and an increase in the aggregate value of fishing licences (Figure 15).
0%
10%
20%
30%
40%
50%
60%
70%
Eco
no
mic
re
nt/
GV
P (
%)

24
Fig. 15 Aggregate value of licences and return to capital in the South Australian commercial Abalone Fishery from 1997/98 to 2009/10 (source EconSearch 2011)a.
a The value of licences represents licence holders’ estimates of the value of their fishing licence derived from
survey responses. Estimates were based on different survey samples and techniques. Some of the difference
between years is, therefore, attributable to sampling variability.
4.5.6 Markets Most (between 80-90%) of the abalone landed in South Australia by the commercial sector, as in other parts of southern Australia, is exported overseas. A breakdown of total abalone exports from South Australia by country of destination for the period 2007/08 to 2009/10 is provided in Table 3. The most significant export destination in 2009/10 was Hong Kong, accounting for 81 per cent of the total quantity and 83 per cent of the total value of exports. The total value of abalone products exported from South Australia is approximately 56 per cent greater than the estimated GVP for the fishery as a whole. The estimate of GVP reflects the beach price of landed abalone while the value of exports reflects the free on board price of processed and packaged abalone. The value of abalone exports, therefore, include processing, transport and trade margins.
0.0%
2.0%
4.0%
6.0%
8.0%
10.0%
12.0%
14.0%
0
50
100
150
200
250
300
350
Re
turn
to
Cap
ital
Val
ue
(%
)
Val
ue
of
lice
nce
s ($
m)
Aggregate Value of Licences Return to Capital Value

25
Table 3 Abalone exports from South Australia, by country of destination from 2007/08 to 2009/10 (source: unpublished ABS data).a
a Export data only include product that is exported directly from South Australia. Therefore, product that is shipped
interstate prior to export is not included. Export data could also include abalone grown in aquaculture in addition
to wild caught abalone.
4.6 Social characteristics
Estimates of the socio-economic impact generated in the 2009/10 financial year by the commercial sector of the South Australian commercial Abalone Fishery in the Eyre/Western region is outlined in Table 4. The Eyre/Western region covers over 230 000 square kilometres from Whyalla to the border with Western Australia. The value of output generated directly in the Eyre/Western region by this fishery was $28.1 million in 2009/10 (Table 4), with another $13.6 million generated by associated downstream activities such as processing, transport, retail/ food services and capital expenditure. Flow-on to other sectors added another $20.3 million in output to the regional economy ($45.1 million to the State economy). The total output impact (direct plus indirect) was estimated to be $62 million in the Eyre/Western region in 2009/10 ($89.4.to the State economy) The contribution to GSP and Gross Regional Product (GRP) is measured as value of output less the costs of good and services (including imports) used in producing the output. In 2009/10, the total fishing industry related contribution to GSP in South Australia by the South Australian commercial Abalone Fishery was $50.6 million ($37.1 million in the Eyre/Western region). Of this, $22.4 million was generated by fishing directly, $5.6 million was generated by downstream activities and $22.6 million was generated in other sectors of the state economy.
Quantity
(kg)
Value
($'000)
Quantity
(kg)
Value
($'000)
Quantity
(kg)
Value
($'000)
Canada 27,005 1,909 13,864 1,397 20,184 1,549
China 1,679 313 1,859 584 2,954 1,110
Hong Kong 515,617 34,708 317,571 32,614 437,550 36,293
Japan 103,297 3,553 51,466 2,137 27,077 1,272
Malaysia 11,265 619 15,597 965 6,612 397
Singapore 18,590 1,565 18,796 1,714 23,991 1,648
Taiwan 6,490 312 2,610 204 1,142 68
USA 34,546 2,180 17,742 1,593 18,924 1,239
Other 5,100 251 1,739 168 4,468 279
Total 723,589 45,410 441,244 41,377 542,902 43,856
2009/102008/09
Destination
2007/08

26
Table 4 The economic impact of the South Australian commercial Abalone Fishery in the Eyre/Western region for 2009/10 (source: Econseach 2011).abc
a Full-time equivalent jobs. Direct employment in the fishing sector was comprised of 78 full-time and 37 part-time
jobs, that is, 115 jobs in aggregate, which was estimated to be equal to 90 fte jobs. b Capital expenditure includes expenditure on boats, fishing gear and equipment, sheds and buildings, motor
vehicles and other equipment. c Totals may not sum due to rounding.
While investment in existing businesses has the potential to add significantly to local economic activity, the approach taken to estimate the regional economic impact was to focus solely on investment in new, local enterprises as these investments are unquestionably a net addition to local economic activity. The impacts of local investment expenditure in new enterprises are reported in Table 5.
($m) % (fte jobs) % ($m) % ($m) %
Direct effects
Fishing 28.1 45% 90 39% 8.5 50% 22.4 60%
Processing 12.7 20% 35 15% 2.8 17% 3.9 11%
Transport 0.5 1% 2 1% 0.1 1% 0.2 1%
Retail 0.0 0% 0 0% 0.0 0% 0.0 0%
Food services 0.0 0% 0 0% 0.0 0% 0.0 0%
Capital expenditure b 0.5 1% 3 1% 0.1 1% 0.2 0%
Total Direct c 41.7 67% 131 56% 11.5 68% 26.8 72%
Flow-on effects
Trade 3.9 6% 35 15% 1.3 8% 1.9 5%
Manufacturing 4.3 7% 12 5% 0.9 6% 1.3 4%
Business Services 2.1 3% 10 4% 0.7 4% 1.0 3%
Transport 1.6 3% 6 3% 0.4 2% 0.7 2%
Other Sectors 8.4 14% 36 16% 1.9 12% 5.5 15%
Total Flow-on c 20.3 33% 99 43% 5.2 31% 10.3 28%
Total c 62.0 100% 230 100% 16.8 100% 37.1 100%
Total/Direct 1.5 - 1.8 - 1.5 - 1.4 -
Total/Tonne $72,400 - 0.27 - $19,500 - $43,400 -
SectorOutput Employment a Household Income Contribution to GRP

27
Table 5 Average annual local investment expenditures by licence holders in the South Australian commercial Abalone Fishery from 2003/04 to 2007/08 (source: EconSearch 2011).
a Based on survey respondents’ estimated investment expenditures over the 5 years, 2003/04 to 2007/08. b These estimates are based on a sample (15) of licence holders. Given the ‘lumpy’ nature of investment
expenditure they may not be representative of all licence holders.
The estimated impacts of local investment by licence holders for 2007/08 is shown in Table 6 and indicates the extent to which such investments add to the already significant regional contribution of the industry.
Table 6 Regional economic impact of local investment expenditures in new enterprises by licence holders in the South Australian commercial Abalone Fishery for 2007/08 (source: EconSearch 2011).
a ‘All other sectors’ refers to the other industry sectors in the regional economy such as manufacturing, trade,
business and property services, transport and finance.
Existing Businesses/
Assets (e.g. motels,
farms, shares, real
estate)
New Enterprises (e.g.
aquaculture,
horticulture, property
development)
Total
($m) ($m) ($m)
Estimated Average
Annual Expenditure per
Licence Holder a
0.129 0.104 0.233
Estimated Aggregate
Annual Expenditure for
the Abalone Fishery b
4.499 3.656 8.155
Investment/
TurnoverEmployment
Household
income
Contribution to
GRP
($m) (fte jobs) ($m) ($m)
Investment
Sectors (direct)3.66 21 0.70 1.50
All other sectors a
(indirect)1.70 13 0.50 0.86
Total 5.35 34 1.20 2.36
Sector
28
5 CO-MANAGEMENT ARRANGEMENTS The Fisheries Council of South Australia (Fisheries Council) was established under the Fisheries Management Act 2007. The functions of the Council are set out in Section 16 of the Fisheries Management Act 2007 and include the preparation of management plans under the Act, advising the Minister on allocation issues and promoting the co-management of fisheries. Essentially, co-management is an arrangement whereby responsibilities and obligations for sustainable fisheries management are negotiated, shared and delegated at appropriate levels between government, industry and other stakeholders. The Fisheries Council is currently considering the development of a policy on co-management which will help inform discussion with the wider commercial fishing industry and other stakeholder groups as to how best to promote and implement co-management. In the meantime, consultation arrangements have been established between PIRSA Fisheries & Aquaculture and the representative industry body for each major commercial fishery. These arrangements recognise the relevant body as the representative body for the industry on the basis that they meet the following criteria: 1. Financially viable. The body must be demonstrably financially viable to the extent
that it can fulfil a fisheries management advisory role. This will be assessed in terms of financial support for the body and financial capacity to engage in the communication and extension necessary to provide input to fisheries management processes.
2. Representative. The body must be able to demonstrate that it represents the
interests of members and the broader industry and community. This may be demonstrated through the structure of the body, its governance arrangements and its processes for canvassing industry feedback.
3. Credible. The body must have demonstrated an ability to provide credible industry
advice on fisheries management issues and to engage with PIRSA Fisheries & Aquaculture in a constructive manner.
For the South Australian commercial Abalone Fishery, there are currently three representative industry bodies. These are the SZ Abalone Management Inc., Central Zone Abalone Fishery and the Abalone Industry Association of SA Inc. These bodies represent the Southern Zone Abalone Fishery, Central Zone Abalone Fishery and the Western Zone Abalone Fishery, respectively. The Minister oversees the management of the fishery under this management plan, but day to day management is conducted by PIRSA Fisheries & Aquaculture in association with the industry bodies. Once this management plan has been approved, further discussions will take place with the three industry bodies, the recreational and Aboriginal traditional fishing sectors and other stakeholders where appropriate, to progress the co-management of the South Australian commercial Abalone Fishery, whereby these bodies may take greater responsibility of the management of the fishery.

29
6 ALLOCATION OF ACCESS AMONG SECTORS
6.1 Current allocated shares of the resource
The Fisheries Management Act 2007 provides that a management plan must specify the share of the fishery to be allocated to each fishing sector under the plan (Section 43(2)(h)). The Fisheries Management Act 2007 also provides that, in determining the share of aquatic resources to be allocated to a particular fishing sector under the first management plan for an existing fishery, the share of aquatic resources to which that fishing sector had access at the time the Minister requested the Council to prepare the plan must be taken into account (Section 43(3)). The Minister formally requested that the Fisheries Council prepare this management plan on 3 July 2008. Therefore, this plan must take into account the share of the South Australian Abalone Fishery that the commercial, recreational and Aboriginal traditional fishing sectors had access to at that time. The share allocated to each fishing sector in relation to the South Australian commercial Abalone Fishery is set out in Table 6. As both the recreational and Aboriginal traditional sectors rarely distinguish between Greenlip and Blacklip Abalone, the catch of these two species will be pooled prior to estimating sectoral shares.
Table 6 Shares of abalone species allocated to each fishing sector
Species Commercial Recreational Aboriginal traditional
Abalone spp. 99.74% 0.15% 0.11%
6.2 Sectors of the South Australian Abalone Fishery
6.2.1 Commercial fishing sector Commercial access to abalone in South Australia is restricted to licence holders in the Western Zone Abalone Fishery, Central Zone Abalone Fishery and Southern Zone Abalone Fishery.
6.2.2 Recreational fishing sector Recreational access to abalone is primarily managed using minimum legal size limits and recreational daily bag and boat limits. Any catch taken by the Charter Boat Fishery is considered to be recreational catch and is allocated as part of the broader recreational fishing sector.
6.2.3 Aboriginal traditional fishing sector Under the Fisheries Management Act 2007, access to South Australia‘s fisheries resources by Aboriginal communities shall be provided through Aboriginal traditional fishing management plans. These plans may be developed when an Indigenous Land Use Agreement (ILUA), agreed to resolve a native title claim, is in place in relation to a native title claim area.

30
The State is currently engaged in ILUA negotiations with native title claimants and other stakeholder groups, including the commercial fishing industry. The agreements arising from these negotiation processes will inform the way that access to fisheries resources by Aboriginal communities is defined and implemented. Aboriginal traditional fishing under the Fisheries Management Act 2007 only relates to fishing agreed through the ILUA process. Aboriginal people are also recreational fishers outside of these arrangements. In this management plan, a share of access has been allocated and set aside for the purpose of resolving these native title claims. There is little available information on the take of Abalone spp. by the Aboriginal traditional fishing sector; however, the small number of claims with fishery-related interests and negotiations to date has informed the share that has been put aside for this purpose. A nominal share of 0.11% has been made to the Aboriginal traditional sector in this management plan, which has been deducted from the total recreational share. This is because Aboriginal traditional fishing is non-commercial fishing. It is anticipated that all fishery-related ILUAs will be negotiated within five years. Therefore, at the five year review for this management plan, any difference between the nominal share put aside and the actual share agreed through the ILUAs can be calculated. Any difference would then be re-allocated to or from the recreational sector.
6.3 Information used to allocate shares
In determining the share to be allocated to a particular fishing sector, the share to which that sector had access at the time the Minister requested the Fisheries Council to prepare the management plan (based on the most recent information available to the Minister) must be taken into account. Quantifying current shares will be an estimate based on the best available information on the current level of use of all sectors. The Allocation Policy requires that information about current use by sectors must be –
Real – that is, data must be available – it must have been collected and published.
Recent – data on which the information is based should be the most recent available and, in any case, no more than five years old.
Reliable – the data on which the information is based should have been obtained, and the information or report collated or prepared, in a way that is verifiable. The process for obtaining the data and preparing the information should be documented.
The information used to allocate shares of aquatic resources in this management plan is derived from the following sources:
South Australian Recreational Fishing Survey (Jones 2009);
Central Zone Abalone (Haliotis laevigata and H. rubra) Fishery (Mayfield et al 2008);
Southern Zone Abalone (Haliotis laevigata and H. rubra) Fishery (Mayfield et al 2009);

31
Western Zone Abalone (Haliotis laevigata and H. rubra) Fishery (Region A) (Chick et al 2009); and
Western Zone Abalone (Haliotis laevigata and H. rubra) Fishery (Region B) (Stobart et al 2010).
6.4 Review of allocations
Allocations between sectors are to be reviewed periodically in accordance with the criteria set out in the Allocation Policy. For the South Australian commercial Abalone Fishery, the first comprehensive review of shares will be commenced within 5 years of commencement of this management plan.
6.5 Method for adjusting allocations of access in future
A need for adjustment of shares between different sectors may be triggered by:
a) a review of the allocations between sectors;
b) a review of the management plan, which will reassess the appropriateness of shares and may trigger an adjustment (refer to section 14); or
c) Outcomes of a resource assessment, which triggers a fisheries management decision that is made primarily to ensure sustainability of the fishery but that may result in a shift of shares between sectors.
The declaration of a marine protected area that would result in reallocation of shares would be given effect through the Marine Parks Act 2007. The Marine Parks Act 2007 provides that compensation may be paid to commercial fishers affected by the closure of an area or restrictions of activities within a marine park. If any future adjustment of shares is to be from the commercial sector to the non-commercial sector, a voluntary scheme would always be pursued in the first instance. Since the commercial sector of the South Australian Abalone Fishery has a limited number of licences and they are rarely transferred, it may be difficult to assess the value of quota units and fishery licences. For this reason, a voluntary adjustment scheme may not be able to be implemented in the fishery. Therefore, second voluntary option/step is required, which would investigate an incentive-based scheme for share adjustment. Compulsory acquisition of commercial access to the fishery would be considered as a last resort. The adjustment of shares from the commercial sector to a non-commercial sector can be summarised by the following options:
1. purchase commercial access (i.e. quota units) to the resource on the open market;
2. create incentives for the commercial sector to trade access to the resource; and
3. compulsory acquisition of commercial access to the fishery would be considered as a last resort. Any compulsory acquisition would include compensation to the commercial sector.

32
7 ECOSYSTEM IMPACTS One objective of this plan is the management of the South Australian commercial Abalone Fishery as a part of the broader ecosystem, using an ecosystem-based fisheries management (EBFM) approach. The Fisheries Management Act 2007 specifically requires that the following ecological impacts be identified and assessed as the first step in developing a fishery management plan:
current known impacts of the fishery on the ecosystem;
potential impacts of the fishery on the ecosystem; and
ecological factors that could have an impact on the performance of the fishery. The ecological impacts associated with the South Australian commercial Abalone Fishery were identified in consultation with stakeholders and assessed through the process of conducting an ecologically sustainable development (ESD) risk assessment (see Appendix 19.1). The National ESD Reporting Framework for Australian Fisheries of Fletcher et al. (2002) was used as a guide throughout this process. All the ecological, economic and social factors that affect the management of the South Australian commercial Abalone Fishery were prioritised by stakeholders at a workshop using risk ratings from negligible to extreme (see Appendix 19.2). A total of thirteen risks with a rating Moderate or higher were identified. These risks are summarised in Table 7. Of these, the two highest risks identified for this fishery were:
1. an outbreak of Abalone Viral Ganglioneuritis (AVG) in the Southern Zone; and
2. sufficient resources for policy, management and research to ensure the Greenlip and Blacklip Abalone resource is harvested within sustainable limits.
Where possible, specific management strategies to minimise these thirteen risks and associated performance indicators have been developed and are provided in Table 8. Detailed information about the South Australian commercial Abalone Fishery and both the methodology and outcomes of the ESD risk assessment are provided in the report ‗Ecologically Sustainable Development (ESD) Risk Assessment for the South Australian commercial Abalone Fishery (PIRSA 2009).
7.1 Policy drivers
This management plan aims to achieve outcomes that are consistent with broader Government objectives for the management of the marine environment. Policy drivers that have been taken into account in the development of this management plan include:
the National Strategy for Ecologically Sustainable Development (1991);
the Precautionary Principle, as set out in the Intergovernmental Agreement on the Environment (1992);
the Australian Government ‗Guidelines for the Ecologically Sustainable Management of Fisheries (2007)‘, which relate to the requirements of the Environment Protection and Biodiversity Conservation Act 1999;
the National Policy on Fisheries By-catch (1999);
FAO Code of conduct for responsible fisheries (1995); and
South Australian Marine Parks Act 2007.

33
Table 7 Summary of moderate or higher risks identified in the South Australian commercial Abalone Fishery ESD risk assessment (all risks to the fishery are presented in Appendix 2)
Component Risk Description Risk rating
Objective Strategy
Retained species
Primary Target Species (Greenlip Abalone)
Impact of fishery on the Greenlip Abalone resource
M
1a, 1b, 4c
1a(i)-1a(v) 1b(i)-1b(vii) 4c(iii), 4c(v)
Primary Target Species (Blacklip Abalone)
Impact of fishery on the Blacklip Abalone resource
M
1a, 1b, 4c
1a(i)-1a(v) 1b(i)-1b(vii) 4c(iii), 4c(v)
Community wellbeing
Fishing Industry
Importance of profit, OH&S, employment, community relationship, asset value and lifestyle to the fishing industry.
M
2b, 2e, 2f 2b(i)-2b(ii) 2e(i) 2f(ii)
Governance
Policy and management (Resources)
Sufficient resources for policy and management to ensure abalone resource is harvested sustainably.
H
2b, 4a, 2b(i) 4a(i)-4a(iv)
Policy and management (Compliance-illegal fishing)
Sufficient compliance resources to manage the illegal, unregulated and unreported catchof abalone.
M
4c 4a(ii)-4a(iii) 4c(i)-4c(v)
Consultation (Aquaculture)
Impact of consultations with other agencies on resource and performance of fishery.
M
3c, 4a, 4b
3c(iii) 4a(v) 4b(iv)
Other agencies (Coordination)
Impact of other agencies such as AQIS on resource and performance of fishery.
M
4a, 4b 4a(v) 4b(iv)
External factors affecting fishery performance
Biological (Diseases-AVG)
Impact of human induced spread of diseases on resource and performance of fishery.
H M M 3d 3d(i)-3d(iii)
Water quality (Desalination Plant)
Impact of human induced changes to water quality on resource and performance of fishery.
M
1c, 3c
1c(i) 3c(i)-3c(ii)
Economic (Market forces)
Impact of market forces on economics of the abalone fishery.
M
2b, 2e, 2f 2b(i) 2e(i) 2f(ii)
Economic (Market access)
Impact of market access on economics of the abalone fishery.
M
2b, 2e, 2f 2b(i) 2e(i) 2f(ii)

34
8 GOALS AND OBJECTIVES This management plan provides a set of management goals and objectives for the South Australian commercial Abalone Fishery that are complementary to the objectives outlined in Section 7 of the Fisheries Management Act 2007. These goals and objectives take into account policy drivers listed in the previous section, such as the principles of Ecologically Sustainable Development, the precautionary principle and the guidelines for the ecologically sustainable management of fisheries set out in the EPBC Act 1999. This management plan seeks to ensure that an appropriate balance exists between the need to ensure long term sustainability of Greenlip and Blacklip Abalone stocks in South Australia and the optimum utilisation and equitable distribution of stocks between all stakeholder groups and future generations. Within the framework provided by Ecologically Sustainable Development, the primary consideration for this plan is Object 7(a) of the Fisheries Management Act 2007, relating to the avoidance of over-exploitation. Economic and social objectives will be pursued to the extent possible, where stock sustainability objectives have been demonstrably achieved. The four key goals for the fishery are set out below. Linked to these goals is a series of operational objectives and management strategies designed to ensure that the goals are effectively pursued over the next ten years of this management plan. These goals and objectives capture all of the factors identified in the Fisheries Management Act 2007 that must be balanced to pursue Ecologically Sustainable Development.
8.1 Goal 1 – Ensure the abalone resource is sustainably harvested
This goal relates to the sustainability of the target stocks. The primary operational objectives for Goal 1 are to ensure that Greenlip and Blacklip Abalone stocks are harvested within sustainable limits, as defined by the reference points identified in this management plan, and that adequate data and information exist to underpin this process. Since the commercial sector harvests almost all the abalone catch, management strategies that limit the commercial take of these two species is an important focus in terms of ensuring ecologically sustainable stock levels. In South Australia, the three main management strategies used to ensure sustainability in the commercial sector are:
limited entry;
restrictions on the total annual commercial catch through the quota system; and
minimum legal lengths. Management strategies that limit the take of Greenlip and Blacklip Abalone by other sectors also help ensure the sustainability of the resource. This includes restrictions on the total recreational and traditional catch each year through size, bag and boat limits, the number of individuals allowed for broodstock purposes and compliance activities to reduce the quantity of illegal activity. The objectives of this management plan in relation to sustainability are twofold:
1. maintain the stocks above ecologically sustainable levels for both species; and
2. ensure sufficient data and information to undertake harvest strategy (see section 9) and inform management decisions.

35
8.2 Goal 2 – Optimum economic utilisation and equitable distribution of the abalone resource
This goal relates to the economic and social benefits derived from the fishery. Goal 2 aims to optimise the economic value of the fishery in an equitable way, within the sustainability constraints of the fishery. Optimising the use of the fishery is addressed in the objectives and strategies by maximising economic returns from the commercial fishery and maintaining equitable access to the resource between commercial, recreational, Aboriginal traditional, broodstock and non-exploitative uses. The TACC decision rules and reference levels in the harvest strategy aim to establish catch limits that maximise productivity and economic returns from the fishery, within the biological constraints. The recent introduction of more flexible instruments for quota ownership and harvesting entitlements are designed to improve the pursuit of economic efficiency. The objectives of this management plan in relation to economic utilisation and equitable resource distribution are sixfold:
1. maximise catches for both species within ecologically sustainable limits;
2. maintain a flow of economic benefit from the fishery to the broader community;
3. provide equitable public access and recreational fishing opportunities;
4. provide equitable Aboriginal traditional fishing access;
5. ensure sufficient economic information exists to make informed management decisions; and
6. shares of access to abalone stocks are explicitly allocated between the commercial, recreational and Aboriginal traditional sectors.
8.3 Goal 3 – Minimise impacts on the ecosystem
This goal relates to the management of the fishery using an ecosystem-based fisheries management (EBFM) approach. Australian Government guidelines for the ecological sustainability of Australian fisheries acknowledge the need to minimise the impacts of fishing on the ecosystem (see Guidelines for the Ecologically Sustainable Management of Fisheries, 2nd Edition). To achieve this goal, 3 key aims were identified:
(1) ensure sustainability of by-catch and by-product species;
(2) minimise interactions with threatened, endangered and protected species; and
(3) minimise impacts on benthic habitats and associated communities. The objectives of this management plan in relation to EBFM are fourfold:
1. minimise fishery impacts on by-catch species and the ecosystem;
2. avoid lethal interactions with endangered, threatened and protected species;
3. minimise external impacts on stocks associated with broader environmental health (e.g. desalination plant and aquaculture); and
4. manage diseases and exotic pests to minimise impacts on abalone stocks. The first three objectives of Goal 3 are easily achieved because the benign method used to catch abalone results in very little interaction with the environment and by-catch is limited to the unavoidable removal of encrusting and boring organisms in the Southern Zone (PIRSA 2009).

36
Perhaps the biggest threat to the South Australian commercial Abalone Fishery (particularly for the Southern Zone Abalone Fishery) is the AVG virus. To mitigate the threat of AVG spreading in South Australian waters though human activities, PIRSA Fisheries & Aquaculture, have prepared an emergency response plan in the event of an outbreak in either the aquaculture or wild harvest sectors. The plan provides specific guidelines for PIRSA Fisheries & Aquaculture staff to respond in the event of a suspected or confirmed AVG outbreak. It has been prepared in accordance with the draft national disease strategy (AQUAVETPLAN) for AVG (Department of Agriculture, Fisheries and Forestry) and is underpinned by the Biosecurity Control Measures for AVG: a code of practise (FRDC report 2006/243). The emergency response plan was also developed with consideration of previous outbreaks and fisheries management responses in both Victoria and in Tasmania. PIRSA Fisheries & Aquaculture‘s preparedness has also involved simulation and case scenario exercises, letters and information to licence holders, as well as a public awareness campaign including a webpage, brochures and media releases.
8.4 Goal 4 – Cost effective and participative management of the fishery
This goal relates to co-management of the fishery, planning of management activities and the recovery of the costs of management of the fishery. The key objectives of this goal are to ensure that stakeholders and government fisheries administration share responsibility and have involvement in the decision-making processes for developing and implementing management arrangements, and to ensure that management arrangements are complied with. The cost-effectiveness of these arrangements also need to be considered in the development process as the management costs are recovered from fishers in accordance with the Government‘s cost recovery policy. The objectives of this management plan in relation to co-management, planning and cost recovery are threefold:
1. promote cost-effective and efficient management of the fishery, in line with the government‘s cost-recovery policy;
2. ensure management arrangements reflect concerns and interests of the wider community; and
3. promote compliance with management arrangements.

37
Table 8 Goals, objectives and strategies for the management of the South Australian commercial Abalone Fishery.
Goal Objective Strategy Addressing Risk Performance indicators Description Reference point
1. Ensure the abalone resource is sustainably harvested
1a. Maintain the stocks above ecologically sustainable levels for both species
1a (i) Conduct annual risk of overfishing assessment for each high and medium importance spatial assessment units (SAUs)
1a (ii) Develop specific management strategies for individual SAUs, as necessary, following scientific assessment
1a (iii) Set the TACC annually, in accordance with the harvest strategy
1a (iv) Ensure management strategies for the commercial, recreational and Aboriginal traditional sectors limit the take of abalone to within sustainable levels and within sector allocations
1a (v) Adopt the Precautionary Principle when robust information is lacking to make an informed decision
Greenlip Abalone stocks
Blacklip Abalone stocks
Management effectiveness
Hourly catch rates of legal-sized abalone (CPUE) estimated from fishery-dependent logbook data
CPUE provide spatial and temporal indirect indices of abundance throughout the fishing grounds
Detailed in the harvest strategy
Total annual commercial catch as a component of the TACC
Under quota management, the spatial distribution of catches indicates variability in abundance
Detailed in the harvest strategy
Proportion of large abalone in the commercial catch
Proportion of large abalone in the commercial catch is proxy for exploitation rate
Detailed in the harvest strategy
Density of legal-size abalone estimated from fishery-independent surveys
Fishery-independent estimate of abundance of abalone provide an indicator of current biomass
Detailed in the harvest strategy
Density of sub legal-size abalone estimated from fishery-independent surveys
Fishery-independent estimate of abundance of abalone provides an indicator of future biomass
Detailed in the harvest strategy
Total mortality Length-frequency distributions of abalone collected by fishery-independent surveys are an important analytical tool for monitoring total mortality to assess exploitation rates
Detailed in the harvest strategy
1b. Ensure sufficient data and information to undertake harvest strategy and inform management decisions
1b (i) Collect fine-scale fishery-dependent data through commercial logbooks
1b (ii) Maintain a fisher-based shell measuring sampling program to collect data on the size distribution of the commercial catch
1b (iii) Collect meatweight data from processors
1b (iv) Conduct fishery-independent surveys to collect data on the population density and size distribution of abalone in high importance SAUs
1b (v) Assess status of Greenlip and Blacklip Abalone stocks using quantitative stock assessment techniques,the harvest strategy and structured, credible industry information
1b (vi) Review and update the strategic research and monitoring plan with the research provider periodically
1b (vii) Undertake periodic surveys to estimate the catch and effort of the recreational and traditional fishing sectors across the State
Research/ information
Catch and effort data provided by all commercial fishers for each day fished
Meatweight data provided for all Greenlip catches in the WZ
Fishery-independent surveys at key sites
Stocks assessed using harvest strategy and appropriate analytical techniques
Spatially- and species specific, catch and effort data provided by all commercial fishers for each day fished.
Meatweight grade data provided in three consistent grades.
Fishery-independent estimates of density and length frequency using lead-lines and timed swims
Harvest strategy and appropriate analytical techniques used to determine stock status
Essential data and information not collected
Meatweight data collected from processors
Meat weight is used to estimate the number of abalone caught
2. Optimum utilisation & equitable distribution of the abalone resource to the benefit of the community
2a. Maximise catches for both species within ecologically sustainable levels
2a (i) Set the TACC annually, in accordance with the harvest strategy
2a (ii) Ensure management strategies for the commercial, recreational and traditional sectors limit the take of abalone to within sustainable levels
Profit Hourly catch rates of legal-sized abalone estimated using fishery-dependent logbook data
Commercial fishers need to maximise catch rates in order to maximise economic efficiency

38
Goal Objective Strategy Addressing Risk Performance indicators Description Reference point
2b. Maintain a flow of economic benefit from fishery to the broader community
2b (i) Develop and implement management arrangements that allow commercial operators to maximise operational flexibility, economic efficiency and returns
2b (ii) Communicate sustainability and economic outcomes of the fishery to the broader community
Profit
Employment
Asset value
Gross Value of Product (GVP)
Gross Operating Surplus (GOS)
Profit at full equity
Licence value
Value of quota units
Economic rent
Return on capital
GVP is the total catch valued at the landed beach price. Used to determine whole fishery value.
GOS gives an indication of the capacity of the operator to remain in the fishery in the short to medium term.
Licence value is the market value of abalone licences, as determined by recent sale data.
Profit at full equity is a measure of the profitability of licence holders.
Economic rent is the difference between the price of a good produced using a natural resource and the unit costs of turning that resource into the good including the opportunity cost of capital.
Return on capital is the economic return to the total investment in capital items
Negative trend in one or more economic performance indicator for more than consecutive 3 years
2c. Provide equitable public access and recreational fishing opportunities.
2c (i) Maintain appropriate recreational size, bag, boat and possession limits
2c (ii) Monitor recreational catch and effort levels across the State every five years
Allocation Catch taken by the recreational fishing sector
>15% increase above allocation over 5 years
2d. Provide for Aboriginal traditional fishing access.
2d (i) Integrate any traditional fishing access prescribed in Aboriginal fishing management plans with the management of the commercial and recreational sectors
2d (ii) Provide fisheries management advice in relation to resolution of native title claims
Allocation Catch taken by the Aboriginal traditional fishing sector
>15% above allocation over 5 years
2e. Ensure sufficient economic information exists to make informed management decisions
2e (i) Undertake periodic economic surveys of the commercial fishery to assess economic performance against a set of economic indicators
2e (ii) Develop and implement methods to improve estimates of the total value of recreational fishing to regional economies and the broad community
Profit
Asset value
Research/ information
Access
Delivery of periodic economic surveys assessing economic performance of the fishery
2f. Shares of access to abalone stocks are explicitly allocated between commercial, recreational and the Aboriginal traditional sectors
2f (i) Allocate access to abalone resources to commercial, recreational and Aboriginal traditional sectors, in accordance with the Fisheries Management Act 2007
2f (ii) Develop mechanisms for adjusting shares in the future that utilise market tools, in accordance with the Fisheries Management Act 2007
2f (iii) Integrate any traditional fishing access prescribed in Aboriginal traditional fishing management plans with the management of the commercial, recreational and charter sectors
Allocation
Compensation (other agencies)
Access
Catches managed within allocations and changes in shares detected and acted on appropriately

39
Goal Objective Strategy Addressing Risk Performance indicators Description Reference point
3. Minimise impacts on the ecosystem
3a. Minimise fishery impacts on by-catch species and the ecosystem
3a (i) Maintain the current cap on the total number of licences used in the commercial fishery
3a (ii) Ensure new entrants to the fishery are adequately trained in capture of abalone
3a (iii) Promote adoption of industry codes of conduct
Water quality-oil discharge
Habitat disturbance
Broader environment
Use of biodegradable oils in shark cages.
Adherence to industry approved code of conducts
Adherence to industry approved codes of conduct ensures product quality is optimal and impacts to habitat disturbance, water quality and broader environment are minimised
Adherence with industry approved codes of conducts
3b. Avoid lethal interactions with endangered, threatened and protected species
3b (i) Ensure commercial data recording systems capture fishing interactions with endangered, threatened and protected species
3b (ii) Develop management measures to avoid interactions with threatened, endangered and protected species, where necessary
Threatened, endangered and protected species (TEPS)
Number of interactions with threatened, endangered and protected species
TEPS logbook data collection program Increasing trend in interaction rates over 3 year period.
3c. Minimise any external impacts on stocks associated with broader environmental health
3c (i) Monitor salinity patterns on Tiparra Reef and Cowell prior to, and after the installation of desalination plant
3c (ii) Request that waste-water strategies by BHP take into account impacts on abalone stocks (lethal doses)
3c (iii) Ensure aquaculture ventures minimise impacts on abalone stocks
Water quality Manage the impact of non-fishery impacts such as the desalination plant and aquaculture on the South Australian commercial Abalone Fishery
3d. Manage diseases and exotic pests to minimise impacts on abalone stocks
3d (i) Continue to monitor the movement patterns of AVG virus and Perkinsus spp
3d (ii) Improve coordination between Government agencies responsible for biosecurity and natural resource management
3d (iii) Encourage the adoption of the principles outlined in the Emergency Response Plan for AVG
Biological-diseases
Follow PIRSA Disease Contingency Plan in the event of an outbreak
4. Cost effective and participative management of the fishery.
4a. Promote cost-effective and efficient management of the fishery, in line with government’s cost recovery policy.
4a (i) Develop and implement management arrangements that are effective at achieving management objectives whilst minimising costs
4a (ii) Determine and discuss the real costs of management, research and compliance for the fishery on an annual basis
4a (iii) Recover licence fees from commercial licence holders, sufficient to cover the attributed costs of management, research and compliance of the fishery, in accordance with the Government‘s cost-recovery policy
4a (iv) Explore methods for all stakeholders to share management costs
4a (v) Influence other management processes that impact on access security
Management effectiveness
Economic drivers
Access
Cost of management services
Cost of licence fees
GVP
Costs of biological monitoring and reporting, policy, regulation and legislation development, compliance and enforcement services, licensing services and research.
To achieve the objective of full cost recovery, licence fees are set a level sufficient to recover the costs of managing the fishery that are attributable to the commercial sector
Commercial licence fees greater than 10% of GVP
4b. Ensure management arrangements reflect concerns and interests of the wider community.
4b (i) Promote stakeholder input to the management of the fishery, through co-management processes and communication strategies
4b(ii) Develop a tailored co-management approach for the fishery
4b (iii) Ensure that social and cultural issues are given appropriate consideration when new management strategies are being developed
4b (iv) Communicate management arrangements to the wider
Management effectiveness

40
Goal Objective Strategy Addressing Risk Performance indicators Description Reference point
community
4c. Management arrangements complied with.
4c (i) Undertake periodic compliance risk assessment
4c (ii) Review management and compliance arrangements for the fishery, as required
4c (iii) Investigate ways to better quantify illegal, unregulated and unreported catch of abalone
4c (iv) Develop and implement clear management arrangements that promote voluntary compliance and assist with successful enforcement
4c (v) Encourage the community to report offences to the Fishwatch number
Greenlip stocks
Blacklip stocks
Compliance risk assessment undertaken on an annual basis
Number of prosecutions
Increasing trend in prosecutions over 3 year period

41
9 HARVEST STRATEGY
9.1 Management Implications of abalone fisheries ecology
The ecology of abalone has important implications for the management of abalone fisheries and must be considered when developing a harvest strategy. Abalone do not have a single freely mixing ―unit‖ of stock assumed by many fisheries management models. Instead they are comprised of many (10s-100s) relatively independent and variable self-recruiting units, or meta-populations (Prince 2005; 2006; Mayfield and Saunders 2008; Miller et al. 2008). The resilience of these meta-populations to fishing pressure is highly variable. Large, highly productive meta-populations tend to be much more resilient to fishing pressure than small, unproductive ones. Furthermore, fishing pressure is applied differentially across meta-populations. Divers tend to fish the most attractive areas first, according to a sliding scale of preferences evaluated primarily on the basis of proximity, accessibility, safety and profitability (Prince 2005; 2006). Previously, the response of management to the spatially complex population structure of abalone and diver behaviour has been to increasingly regionalise the management of the fishery, such as the introduction of a growing number of zonal size limits and catch limits. Challenging this trend is the escalating level of government resources required to reliably monitor and assess stock abundance, and to enforce catch levels and MLLs, across a proliferating number of meta-populations within each zone (Prince 2005; 2006; Prince et al. 2008; Saunders and Mayfield 2008). Against this backdrop, it is important to implement a process to prioritise the management and research focus.
9.2 Principles of the abalone harvest strategy
The four underlying principles adhered to in the development of the abalone harvest strategy are:
effective delivery on stock sustainability outcomes;
understandability and practicality for fishery managers and stakeholders to apply;
effective engagement of key stakeholders in the decision-making process; and
cost-effectiveness. The expected benefits of a harvest strategy that delivers on all of these principles are:
the development of transparent objective harvest decision rules;
a clear assignment of assessment of stock status;
an improved process for collaboration between PIRSA Fisheries & Aquaculture, SARDI Aquatic Sciences and representatives from the abalone industry;
a framework for effectively integrating industry information; and
greater confidence in decision making (through application of the decision rules).
9.3 Spatial scale of fishery management
The South Australian Government has management jurisdiction for abalone from the low water mark out to three nautical miles. It also has jurisdiction from three nautical miles out to the edge of the Australian Fishing Zone (200 nautical miles) under an Offshore Constitutional Settlement (OCS) agreement between the South Australian and Commonwealth governments.

42
Since 1971, the commercial sector of the South Australian Abalone Fishery has been managed as three separate fishery management zones known as the Southern, Central and Western Zone Abalone fisheries. The Southern Zone Abalone Fishery includes all coastal waters of South Australia between meridian 139°E and the South Australia/Victoria border, with the exception of the Coorong and waters inside the mouth of the Murray River (Fig. 1). The Central Zone Abalone Fishery consists of all coastal waters of South Australia between the Meridians 136°30‘E and 139°E, while the Western Zone Abalone Fishery consists of all coastal waters of South Australia between the Western Australia/South Australia border and Meridian 136°30‘E (Fig. 1). Although the management arrangements in these three fishery management zones have evolved independently since their separation in 1971, all three have subsequently been subdivided into smaller management units:
(1) the Western Zone Abalone Fishery is sub-divided into Region A (Meridian 133°50.8‘E to 136°30‘E) and Region B (between Western Australia/South Australia border and Meridian 133°50.8‘E), both of which are managed separately;
(2) the Central Zone Abalone Fishery includes a small sub-Zone adjacent to Cowell, an area of ~25 km2, which is managed separately; and
(3) the collection of Blacklip Abalone in the Southern Zone Abalone Fishery is sub-divided into non-fishdown areas and four fishdown areas (Area S).
Within these fishery management zones, there are some aquatic reserves, which have prohibitions and restrictions on what species can be taken, including abalone. The locations and coordinates of the State‘s aquatic reserves are provided in the Fisheries Management (Aquatic Reserves) Regulations 2008 or on the PIRSA Fisheries & Aquaculture website (www.pir.sa.gov.au). The taking of abalone is also prohibited from intertidal reef areas. The basic concept of the abalone harvest strategy is that it will efficiently utilise the available information (research and industry) to make harvest decisions at a finer spatial scale to ‗build‘ a TACC for the each fishery management zone. It does not represent a move to finer spatial management. Once a TACC is determined for the zone, licence holders will maintain the flexibility of where they catch their allocation of abalone quota within that fishery management zone. Where the intent is to introduce fine scale spatial management, such as the Southern Zone Abalone fishery, the same harvest strategy will facilitate finer spatial scale management.
9.4 Framework for annual decision-making process
This management plan provides a structured framework for decision making that takes into account the complex spatial structure of both stock and fishing pressure and ensures the Ecologically Sustainable Development objective of the Fisheries Management Act 2007 is followed. The framework is based on a set of risk management criteria that have been developed specifically to provide for management at appropriate spatial scales.

43
This decision-making framework comprises of three main phases (monitoring, assessment and harvest decision rules) that can be broken down into the following eight steps (Figure 16): Monitoring phase
1. Identify spatial assessment units (SAUs);
2. Undertake research program to collect information on performance indicators (PIs);
Assessment phase
3. Determine relative importance of SAUs (relative to total catch of all abalone);
4. Determine the likelihood that each high and medium importance SAU is overfished;
5. Industry to provide structured input for each high and medium importance SAU;
Harvest decision rules phase
6. Consider scientific assessment and industry input to apply harvest decision for each high and medium importance SAU (within bounds of scientific risk assessment);
7. Sum harvest decisions across all SAUs to determine TACC; and
8. Formally recommend TACC – biannual, with annual monitoring
Fig. 16 The three main components of the abalone harvest strategy. Abbreviations: SAUs, spatial assessment units; PIs, performance indicators; TACC, total allowable commercial catch.
These eight steps will be applied separately to each class of abalone in each fishery management zone (e.g. Greenlip Abalone in the Central Zone, both species combined for Western Zone Region B, non-fishdown Blacklip Abalone in the Southern Zone, etc.), unless specified otherwise.

44
9.4.1 Monitoring Phase
9.4.1.1 Identify SAUs
This harvest strategy will be undertaken at the spatial scale of ―spatial assessment units (SAUs)‖. These units comprise single or multiple mapcodes that are intended to reflect abalone meta-populations. In some cases (e.g. Western Zone Region B), limited data require the amalgamation of additional mapcodes such that the SAUs in these parts of the fishery are larger than elsewhere, and likely encompass multiple abalone meta-populations. While SAUs are unlikely to be different for each class of abalone within a fishery management zone or subjected to long-term modifications, there may be some modification associated with the first application of the harvest strategy. At the time of preparing this management plan, there were a total of 60 SAUs identified across all three fishery management zones, i.e. 30 SAUs identified for Region A of the Western Zone, 4 for Region B of the Western Zone, 11 for the Central Zone and 15 for the Southern Zone (Section 19.3). In comparison to the >200 mapcodes across all three fishery management zones, application of the harvest strategy at the scale of SAUs will be less cumbersome and reduce complexity of assessment.
9.4.1.2 Collection information on performance indicators
Up to six performance indicators (PIs) – three based on fishery-dependent data and three based on fishery-independent data – will be used to measure fishery performance for each class of abalone in the harvest strategy. SAUs of high importance (see below for determining level of importance) will be assessed against all six PIs, whereas medium importance SAUs will only be assessed using the three fishery-dependent performance indicators. Low importance SAUs are not assessed in this harvest strategy. The fishery-dependent performance indicators used to measure fishery performance for both high and medium importance SAUs are:
1. Catch – expressed as % of the TACC;
2. %Large (or %Grade1, where graded) – proportion of large abalone in the commercial catch; and
3. CPUE – catch per unit effort (kg.hr-1).
The fishery-independent performance indicators used to measure fishery performance for high-importance SAUs only are:
4. Densitylegal – density of legal-sized abalone observed on fishery-independent surveys;
5. Densitypre-recruit – density of pre-recruit abalone (i.e. those individuals that would be expected to grow to legal-size over the next two years) observed on fishery-independent surveys; and
6. Z – total mortality, determined from the length-structure of legal-sized abalone observed on fishery-independent surveys.

45
These performance indicators have been chosen because they provide direct measures of abalone abundance and/or exploitation rates and they are independent. All performance indicators are weighted similarly. If better indicators of fishery performance become available during the life of this plan, the suite of performance indicators used and associated weightings will be reconsidered.
9.4.2 Assessment phase
9.4.2.1 Determine relative importance of SAUs
The importance of each SAU for each class of abalone in each fishery management zone is based on the relative contribution to the total catch from that fishery management zone (e.g. for Central Zone, the combined Greenlip Abalone and Blacklip Abalone catch). As the spatial distribution of catch can vary among SAUs between years, importance is based on the mean catch for the most recent decade, inclusive of the year being assessed (i.e. the current year). Three importance categories are defined – high, medium and low – based on the percentage contribution to total catch. While the boundaries between high, medium and low importance SAUs differ among zones, due to the number of SAUs and their relative importance, general rules apply. First, across all classes of abalone within a fishery management zone, those SAUs that contribute at least 50% of the total catch are deemed to be of high importance (Fig. 17). Second, across all classes of abalone within a fishery management zone, those SAUs that contribute to at least the next 30% of the total catch are designated medium importance. The remaining SAUs are classified as being of low importance. Thus, those SAUs categorised as either high or medium importance make up greater than 80% of the total catch for all classes of abalone in the fishery management zone.
Fig. 17 An example for determining relative importance of each SAU. Note: each SAU is ranked twice, once for Greenlip Abalone and once for Blacklip Abalone.

46
9.4.2.2 Determine scientific status category for high and medium importance SAU
(a) Scoring for each performance indicator Where applicable, each performance indicator for each class of abalone in each high and medium importance SAU is scored based on the value of the performance indicator relative to four reference points derived from historical data for that performance indicator (the reference period). Four reference points are used for scoring (Fig. 18):
1. Upper limit reference point (ULRP)-defined as the 3rd highest value (i.e. top 10%) of the reference period;
2. Upper target reference point (UTRP)-defined as the 6th highest value (i.e. top 25%) of the reference period;
3. Lower target reference point (LTRP)-defined as the 6th lowest value (i.e. bottom 25%) of the reference period; and
4. Lower limit reference point (LLRP)-defined as the 3rd lowest value (i.e. bottom 10%) of the reference period.
Fig. 18 Schematic showing the reference period (grey bars) and associated reference points, the year being assessed (orange bar), and the scores applied to measure fishery performance. ULRP, UTRP, LTRP and LLRP refer to upper limit reference point, upper target reference point, lower trigger reference point and lower target reference point, respectively.
Assigned scores range from -2 to +2 (Fig. 18):
A score of -2 is assigned if the value of the performance indicator is smaller than the LLRP
A score of -1 is assigned if the value of the performance indicator is between the LLRP and the LTRP
A score of 0 is assigned if the value of the performance indicator is between the LTRP and the UTRP
A score of +1 is assigned if the value of the performance indicator is between the UTRP and ULRP
A score of +2 is assigned if the value of the performance indicator is greater than the ULRP.

47
Each performance indicator has a score that is derived from two performance measures (or scores), one score for the current year‘s performance, and the other score for recent years‘ performance. These are summed to provide a single score for each performance indicator. The score for the current year reflects the current value of the performance indicator, relative to the 20-year reference period and associated reference points. To determine the score for recent status, consecutive scores, up to three previous years, for values that remain outside the UTRP-LTRP band are summed. Thus, in combination, values for up to the last four years are used to determine the score of each performance indicator for each class of abalone in each SAU. Based on the example provided in Figure 18, a score of +2 is allocated for 2010 and a score of +1 is allocated for 2009. Consequently, the total score for the performance indicator in that example would be +3. Note that, with this scoring system, no further scores are allocated (going backwards in the annual time series) in the following situations, whichever comes first:
Once any of the last four years fall within the LTRP-UTRP range; or
Once any of the three years being scored for ―recent performance‖ fall outside of the LTRP-UTRP range but on the opposite side to the current year.
(b) Exceptions to the performance indicator scoring system
Where direct information for setting a quota is available, e.g. biomass surveys for Cowell, this information will be used to set the quota, obviating the need for scientific assessment using the performance indicators identified above. Where insufficient data exists for estimating CPUE or legal density from fishery-independent surveys in high importance SAUs, or for estimating CPUE in medium importance SAUs, those SAUs will be assessed as ―undefined‖. When catches in medium importance SAUs rise to a level that places that SAU into the high importance category, there is unlikely to be any fisheries-independent information available for that SAU. Consequently, these SAUs will continue to be assessed using fisheries-dependent information only, until such time that fisheries-independent information can contribute meaningfully to the assessment of fishery performance (~5 data points in the reference period). From 2012, the lack of representative commercial length frequency data will be given a score of -1. This score will not be cumulative or applied retrospectively. Prior to 2012, this will be scored as 0.
9.4.2.3 Combining performance indicator scores to determine risk of overfishing
Determining the risk of overfishing for a class of abalone in each SAU of medium and high importance comprises two steps. First, the scores for each performance indicator PI are summed to provide a total score for that SAU. Second, that total score is converted to one of five colour-coded categories using a probability distribution, which describes the likely risk of that class of abalone in that SAU being overfished (Fig. 19). These colour-coded categories are linked with the application of harvest decision rules at the SAU scale.

48
Fig. 19 Histograms showing the probability distributions of obtaining total scores across (a) 6 performance indicators (PIs) for spatial assessment units (SAUs) of high importance and (b) 3 PIs for SAUs of medium importance (distribution generated by Monte Carlo simulations, n = 5000). The numbers next to the bars indicate the probability (as a %) of obtaining that total score by chance alone.

49
9.4.2.4 Determining zonal stock status
The stock status for each class of abalone in each fishery management zone is derived from a combination of the risk of overfishing determined for each SAU for that class of abalone and the importance of that SAU, by catch, to the zone. Thus, the most important SAUs provide the greatest contribution to zonal status.
Zonal stock status is determined in five steps:
1. Scores for each SAU for a class of abalone are assigned to the risk of overfishing category, as follows: -2 for RED, -1 for YELLOW, 0 for GREEN, +1 for BLUE and +2 for LIGHT BLUE;
2. The proportional contribution of each high and medium importance SAU to the combined catch from each high and medium SAU is determined (catches from low importance SAUs are ignored in this calculation);
3. The stock status score (-2 to +2) for each SAU is multiplied by their proportional contribution to the combined catch;
4. The values determined at step 3 are summed to provide a catch-weighted score for zone status that ranges between -2 and +2; and
5. Specified boundaries are used to place the score obtained at step 4, and hence the zone, into one of five stock status categories, i.e. depleted (score ≤ -1.5), over fished (-1.5 < score ≤ -0.5), sustainably fished (-0.5 < score ≤ +0.5),under fished (+0.5 < score ≤ +1.5.5) and lightly fished (score > +1.5)
9.4.2.5 Incorporation of industry information
At the time of preparing this harvest strategy, structured industry input was in the early stages of being developed. The development and incorporation of industry‘s assessment of abalone stocks into stock status and assessment reports has recently been identified as a high research priority for the South Australian commercial Abalone Fishery. As such, PIRSA Fisheries & Aquaculture and SARDI Aquatic Sciences will support the development of industry input over the first two to three years of this management plan being implemented, with the view that it will, in future, have a greater role in the risk of overfishing assessment process of the harvest strategy. Prior to that, industry input will predominately be used to inform harvest decision rules.
9.4.3 Harvest decision rules phase
9.4.3.1 Apply harvest decision to each SAU
Once the risk of overfishing has been determined by the scientific assessment, and structured industry input has been prepared, the management committee for each zone (comprising representatives from industry, PIRSA Fisheries & Aquaculture and SARDI Aquatic Sciences) will hold a workshop to develop a recommendation to the Minister for the following year‘s TACC. At this workshop, the management committee will determine, for each high, medium and low importance SAU, the appropriate harvest decision within the bounds of the scientific status categories (Table 9). The harvest decision to be made for each SAU is the percentage change between its contribution to the total catch and its contribution towards developing the next TACC. For example, if the catch of Greenlip Abalone from a SAU contributed 10% to the total catch taken over the last four years, and that SAU is determined to be in the ‗BLUE‘ status category, a final harvest decision of 20% increase to that SAU alone would result in a 2% increase to 12% (i.e. 20% of 10%) to the next TACC.

50
In determining the final harvest decision for each high and medium SAU, the management committee will consider the structured industry input and advice from PIRSA Fisheries & Aquaculture, SARDI Aquatic Sciences, the recreational sector, conservation bodies and any other relevant stakeholder, within the range determined by the scientific risk assessment. For SAUs classified as ―undefined‖ or of low importance, the harvest decisions will be based on a synthesis of the available scientific and industry information.
Table 9 Range of harvest decision rules in relation to the risk of overfishing identified by the scientific assessment.
Status category Harvest decision rules (% change in catch contribution)
RED At least 30% reduction
YELLOW 10-30% reduction
GREEN 10% reduction to 10% increase
BLUE Up to 30% increase
LIGHT BLUE Up to 50% increase
9.4.3.2 Sum harvest decisions across all SAUs to determine TACC
The TACC is determined as the sum of harvest decisions across all SAUs (see Section 19.4-Appendix 4 for a working example). Once the management committee has systematically determined the appropriate harvest decision for each high, medium and low importance SAU, the resulting percentage change, from the harvest decision, is applied to the percentage contribution that each corresponding SAU made to the total catch taken over the last four years (Section 19.4 Appendix 4, col H = col C + (col G * col C)). This calculation yields the contribution (also expressed as a percentage) of each high and medium SAU toward the next TACC (Section 19.4 Appendix 4, col H). The results of the decision rules are summed across all SAUs within a fishery management zone to determine whether there is a net change from the TACC for the previous year. To avoid the need to implement small changes to the TACC from one year to the next, and thereby incorporating stability in the process, the TACC will not be changed unless the revised TACC differs from the current TACC by greater than 10%. In exceptional circumstances, smaller increases and decreases in the TACC may be implemented. Based on the application of the decision rules of the harvest strategy and the aggregate of these actions, the management committee shall recommend the zonal TACC to the Minister for Fisheries. Final determination of the zonal TACC is subject to approval by the Minister for Fisheries.

51
Since abalone stocks are unlikely to demonstrate a response to changes in TACC (or other management arrangements) within 12 months of a change in TACC, the harvest strategy will be undertaken as part of a full stock assessment every two years for each class of abalone. This also implies that the TACC will be determined biannually. In alternate years, performance indicators for high and medium importance SAUs will continue to be monitored and zonal status determined (through production of a performance indicator/status report) to ensure there is the ability to respond, where necessary. During these alternate years, the management committee will still convene and formally recommend a TACC to the Minister. If the category of zonal status changes, the management committee will adhere to the full abalone harvest strategy in recommending a new TACC.
9.4.3.3 Protection for the most vulnerable SAUs
SAUs categorised as RED are the most vulnerable to overfishing. Subsequently, in addition to a minimum 30% reduction in the catch contribution, the necessity of additional management arrangements for these SAUs (to minimise their risk to overfishing) will be discussed in consultation with industry.

52
10 EXPLORATORY AND DEVELOPMENT FISHING
10.1 Permits for research fishing
Some research activities are undertaken as part of a commercial enterprise, where the fish caught as part of the research fishing are sold for the purposes of funding the research. Regulations under the Fisheries Management Act 2007 have provisions to issue permits for research activities with a commercial element. Other non-commercial research activities are authorised by exemption. Broodstock and seedstock collection is the taking of aquatic resources or part of resources for the purposes of commercial aquaculture. Only low levels of this type of activity are permitted. Large scale collection must be done under a fishery licence by arrangement between a fishery licence holder and aquaculture licence holder on a commercial basis. If the species is part of an existing commercial fishery, broodstock and seedstock collection activities are now managed through a permit system under the Act.
10.2 Exploratory and development fishing
Applications for exploratory and developmental fishing for species that are not part of South Australian commercial Abalone Fishery are dealt with under the Exploratory and Developmental Fishing Policy. Exploratory and developmental fishing for species that are part of the South Australian commercial Abalone Fishery in the area of the fishery, are dealt with under this plan.

53
11 STOCK ASSESSMENT AND RESEARCH
11.1 Research services
PIRSA Fisheries & Aquaculture contracts research services for each fishery. SARDI Aquatic Sciences is currently the primary research provider for core research for the South Australian commercial Abalone Fishery. The Commonwealth Fisheries Research and Development Corporation (FRDC) provides funding for specific research projects. In order to gain access to such funds, States contribute the equivalent of 0.25% of the value of fisheries production (average over the preceding three years). South Australia's contribution for 2011/12 was in the order of $643,682, which was collected from licence holders on a fishery Gross Value of Production basis, as part of their license fee. Although FRDC is the major source of funding for fisheries and aquaculture research and development, other sources of funding are available. These include the Australian Research Council; AusIndustry and Australian Fisheries, Forestry and Agriculture, through Agriculture Advancing Australia.
11.2 Data collection and analysis
11.2.1 Fishery-dependent data The primary source of data used for stock assessment is fishery-dependent. Fishery-dependent data for both Blacklip and Greenlip Abalone have been collected on a regular basis since 1968, using a commercial logbook program. This program requires all commercial fishers to record daily information on fishing area, the amount of time spent fishing, whether or not an underwater vehicle was used, the diving depth and the total catch of each species landed (Mayfield et al. 2008). These data are submitted to SARDI Aquatic Sciences at the end of each month, where they are entered into a database. Information collected through the logbook program is periodically reviewed to ensure data collection meets management and research needs. The most notable change to the data collection system was made in 1978, when sub-zones and fishing blocks were replaced by spatially smaller map numbers (=fishing areas) and map codes. Fishing areas and map codes vary in size, from reef level to much larger areas encompassing multiple reef complexes. In 2007, PIRSA Fisheries & Aquaculture implemented a generic data recording logbook for wildlife interactions (including threatened, endangered and protected species – TEPS) for all South Australian commercial fisheries. The TEPS logbook was implemented to ensure consistent reporting practices for interactions with TEPS and to fulfil the requirements under the Environmental Protection and Biodiversity Conservation Act 1999, as well as addressing the recommendations made by Australian Government Department of Sustainability, Environment, Water, Population and Communities (SEWPaC) for South Australian commercial fisheries export approval. PIRSA Fisheries & Aquaculture currently contracts SARDI Aquatic Sciences to collect and archive the data from the TEPS logbooks and summarise them in an annual report.

54
11.2.1.1 Shell measuring sampling program
Measurements of individual lengths of abalone in the commercial catch have been obtained periodically. These measurements provide information on the size structure of the catch. The irregular sampling of commercial catches has impeded the ability to detect and quantify temporal changes in the size structure of commercially fished abalone and a more rigorous program is currently being implemented across the fishery.
11.2.2 Fishery-independent data Two types of fishery-independent surveys have been undertaken by SARDI Aquatic Sciences (and the former Department of Fisheries) to monitor changes in abalone abundance and population structure. The first, termed the ―timed-swim‖ method, has been undertaken at various sites throughout South Australia since 1968. This type of survey provides information on temporal changes in the relative abundance and length structure of populations. The second, termed the ―leaded-line‖ method (McGarvey 2006; McGarvey et al. 2008), has the primary objective of measuring absolute density, from which the total biomass can be quantified, within pre-defined and bounded survey regions (Mayfield et al. 2008). Leaded-line surveys been used since 2002 in places such as Anxious Bay in the Western Zone and Cowell in the Central Zone. Data on recreational catch and effort levels will also be taken into account when assessing the performance of the fishery through stock assessment. The two main sources of survey data used for this sector will be that provided by the:
1. 2000/01 National Recreational and Indigenous Fishing Survey (Henry and Lyle, 2003); and
2. 2007/08 Survey of South Australian Resident Recreational Fishers (Jones 2009).
11.3 Reporting
The first assessment of the South Australian abalone resource was published in 1984 by the South Australian Department of Fisheries (Lewis et al. 1984). In 1996, the abalone research arrangements were comprehensively reviewed (Andrew 1996). Between 1998 and 2000, reports were produced on an annual basis. The 2001 stock assessment report was the first to provide fishery statistics for all three fishery management zones of the South Australian commercial Abalone Fishery (Mayfield et al. 2001). Stock assessments have been zone- and species-specific since 2002 and are subject to regular independent peer review. The frequency of the publication of the stock assessment reports varies with the region analysed, of which there are four (Southern Zone, Central Zone and Region A and B in the Western Zone). On average, they are published once every two years, with a status report typically produced in alternate years. The main aim of the stock assessments is to provide an evaluation of the performance of the fishery against key performance indicators and reference points outlined in the management plan and to provide an assessment of current stock status. To achieve this aim, three main data types are analysed. These are:
1. commercial catch and effort data are used to provide the spatial and temporal analyses of catch, effort and CPUE;
2. catch sampling from the commercial catch are obtained by measuring samples provided by commercial fishers; and
3. fishery-independent data on abundance and population size structure in key fishing grounds.

55
11.4 Strategic research plan
The strategic research and monitoring plan describes the research and monitoring requirements for the South Australian commercial Abalone Fishery to achieve the goals and objectives of this management plan. It is not intended to be a definitive list of all research needs for the fishery over the life of the plan. Research and monitoring projects in the plan are assigned priority.
‘Core’ research and monitoring is the highest priority and forms part of ongoing work programs.
‘Important’ research and monitoring is essential to support good decision-making in the fishery but is a once-off or periodic project that has not been commenced or is in progress.
‘Desirable’ research and monitoring is work that would be useful for improved decision-making in the fishery but is dependent on funding.
This management plan has implications for the way research is conducted. Previously, there was a 5-year rolling research and monitoring plan, when stock assessment of individual management zones alternated between years. Under this management plan, research and monitoring to assess the risk of overfishing in high and medium SAUs is categorised as core research. A summary of the proposed monitoring and reporting schedule for the research underpinning the management of the South Australian commercial Abalone Fishery for the period 2012/13 to 2015/16 is provided in Table 10.

56
Table 10 Proposed monitoring and reporting schedule for the research underpinning the South Australian commercial Abalone Fishery by fishery management zone and species for the 2012/13 to 2015/16 financial years.a
a
shading indicates activity. Green shading is for Greenlip Abalone and black shading is for Blacklip
Abalone. N/P denotes not planned as there are no SAUs currently classified as High in these fishery management zones

57
12 COMPLIANCE AND MONITORING
12.1 Objectives
PIRSA Fisheries & Aquaculture runs a compliance program that has dual objectives:
to maximise voluntary compliance with fisheries rules1; and
to create effective deterrence to breaching fisheries rules. These objectives are consistent with the National Fisheries Compliance Policy. Voluntary compliance is maximised through ensuring that fishers are aware of the rules that apply to their fishing activities, understand the rules and the purpose of those rules and operate in a culture of compliance. Effective deterrence is created through the presence of Fisheries Officers and awareness of compliance operations, as well as through detection and prosecution of illegal activity. 2
12.2 Cost recovery
The costs of the compliance program are funded in two ways. The costs attributed to the commercial sector are recovered from licence holders through licence fees. This is done in accordance with the government‘s cost recovery policy for fisheries. PIRSA Fisheries & Aquaculture and industry associations are involved in annual negotiations in relation to the proposed compliance program and associated costs. The costs attributed to non-commercial sectors are funded by the State Government from consolidated revenue.
12.3 Planning
PIRSA Fisheries & Aquaculture compliance programs are developed on an annual basis to:
support the fisheries management objectives for each fishery;
identify compliance risks in each fishery;
respond to key risks;
have an appropriate mix of tools designed to maximise voluntary compliance and create effective deterrence; and
establish benchmarks against which to measure responses to risks.
12.3.1 Risk assessment A compliance risk assessment is reviewed on an annual basis for each fishery. This assessment identifies and prioritises the compliance risks that exist in each fishery. Risks are ranked according to the likelihood and consequence of the risk occurring.
1 Rules include regulations, licence conditions, closure notices or any other enforceable instrument under
the Fisheries Management Act 2007. 2 Prosecution may include the issuing of a formal caution or an expiation notice, in addition to prosecution
through the courts.

58
The abalone compliance risk assessment is scheduled to be conducted in October/November each year, to align with the cost recovery process and inform the development and costs of the compliance program for the following financial year. The risk assessment process involves industry representatives and is designed to identify the key risks that the fishery is exposed to as a result of illegal activity. The risks are ranked based on a variety of factors including the current levels of non-compliance being observed or reported and the impact that this activity may have on the sustainability of the target species or the ecosystem.
12.3.2 Responses and benchmarks Compliance activities are planned to respond to the risks identified in the fishery, with an emphasis on the most serious risks. Responses must include measures aimed at both maximising voluntary compliance and creating effective deterrence. Benchmarks are established by which to measure compliance activities. These benchmarks are used to guide the allocation of resources in compliance planning.
12.3.3 Compliance plans Compliance plans are developed each year for the South Australian commercial Abalone Fishery based on the results of the risk assessment. This includes forecasts for the following two years.
12.4 Compliance status report
Every three years a report is to be prepared assessing the compliance status of the South Australian commercial Abalone Fishery. This report will:
describe the compliance program for the previous three years including an overview of activities and relevant statistics;
describe how the program has been implemented to achieve both voluntary compliance and create effective deterrence;
describe the risks that have been addressed as a priority over that period;
comment on any changes to the risk profile of the fishery during that period;
analyse the compliance status of the fishery (including information about intelligence reports received); and
make suggestions for future compliance planning.

59
13 REGULATORY ARRANGEMENTS Regulatory arrangements for the South Australian commercial Abalone Fishery are contained within the Fisheries Management (Abalone Fisheries) Regulations 2006 and Fisheries Management (General) Regulations 2007. Any amendments to the above regulations could change the regulatory arrangements listed in this section. Appropriate consultation will be undertaken should that occur. In relation to licences, the Minister reserves the right to amend licence conditions and entitlements for the South Australian commercial Abalone Fishery if required to meet sustainability objectives of the Fisheries Management Act 2007 and/or in this plan through the term of the plan. In addition, the Fisheries Council is currently undertaking a review of the rules and regulations under the Fisheries Management Act 2007 (the Rules Review) in order to standardise and simplify the number of rules imposed across all fisheries. The Minister reserves the right to amend licence conditions and entitlements as a result of the outcomes of the Rules Review, including the gear review component.
13.1 Licensing
Access to the South Australian commercial Abalone Fishery is provided through a licence. Licences are endorsed with quota units for either the Southern, Central or Western Zone. Under this management plan, licences will be issued for a period of ten years.
13.1.1 Issue of licenses Commercial access to the South Australian commercial Abalone Fishery is limited to a total of 35 commercial licences (Table 11). There are 23 licences in the Western Zone Abalone Fishery and 6 each in the Central and Southern Zones Abalone fisheries.
13.1.2 Registered masters A maximum number of three registered masters may be endorsed on a licence. The same masters that are currently registered and endorsed on the licence will also be endorsed on the Registrations and Entitlements register certificate, unless a new master is to be registered.
13.1.3 Registered boats
13.1.3.1 Use of boats for recreational fishing
Commercial boats may be used for recreational purposes if PIRSA Fisheries & Aquaculture is notified beforehand on 1800 065 522 and the following information is provided:
the name of the licence holder making the call;
the fishery licence number(s) of the licence(s) on which the registered boat is endorsed;
the name of the boat and the commercial boat registration number;
the recreational boat registration number of the boat;
the registration numbers of recreational devices (rock lobster pots or nets) that will be on board the boat;
the time and date the recreational activity will commence; and
the time and date the recreational activity will cease.

60
The boat must be registered for recreational use in accordance with Department of Transport, Energy and Infrastructure requirements. The commercial fishing boat registration number must be covered over while undertaking recreational fishing, and the recreational registrations numbers must be displayed instead, otherwise the boat will be deemed to be fishing commercially.
13.1.3.2 Surveying of boat
All commercial boats must be kept in survey. Fishery licences and boat registrations under the Fisheries Management Act 2007 do not replace the need to have the boat in survey under the Harbors and Navigation Act 1993.
13.2 Current management arrangements
13.2.1 Commercial fishery A summary of the current management arrangements in the South Australian commercial Abalone Fishery is shown in Table 11. One of the main tools used to manage the abalone resource is a quota management system. This system requires a TACC limit to be set every year in each management zone for both target species (see Table 11 for current TACCs). The catch each licence holder can take is directly related to the number of quota units endorsed on their licence. These are issued annually as separate entitlements, after the TACC has been set, and are fully transferable within zones. Temporary transfers are also permitted. A full description of how the quota allocation is calculated each year and subsequently allocated among licences can be found in the 2004 Management Plan (Nobes et al. 2004). MLLs also apply and vary from a minimum shell length of 110 mm SL for Blacklip Abalone in Area S of the Southern Zone to 145 mm SL for Greenlip Abalone in the Western Zone (Table 11).
Table 11 Summary of management measures for the commercial sector of the South Australian commercial Abalone Fishery in 2011*.
mw = meat weight; sw = shell weight; SL = shell length. FDA = fishdown area; Non
FDA = non fishdown area.
Management tool Southern Zone Central Zone Western Zone
Limited entry 6 6 23
TACC (t)
Greenlip 7.2 (sw) Non FDA Blacklip 99 (sw) FDA Blacklip 45 (sw)
Greenlip 47.7 (mw) Blacklip: 8.1 (mw)
Region A Greenlip 69 (mw) Blacklip 92 (mw) Region B Total 9.2 (mw)
Quota season 1 Sept. to 31 Aug 1 Jan. to 31 Dec. 1 Jan. to 31 Dec.
Minimum legal length (SL)
130 mm Greenlip 110 mm Blacklip (FDA) 125 mm Blacklip (non FDA)
130 mm Greenlip 130 mm Blacklip
145 mm Greenlip 130 mm Blacklip
* 2011 season for Southern Zone Abalone Fishery corresponds to September 2010 to August 2011

61
13.2.2 Recreational fishery The recreational sector is managed through of combination of output and input controls that ensure the total recreational catch is maintained within sustainable limits and that access to the fishery and fishing opportunities are equitably distributed between recreational participants. These regulations are outlined in Table 12 and include minimum legal lengths, a maximum daily bag limit and a daily boat limit of 10 abalone.
Table 12 Summary of management measures for the recreational sector of the South Australian Abalone Fishery.
Management tool Southern Zone Central Zone Western Zone
Minimum length 130 mm SL Blacklip
130 mm SL Greenlip
130 mm SL Blacklip
130 mm SL Greenlip
130 mm SL Blacklip
145 mm SL Greenlip
Daily boat limit 10 per day 10 per day 10 per day
Daily bag limit 5 per person per day 5 per person per day 5 per person per day
13.2.3 Aboriginal traditional fishery The State is currently engaged in ILUA negotiations with native title claimants. The agreements arising from these negotiation processes shall inform the management arrangements for the Aboriginal traditional fishing sector.
13.3 Fish processing
The Fisheries Management Act 2007 and the Fisheries Management (Fish Processor) Regulations 2007 set out the requirements for registration as a fish processor.
Licence holders are required to consign all abalone to a registered fish processor. Under the Fisheries Management (Fish Processor) Regulations 2007 there are two types of registrations – full registration and restricted registration. Registrations are granted to applicants on an annual basis. A full registration attracts a base fee plus a fee for authorisation to process specified species, including abalone. A restricted registration attracts a lesser annual fee. A full registration allows the holder to process, store or deal with fish for the purposes of trade or business subject to the requirements set out in the regulation, which include quota monitoring reporting and labelling requirements. A restricted registration allows a licence holder to only process fish taken pursuant to their own licence for the purpose of one of the following:
for sale to an unregistered fish processor;
for sale directly to the public (e.g. beach selling); and
for sale to a person who is supplying the fish to the public as part of a meal (e.g. to a pub or restaurant).

62
14 REVIEW OF PLAN Under the Fisheries Management Act 2007, management plans are subject to periodic review by the Fisheries Council. Section 49 of the Fisheries Management Act 2007 outlines the process of reviewing a management plan.
14.1 Section 49—Review of management plans
(1) The Council may review a management plan at any time.
(2) The Council must, as soon as practicable after the fifth anniversary of the commencement of a management plan, conduct a comprehensive review of the plan for the purpose of determining whether the plan should be amended, replaced or reinstated without amendment.
(3) The Council must submit a report on the outcome of a review under this section to the Minister within 12 months after the commencement of the review.
(4) The Minister must, within 12 sitting days after receiving a report under this section, cause copies of the report to be laid before both Houses of Parliament.
(5) If a report under this section recommends that a management plan should be reinstated without amendment on its expiry, the plan may be so reinstated without following the procedures set out in section 44.
(6) If a plan is to be reinstated under this section, the Minister must—
(a) adopt the plan; and
(b) cause notice of that fact to be published in the Gazette; and
(c) in the Gazette notice adopting the plan, fix a date on which the plan will take effect.
A review of the South Australian commercial Abalone Fishery Management Plan may be conducted at any time and a full review of this management plan will be conducted after 5 years of its operation. If new ideas and initiatives become available during the life of this management plan, they will be considered for incorporation into the management plan.

63
15 RESOURCES REQUIRED TO IMPLEMENT THE PLAN
15.1 Cost recovery - overview
South Australian commercial fisheries operate in accordance with the Government‘s cost recovery policy, which provides that the costs attributed to the management of the commercial fishery are recovered from industry. Therefore, the costs of policy development, research and compliance programs are 100% cost recovered through legislated licence fees. The costs attributed to non-commercial sectors are funded by government from consolidated revenue. The commercial abalone fishing industry, through its three representative bodies, has a high level of involvement in structuring the relevant policy, compliance and research programs in partnership with PIRSA Fisheries & Aquaculture and its service providers. This is an important facet of co-management in South Australia. The key dates for the annual schedule for cost recovery is shown in Table 13. Further details about the process for developing research and compliance programs are set out in Sections 11 and 12 of this management plan, respectively.
Table 13 Annual schedule for cost recovery in relation to commercial fisheries includes the following key dates.
Date Activity Parties
October Review long term objectives for fishery and update if necessary.
Identify priority outcomes for upcoming financial year.
PIRSA Fisheries & Aquaculture and industry association
November Develop policy, research and compliance work programs.
PIRSA Fisheries & Aquaculture
December/ January
Consult relevant industry associations in relation to proposed programs.
Industry associations to consult with wider industry.
PIRSA Fisheries & Aquaculture and industry association
February Formal meeting with industry associations to finalise work programs.
PIRSA Fisheries & Aquaculture and industry association
March-May
Finalise costs.
Submit proposed licence fees to Cabinet.
Amend regulations to prescribe new fees.
PIRSA Fisheries & Aquaculture and other government agencies
June Invoices sent for licence fees. PIRSA
15.2 Cost recovery – South Australian commercial Abalone Fishery
PIRSA Fisheries & Aquaculture collects licence fees from licence holders in accordance with the South Australian Government‘s cost recovery policy for the management of commercial fisheries. These fees are collected through a base licence fee and an additional fee per unit of quota endorsed on the licence, provided in the Fisheries Management (Fees) Regulations 2007.

64
16 REFERENCES
Andrew, N.L. (1996). Review of the South Australian Abalone Research and Management Plan. Report to PISA. 35pp.
Babcock, R. & Keesing, J. (1999). Fertilization biology of the abalone Haliotis laevigata: laboratory and field studies. Canadian Journal of Fisheries and Aquatic Science 56: 1668-1678.
Brown, L.D. & Murray, N.D. (1992). Population genetics, gene flow, and stock structure in Haliotis rubra and Haliotis laevigata. In: S.A. Shepherd, M.J. Tegner & S.A. Guzma del Proo (Eds.) Abalone of the world: biology, fisheries and culture. Proceedings of the 1st International symposium on abalone. Fishing News Books: Oxford, London. pp. 24–33.
Chick, R.C., Turich, N. Mayfield, S. and Dent, J.J. (2009). Western Zone Abalone (Haliotis laevigata and H. rubra) Fishery (Region A). Fishery assessment report for PIRSA. SARDI Aquatic Sciences Publication No. F2007/000561-2. SARDI Research Report Series No. 289. 90pp.
Day, R.W & Fleming, A.E. (1992). The determinants and measurement of abalone growth. In: S.A. Shepherd, M.J. Tegner & S.A. Guzma del Proo (Eds.) Abalone of the world: biology, fisheries and culture. Proceedings of the 1st International symposium on abalone. Fishing News Books: Oxford, London. pp. 141-168.
EconSearch (2011). Economic Indicators for the Commercial Fisheries of South Australia, Summary Report, 2009/010. Report prepared for Primary Industries and Resources South Australia, Adelaide. 61pp.
Fletcher, W.J., Chesson, J., Fisher M., Sainsbury, K.J., Hundloe, T., Smith, A.D.M. &. Whitworth, B. (2002) National ESD Reporting Framework for Australian Fisheries: The ‗How To‘ Guide for Wild Capture Fisheries. FRDC Project 2000/145, Canberra, Australia. 120pp.
Hancock, B. (2000). Genetic subdivision of Roe‘s abalone, Haliotis roei Grey (Mollusca: Gastropoda), in South-Western Australia. Marine and Freshwater Research 51:679–687.
Henry, G.W. & Lyle, J.M. (2003). The National Recreational and Indigenous Fishing Survey. Final Report to the Fisheries Research & Development Corporation Project No. 1999/158. 188pp.
Jones, K. (2009). 2007/08 South Australian Recreational Fishing Survey. South Australian Fisheries Management Series No. 55, PIRSA Fisheries, Adelaide. 84pp.
Lewis, R.K., Shepherd, S.A., Sluczanowski, P. & Rohan, G. (1984). An assessment of the South Australian abalone resource. South Australian Department of Fisheries. 59pp.
McShane, P.E. & Smith M.G. (1991). Recruitment variation in sympatric populations of Haliotis rubra (Mollusca: Gastropoda) in southeast Australian waters. Marine Ecology Progress Series 73: 203–210.

65
Mayfield, S., Rodda, K.R., Preece, P.A.G., Foureur, B.L. & Ward, T.M. (2001). Abalone. Fishery assessment report to PIRSA Fisheries Policy Group. South Australian Fisheries Assessment Series 01/02. 73pp.
Mayfield, S., Carlson, I. & Chick, R.C. (2008). Central Zone Abalone (Haliotis laevigata and H. rubra) Fishery. Fishery assessment report for PIRSA. SARDI Aquatic Sciences Publication No. F2007/000611-2. SARDI Research Report Series No. 306. 65pp.
Mayfield, S., Chick, R.C., Carlson, I.J. & Ward, T.M. (2011). Invertebrate dive fisheries can be sustainable: 40 years of production from a greenlip abalone fishery off southern Australia. Reviews in Fisheries Science, 19: 216-230.
Mayfield, S., Hogg, A., Saunders, T.M. & Burch, P. (2009). Southern Zone Abalone Fishery (Haliotis rubra & H. laevigata). Fishery Assessment Report for PIRSA. SARDI Aquatic Sciences Publication No. F2007/000552-2. SARDI Research Report Series No.350. 51pp.
Mayfield, S. & Saunders, T.M. (Eds). (2008). Towards optimising the spatial scale of abalone fishery management. Final report to the Fisheries Research and Development Corporation, Project No. 2004/019. SARDI Aquatic Sciences Publication No. F2008/000082-1. SARDI Research Report Series No. 273. ISBN 978-0-7308-5386-2. 148pp.
McGarvey, R. (2006). Assessing survey methods for greenlip abalone in South Australia. Final report to the Australian Fisheries Research and Development Corporation, Project N0. 2001/076. South Australian Research and Development Institute (Aquatic Sciences), Adelaide, Australia.
McGarvey, R., Mayfield, S., Byth, K., Saunders, T.M., Chick, R.C., Foureur, B.F., Feenstra, J.F., Preece, P.P. & Jones, A. (2008). A diver survey design to estimate density, biomass, and spatial distribution of abalone. Canadian Journal of Fisheries and Aquatic Sciences 65: 1931-1944.
Morgan, L.E. & Shepherd, S.A. (2006). Population and spatial structure of two common temperate reef herbivores: abalone and sea urchins. In: J.P. Kritzer & P.F. Sale (Eds) Marine Metapopulations. Academic Press: San Diego. pp. 205–234.
Miller, K.J., Maynard, B.T. & Mundy, C.N. (2008). Genetic diversity and gene flow in collapsed and healthy abalone fisheries. Molecular Ecology 200–211.
Nobes, M., Casement, D. & Mayfield, S. (2004). Management plan for the South Australian Abalone Fishery. South Australian Fisheries Management Series No. 42. 47pp.
PIRSA (2009). Ecologically Sustainable Development (ESD) Risk Assessment of the South Australian Abalone Fishery. Primary Industries and Resources, South Australia. 81pp.
Prince, J.D. (2005). Combating the tyranny of scale for Haliotids: micro-management for micro-stocks. Bulletin of Marine Science 76: 557-577.
Prince, J.D. (2006). Sustainability Requires Change to Allocated Property Rights: The story of Abalone. Sharing the Fish Conference 06. Allocation Issues in

66
Fisheries Management. Fremantle, Western Australia. 26 February – 2 March 2006.
Prince, J.D. (2008). Peeters, H., Gorfine, H. & Day, RW (2008). The novel use of harvest policies and rapid visual assessment to manage spatially complex abalone resources (Genus Haliotis). Fisheries Research 94: 330-338.
Prince, J.D., Sellers, T.L., Ford, W.B. & Talbot, S.R. (1988). Confirmation of a relationship between the localized abundance of breeding stock and recruitment for Haliotis rubra Leach (Mollusca: Gastropoda). Journal of Experimental Marine Biology and Ecology 122: 91-104.
Roberts, R. (2001). A review of larval settlement cues for abalone (Haliotis spp.). 4th International Abalone Symposium, Cape Town, South Africa, 6-11th February. Journal of Shellfish Research 20: 571-586.
Shepherd, S.A. (1988). Studies on southern Australian Abalone (Genus Haliotis). VIII. Growth of juvenile H. laevigata. Australian Journal of Marine and Freshwater Research 39: 177–183.
Shepherd, S.A. (2008). Abalone of Gulf St Vincent. In: S.A. Shepherd., S. Bryars., I.R. Kirkegaard., P. Harbison & J.T. Jennings (Eds). Natural History of Gulf St Vincent. Royal Society of South Australia, Adelaide. pp 448-455.
Shepherd, S.A. & Daume, S. (1996). Ecology and survival of juvenile abalone in a crustose coralline habitat in South Australia, Proceedings of an international workshop: survival strategies in early life stages of marine resources. A.A.Balkema Publishers, Brookfield USA. pp. 297-314.
Shepherd, S.A. & Turner, J.A. (1985). Studies on southern Australian abalone (genus Haliotis). VI. Habitat preference, abundance and predators of juveniles. Journal of Experimental Marine Biology and Ecology 93: 285-298.
Shepherd, S.A., Lowe, D. & Partington, D. (1992) Studies on southern Australian abalone (genus Haliotis) XIII: larval dispersal and recruitment. Journal of Experimental Marine Biology and Ecology 164: 247-260.
Shepherd, S.A. & Rodda, K.R. (2001) Sustainability demands vigilance: evidence for serial decline of the greenlip abalone fishery and a review of management. Journal of Shellfish Research 20: 829 - 841.
Stobart, B., Dent, J.J., Chick, Matthew, R.C.,and Mayfield, S. (2010). Western Zone Abalone (Haliotis laevigata and H. rubra) Fishery (Region B). Fishery assessment report for PIRSA. SARDI Aquatic Sciences Publication No. F2010/000389-1. SARDI Research Report Series No. 485. 23pp.
Zacharin, W. (1997). Management plan for the South Australian Abalone Fishery. Internal document, PIRSA Fisheries. 33pp.
Wells, F.E & Mulvay, P. (1995). Good and bad fishing areas for Haliotis laevigata: a comparison of population parameters. Marine and Freshwater Research 46: 591-598.

67
17 GLOSSARY These terms are intended to be used for the purposes of this management plan only and are not intended to be inconsistent with fisheries legislation. Adaptive management Management involving active responses to new information or the deliberate manipulation of fishing intensity or other aspects in order to learn something of their effects. Within a stock, several sub-stocks can be regarded as experimental units in which alternative strategies are applied. Allocation Distribution of the opportunity to access fisheries resources, within and between stakeholder groups. Aquatic reserve An area of water, or land and water, established as an aquatic reserve by proclamation under the Fisheries Act 1982. Bag limit The maximum number of a species that can be legally taken by a person per day or per fishing trip, as specified.
Benthic Describes animals that live on, in or near the substrate. Beach price Price received by commercial fishers at the "port level" for their catch, and is generally expressed in terms of $/kg. Processing costs are not included in the beach price, as processing operations are assumed to occur further along the value chain. The use of beach prices also removes the effect of transfer pricing by the firm if it is vertically integrated into the value chain. Biodiversity The variability among living organisms from all sources (including terrestrial, marine and other aquatic ecosystems and the ecological complexes of which they are a part) and includes: (a) diversity within species and between species; and (b) diversity of ecosystems. Biological reference point An indicator of the status of an exploited stock and a standard for comparison between years. Two types are often used when sufficient biological data are available: those based on fishing mortality and those based on the sustainability of recruitment. In data poor fisheries, other biological performance indicators related to estimates of relative biomass may be used (i.e. total catch and catch per unit effort). Reference points can be either desirable targets (target reference points) or minimum biologically acceptable limits (limit reference points). Biomass The total weight or volume of individuals in a fish stock. Boat Business Profit Defined as Gross Operating Surplus (GOS) less Depreciation less Owner-operator and Unpaid Family Labour. Boat Business Profit represents a more complete picture of the actual financial status of an individual firm, compared with GOS, which represents the cash in-cash out situation only. Boat Capital Capital items that are required by the licence holder to earn the boat income. It includes boat hull, engine, electronics and other permanent fixtures and tender boats. Other capital items such as motor vehicles, sheds, cold-rooms, and jetty/moorings can be included to the extent that they are used in the fishing business. The fishing licence/permit value is included in total boat capital.

68
Boat Cash Income Defined as Gross Operating Surplus less imputed wages for owner- operator and unpaid family labour. Boat Gross Margin Total Boat Income less Total Boat Variable Costs. This is a basic measure of profit which assumes that capital has no alternative use and that as fishing activity (days fished) varies there is no change in capital or fixed costs. Boat limit The maximum number of a species that can be legally taken by persons on a boat per day or per fishing trip, as specified. By-catch At a broad level, fisheries by-catch includes all material, living and non-living, other than targeted species which is caught while fishing. It includes discards (that part of the catch returned to the water) and also that part of the catch that is not landed but is killed as a result of interaction with fishing gear. By-product Non-targeted catch that is commercially valuable and retained by fishers. Catch The total amount (weight or number) of a species captured from within a specified area over a given period of time. The catch includes any animals that are released or returned to the water. Catch per unit effort (CPUE) The weight or number of a species caught by a specified amount of effort. Typically, effort units are defined using a combination of the following factors: gear type; gear size; the amount of gear; the amount of time the gear is used ; and the number of people operating the gear. CPUE is often used as an index of relative abundance in fisheries stock assessment. In modern assessments, CPUE is standardised to account for the diverse range of factors that can affect CPUE. Closures Prohibition of fishing during particular times or seasons (temporal closures) or in particular areas (spatial closures), or a combination of both. Cohort A group of fish spawned during a specified period, usually within a year. A cohort is also referred to as an age class. Co-management Arrangements between governments and stakeholder groups to allow joint responsibility for managing fisheries resources on a cooperative basis. Co-management arrangements can range from a consultative model, where stakeholders have an advisory role to government, to an informative model where co-managers have decision-making powers. Commercial fishing Fishing undertaken for the purposes of trade or business. Common property resource A resource that is determined to be owned by the community, or by the State on behalf of the community, and to which no individuals or user groups have exclusive access rights. Cost of management services Commercial fishery management services will generally include biological monitoring and reporting; policy, regulation and legislation development; compliance and enforcement services; licensing services; and research. Where a commercial fishery operates under full cost recovery, licence fees will be set to cover the cost of managing the fishery or at least the commercial sector‘s share of the resource. In fisheries where there is full cost recovery, it can be assumed that the cost of providing these management services to the commercial sector will be equal to the gross receipts from licence fees in the fishery. With information on licence fee

69
receipts, GVP, catch and the number of commercial fishers in the fishery, the following indicators can be readily calculated:
• aggregate licence fee receipts for the fishery ($) • licence fee/GVP (%) • licence fee/catch ($/kg) • licence fee/licence holder ($/licence holder)
Critical habitats Habitats that are crucial in at least part of the life cycle of a species, which typically includes nurseries such as estuaries, mangroves, seagrass beds, reefs and defined spawning areas. Data poor fishery A fishery where limited data are available to inform management. For example, fisheries for species where baseline biological data such as size at maturity, fishing mortality and growth rates are unknown. Depreciation Depreciation refers to the annual reduction in the value of boat capital due to general wear and tear or the reduction in value of an item over time. Ecologically sustainable development Using, conserving and enhancing the community‘s resources so that ecological processes, on which life depends, are maintained, and the total quality of life, now and in the future, can be increased. Economic efficiency The maximisation of the value of the net benefits derived from fishery resources. Ecosystem A dynamic complex of plant, animal, fungal, and micro-organism communities and the associated non-living environment interacting as an ecological unit. Effective fishing effort Measures of fishing effort (such as hooks per day of fishing) that have been standardised so that the measure is proportional to the fishing mortality rate that the gear(s) impose on the stock of fish. Management measures to limit effective effort imply that the fishing mortality rate is to be limited. Effort Amount of fishing taking place, usually described in terms of gear type and frequency or period during which the gear is in use; for example, 'hook-sets', 'trawl-hours', 'searching hours'. Fecundity Number of eggs an animal produces each reproductive cycle; the potential reproductive capacity of an organism or population. Fish An aquatic animal other than an aquatic bird, an aquatic mammal, a reptile or an amphibian. Fishery A term used to describe the collective enterprise of taking fish. A fishery is usually defined by a combination of the species caught (one or several), the gear and/or fishing methods used, and the area of operation. Fishery-dependent data Information collected about a fishery or fish stock by the participants of a fishery, eg. catch and effort information from fishery log sheets. Fishery-independent data Information collected about a fishery or fish stock by researchers, independent of the fishery, eg. scientific surveys, observer reports.

70
Fishing capacity The amount of fishing effort that a fishing boat, or a fleet of fishing boats, could exert if utilised to its/their full potential. Fishing mortality The rate of deaths of fish due to fishing. Fully-exploited This describes a fish stock for which current catches and fishing pressure are close to optimum (the definition of which may vary between fisheries; for example, catches are close to maximum sustainable yield). Categorising a species as 'fully fished' suggests that increasing fishing pressure or catches above optimum (allowing for annual variability) may lead to overfishing. Gear restriction A type of input control used as a management tool to restrict the amount and/or type of fishing gear that can be used by fishers in a particular fishery. Gross Operating Surplus (GOS) is defined as Total Boat Income less Total Boat Cash Costs and is expressed in current dollar terms. GOS may be used interchangeably with the term Gross Boat Profit. A GOS value of zero represents a breakeven position for the business, where TBCC equals TBCR. If GOS is a negative value the firm is operating at a cash loss and if positive the firm is making a cash profit. GOS does not include a value for owner/operator wages, unpaid family work, or depreciation. Gross value of production (GVP) Value of the total annual catch for individual fisheries, fishing sectors or the fishing industry as a whole, and is measured in dollar terms. GVP, generally reported on an annual basis, is the quantity of catch for the year multiplied by the average monthly landed beach prices. Growth overfishing A level of fishing pressure beyond that required to maximise the yield (or value) per recruit; a level of fishing where young recruits entering the fishery are caught before they reach an optimum marketable size. Habitat The place or type of site in which an organism naturally occurs. Harvest The total number or weight of fish caught and kept from an area over a period of time. Indicator species A species whose presence or absence is indicative of a particular habitat, community or set of environmental conditions. Individually transferable quota A management tool by which portions of the total allowable catch are allocated among licence holders (individual fishers or companies) as units of quota. Quota entitlements can be made to be temporarily or permanently transferable between these licence holders. Input controls Limitations on the amount of fishing effort; restrictions on the number, type, and size of fishing vessels or fishing gear, or on the fishing areas or fishing times in a fishery. Latent effort The potential for effective effort within a fishery to increase over time (i.e. inactive fishing licences that may be used in the future). Length frequency Arrangement of recorded lengths of a species, which indicates the number of times each length or length interval occurs in a population or sample.
71
Limited entry Fishing effort is controlled by restricting the number of operators. It usually requires controlling the number of licences in a fishery. It can also include restrictions on the number and size of vessels, the transfer of fishing rights, and the replacement of vessels
Logbook An official record of catch and effort data made by fishers.
Marine park In South Australia, marine parks are a type of marine protected area proclaimed under the Marine Parks Act 2007 with the primary aim of protecting and conserving marine biodiversity. South Australia‘s 19 marine parks will be zoned and managed for multiple use to protect and conserve marine biodiversity while proving for the ecologically sustainable use of suitable areas.
Minimum mesh size The smallest size of mesh permitted in nets and traps; imposed on the basis that smaller individuals will escape unharmed.
Mortality Rate of deaths (usually in terms of proportion of the stock dying annually) from various causes. Comprises (i) Natural Mortality - deaths in a fish stock caused by predation, pollution, senility, etc., but not fishing and (ii) Fishing Mortality - deaths in a fish stock caused by fishing.
Nominal fishing effort ‗Nominal‘ means quantities as they are reported, before any analyses or transformations. Nominal effort refers to measures of fishing effort or vessel carrying capacity that have not been standardised.
Non-target species Any part of the catch, except the target species, and including by-catch and by-product.
Non-retained species Species that are taken as part of the catch but are subsequently discarded, usually because they have low market value or because regulations preclude them from being retained.
Offshore Constitutional Settlement (OCS) An agreement between the State(s) and the Commonwealth whereby the State or the Commonwealth (or in some cases a Joint Authority) is given jurisdiction for a particular fishery occurring in both coastal waters and the Australian Fishing Zone. When no OCS agreement has been reached, the fishery remains under the jurisdiction of the State out to 3 nm, and the Commonwealth from 3 to 200 nm.
Output controls Limitations on the weight of the catch (quota), or the allowable size, sex or reproductive condition of individuals in the catch.
Over-exploited or overfished A fish stock in which the amount of fishing is excessive or for which the catch depletes the biomass too much; or a stock that still reflects the effects of previous excessive fishing.
Owner-operator and Unpaid Family Labour Many fishing businesses there is a component of labour that does not draw a direct wage or salary from the business. This will generally include owner/operator labour and often also include some unpaid family labour. The value of this labour needs to be accounted which involves imputing a labour cost based on the amount of time and equivalent wages rate. In the above calculations this labour cost can be included simply as another cost so that Gross Operating Surplus takes account of this cost. Alternatively, it can be deducted from GOS to give a separate indicator called Boat Cash Income. Owner-operator and unpaid family labour is separated into variable labour (fishing and repairs and maintenance) and overhead labour (management and administration).

72
Parameter A ‗constant‘ or numerical description of some property of a population. Parental stock The weight of the adult population of a species. Population A group of individuals of the same species, forming a breeding unit and sharing a habitat. Possession limit A possession limit under the Fisheries Management Act 2007 is the maximum number of fish that a person is allowed to have in their possession in certain circumstances. Possession limits can provide a useful tool to constrain recreational fishers from taking and stock-piling large quantities of fish. Precautionary principle This concept asserts that where there are threats of serious or irreversible damage, lack of full scientific certainty shall not be used as a reason for postponing measures to prevent environmental degradation. In the application of the precautionary principle, public and private decision-making should be guided by: (i) careful evaluation to avoid, wherever practicable, serious or irreversible damage to the environment; and (ii) an assessment of the risk-weighted consequences of various options. Profit at Full Equity Calculated as Boat Business Profit plus rent, interest and lease payments. Profit at Full Equity represents the profitability of an individual licence holder, assuming the licence holder has full equity in the operation, i.e. there is no outstanding costs associated with the investment in boat capital. Profit at Full Equity is a useful absolute measure of the economic performance of fishing firms. Quota A limit on the weight or number of fish that may be caught of a particular stock or from specified waters. Quota entitlement The proportion of a quota that is allocated to a particular licence, which limits the total amount of a species that is permitted to be taken pursuant to that licence. Rate of Return to Capital Calculated as Profit at Full Equity divided by Boat Capital multiplied by 100. This measure is expressed in percentage terms and is calculated for an individual licence holder. It refers to the economic return to the total investment in capital items, and is a useful relative measure of the performance of individual firms. Rate of return to capital is useful to compare the performance of various licence holders, and to compare the performance of other types of operators, and with other industries. Recreational fishing Fishing for a purpose other than trade or business, where the catch is released or used for personal consumption or taken for sport. Recruitment The addition of new individuals to a stock. Recruitment overfishing Occurs when excessive fishing effort or catch reduces recruitment to the extent that the stock biomass falls below the pre-defined limit reference point. Relative abundance An index of fish population abundance used to compare fish populations from year to year. This does not measure the actual numbers of fish, but shows changes in the population over time. Retained species The species within the catch that are not discarded.

73
Sample A proportion or a segment of a fish stock which is removed for study, and is assumed to be representative of the whole. The greater the effort, in terms of both numbers and magnitude of the samples, the greater the confidence that the information obtained is a true reflection of the status of a stock (level of abundance in terms of numbers or weight, age composition, etc.). Seasonal closure The closure of a fishing ground for a defined period of time, usually used to protect a stock during a spawning season. Selectivity The ability of a type of gear to target and catch a certain size or species of fish. Socio-economic Relating to both social and economic considerations. Spatial Of or relating to space. Species A group of organisms capable of interbreeding freely with each other but not with members of other species. Size limits A minimum or maximum size limit determines the legal size at which a given species can be retained. Size of maturity Length or weight of the fish when it attains reproductive maturity. Slot size limit Refers to a situation where both a minimum and maximum size limit has been determined for a given species. Stakeholder An individual or a group with an interest in the conservation, management and use of a resource. Stock A group of individuals of a species occupying a well defined spatial range independent of other groups of the same species, which can be regarded as an entity for management or assessment purposes. Stock assessment A detailed analysis of stock status (abundance, distribution, age structure, etc.) to support the management of the species/fishery. Target species The most highly sought component of the catch taken by fishers.
Target effort Effort that is directed at a particular species.
Total Boat Cash Costs (TBCC) Defined as Total Boat Variable Costs plus Total Boat Fixed Costs. Total Boat Fixed Costs Costs that remain fixed regardless of the level of catch or the amount of time spent fishing. As such these costs, measured in current dollar terms, are likely to remain relatively constant from one year to the next. Examples of fixed cost include:
• insurance • licence and industry fees • office & business administration (communication, stationery, accountancy fees) • interest on loan repayments and overdraft • leasing

74
Total Boat Income (TBI) Term refers to the cash receipts received by an individual firm and is expressed in dollar terms. Total boat income is calculated as catch (kg) multiplied by ‗beach price‘ ($/kg). Total boat income is the contribution of an individual licence holder to the GVP of a fishing sector or fishery. Total Boat Variable Costs Costs which are dependent upon the level of catch or, more commonly, the amount of time spent fishing. As catch or fishing time increases, variable costs also increase. Variable costs are measured in current dollar terms and include the following individual cost items:
• fuel, oil and grease for the boat (net of diesel fuel rebate) • bait • ice • provisions • crew payments • fishing equipment, purchase and repairs (nets, pots, lines, etc) • repairs & maintenance: ongoing (slipping, painting, overhaul motor)
Traditional fishing Fishing for the purposes of satisfying personal, domestic or non-commercial communal needs, including ceremonial, spiritual and educational needs and utilising fish and other natural marine and freshwater products according to relevant indigenous custom. Temporal Of or relating to time. Threatened A species or community that is vulnerable, endangered or presumed extinct. Total allowable catch (TAC) For a fishery, a catch limit set as an output control on fishing. The total amount of a species that may be taken during a specified time period. Total allowable commercial catch (TACC) For a fishery, a catch limit set as an output control specifically on commercial fishing. The total amount of species that may be taken by commercial fishing during a specified time period. Trigger points Events or measures that, if they occur or if they reach specified levels, are used to determine when a response should be made. Not usually used as a criterion for overfishing, but to indicate the need for review of management. Undecided A fish stock that may be underfished, fully fished or overfished, but for which there is inadequate information to make a reliable assessment of status. Under-exploited or under-fished A fish stock that has potential to sustain catches higher than those currently taken. Vulnerable species Under endangered species protection legislation, a species that within 25 years will become endangered unless mitigating action is taken. Yield Total weight of fish harvested from a fishery. Yield per recruit Analysis of how growth and natural mortality interact to determine the best size of animals for harvest.

75
18 ACRONYMS AFMA Australian Fisheries Management Authority
AIASA Abalone Industry Association of South Australia Inc
CDR Catch and Disposal Record
CPUE Catch Per Unit Effort
CSIRO Commonwealth Scientific Industry Research Organisation
DEWNR State Department of Environment, Water and Natural Resources
EPBC Act Environment Protection and Biodiversity Conservation Act 1999
EEZ Exclusive Economic Zone
ESD Ecologically Sustainable Development
FAO Food and Agriculture Organisation of the United Nations
FRDC Fisheries Research and Development Corporation
ITQ Individually Transferable Quota
MFA Marine Fishing Area
MPA Marine Protected Area
MSC Marine Stewardship Council
MEY Maximum Economic Yield
MSY Maximum Sustainable Yield
NRIFS National Recreational and Indigenous Fishing Survey
PIRSA Department of Primary Industries and Regions, South Australia
SARDI South Australian Research and Development Institute
TAC Total Allowable Catch
TACC Total Allowable Commercial Catch
TEPS Threatened, Endangered and Protected Species

76
19 APPENDICES
19.1 APPENDIX 1 – METHODOLOGY OF ESD RISK ASSESSMENT.
The current series of PIRSA ESD performance reports have been prepared to ensure that South Australian fisheries management is both effective and efficient in the context of achieving ESD outcomes. In addition to meeting the statutory requirements of the Fisheries Management Act 2007, and national environmental legislation, this approach will also provide the fishing industry, key stakeholders, and the broader community with an ongoing opportunity to contribute to, and influence, fisheries management outcomes. The reports will also provide the basis for the development of statutory management plans required under the Fisheries Management Act 2007. On behalf of the Fisheries Council of South Australia, PIRSA Fisheries & Aquaculture has used the comprehensive issue identification and subsequent risk assessment and priority setting process to collaboratively develop more effective management arrangements under the new Act. Where necessary this may include development of fishery specific harvest strategies, and related research and monitoring programs for each of the fisheries assessed. The issue identification, risk assessment, and reporting process described in detail below, as well as the final report format, is closely based on the National ESD Framework How To Guide (see www.fisheries-esd.com), as well as the Department of Fisheries Western Australia ESD performance reports pioneered by Dr Rick Fletcher and other WA Fisheries staff. Scope This ESD report describes ―the contribution of the South Australian commercial Abalone Fishery to ESD‖ in the context of South Australian Fisheries legislation and policy. The report is based on preliminary scoping and issue identification work by PIRSA Fisheries & Aquaculture staff in conjunction with industry representatives from the three different Abalone fisheries. This initial scoping was then refined and validated through a broader stakeholder workshop on 14 May 2009 facilitated by an independent fisheries consultant. The scope of the assessment was contained to issues relevant to the South Australian commercial Abalone Fishery. The recreational catch of abalone will be assessed separately through an ESD assessment of South Australian recreational fishing. The assessment process examined an extensive range of issues, risks and opportunities identified by stakeholders during various abalone workshops. The identification of issues was informed by the generic ESD component tree approach with each fishery component tree refined specifically for this fishery. Each major component tree reflects the primary components of ESD, and the ESD report assesses the performance of the fishery for each of the relevant ecological, economic, social and governance issues facing the fishery (see Table 14). The process also identifies where additional (or reduced) management or research attention is needed, and identifies strategies and performance criteria to achieve management objectives to the required standard.

77
Table 14 Primary Ecologically Sustainable Development (ESD) Components.
Overview The steps followed to complete this Abalone Fishery Report are detailed below: 1. A set of ―Generic ESD Component Trees‖ were modified through an iterative
process with stakeholders into a set of trees specific to the fishery. This process identified the issues relevant to ESD performance of the fishery under the categories described in Table 14 above.
2. A risk assessment of the identified issues (or components) was completed based
on the likelihood and consequence of identified events that may undermine or alternatively contribute to ESD objectives. This was an iterative process involving managers, scientists, industry and key stakeholders.
3. Risks were then prioritised according to their severity. For higher level risks -
where an increase in management or research attention was considered necessary - a detailed analysis of the issue, associated risks, and preferred risk management strategies was completed. For low risk issues, the reasons for assigning low risk and/or priority were recorded.
4. For higher level risks a full ESD performance report was prepared. This was
completed in the context of specific management objectives and includes operational objectives, indicators, data required, performance measures and preferred management responses.
5. A background report providing context and necessary supporting information
about the fishery was also prepared to guide the identification of issues, risks and management strategies. This report includes the history of the fishery and its management, the areas of operation and their biological and physical characteristics, target species and by-product and by-catch species, and other relevant information.
The process is illustrated in Figure 20.
Retained Species
Non-Retained Species Ecological Wellbeing
General Ecosystem
Community Wellbeing
Aboriginal Community Human Wellbeing
Governance
External Factors Affecting Ability to Achieve
Fishery Performance

78
Fig. 20 Summary of the Ecologically Sustainable Development (ESD) reporting framework processes (source: ESD Reporting How To Guide; Fletcher et al. 2002).
Issue Identification (component trees) The South Australian Abalone Fishery ESD reporting component trees are a refined version of the generic trees suggested in the National ESD Reporting Framework. The generic trees and the issues that they encompass were the result of extensive consideration and refinement during the initial development of the National Fisheries ESD approach. The trees were designed to be very comprehensive to ensure that all of the conceivable issues facing a fishery would be considered during the workshop process. The fishery specific component trees developed after expert and stakeholder consideration provide a more realistic and practical illustration of the issues facing a particular fishery. The generic component trees have been used as the starting point to ensure thorough, consistent, and rigorous identification and evaluation of ESD issues across all of the South Australia‘s fisheries being assessed. When developing each of the major fishery specific component trees, each primary component is broken down into more specific sub-components for which operational objectives can then be developed. For example, the component tree identifying General ecosystem effects of the fishery that was refined during the stakeholder workshop for the South Australian Abalone Fishery is reproduced below in Figure 21.
Report on
Justification for Risk
Rating Only
Low Risk/Priority
Develop Objectives
Indicators
Performance limits
Report Current Status
> Low Risk/Priority
Risk Assessment
ESD Component
Trees
(issues identified)
PLUS
GENERAL
BACKGROUND
INFORMATION
=
ESD REPORT
Use Data for
other
purposes
For
example,
Applications
to EA

79
Fig. 21 South Australian commercial Abalone Fishery Component Tree Structure (for General Ecosystem Effects of the Fishery).
Risk Assessment and Prioritisation of Issues Once the fishery specific component trees were developed and reviewed by stakeholders, the focus moved to the assessment and prioritisation of risks and opportunities facing the fishery. These have been considered in the context of the specific management objectives for each fishery being assessed. The higher level management objectives and desired ESD outcomes are those described in the Fisheries Management Act 2007. Risks and opportunities are also evaluated against more detailed fishery specific objectives - such as those articulated in the fishery‘s management plan. The risk assessment of issues identified for the South Australian Abalone Fishery has been done on the basis of existing management which is currently managing risks to the fishery. Hence the risk assessment conducted during stakeholder workshops considered the residual risk after the existing risk treatments were taken into account. For example, the current compliance program for the South Australian Abalone Fishery is itself based on a separate compliance risk assessment process. This process identifies compliance risks in the context of the fishery‘s management objectives, and then develops and applies strategies to mitigate those risks. The ESD assessment and reporting process works across the full suite of fishery ESD objectives in a similar way. Risk assessment applied under the national ESD framework has been designed to be consistent with the Australian Standard AS/NZS 4360:1999 for Risk Management. Subject matter experts and key fishery stakeholders consider the range of potential consequences of an issue, activity, or event (identified during the component tree development process) and how likely those consequences are to occur. The estimated consequence of an event is multiplied by the likelihood of that event occurring to produce an estimated level of risk.
Impact on predators
Impact on competitors
removal of abalone
Discarding (shells and guts)
Impacts on trophic structure
Anchoring
Dive equipment
Beach launching
Habitat disturbance
Greenhouse gas emissions
Air quality
Rubbish/ debris
Bilge discharge
Hydraulic oil (for cages)
Water quality
Broader environment Disease
General ecosystem effects of the fishery

80
ESD workshop participants worked methodically through each component tree from the top down and conducted a qualitative risk assessment of each issue. An estimate of the consequence level for each issue was made and scored from 0-5, with 0 being negligible and 5 being catastrophic/irreversible. The consequence estimate was based upon the combined judgement of workshop participants who had considerable expertise in the issues being assessed. The level of consequence was estimated at the appropriate scale and context for the issue in question. For the target species (Greenlip and Blacklip Abalone), the consequence assessment was based at the population not the individual level. Killing one abalone is catastrophic for the individual but not for the population. Similarly, when assessing possible ecosystem impacts this was done at the level of the whole ecosystem or at least in terms of the entire extent of the habitat, not at the level of an individual patch or individuals of non-target species3. The likelihood of that consequence occurring was assigned to one of six levels from remote (1) to likely (6). This was based on a judgement about the probability of the events - or chain of events - occurring that could result in a particular adverse consequence. This judgement about conditional probability was again based on the collective experience and knowledge of workshop participants. From the consequence and likelihood scores, the overall risk value (Risk = Consequence x Likelihood), was calculated. On the basis of this risk value each issue was assigned a Risk Ranking within one of five categories (Table 15).
Table 15 Risk ranking definitions and suggested reporting outcomes
RISK Rank Likely Management Response Reporting
Negligible 0 Nil Short Justification Only
Low 1 None Specific Full Justification needed
Moderate 2 Specific Management Needed Full Performance Report
High 3 Possible increases to management activities needed
Full Performance Report
Extreme 4 Likely additional management activities needed
Full Performance Report
3 These descriptions, and detailed guidance about developing consequence and likelihood scores for
fishery issues are provided in the ESD How To Guide at www.fisheries-esd.com.
What is Risk Analysis?
“Risk analysis involves consideration of the sources of risk, their consequences and the likelihood that those consequences may occur.”
Australian and New Zealand Standard (AS/NZS) 4360 – 1999
81
Where a more detailed and/or quantitative risk assessment and management process was in place for the fishery - such as a robust quantitative stock assessment for a target species - the resultant risk score could be expected to be moderate to low. The risk score in this example reflects the fact that the risk is effectively being managed through existing arrangements. The national ESD reporting framework suggests that only those issues scored at moderate, high and extreme risk, which require additional management attention, need to have full ESD performance reports completed. This is the approach that has been used in the PIRSA Fisheries & Aquaculture ESD reports (PIRSA 2009). The rationale for scoring other issues as low or negligible risk has also been documented and form part of these reports. This encourages transparency and should help stakeholders to understand the basis for risk scores and the justification for no further management, or for additional management action if necessary. The process is
summarised earlier in this section (Fig. 20).
Performance Reports for Higher Risk Issues As noted above, a comprehensive ESD performance report has only been prepared for higher risk/priority issues that require additional management attention (PIRSA 2009). The content of these reports is based on the standard subject headings recommended in the ESD Framework‘s How To Guide (Fletcher et al. 2002). The full performance report for the South Australian Abalone Fishery was developed by PIRSA Fisheries & Aquaculture, informed by the initial consultation with industry and then broader stakeholders at PIRSA‘s Adelaide ESD workshop on 22 May 2009. A preliminary draft ESD report was sent to industry members and other stakeholders for review. The review period was brief due to the short time frame available to finalise the reports before consideration by the Fisheries Council in June 2009.

82
19.2 APPENDIX 2 – OVERVEIW OF THE SOUTH AUSTRALIAN ABALONE FISHERY ECOLOGICAL RISK ASSESSMENT.
The following table provides a summary of the material presented in the report. Issue
Risk Objective Developed
Indicator Measured
Performance Measure
Current Performance
Robustness
Actions
RETAINED SPECIES
Primary Target Species (Greenlip Abalone)
M YES Catch, effort, CPUE, abundance
To be determined Acceptable Robust TACC reviewed every year
Primary Target Species (Blacklip Abalone)
M YES Catch, effort, CPUE, abundance
To be determined Acceptable Robust TACC reviewed every year
Secondary species N Negligible risk N/A N/A N/A N/A *** By-catch N Negligible risk N/A N/A N/A N/A ***
NON-RETAINED SPECIES
Direct interaction but no capture N Negligible risk N/A N/A N/A N/A ***
GENERAL ECOSYSTEM EFFECTS
Removal of abalone (Impact on predators)
L Low risk N/A N/A N/A N/A ***
Removal of abalone (Impact on competitors)
L Low risk N/A N/A N/A N/A ***
Discarding N Negligible risk N/A N/A N/A N/A ***
Habitat disturbance N Negligible risk N/A N/A N/A N/A ***
Broader environment N Negligible risk N/A N/A N/A N/A ***
Diseases L Low risk N/A N/A N/A N/A ***
COMMUNITY WELLBEING
Fishing Industry M N/A To be determined To be determined N/A N/A ***

83
Issue
Risk Objective Developed
Indicator Measured
Performance Measure
Current Performance
Robustness
Actions
Regional centres (Economic value)
L Low risk N/A N/A N/A N/A ***
Regional centres (Social value)
L Low risk N/A N/A N/A N/A ***
Regional centres (Infrastructure)
L Low risk N/A N/A N/A N/A ***
Regional centres (Attitude of recreational fishers)
L Low risk N/A N/A N/A N/A ***
City centres (Economic values)
N Negligible risk N/A N/A N/A N/A ***
City centres (Research/knowledge)
L Low risk N/A N/A N/A N/A ***
INDIGENOUS COMMUNITY
Economics TBC TBC TBC TBC TBC TBC TBC
Employment TBC TBC TBC TBC TBC TBC TBC
Community viability TBC TBC TBC TBC TBC TBC TBC
Cultural values TBC TBC TBC TBC TBC TBC TBC
GOVERNANCE
Policy and management (Resources)
H YES To be determined To be determined N/A N/A ***
Policy and management (Compliance-illegal fishing)
M YES To be determined To be determined N/A N/A ***
Consultation (Inter-agency coordination)
L YES N/A N/A N/A N/A ***
Consultation (Aquaculture)
M YES To be determined To be determined N/A N/A ***
Other agencies (Commonwealth-DEWHA)
L YES N/A N/A N/A N/A ***
Other agencies (AQIS)
M YES To be determined To be determined N/A N/A ***

84
Issue
Risk Objective Developed
Indicator Measured
Performance Measure
Current Performance
Robustness
Actions
EXTERNAL FACTORS AFFECTING PERFORMANCE OF THE FISHERY
Physical L Low risk N/A N/A N/A N/A ***
Biological (Diseases-AVG)
H M M YES Presence of AVG Consult emergency response plan
N/A N/A ***
Biological (Diseases-Perkinsus)
L N N Low risk N/A N/A N/A N/A ***
Exotic species L Low risk N/A N/A N/A N/A *** Water quality (Desalination Plant)
M YES To be determined To be determined N/A N/A ***
Economic (Market forces)
M YES Export value, Exchange rates
To be determined N/A N/A ***
Economic (Market access)
M YES To be determined To be determined N/A N/A ***
Access Marine Parks
L Low risk N/A N/A N/A N/A ***
N/A - not applicable TBC - to be completed *** review at next major assessment, scheduled in 5 years.

85
19.3 APPENDIX 3 – SPATIAL ASSESSMENT OF THE SOUTH AUSTRALIAN COMMERCIAL ABALONE FISHERY.
A) Western Zone-Abalone Fishery-Region A
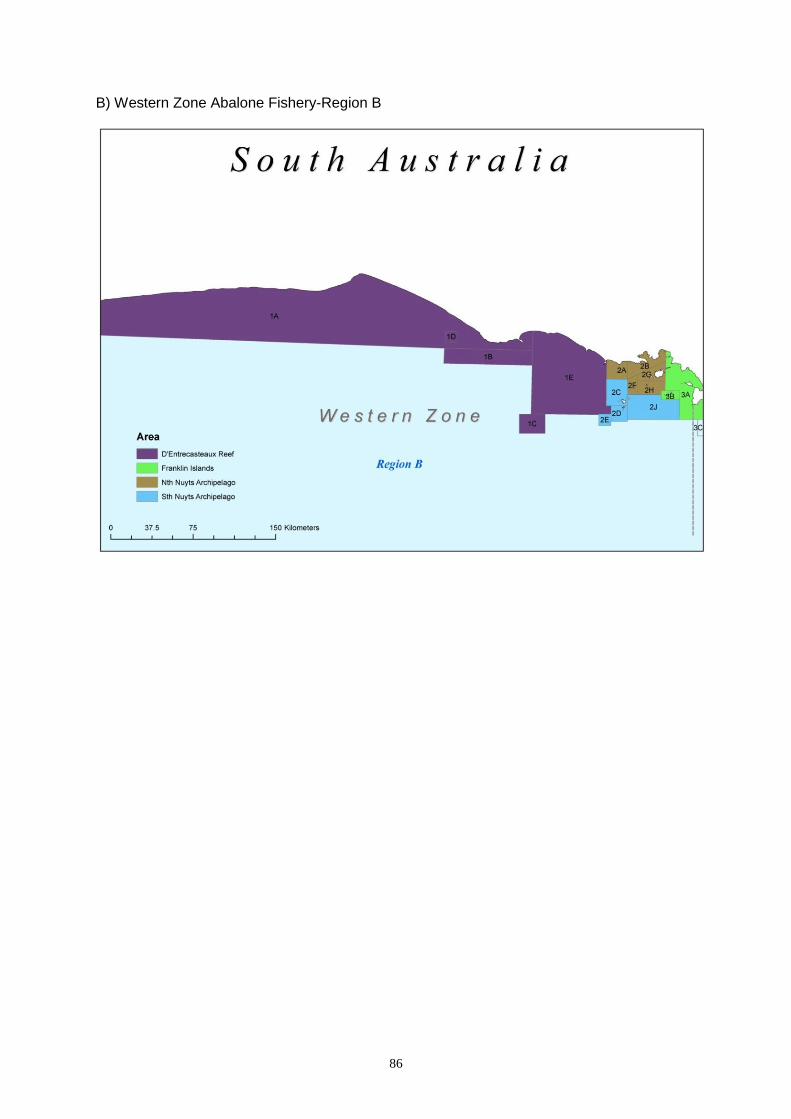
86
B) Western Zone Abalone Fishery-Region B

87
C) Central Zone Abalone Fishery

88
D) Southern Zone Abalone Fishery

89
19.4 APPENDIX 4 – AN EXAMPLE OF A SPREADSHEET USED TO APPLY THE HARVEST STRATEGY TO DETERMINE THE TACC FOR EACH CLASS OF ABALONE#.
#Note: the data used in this example is not real
*since the 2012 TACC (146.2 tonnes) differs less than 10% from the 2011 TACC ( 150 tonnes), the management committee shall recommend that the TACC is not changed.


![The Novel ABALONE Photosensor Technology - sensl.comsensl.com/.../irp/2017_Ferenc_The_Novel_ABALONE_Photosensor_Technology.pdf · The novel ABALONE Photosensor Technology [1] has](https://img.dokumen.tips/doc/110x75/5d5a3f8888c993d7478bb96c/the-novel-abalone-photosensor-technology-sensl-the-novel-abalone-photosensor.jpg)