Embed Size (px)
Citation preview
Management of DiabetesTreat to Target Approach
(A1c <7%)
by
Professor Dr Intekhab AlamDepartment of Medicine
Postgraduate Medical Institute
Lady Reading Hospital, Peshawar.
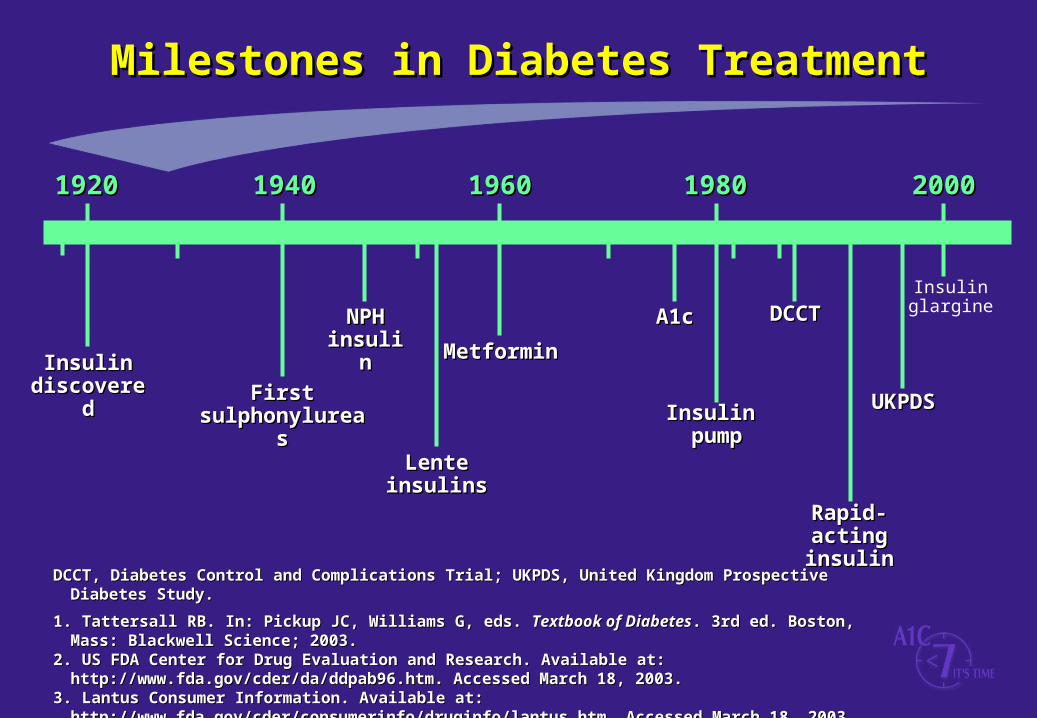
Milestones in Diabetes TreatmentMilestones in Diabetes Treatment
Insulin glargine
Insulin Insulin discovereddiscovered First First
sulphonylureassulphonylureas
NPHNPHinsulininsulin
Lente Lente insulinsinsulins
MetforminMetformin
Insulin Insulin pumppump
Rapid-acting Rapid-acting insulininsulin
UKPDSUKPDS
19201920 19401940 19601960 19801980 20002000
A1cA1c DCCTDCCT
DCCT, Diabetes Control and Complications Trial; UKPDS, United Kingdom Prospective Diabetes Study.DCCT, Diabetes Control and Complications Trial; UKPDS, United Kingdom Prospective Diabetes Study.
1. Tattersall RB. In: Pickup JC, Williams G, eds. 1. Tattersall RB. In: Pickup JC, Williams G, eds. Textbook of DiabetesTextbook of Diabetes. 3rd ed. Boston, Mass: Blackwell Science; . 3rd ed. Boston, Mass: Blackwell Science; 2003.2003.
2. US FDA Center for Drug Evaluation and Research. Available at: http://www.fda.gov/cder/da/ddpab96.htm. 2. US FDA Center for Drug Evaluation and Research. Available at: http://www.fda.gov/cder/da/ddpab96.htm. Accessed March 18, 2003.Accessed March 18, 2003.
3. Lantus Consumer Information. Available at: http://www.fda.gov/cder/consumerinfo/druginfo/lantus.htm.3. Lantus Consumer Information. Available at: http://www.fda.gov/cder/consumerinfo/druginfo/lantus.htm. Accessed March 18, 2003.Accessed March 18, 2003.
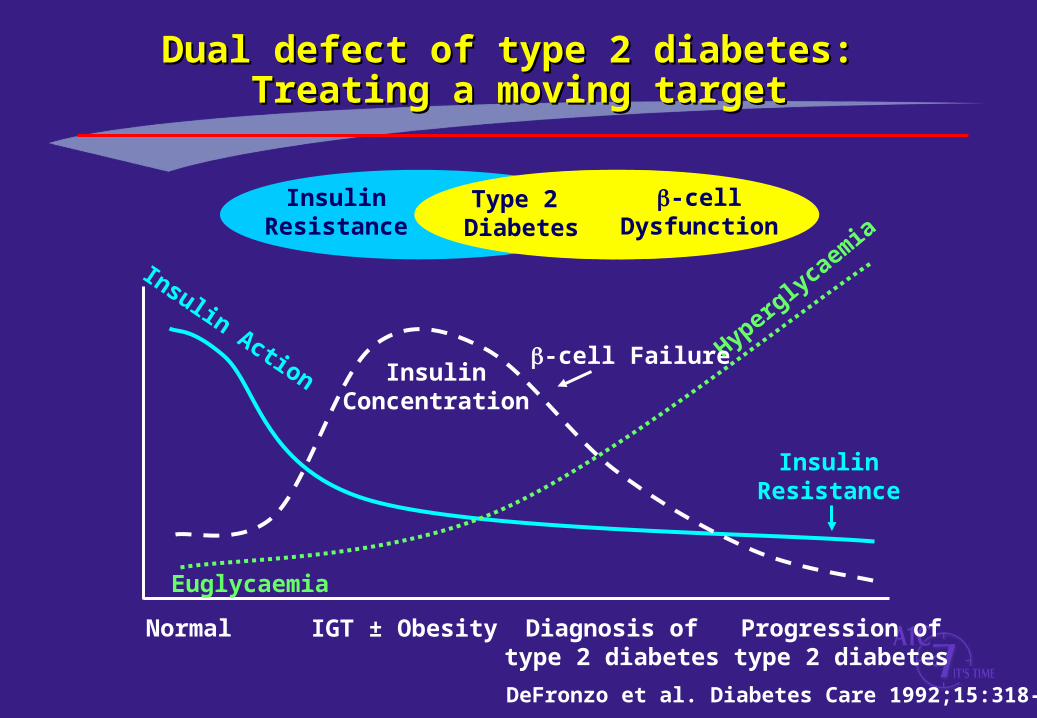
InsulinResistance
Type 2 Diabetes
-cellDysfunction
InsulinResistance
Hyperglycaem
ia
InsulinConcentration
Insulin Action
Euglycaemia
-cell Failure
Normal IGT ± Obesity Diagnosis oftype 2 diabetes
Progression oftype 2 diabetes
Dual defect of type 2 diabetes: Dual defect of type 2 diabetes: Treating a moving targetTreating a moving target
DeFronzo et al. Diabetes Care 1992;15:318-68

Diet
Metformin
UKPDS Group. Lancet 1998;352:854-65
Med
ian
Hb
A1C
(%
)
Time from randomisation (years)
Sulphonylurea
Insulin
Progressive hyperglycaemia in type 2 diabetesProgressive hyperglycaemia in type 2 diabetes
6
7
8
9
0 2 4 6 8 10
HbA1C 6.5%
(IDF & AACE goal value)

ADA- and AACE/ACE-Recommended Goals for ADA- and AACE/ACE-Recommended Goals for Glycaemic Control: A1c, FPG, and PPGGlycaemic Control: A1c, FPG, and PPG
NormalNormal11 GoalGoal11Biochemical ControlBiochemical Control11
A1cA1c** (%) (%) <6.0<6.0 <7.0<7.0††
FPG (mg/dL)FPG (mg/dL)Average preprandialAverage preprandial <110<110 9090-130-130‡‡
PPG (mg/dL)PPG (mg/dL) <140<140 <180<180§§
*Referenced to the nondiabetic range using a DCCT assay.*Referenced to the nondiabetic range using a DCCT assay.11
††AACE/ACE recommendation: AACE/ACE recommendation: 6.5%.6.5%.22
‡‡AACE/ACE recommendation: <110 mg/dL.AACE/ACE recommendation: <110 mg/dL.22
§§AACE/ACE recommendation: <140 mg/dL.AACE/ACE recommendation: <140 mg/dL.22
ADA, American Diabetes Association; AACE/ACE, American Association of Clinical ADA, American Diabetes Association; AACE/ACE, American Association of Clinical Endocrinologists/American College of Endocrinology; FPG, fasting plasma glucose; PPG, postprandial Endocrinologists/American College of Endocrinology; FPG, fasting plasma glucose; PPG, postprandial glucose; DCCT, Diabetes Control and Complications Trial.glucose; DCCT, Diabetes Control and Complications Trial.
1.1. ADA. ADA. Diabetes CareDiabetes Care. 2003;26(suppl 1):S33-S50.. 2003;26(suppl 1):S33-S50.2.2. AACE/ACE. AACE/ACE. Endocr PractEndocr Pract. 2002;8(suppl 1):40-82.. 2002;8(suppl 1):40-82.

A1c Reflects Overall Glucose ControlA1c Reflects Overall Glucose Control
A1c is the glycated form of the abundant red blood cell protein1
A1c levels provide a 2- to 3-month index of glycaemic control2
The target A1c level for patients with diabetes is <7%1
Overall blood glucose control is best obtained by monitoring A1c3
1. Pickup JC. In: Pickup JC, Williams G, eds. Textbook of Diabetes. 3rd ed. Boston, Mass: Blackwell Science; 2003.
2. Clark N. In: Leahy JL, Cefalu WT, eds. Insulin Therapy. New York, NY: Marcel Dekker, Inc.; 2002.3. Cefalu WT. In: Leahy JL, Cefalu WT, eds. Insulin Therapy. New York, NY: Marcel Dekker, Inc.; 2002.
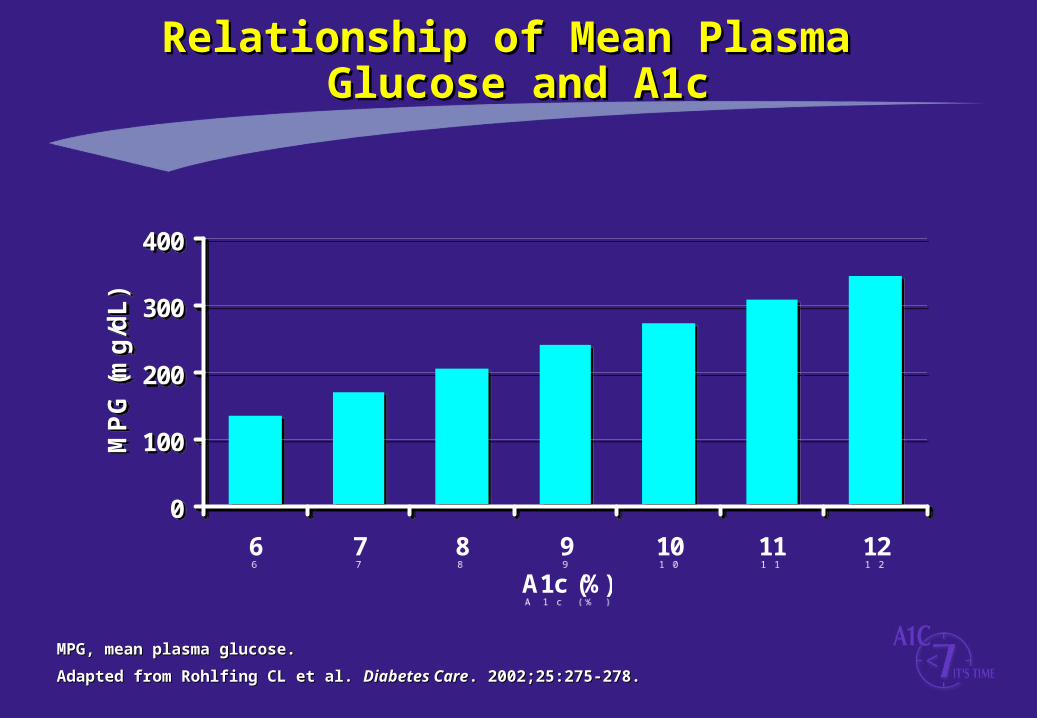
0
100
200
300
400
6 7 8 9 10 11 12
A1c (%)
MP
G (
mg
/dL
)
0
100
200
300
400
6 7 8 9 10 11 12
A1c (%)
MP
G (
mg
/dL
)
Relationship of Mean Plasma Relationship of Mean Plasma Glucose and A1cGlucose and A1c
MPG, mean plasma glucose.MPG, mean plasma glucose.
Adapted from Rohlfing CL et al. Adapted from Rohlfing CL et al. Diabetes CareDiabetes Care. 2002;25:275-278.. 2002;25:275-278.

DCCT, Diabetes Control and Complications Trial.DCCT, Diabetes Control and Complications Trial.
1. Adapted from Skyler JS. 1. Adapted from Skyler JS. Endocrinol Metab Clin North Am. Endocrinol Metab Clin North Am. 1996;25:243-254.1996;25:243-254.2. DCCT. 2. DCCT. N Engl J Med.N Engl J Med. 1993;329:977-986. 1993;329:977-986.3. DCCT. 3. DCCT. DiabetesDiabetes. 1995;44:968-983.. 1995;44:968-983.
Re
lati
ve
Ris
kR
ela
tiv
e R
isk
A1c (%)A1c (%)
1515
1313
1111
99
77
55
33
11
66 77 88 99 1010 1111 1212
A1c and Relative Risk of Microvascular A1c and Relative Risk of Microvascular Complications: DCCT Complications: DCCT
RetinopathyRetinopathy
NephropathyNephropathy
NeuropathyNeuropathy
MicroalbuminuriaMicroalbuminuria
2020

*Diet, only.†Insulin or sulphonylurea + diet.UKPDS, United Kingdom Prospective Diabetes Study. Adapted from UKPDS Group. Lancet. 1998;352:837-853.
Cross-sectional median values
Time From Randomisation (years)Time From Randomisation (years)
Conventional Treatment* (n=1138)Conventional Treatment* (n=1138)Intensive TreatmentIntensive Treatment†† (n=2729) (n=2729)
99
88
77
66
0000 33 66 99 1212 1515
Med
ian
A1c
(%
)M
edia
n A
1c (
%)
Type 2 Diabetes Is a ProgressiveType 2 Diabetes Is a ProgressiveDisease: UKPDSDisease: UKPDS

Complications DCCT1,2 Ohkubo3 UKPDS4
of diabetes mellitus (9% 7%) (9% 7%) (8% 7%)
Retinopathy -63% -69% -21%
Nephropathy -54% -70% -34%
Neuropathy -60% – –
Macrovascular disease -41%* – -16%*
Risk reduction by decrease in A1c (%)
Good Glycaemic Control Reduces Good Glycaemic Control Reduces Incidence of ComplicationsIncidence of Complications
*Not statistically significant. *Not statistically significant. DCCT, Diabetes Control and Complications Trial; UKPDS, United Kingdom Prospective Diabetes Study.DCCT, Diabetes Control and Complications Trial; UKPDS, United Kingdom Prospective Diabetes Study.
1. DCCT Research Group. 1. DCCT Research Group. N Engl J MedN Engl J Med. 1993;329:977-986. . 1993;329:977-986. 2. DCCT Research Group. 2. DCCT Research Group. DiabetesDiabetes. 1995;44:968-983.. 1995;44:968-983.3. Ohkubo Y et al. 3. Ohkubo Y et al. Diabetes Res Clin PractDiabetes Res Clin Pract. 1995;28:103-117. . 1995;28:103-117. 4. UKPDS Group. 4. UKPDS Group. LancetLancet. 1998;352:837-853.. 1998;352:837-853.
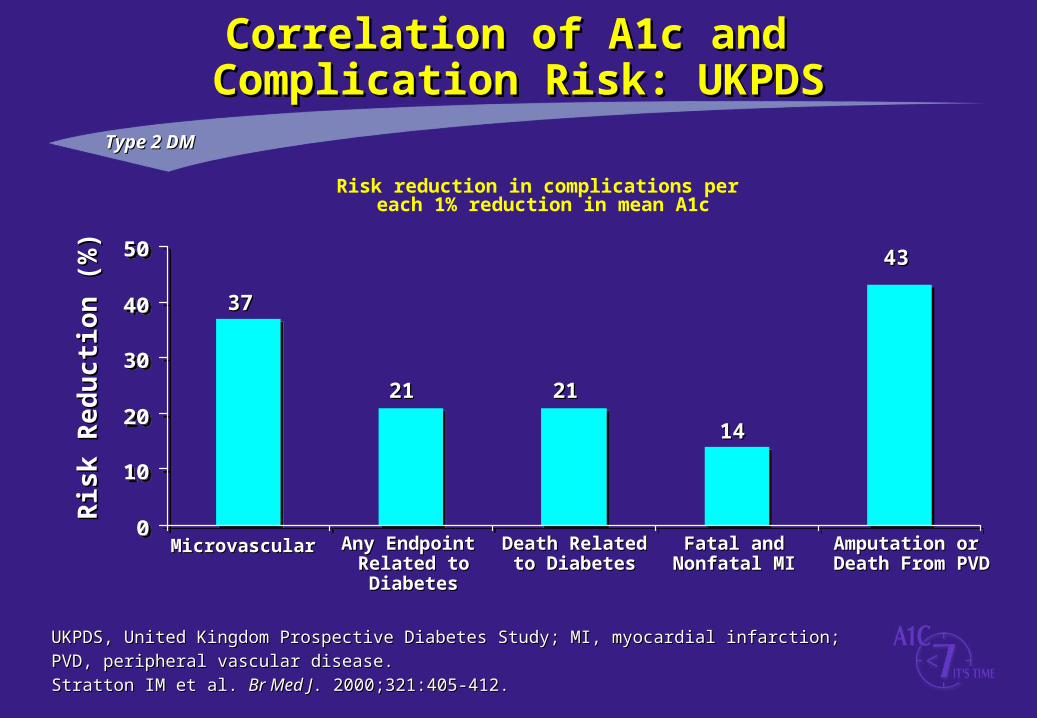
UKPDS, United Kingdom Prospective Diabetes Study; MI, myocardial infarction; UKPDS, United Kingdom Prospective Diabetes Study; MI, myocardial infarction;
PVD, peripheral vascular disease. PVD, peripheral vascular disease.
Stratton IM et al. Stratton IM et al. Br Med JBr Med J. 2000;321:405-412.. 2000;321:405-412.
Correlation of A1c and Correlation of A1c and Complication Risk: UKPDSComplication Risk: UKPDS
Risk reduction in complications per each 1% reduction in mean A1c
0
10
20
30
40
50
0
10
20
30
40
50
Amputation or Amputation or Death From PVDDeath From PVD
3737
2121 2121
1414
4343
Ris
k R
ed
uct
ion
(%
)R
isk
Re
du
ctio
n (
%)
MicrovascularMicrovascular Any Endpoint Any Endpoint Related to DiabetesRelated to Diabetes
Death RelatedDeath Relatedto Diabetesto Diabetes
Fatal and Fatal and Nonfatal MINonfatal MI
Type 2 DMType 2 DM

*1-2 insulin injections and 1 urine/blood glucose test daily.†3 insulin injections/pump treatments daily + SMBG + diet + exercise.EDIC, Epidemiology of Diabetes Interventions and Complications trial; SMBG, self-monitored blood glucose.
DCCT/EDIC Research Group. N Engl J Med. 2000;342:381-389.
Preservation of Benefit: Preservation of Benefit: EDIC Progression of RetinopathyEDIC Progression of Retinopathy
EDIC (year)
Cu
mu
lati
ve In
cid
enc
e (%
)
0.00.0 0.50.5 1.01.0 1.51.5 2.02.0 2.52.5 3.03.0 3.53.5 4.04.000
24242222202018181616141412121010
22446688
Conventional Treatment*
Intensive Treatment†
Type 1 DMType 1 DM

Risk of Death Related to A1c LevelsRisk of Death Related to A1c Levels
Note: A1c <5.0% was defined as a relative risk of 1.Note: A1c <5.0% was defined as a relative risk of 1.Adapted from Khaw K-T et al. Adapted from Khaw K-T et al. Br Med J.Br Med J. 2001;322:1-6. 2001;322:1-6.Norfolk cohort of the European Prospective Investigation of cancer and Nutrition, n-4662Norfolk cohort of the European Prospective Investigation of cancer and Nutrition, n-4662
00
22
44
66
CardiovascularCardiovascularDiseaseDisease
Ischaemic Heart Ischaemic Heart DiseaseDisease
All CausesAll Causes
Re
lati
ve
Ris
k (
%)
Re
lati
ve
Ris
k (
%)
A1c 5.0%A1c 5.0%--5.4%5.4%
A1c 5.5%-6.9%A1c 5.5%-6.9%
A1c A1c 7.0%7.0%

A Comprehensive Approach A Comprehensive Approach To Treat to TargetTo Treat to Target
*Composite endpoint = cardiovascular death and amputation (with either therapy), and relative risk for *Composite endpoint = cardiovascular death and amputation (with either therapy), and relative risk for organ damage (with intensive therapy).organ damage (with intensive therapy).Gaede P et al. Gaede P et al. N Engl J MedN Engl J Med. 2003;348:383-393.. 2003;348:383-393.Steno diabetes center,Denmark. n 160.Steno diabetes center,Denmark. n 160.
80808080
72727878
70707474 7171 6666 6363 6161 5959 1919
131341414444505059596363Number at Risk/TreatmentNumber at Risk/Treatment ConventionalConventional
IntensiveIntensive
Pri
mar
y C
om
po
site
P
rim
ary
Co
mp
osi
te
En
dp
oin
t* (
%)
En
dp
oin
t* (
%)
Follow-up (months)Follow-up (months)
6060
5050
4040
3030
2020
1010
00
PP=.007=.007
00 1212 2424 3636 4848 6060 7272 8484 9696
Conventional TreatmentConventional Treatment
Intensive TreatmentIntensive Treatment
Type 2 DMType 2 DM

**PP=.011 sulphonylurea =.011 sulphonylurea insulin vs insulin alone; insulin vs insulin alone; ††PP<.00011 insulin or sulphonylurea <.00011 insulin or sulphonylurea insulin vs insulin vs conventional glucose control policy; conventional glucose control policy; ‡‡PP=.0066 sulphonylurea =.0066 sulphonylurea insulin vs insulin alone. insulin vs insulin alone.SU, sulphonylurea; IQR, interquartile range.SU, sulphonylurea; IQR, interquartile range.
Adapted from Wright A et al. Adapted from Wright A et al. Diabetes CareDiabetes Care. 2002;25:330-336.. 2002;25:330-336.
Pat
ien
ts A
chie
vin
g
A1c
<7%
at
6 Y
ears
(%
)
ConventionalConventionalGlucose ControlGlucose Control
Insulin Alone Insulin Alone SU ± InsulinSU ± Insulin
Intensive Glucose Control (Intensive Glucose Control (FPG < 108 mg%)FPG < 108 mg%)
Median A1c (IQR): 7.6% (6.8-8.7) 7.1% (6.2-8.0)Median A1c (IQR): 7.6% (6.8-8.7) 7.1% (6.2-8.0)† † 6.6% (6.0-7.6)6.6% (6.0-7.6)†‡†‡
2020
3535
4747
00
1010
2020
3030
4040
5050
6060 **
Insulin Helps Achieve ControlInsulin Helps Achieve Control
Type 2 DMType 2 DM
DCCT, Diabetes Control and Complications Trial; UKPDS, United Kingdom Prospective Diabetes Study.DCCT, Diabetes Control and Complications Trial; UKPDS, United Kingdom Prospective Diabetes Study.
Treat to Target A1cTreat to Target A1c
A1c is a key marker of diabetes treatment efficacy
A1c levels correlate with a patient’s relative risk of death
and of microvascular and macrovascular complications
The DCCT, UKPDS, and other major trials—as well as
major diabetes organizations—support treatment-to-target
A1c <7%
LDL-C, low-density lipoprotein cholesterol.LDL-C, low-density lipoprotein cholesterol.
Treat to Target A1cTreat to Target A1c
Aggressive therapy is often necessary to achieve control
Treat to target requires a comprehensive approach: control
of blood pressure and control of LDL-c, bolstering a
concerted attack on A1c levels
Treat to target reduces risk of complications and its
associated costs

Pitfalls In HbAPitfalls In HbA1C 1C EstimationEstimation
False high HbA1C:
– Hb F, Acetylated Hb, Cabamoylated Hb. False low HbA1C:
– Hb S or C, Hemolytic anemias, Hemmorhage. Reliability in diagnosing Diabetes:
sensitivity 85%
specificity 91%. Fructosamine levels:
nonenzymatic glycosylation of serum proteins esp Albumin
1.5-2,4 mmol/l with 5gm/dl of Albumin.

The ABC of Diabetes ManagementThe ABC of Diabetes Management
Effective management of diabetes requires
– A – Control of A1c
– B – Control of Blood pressure
– C – Control of Cholesterol

ADA Glycemic TargetsADA Glycemic Targets
American Diabetes Association. Standards of Medical Care for Patients with Diabetes Mellitus.Diabetes Care 1999;22(Suppl):S32-S41.
Normal GoalAction
Level
HbA1c (%) <6 <7>8
Fasting and preprandialblood glucose (mg/dL) <110 80 to 120 >140

ADA Blood Pressure TargetsADA Blood Pressure Targets
American Diabetes Association. Standards of Medical Care for Patients with Diabetes Mellitus.Diabetes Care 1999;22(Suppl):S32-S41.
Goal (mm Hg)
Usual patient <130/85
Isolated systolic hypertension If ≥180 <160 If 160 to 179 Reduce by 20
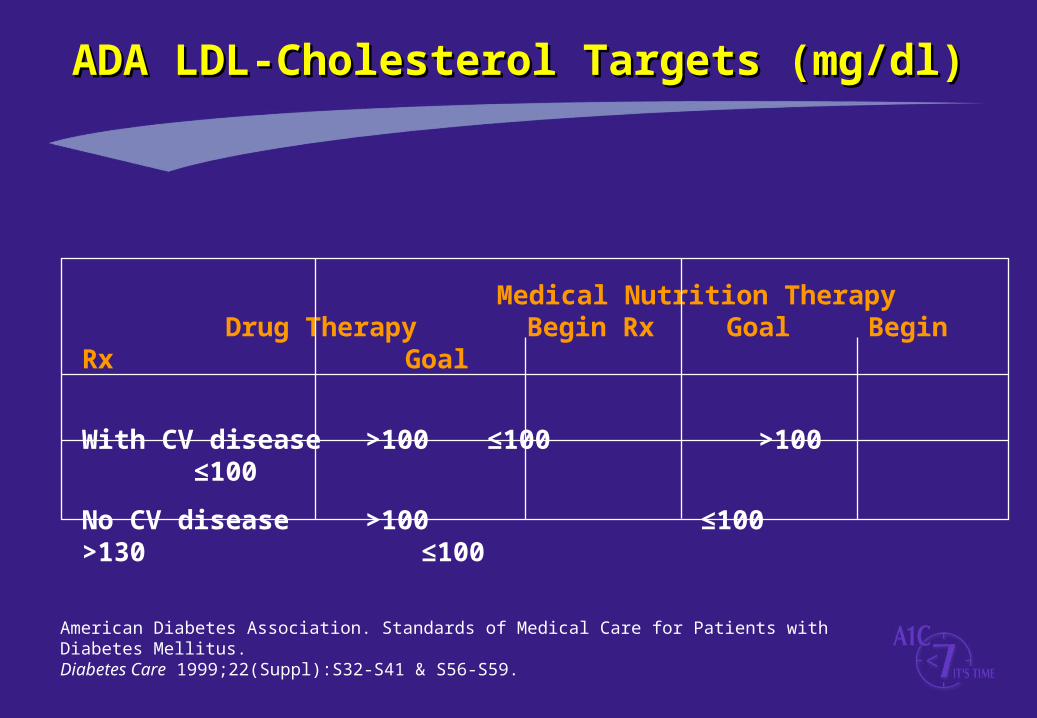
ADA LDL-Cholesterol Targets (mg/dl)ADA LDL-Cholesterol Targets (mg/dl)
American Diabetes Association. Standards of Medical Care for Patients with Diabetes Mellitus.Diabetes Care 1999;22(Suppl):S32-S41 & S56-S59.
Medical Nutrition Therapy Drug TherapyBegin Rx Goal Begin Rx Goal
With CV disease >100 ≤100 >100 ≤100
No CV disease >100 ≤100 >130 ≤100
European Diabetes Policy Group Desktop GuideEuropean Diabetes Policy Group Desktop Guide
‘Providing a greater emphasis on arterial risk
factor management rather than just good blood
glucose control’
European Diabetes Policy Group (1998–1999)European Diabetes Policy Group (1998–1999)

European Diabetes Policy Group Desktop GuideEuropean Diabetes Policy Group Desktop Guide
At each assessment
– Set individual targets for blood glucose, blood lipid and blood pressure
– Targets should incorporate an assessment of risk and the patient’s needs
– Set realistic objectives within a time period
– Evaluate individual targets at least yearly in the light of past successes and if clinical circumstances change
European Diabetes Policy Group (1998–1999)European Diabetes Policy Group (1998–1999)

European Diabetes Policy Group (1998–1999)European Diabetes Policy Group (1998–1999)
AssessmentAssessment
Measure
– HbA1c every 2-6 months
– blood lipid profile (total, LDL- and HDL-cholesterol, and
triglycerides) every 2-6 months if previously above assessment
levels otherwise annually
– blood pressure at each consultation unless known to be below
assessment levels

European Diabetes Policy Group adviceEuropean Diabetes Policy Group advice
‘Failure to attempt to
reach agreed targets
is inadequate care’
European Diabetes Policy Group (1998–1999)European Diabetes Policy Group (1998–1999)