Embed Size (px)
Citation preview
47Annual Report 2013 | Encana Corporation
MA
NA
GE
ME
NT
RE
PO
RT
Management’s Responsibility for Consolidated Financial Statements
The accompanying Consolidated Financial Statements of Encana Corporation (the “Company”) are the responsibility of Management. The Consolidated Financial
Statements have been prepared by Management in United States dollars in accordance with generally accepted accounting principles in the United States and
include certain estimates that reflect Management’s best judgments.
The Company’s Board of Directors has approved the information contained in the Consolidated Financial Statements. The Board of Directors fulfills its responsibility
regarding the financial statements mainly through its Audit Committee, which has a written mandate that complies with the current requirements of Canadian
securities legislation and the United States Sarbanes-Oxley Act of 2002 and voluntarily complies, in principle, with the Audit Committee guidelines of the New York
Stock Exchange. The Audit Committee meets at least on a quarterly basis.
Management’s Assessment of Internal Control over Financial Reporting
Management is also responsible for establishing and maintaining adequate internal control over the Company’s financial reporting. The internal control system was
designed to provide reasonable assurance to the Company’s Management regarding the preparation and presentation of the Consolidated Financial Statements.
Internal control systems, no matter how well designed, have inherent limitations. Therefore, even those systems determined to be effective can provide only reasonable
assurance with respect to financial statement preparation and presentation. Also, projections of any evaluation of effectiveness to future periods are subject to the risk
that controls may become inadequate because of changes in conditions, or that the degree of compliance with the policies or procedures may deteriorate.
Management has assessed the design and effectiveness of the Company’s internal control over financial reporting as at December 31, 2013. In making its
assessment, Management has used the Internal Control – Integrated Framework (1992) issued by the Committee of Sponsoring Organizations of the Treadway
Commission to evaluate the effectiveness of the Company’s internal control over financial reporting. Based on our evaluation, Management has concluded that
the Company’s internal control over financial reporting was effectively designed and operating effectively as at that date.
PricewaterhouseCoopers LLP, an independent firm of chartered accountants, was appointed by a vote of shareholders at the Company’s last annual meeting
to audit and provide independent opinions on both the Consolidated Financial Statements and the Company’s internal control over financial reporting
as at December 31, 2013, as stated in their Auditor’s Report. PricewaterhouseCoopers LLP has provided such opinions.
Douglas J. Suttles Sherri A. BrillonPresident & Chief Executive Officer Executive Vice-President & Chief Financial Officer
February 20, 2014
MANAGEMENT REPORT
47

48 Encana Corporation | Annual Report 2013
AU
DIT
OR
’S
RE
PO
RT
INDEPENDENT AUDITOR’S REPORT
To the Shareholders of Encana Corporation
We have completed an integrated audit of Encana Corporation’s 2013 and 2012 Consolidated Financial Statements and its internal control over financial reporting
as at December 31, 2013 and an audit of its 2011 Consolidated Financial Statements. Our opinions, based on our audits, are presented below.
Report on the Consolidated Financial Statements
We have audited the accompanying Consolidated Financial Statements of Encana Corporation, which comprise the Consolidated Balance Sheet as at December 31, 2013
and December 31, 2012 and the Consolidated Statements of Earnings, Comprehensive Income, Changes in Shareholders’ Equity and Cash Flows for each of the three
years in the period ended December 31, 2013, and the related notes, which comprise a summary of significant accounting policies and other explanatory information.
Management’s Responsibility for the Consolidated Financial Statements
Management is responsible for the preparation and fair presentation of these Consolidated Financial Statements in accordance with accounting principles generally
accepted in the United States of America and for such internal control as management determines is necessary to enable the preparation of Consolidated Financial
Statements that are free from material misstatement, whether due to fraud or error.
Auditor’s Responsibility
Our responsibility is to express an opinion on these Consolidated Financial Statements based on our audits. We conducted our audits as at December 31, 2013
and December 31, 2012 and for the years then ended in accordance with Canadian generally accepted auditing standards and the standards of the Public
Company Accounting Oversight Board (United States). Those standards require that we plan and perform the audit to obtain reasonable assurance about whether
the Consolidated Financial Statements are free from material misstatement. Canadian generally accepted auditing standards also require that we comply with
ethical requirements.
An audit involves performing procedures to obtain audit evidence, on a test basis, about the amounts and disclosures in the consolidated financial statements.
The procedures selected depend on the auditor’s judgment, including the assessment of the risks of material misstatement of the consolidated financial
statements, whether due to fraud or error. In making those risk assessments, the auditor considers internal control relevant to the company’s preparation
and fair presentation of the consolidated financial statements in order to design audit procedures that are appropriate in the circumstances. An audit also
includes evaluating the appropriateness of accounting principles and policies used and the reasonableness of accounting estimates made by management,
as well as evaluating the overall presentation of the consolidated financial statements.
We believe that the audit evidence we have obtained in our audits is sufficient and appropriate to provide a basis for our audit opinion on the Consolidated
Financial Statements.
Opinion
In our opinion, the Consolidated Financial Statements present fairly, in all material respects, the financial position of Encana Corporation and its subsidiaries as at
December 31, 2013 and December 31, 2012 and the results of its operations and its cash flows for each of the three years in the period ended December 31, 2013
in accordance with accounting principles generally accepted in the United States of America.
AUDITOR’S REPORT
48

49Annual Report 2013 | Encana Corporation
AU
DIT
OR
’S
RE
PO
RT
REPORT ON INTERNAL CONTROL OVER FINANCIAL REPORTING
We have also audited Encana Corporation and its subsidiaries’ internal control over financial reporting as at December 31, 2013, based on criteria established
in Internal Control - Integrated Framework (1992), issued by the Committee of Sponsoring Organizations of the Treadway Commission (“COSO”).
Management’s Responsibility for Internal Control over Financial Reporting
Management is responsible for maintaining effective internal control over financial reporting and for its assessment of the effectiveness of internal control over
financial reporting included in the accompanying Management’s Assessment of Internal Control over Financial Reporting.
Auditor’s Responsibility
Our responsibility is to express an opinion on the company’s internal control over financial reporting based on our audit. We conducted our audit of internal control
over financial reporting in accordance with the standards of the Public Company Accounting Oversight Board (United States). Those standards require that we plan
and perform the audit to obtain reasonable assurance about whether effective internal control over financial reporting was maintained in all material respects.
An audit of internal control over financial reporting includes obtaining an understanding of internal control over financial reporting, assessing the risk that a material
weakness exists, testing and evaluating the design and operating effectiveness of internal control based on the assessed risk, and performing such other
procedures as we consider necessary in the circumstances.
We believe that our audit provides a reasonable basis for our audit opinion on the company’s internal control over financial reporting.
Definition of Internal Control over Financial Reporting
A company’s internal control over financial reporting is a process designed to provide reasonable assurance regarding the reliability of financial reporting and the
preparation of financial statements for external purposes in accordance with generally accepted accounting principles. A company’s internal control over financial
reporting includes those policies and procedures that: (i) pertain to the maintenance of records that, in reasonable detail, accurately and fairly reflect the transactions
and dispositions of the assets of the company; (ii) provide reasonable assurance that transactions are recorded as necessary to permit preparation of financial
statements in accordance with generally accepted accounting principles, and that receipts and expenditures of the company are being made only in accordance with
authorizations of management and directors of the company; and (iii) provide reasonable assurance regarding prevention or timely detection of unauthorized acquisition,
use, or disposition of the company’s assets that could have a material effect on the financial statements.
Inherent Limitations
Because of its inherent limitations, internal control over financial reporting may not prevent or detect misstatements. Also, projections of any evaluation
of effectiveness to future periods are subject to the risk that controls may become inadequate because of changes in conditions or that the degree of compliance
with the policies or procedures may deteriorate.
Opinion
In our opinion, Encana Corporation and its subsidiaries maintained, in all material respects, effective internal control over financial reporting as at December 31, 2013,
based on criteria established in Internal Control - Integrated Framework (1992) issued by COSO.
PricewaterhouseCoopers LLPChartered AccountantsCalgary, Alberta, Canada
February 20, 2014
49

50 Encana Corporation | Annual Report 2013
CO
NS
OL
IDA
TE
D
FIN
AN
CIA
L S
TAT
EM
EN
TS
P
RE
PA
RE
D I
N
AC
CO
RD
AN
CE
WIT
H
U.S
. G
AA
P I
N U
S$
MM
CONSOLIDATED STATEMENT OF EARNINGS
For the years ended December 31 ($ millions, except per share amounts) 2013 2012 2011
Revenues, Net of Royalties (Note 2) $ 5,858 $ 5,160 $ 8,467
Expenses (Note 2)
Production and mineral taxes 134 105 198
Transportation and processing 1,476 1,231 1,193
Operating 859 794 866
Purchased product 441 349 635
Depreciation, depletion and amortization 1,565 1,956 2,282
Impairments (Note 8) 21 4,695 2,249
Accretion of asset retirement obligation (Note 14) 53 53 50
Administrative (Note 17) 439 392 350
Interest (Note 4) 563 522 468
Foreign exchange (gain) loss, net (Note 5) 325 (107) 133
Other (6) 1 21
5,870 9,991 8,445
Net Earnings (Loss) Before Income Tax (12) (4,831) 22
Income tax expense (recovery) (Note 6) (248) (2,037) 17
Net Earnings (Loss) $ 236 $ (2,794) $ 5
Net Earnings (Loss) per Common Share (Note 15)
Basic $ 0.32 $ (3.79) $ 0.01
Diluted $ 0.32 $ (3.79) $ 0.01
CONSOLIDATED STATEMENT OF COMPREHENSIVE INCOMEFor the years ended December 31 ($ millions) 2013 2012 2011
Net Earnings (Loss) $ 236 $ (2,794) $ 5
Other Comprehensive Income (Loss), Net of Tax
Foreign currency translation adjustment (Notes 16) (46) 81 (305)
Pension and other post-employment benefit plans (Notes 16, 19) 60 13 (34)
Other Comprehensive Income (Loss) 14 94 (339)
Comprehensive Income (Loss) $ 250 $ (2,700) $ (334)
See accompanying Notes to Consolidated Financial Statements
50

51Annual Report 2013 | Encana Corporation
CONSOLIDATED BALANCE SHEET
As at December 31 ($ millions) 2013 2012
AssetsCurrent Assets
Cash and cash equivalents $ 2,566 $ 3,179
Accounts receivable and accrued revenues (Note 7) 988 1,236
Risk management (Note 21) 56 479
Income tax receivable 562 560
Deferred income taxes (Note 6) 118 23
4,290 5,477 Property, Plant and Equipment, at cost: (Note 8)
Natural gas and oil properties, based on full cost accounting
Proved properties 51,603 50,953
Unproved properties 1,068 1,295
Other 3,148 3,379
Property, plant and equipment 55,819 55,627
Less: Accumulated depreciation, depletion and amortization (45,784) (45,876)
Property, plant and equipment, net (Note 2) 10,035 9,751
Cash in Reserve 10 54
Other Assets (Note 9) 526 466
Risk Management (Note 21) 204 111
Deferred Income Taxes (Note 6) 939 1,116
Goodwill (Notes 2, 10) 1,644 1,725
(Note 2) $ 17,648 $ 18,700
Liabilities and Shareholders’ EquityCurrent Liabilities
Accounts payable and accrued liabilities (Note 11) $ 1,895 $ 2,003
Income tax payable 29 45
Risk management (Note 21) 25 5
Current portion of long-term debt (Note 12) 1,000 500
Deferred income taxes (Note 6) 3 59
2,952 2,612
Long-Term Debt (Note 12) 6,124 7,175
Other Liabilities and Provisions (Note 13) 2,520 2,672
Risk Management (Note 21) 5 10
Asset Retirement Obligation (Note 14) 900 936
12,501 13,405
Commitments and Contingencies (Note 23)
Shareholders’ Equity
Share capital - authorized unlimited common shares, without par value
2013 issued and outstanding: 740.9 million shares (2012: 736.3 million shares) (Note 15) 2,445 2,354
Paid in surplus (Notes 15, 18) 15 10
Retained earnings 2,003 2,261
Accumulated other comprehensive income (Note 16) 684 670
Total Shareholders’ Equity 5,147 5,295
$ 17,648 $ 18,700
See accompanying Notes to Consolidated Financial Statements
Clayton H. Woitas Jane L. Peverett Director
Approved by the Board of Directors
CO
NS
OL
IDA
TE
D
FIN
AN
CIA
L S
TAT
EM
EN
TS
P
RE
PA
RE
D I
N
AC
CO
RD
AN
CE
WIT
H
U.S
. G
AA
P I
N U
S$
MM
Director51

52 Encana Corporation | Annual Report 2013
CONSOLIDATED STATEMENT OF CHANGES IN SHAREHOLDERS’ EQUITY
For the year ended December 31, 2013 ($ millions)
Share Capital
Paid in Surplus
Retained Earnings
Accumulated Other Comprehensive
Income
Total Shareholders’
Equity
Balance, December 31, 2012 $ 2,354 $ 10 $ 2,261 $ 670 $ 5,295
Share-Based Compensation (Note 18) - 3 - - 3
Net Earnings (Loss) - - 236 - 236
Common Shares Cancelled (Note 15) (2) 2 - - -
Dividends on Common Shares (Note 15) - - (494) - (494)Common Shares Issued Under
Dividend Reinvestment Plan (Note 15) 93 - - - 93
Other Comprehensive Income (Loss) (Note 16) - - - 14 14
Balance, December 31, 2013 $ 2,445 $ 15 $ 2,003 $ 684 $ 5,147
For the year ended December 31, 2012 ($ millions)
Share
Capital
Paid in
Surplus
Retained
Earnings
Accumulated Other
Comprehensive
Income
Total
Shareholders’
Equity
Balance, December 31, 2011 $ 2,354 $ 5 $ 5,643 $ 576 $ 8,578
Share-Based Compensation (Note 18) - 5 - - 5
Net Earnings (Loss) - - (2,794) - (2,794)
Dividends on Common Shares (Note 15) - - (588) - (588)
Other Comprehensive Income (Loss) (Note 16) - - - 94 94
Balance, December 31, 2012 $ 2,354 $ 10 $ 2,261 $ 670 $ 5,295
For the year ended December 31, 2011 ($ millions)
Share
Capital
Paid in
Surplus
Retained
Earnings
Accumulated Other
Comprehensive
Income
Total
Shareholders’
Equity
Balance, December 31, 2010 $ 2,352 $ - $ 6,226 $ 915 $ 9,493
Share-Based Compensation - 5 - - 5
Net Earnings (Loss) - - 5 - 5
Dividends on Common Shares (Note 15) - - (588) - (588)
Common Shares Issued Under Option Plans 2 - - - 2
Other Comprehensive Income (Loss) - - - (339) (339)
Balance, December 31, 2011 $ 2,354 $ 5 $ 5,643 $ 576 $ 8,578
See accompanying Notes to Consolidated Financial Statements
CO
NS
OL
IDA
TE
D
FIN
AN
CIA
L S
TAT
EM
EN
TS
P
RE
PA
RE
D I
N
AC
CO
RD
AN
CE
WIT
H
U.S
. G
AA
P I
N U
S$
MM
52

53Annual Report 2013 | Encana Corporation
CO
NS
OL
IDA
TE
D
FIN
AN
CIA
L S
TAT
EM
EN
TS
P
RE
PA
RE
D I
N
AC
CO
RD
AN
CE
WIT
H
U.S
. G
AA
P I
N U
S$
MM
CONSOLIDATED STATEMENT OF CASH FLOWS
For the years ended December 31 ($ millions) 2013 2012 2011
Operating Activities
Net earnings (loss) $ 236 $ (2,794) $ 5
Depreciation, depletion and amortization 1,565 1,956 2,282
Impairments (Note 8) 21 4,695 2,249
Accretion of asset retirement obligation (Note 14) 53 53 50
Deferred income taxes (Note 6) (57) (1,837) 212
Unrealized (gain) loss on risk management (Note 21) 345 1,465 (879)
Unrealized foreign exchange (gain) loss (Note 5) 330 (112) 96
Other 55 82 87
Net change in other assets and liabilities (80) (78) (160)
Net change in non-cash working capital (Note 22) (179) (323) (15)
Cash From (Used in) Operating Activities 2,289 3,107 3,927
Investing Activities
Capital expenditures (Note 2) (2,712) (3,476) (4,610)
Acquisitions (Note 3) (184) (379) (515)
Proceeds from divestitures (Note 3) 705 4,043 2,080
Cash in reserve 44 415 (383)
Net change in investments and other 252 (242) (203)
Cash From (Used in) Investing Activities (1,895) 361 (3,631)
Financing Activities
Issuance of revolving long-term debt - 1,721 13,606
Repayment of revolving long-term debt - (1,724) (13,556)
Issuance of long-term debt (Note 12) - - 997
Repayment of long-term debt (Note 12) (500) (503) (500)
Issuance of common shares - - 2
Dividends on common shares (Note 15) (401) (588) (588)
Capital lease payments (Note 8) (8) (17) (155)
Cash From (Used in) Financing Activities (909) (1,111) (194)
Foreign Exchange Gain (Loss) on Cash and Cash
Equivalents Held in Foreign Currency (98) 22 (1)
Increase (Decrease) in Cash and Cash Equivalents (613) 2,379 101
Cash and Cash Equivalents, Beginning of Year 3,179 800 699
Cash and Cash Equivalents, End of Year $ 2,566 $ 3,179 $ 800
Cash, End of Year $ 161 $ 92 $ 70
Cash Equivalents, End of Year 2,405 3,087 730
Cash and Cash Equivalents, End of Year $ 2,566 $ 3,179 $ 800
Supplementary Cash Flow Information (Note 22)
See accompanying Notes to Consolidated Financial Statements
53

Encana Corporation | Annual Report 2013
NO
TE
S T
O
CO
NS
OL
IDA
TE
D
FIN
AN
CIA
L S
TAT
EM
EN
TS
P
RE
PA
RE
D I
N
AC
CO
RD
AN
CE
WIT
H
U.S
. G
AA
P I
N U
S$
MM
54
1. SUMMARY OF SIGNIFICANT ACCOUNTING POLICIES
A) NATURE OF OPERATIONS
Encana Corporation and its subsidiaries (“Encana” or the “Company”) are in the business of the exploration for, the development of, and the production
and marketing of natural gas, oil and natural gas liquids (“NGLs”). The term liquids is used to represent Encana’s oil, NGLs and condensate.
B) BASIS OF PRESENTATION
The Consolidated Financial Statements include the accounts of Encana and are presented in accordance with accounting principles generally accepted
in the United States (“U.S. GAAP”).
In these Consolidated Financial Statements, unless otherwise indicated, all dollar amounts are expressed in United States (“U.S.”) dollars. Encana’s financial results
are consolidated in Canadian dollars; however, the Company has adopted the U.S. dollar as its reporting currency to facilitate a more direct comparison to other
North American oil and gas companies. All references to US$ or to $ are to United States dollars and references to C$ are to Canadian dollars.
C) PRINCIPLES OF CONSOLIDATION
The Consolidated Financial Statements include the accounts of Encana and entities in which it holds a controlling interest. All intercompany balances and
transactions are eliminated on consolidation. For upstream joint interest operations where Encana retains an undivided interest in jointly owned property, the
Company records its proportionate share of assets, liabilities, revenues and expenses. Investments in non-controlled entities over which Encana has the ability
to exercise significant influence are accounted for using the equity method.
D) FOREIGN CURRENCY TRANSLATION
Monetary assets and liabilities of the Company that are denominated in foreign currencies are translated at the rates of exchange in effect at the period end date.
Any gains or losses are recorded in the Consolidated Statement of Earnings. Foreign currency revenues and expenses are translated at the rates of exchange
in effect at the time of the transaction.
For the accounts of foreign operations, assets and liabilities are translated at period end exchange rates, while revenues and expenses are translated using
average rates over the period. Translation gains and losses relating to the foreign operations are included in accumulated other comprehensive income (“AOCI”).
Recognition of Encana’s accumulated translation gains and losses into net earnings occurs upon complete or substantially complete liquidation of the Company’s
investment in the foreign operation.
For financial statement presentation, assets and liabilities are translated into the reporting currency at period end exchange rates, while revenues and expenses
are translated using average rates over the period. Gains and losses relating to the financial statement translation are included in AOCI.
E) USE OF ESTIMATES
The timely preparation of the Consolidated Financial Statements requires that Management make estimates and assumptions and use judgment regarding the
reported amounts of assets and liabilities and disclosures of contingent assets and liabilities at the date of the Consolidated Financial Statements and the reported
amounts of revenues and expenses during the period. Such estimates primarily relate to unsettled transactions and events as of the date of the Consolidated
Financial Statements. Accordingly, actual results may differ from estimated amounts as future events occur.
Significant items subject to estimates and assumptions are:
Estimates of proved reserves and related future cash flows used for depletion and ceiling test impairment calculations
Estimated fair value of long-term assets used for impairment calculations
Fair value of reporting units used for the assessment of goodwill
Estimates of future taxable earnings used to assess the realizable value of deferred tax assets
Fair value of asset retirement obligations and costs
Fair value of derivative instruments
Tax interpretations, regulations and legislation in the various jurisdictions in which the Company and its subsidiaries operate
Accruals for long-term performance-based compensation arrangements, including whether or not the performance criteria will be met and measurement
of the ultimate payout amount
Recognized values of pension assets and obligations, as well as the pension costs charged to net earnings depend on certain actuarial and economic assumptions
Accruals for legal claims, environmental risks and exposures
NOTES TO CONSOLIDATED FINANCIAL STATEMENTS

Annual Report 2013 | Encana Corporation
NO
TE
S T
O
CO
NS
OL
IDA
TE
D
FIN
AN
CIA
L S
TAT
EM
EN
TS
P
RE
PA
RE
D I
N
AC
CO
RD
AN
CE
WIT
H
U.S
. G
AA
P I
N U
S$
MM
55
F) REVENUE RECOGNITION
Revenues associated with Encana’s natural gas and liquids are recognized when production is sold to a purchaser at a fixed or determinable price, delivery has
occurred, title has transferred and collectability of the revenue is probable. Realized gains and losses from the Company’s financial derivatives related to natural
gas and oil commodity prices are recognized in revenue when the contract is settled. Unrealized gains and losses related to these contracts are recognized
in revenue based on the changes in fair value of the contracts at the end of the respective periods.
Market optimization revenues and purchased product expenses are recorded on a gross basis when Encana takes title to the product and has the risks and
rewards of ownership. Purchases and sales of products that are entered into in contemplation of each other with the same counterparty are recorded on a net
basis. Revenues associated with the services provided where Encana acts as agent are recorded as the services are provided.
G) PRODUCTION AND MINERAL TAXES
Costs paid by Encana to certain mineral and non-mineral interest owners based on production of natural gas and liquids are recognized when the product is produced.
H) TRANSPORTATION AND PROCESSING
Costs paid by Encana for the transportation and processing of natural gas and liquids are recognized when the product is delivered and the services provided.
I) OPERATING
Operating costs paid by Encana for oil and gas properties in which the Company has a working interest. Expenses are net of amounts capitalized in accordance
with the full cost method of accounting.
J) EMPLOYEE BENEFIT PLANS
The Company sponsors defined contribution and defined benefit plans, providing pension and other post-employment benefits to its employees in Canada
and the U.S. As of January 1, 2003, the defined benefit pension plan was closed to new entrants.
Pension expense for the defined contribution pension plan is recorded as the benefits are earned by the employees covered by the plans. Encana accrues for
its obligations under its employee defined benefit plans, net of plan assets. The cost of defined benefit pensions and other post-employment benefits is actuarially
determined using the projected benefit method based on length of service and reflects Management’s best estimate of salary escalation, retirement ages
of employees and expected future health care costs. The expected return on plan assets is based on historical and projected rates of return for assets in the
investment plan portfolio. The actual return is based on the fair value of plan assets. The projected benefit obligation is discounted using the market interest
rate on high-quality corporate debt instruments as at the measurement date.
Pension expense for the defined benefit pension plan includes the cost of pension benefits earned during the current year, the interest cost on pension obligations,
the expected return on pension plan assets, the amortization of the net transitional obligation, the amortization of adjustments arising from pension plan
amendments, the amortization of prior service costs, and the amortization of the excess of the net actuarial gain or loss over 10 percent of the greater of the
benefit obligation and the fair value of plan assets. Amortization is done on a straight-line basis over a period covering the expected average remaining service
lives of employees covered by the plans. Actuarial gains and losses related to the change in the over-funded or under-funded status of the defined benefit pension
plan and other post-employment benefit plans are recognized in other comprehensive income.
K) INCOME TAXES
Encana follows the liability method of accounting for income taxes. Under this method, deferred income taxes are recorded for the effect of any temporary
difference between the accounting and income tax basis of an asset or liability, using the enacted income tax rates and laws expected to apply when the assets
are realized and liabilities are settled. Current income taxes are measured at the amount expected to be recoverable from or payable to the taxation authorities
based on the income tax rates and laws enacted at the end of the reporting period. The effect of a change in the enacted tax rates or laws is recognized in net
earnings in the period of enactment. Income taxes are recognized in net earnings except to the extent that they relate to items recognized directly in shareholders’
equity, in which case the income taxes are recognized directly in shareholders’ equity.
Deferred income tax assets are routinely assessed for realizability. If it is more likely than not that deferred tax assets will not be realized, a valuation allowance
is recorded to reduce the deferred tax assets. Encana considers available positive and negative evidence when assessing the realizability of deferred tax assets
including historic and expected future taxable earnings, available tax planning strategies and carry forward periods. The assumptions used in determining expected
future taxable earnings are consistent with those used in the goodwill impairment assessment.
Encana recognizes the financial statement effects of a tax position when it is more likely than not, based on the technical merits, that the position will be sustained upon
examination by a taxing authority. A recognized tax position is initially and subsequently measured as the largest amount of tax benefit that is greater than 50 percent
likely of being realized upon settlement with a taxing authority. Liabilities for unrecognized tax benefits that are not expected to be settled within the next 12 months
are included in other liabilities and provisions.

Encana Corporation | Annual Report 2013
NO
TE
S T
O
CO
NS
OL
IDA
TE
D
FIN
AN
CIA
L S
TAT
EM
EN
TS
P
RE
PA
RE
D I
N
AC
CO
RD
AN
CE
WIT
H
U.S
. G
AA
P I
N U
S$
MM
56
L) EARNINGS PER SHARE AMOUNTS
Basic net earnings per common share is computed by dividing the net earnings by the weighted average number of common shares outstanding during the period.
Diluted net earnings per common share amounts are calculated giving effect to the potential dilution that would occur if stock options were exercised or other
contracts to issue common shares were exercised, fully vested, or converted to common shares. The treasury stock method is used to determine the dilutive effect
of stock options and other dilutive instruments. The treasury stock method assumes that proceeds received from the exercise of in-the-money stock options and
other dilutive instruments are used to repurchase common shares at the average market price.
M) CASH AND CASH EQUIVALENTS
Cash and cash equivalents include cash on hand and short-term investments, such as money market deposits or similar type instruments, with a maturity of three
months or less when purchased. Outstanding disbursements issued in excess of applicable bank account balances are excluded from cash and cash equivalents
and are recorded in accounts payable and accrued liabilities. Cash in reserve represents cash amounts segregated or held in escrow which are not available for
general operating use.
N) PROPERTY, PLANT AND EQUIPMENT
UPSTREAM
Encana uses the full cost method of accounting for its acquisition, exploration and development activities. Under this method, all costs directly associated with the
acquisition of, the exploration for, and the development of natural gas and liquids reserves are capitalized on a country-by-country cost centre basis. Capitalized
costs exclude costs relating to production, general overhead or similar activities.
Under the full cost method of accounting, the carrying amount of Encana’s natural gas and oil properties within each country cost centre is subject to a ceiling test
performed quarterly. A ceiling test impairment is recognized in net earnings when the carrying amount of a country cost centre exceeds the country cost centre
ceiling. The carrying amount of a cost centre includes capitalized costs of proved oil and gas properties, net of accumulated depletion and the related deferred
income taxes.
The cost centre ceiling is the sum of the estimated after-tax future net cash flows from proved reserves, using the 12-month average trailing prices and
unescalated future development and production costs, discounted at 10 percent, plus unproved property costs. The 12-month average trailing price is calculated
as the average of the price on the first day of each month within the trailing 12-month period. Any excess of the carrying amount over the calculated ceiling
amount is recognized as an impairment in net earnings.
Capitalized costs accumulated within each cost centre are depleted using the unit-of-production method based on proved reserves. Depletion is calculated using
the capitalized costs, including estimated retirement costs, plus the undiscounted future expenditures to be incurred in developing proved reserves.
Costs associated with unproved properties are excluded from the depletion calculation until it is determined that proved reserves are attributable or impairment
has occurred. Unproved properties are assessed separately for impairment on a quarterly basis. Costs that have been impaired are included in the costs subject
to depletion within the full cost pool.
Proceeds from the divestiture of properties are normally deducted from the full cost pool without recognition of gain or loss unless the deduction significantly alters
the relationship between capitalized costs and proved reserves in the cost centre, in which case a gain or loss is recognized in net earnings. Generally, a gain or
loss on a divestiture is not recognized unless more than 25 percent of the Company’s proved reserves quantities in a particular country are sold. For divestitures
that result in the recognition of a gain or loss on the sale and constitute a business, goodwill is allocated to the divestiture.
MARKET OPTIMIZATION
Midstream facilities, including power generation facilities, are carried at cost and depreciated on a straight-line basis over the estimated service lives of the assets,
which are 20 years.
CORPORATE
Costs associated with office furniture, fixtures, leasehold improvements, information technology and aircraft are carried at cost and depreciated on a straight-line basis
over the estimated service lives of the assets, which range from three to 25 years. Costs associated with The Bow office building are carried at cost and depreciated
on a straight-line basis over the 60-year estimated life of the building. Assets under construction are not subject to depreciation until put into use. Land is carried at cost.
O) CAPITALIZATION OF COSTS
Expenditures related to renewals or betterments that improve the productive capacity or extend the life of an asset are capitalized. Maintenance and repairs are
expensed as incurred. Interest is capitalized during the construction phase of major development projects.

Annual Report 2013 | Encana Corporation
NO
TE
S T
O
CO
NS
OL
IDA
TE
D
FIN
AN
CIA
L S
TAT
EM
EN
TS
P
RE
PA
RE
D I
N
AC
CO
RD
AN
CE
WIT
H
U.S
. G
AA
P I
N U
S$
MM
57
P) BUSINESS COMBINATIONS
Business combinations are accounted for using the acquisition method. The acquired identifiable net assets are measured at their fair value at the date
of acquisition. Deferred taxes are recognized for any differences between the fair value of net assets acquired and their tax bases. Any excess of the purchase
price over the fair value of the net assets acquired is recognized as goodwill. Any deficiency of the purchase price below the fair value of the net assets acquired
is recorded as a gain in net earnings. Associated transaction costs are expensed when incurred.
Q) GOODWILL
Goodwill, which represents the excess of purchase price over fair value of net assets acquired, is assessed for impairment at least annually at December 31.
Goodwill and all other assets and liabilities are allocated to reporting units, which are Encana’s country cost centres. To assess impairment, the carrying amount
of each reporting unit is determined and compared to the fair value of the reporting unit. If the carrying amount of the reporting unit is higher than its related fair
value then goodwill is written down to the reporting unit’s implied fair value of goodwill. The implied fair value of goodwill is determined by deducting the fair value
of the reporting unit’s assets and liabilities from the fair value of the reporting unit as if the reporting entity had been acquired in a business combination. Any
excess of the carrying value of goodwill over the implied fair value of goodwill is recognized as an impairment and charged to net earnings. Subsequent
measurement of goodwill is at cost less any accumulated impairments.
R) IMPAIRMENT OF LONG-TERM ASSETS
The carrying value of long-term assets, excluding goodwill and upstream assets included in property, plant and equipment, are assessed for impairment when
indicators suggest that the carrying value of an asset or asset group may not be recoverable. If the carrying amount exceeds the sum of the undiscounted cash
flows expected to result from the continued use and eventual disposition of the asset or asset group, an impairment is recognized for the excess of the carrying
amount over its estimated fair value.
S) ASSET RETIREMENT OBLIGATION
Asset retirement obligations are those legal obligations where the Company will be required to retire tangible long-lived assets such as producing well sites,
offshore production platforms and natural gas processing plants. The fair value of estimated asset retirement obligations is recognized in the Consolidated Balance
Sheet when incurred and a reasonable estimate of fair value can be made. The asset retirement cost, equal to the initially estimated fair value of the asset
retirement obligation, is capitalized as part of the cost of the related long-lived asset. Changes in the estimated obligation resulting from revisions to estimated
timing or amount of future cash flows are recognized as a change in the asset retirement obligation and the related asset retirement cost.
Amortization of asset retirement costs is included in depreciation, depletion and amortization in the Consolidated Statement of Earnings. Increases in the asset
retirement obligations resulting from the passage of time are recorded as accretion of asset retirement obligation in the Consolidated Statement of Earnings.
Actual expenditures incurred are charged against the accumulated asset retirement obligation.
T) STOCK-BASED COMPENSATION
Obligations for payments of cash or common shares under Encana’s stock-based compensation plans are accrued over the vesting period, net of forfeitures,
using fair values. Fair values are determined using observable share prices and/or pricing models such as the Black-Scholes-Merton option-pricing model. For
equity-settled stock-based compensation plans, fair values are determined at the grant date and are recognized over the vesting period as compensation costs
with a corresponding credit to shareholders’ equity. For cash-settled stock-based compensation plans, fair values are determined at each reporting date and
periodic changes are recognized as compensation costs, with a corresponding change to liabilities.
Obligations for payments for share units of Cenovus Energy Inc. (“Cenovus”) held by Encana employees are accrued as compensation costs based on the fair
value of the financial liability.
U) LEASES
Leases entered into for the use of an asset are classified as either capital or operating leases. Capital leases transfer to the Company substantially all of the risks
and benefits incidental to ownership of the leased item. Capital leases are capitalized upon commencement of the lease term at the lower of the fair value of the
leased asset or the present value of the minimum lease payments. Capitalized leased assets are amortized over the estimated useful life of the asset if the lease
arrangement contains a bargain purchase option or ownership of the leased asset transfers at the end of the lease term. Otherwise, the leased assets are
amortized over the lease term. Amortization of capitalized leased assets is included in depreciation, depletion and amortization in the Consolidated Statement
of Earnings. All other leases are classified as operating leases and the payments are recognized on a straight-line basis over the lease term.

Encana Corporation | Annual Report 2013
NO
TE
S T
O
CO
NS
OL
IDA
TE
D
FIN
AN
CIA
L S
TAT
EM
EN
TS
P
RE
PA
RE
D I
N
AC
CO
RD
AN
CE
WIT
H
U.S
. G
AA
P I
N U
S$
MM
58
V) FAIR VALUE MEASUREMENTS
Fair value is defined as the price that would be received to sell an asset or paid to transfer a liability in an orderly transaction between market participants at the
measurement date. Valuation techniques include the market, income, and cost approach. The market approach uses information generated by market transactions
involving identical or comparable assets or liabilities; the income approach converts estimated future amounts to a present value; and the cost approach is based
on the amount that currently would be required to replace an asset.
Inputs used in determining fair value are characterized according to a hierarchy that prioritizes those inputs based on the degree to which they are observable.
The three input levels of the fair value hierarchy are as follows:
Level 1 – Inputs represent quoted prices in active markets for identical assets or liabilities, such as exchange-traded commodity derivatives.
Level 2 – Inputs other than quoted prices included within Level 1 that are observable for the asset or liability, either directly or indirectly, such as quoted market
prices for similar assets or liabilities in active markets or other market corroborated inputs.
Level 3 – Inputs that are not observable from objective sources, such as forward prices supported by little or no market activity or internally developed estimates
of future cash flows used in a present value model.
In determining fair value, the Company utilizes the most observable inputs available. If a fair value measurement reflects inputs at multiple levels within the
hierarchy, the fair value measurement is characterized based on the lowest level of input that is significant to the fair value measurement.
Recurring fair value measurements are performed for risk management assets and liabilities and for share units issued as part of the Split Transaction,
as discussed in Notes 15 and 20. The carrying amount of cash and cash equivalents, accounts receivable and accounts payable reported on the Consolidated
Balance Sheet approximates fair value. The fair value of long-term debt is disclosed in Note 12. Fair value information related to pension plan assets is included
in Note 19.
Certain non-financial assets and liabilities are initially measured at fair value, such as asset retirement obligations and certain assets and liabilities acquired
in business combinations or through non-monetary exchange transactions.
W) RISK MANAGEMENT ASSETS AND LIABILITIES
Risk management assets and liabilities are derivative financial instruments used by Encana to manage economic exposure to market risks relating to commodity
prices, foreign currency exchange rates and interest rates. The use of these derivative instruments is governed under formal policies and is subject to limits
established by the Board of Directors (“Board”). The Company’s policy is not to utilize derivative financial instruments for speculative purposes.
Derivative instruments that do not qualify for the normal purchases and sales exemption are measured at fair value with changes in fair value recognized in
net earnings. The fair values recorded in the Consolidated Balance Sheet reflect netting the asset and liability positions where counterparty master netting
arrangements contain provisions for net settlement. Realized gains or losses from financial derivatives related to natural gas and oil commodity prices are
recognized in revenues as the contracts are settled. Realized gains or losses from financial derivatives related to power commodity prices are recognized in
transportation and processing expense as the related power contracts are settled. Unrealized gains and losses are recognized in revenues and transportation
and processing expense accordingly, at the end of each respective reporting period based on the changes in fair value of the contracts.
X) COMMITMENTS AND CONTINGENCIES
Liabilities for loss contingencies arising from claims, assessments, litigation, environmental and other sources are recorded when it is probable that a liability has
been incurred and the amount can be reasonably estimated. These accruals are adjusted as additional information becomes available or circumstances change.

Annual Report 2013 | Encana Corporation
NO
TE
S T
O
CO
NS
OL
IDA
TE
D
FIN
AN
CIA
L S
TAT
EM
EN
TS
P
RE
PA
RE
D I
N
AC
CO
RD
AN
CE
WIT
H
U.S
. G
AA
P I
N U
S$
MM
59
Y) RECENT ACCOUNTING PRONOUNCEMENTS
CHANGES IN ACCOUNTING POLICIES AND PRACTICES
On January 1, 2013, Encana adopted the following accounting standards updates issued by the Financial Accounting Standards Board (“FASB”), which have
not had a material impact on the Company’s Consolidated Financial Statements:
Accounting Standards Update 2011-11, “Disclosures about Offsetting Assets and Liabilities”, and Accounting Standards Update 2013-01, “Clarifying the Scope
of Disclosures about Offsetting Assets and Liabilities”, require disclosure of both gross and net information about certain financial instruments eligible for offset
in the balance sheet and certain financial instruments subject to master netting arrangements. The amendments have been applied retrospectively.
Accounting Standards Update 2013-02, “Reporting of Amounts Reclassified Out of Accumulated Other Comprehensive Income”, requires enhanced disclosures
about amounts reclassified out of accumulated other comprehensive income. The amendments have been applied prospectively.
NEW STANDARDS ISSUED NOT YET ADOPTED
As of January 1, 2014, Encana will be required to adopt the following accounting standards updates issued by the FASB, which are not expected to have a material
impact on the Company’s Consolidated Financial Statements:
Accounting Standards Update 2013-04, “Obligations Resulting from Joint and Several Liability Arrangements for Which the Total Amount of the Obligation is Fixed at the
Reporting Date”, clarifies guidance for the recognition, measurement and disclosure of liabilities resulting from joint and several liability arrangements. The amendments
will be applied retrospectively.
Accounting Standards Update 2013-05, “Parent’s Accounting for the Cumulative Translation Adjustment upon Derecognition of Certain Subsidiaries or Groups of Assets
within a Foreign Entity or of an Investment in a Foreign Entity”, clarifies the applicable guidance for certain transactions that result in the release of the cumulative
translation adjustment into net earnings. The amendments will be applied prospectively.
Accounting Standards Update 2013-11, “Presentation of an Unrecognized Tax Benefit When a Net Operating Loss Carryforward, a Similar Tax Loss, or a Tax Credit
Carryforward Exists”, clarifies that a liability related to an unrecognized tax benefit or portions thereof should be presented as a reduction to a deferred tax asset for
a net operating loss carryforward, a similar tax loss or a tax credit carryforward, except under specific situations. The amendments will be applied prospectively.
2. SEGMENTED INFORMATION
Encana’s reportable segments are determined based on the Company’s operations and geographic locations as follows:
Canadian Division includes the exploration for, development of, and production of natural gas, oil and NGLs and other related activities within the Canadian cost centre.
USA Division includes the exploration for, development of, and production of natural gas, oil and NGLs and other related activities within the U.S. cost centre.
Market Optimization is primarily responsible for the sale of the Company’s proprietary production. These results are included in the Canadian and USA Divisions.
Market optimization activities include third party purchases and sales of product that provide operational flexibility for transportation commitments, product type,
delivery points and customer diversification. These activities are reflected in the Market Optimization segment. Market Optimization sells substantially all of the
Company’s upstream production to third party customers. Transactions between segments are based on market values and are eliminated on consolidation.
Corporate and Other mainly includes unrealized gains or losses recorded on derivative financial instruments. Once the instruments are settled, the realized gains
and losses are recorded in the reporting segment to which the derivative instrument relates.

Encana Corporation | Annual Report 2013
NO
TE
S T
O
CO
NS
OL
IDA
TE
D
FIN
AN
CIA
L S
TAT
EM
EN
TS
P
RE
PA
RE
D I
N
AC
CO
RD
AN
CE
WIT
H
U.S
. G
AA
P I
N U
S$
MM
60
RESULTS OF OPERATIONS
SEGMENT AND GEOGRAPHIC INFORMATION
Canadian Division USA Division Market Optimization
For the years ended December 31 2013 2012 2011 2013 2012 2011 2013 2012 2011
Revenues, Net of Royalties $ 2,824 $ 2,760 $ 2,872 $ 2,763 $ 3,365 $ 4,022 $ 512 $ 419 $ 703
Expenses
Production and mineral taxes 15 9 15 119 96 183 - - -
Transportation and processing 756 555 490 722 652 728 - - -
Operating 372 352 380 411 377 444 38 48 40
Purchased product - - - - - - 441 349 635
1,681 1,844 1,987 1,511 2,240 2,667 33 22 28
Depreciation, depletion and amortization 601 748 966 818 1,102 1,226 12 12 12
Impairments - 1,822 2,249 - 2,842 - - - -
$ 1,080 $ (726) $ (1,228) $ 693 $ (1,704) $ 1,441 $ 21 $ 10 $ 16
Corporate & Other Consolidated
2013 2012 2011 2013 2012 2011
Revenues, Net of Royalties $ (241) $ (1,384) $ 870 $ 5,858 $ 5,160 $ 8,467
Expenses
Production and mineral taxes - - - 134 105 198
Transportation and processing (2) 24 (25) 1,476 1,231 1,193
Operating 38 17 2 859 794 866
Purchased product - - - 441 349 635
(277) (1,425) 893 2,948 2,681 5,575
Depreciation, depletion and amortization 134 94 78 1,565 1,956 2,282
Impairments 21 31 - 21 4,695 2,249
$ (432) $ (1,550) $ 815 1,362 (3,970) 1,044
Accretion of asset retirement obligation 53 53 50
Administrative 439 392 350
Interest 563 522 468
Foreign exchange (gain) loss, net 325 (107) 133
Other (6) 1 21
1,374 861 1,022
Net Earnings (Loss) Before Income Tax (12) (4,831) 22
Income tax expense (recovery) (248) (2,037) 17
Net Earnings (Loss) $ 236 $ (2,794) $ 5
Annual Report 2013 | Encana Corporation
NO
TE
S T
O
CO
NS
OL
IDA
TE
D
FIN
AN
CIA
L S
TAT
EM
EN
TS
P
RE
PA
RE
D I
N
AC
CO
RD
AN
CE
WIT
H
U.S
. G
AA
P I
N U
S$
MM
61
RESULTS OF OPERATIONS
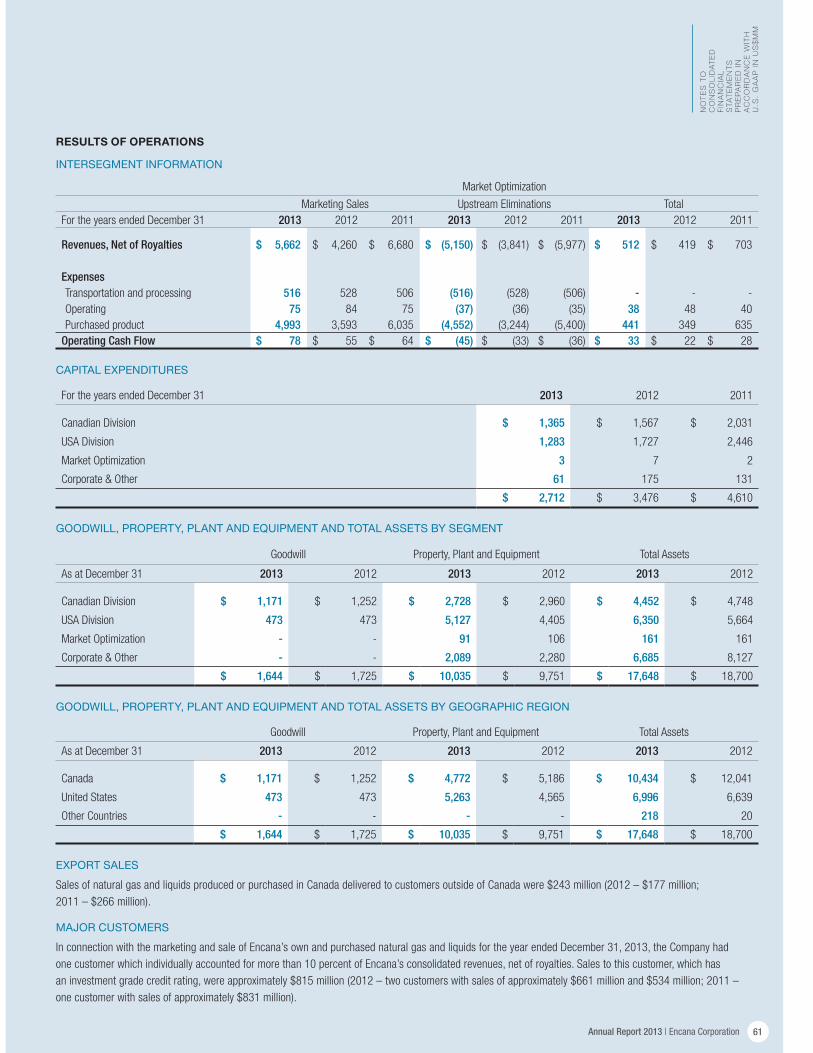
INTERSEGMENT INFORMATION
Market Optimization
Marketing Sales Upstream Eliminations Total
For the years ended December 31 2013 2012 2011 2013 2012 2011 2013 2012 2011
Revenues, Net of Royalties $ 5,662 $ 4,260 $ 6,680 $ (5,150) $ (3,841) $ (5,977) $ 512 $ 419 $ 703
Expenses Transportation and processing 516 528 506 (516) (528) (506) - - -
Operating 75 84 75 (37) (36) (35) 38 48 40
Purchased product 4,993 3,593 6,035 (4,552) (3,244) (5,400) 441 349 635
Operating Cash Flow $ 78 $ 55 $ 64 $ (45) $ (33) $ (36) $ 33 $ 22 $ 28
CAPITAL EXPENDITURES
For the years ended December 31 2013 2012 2011
Canadian Division $ 1,365 $ 1,567 $ 2,031
USA Division 1,283 1,727 2,446
Market Optimization 3 7 2
Corporate & Other 61 175 131
$ 2,712 $ 3,476 $ 4,610
GOODWILL, PROPERTY, PLANT AND EQUIPMENT AND TOTAL ASSETS BY SEGMENT
Goodwill Property, Plant and Equipment Total Assets
As at December 31 2013 2012 2013 2012 2013 2012
Canadian Division $ 1,171 $ 1,252 $ 2,728 $ 2,960 $ 4,452 $ 4,748
USA Division 473 473 5,127 4,405 6,350 5,664
Market Optimization - - 91 106 161 161
Corporate & Other - - 2,089 2,280 6,685 8,127
$ 1,644 $ 1,725 $ 10,035 $ 9,751 $ 17,648 $ 18,700
GOODWILL, PROPERTY, PLANT AND EQUIPMENT AND TOTAL ASSETS BY GEOGRAPHIC REGION
Goodwill Property, Plant and Equipment Total Assets
As at December 31 2013 2012 2013 2012 2013 2012
Canada $ 1,171 $ 1,252 $ 4,772 $ 5,186 $ 10,434 $ 12,041
United States 473 473 5,263 4,565 6,996 6,639
Other Countries - - - - 218 20
$ 1,644 $ 1,725 $ 10,035 $ 9,751 $ 17,648 $ 18,700
EXPORT SALES
Sales of natural gas and liquids produced or purchased in Canada delivered to customers outside of Canada were $243 million (2012 – $177 million;
2011 – $266 million).
MAJOR CUSTOMERS
In connection with the marketing and sale of Encana’s own and purchased natural gas and liquids for the year ended December 31, 2013, the Company had
one customer which individually accounted for more than 10 percent of Encana’s consolidated revenues, net of royalties. Sales to this customer, which has
an investment grade credit rating, were approximately $815 million (2012 – two customers with sales of approximately $661 million and $534 million; 2011 –
one customer with sales of approximately $831 million).

Encana Corporation | Annual Report 2013
NO
TE
S T
O
CO
NS
OL
IDA
TE
D
FIN
AN
CIA
L S
TAT
EM
EN
TS
P
RE
PA
RE
D I
N
AC
CO
RD
AN
CE
WIT
H
U.S
. G
AA
P I
N U
S$
MM
62
3. ACQUISITIONS AND DIVESTITURES
For the years ended December 31 2013 2012 2011
Acquisitions
Canadian Division $ 28 $ 139 $ 410
USA Division 156 240 105
Total Acquisitions 184 379 515
Divestitures
Canadian Division (685) (3,770) (350)
USA Division (18) (271) (1,730)
Corporate & Other (2) (2) -
Total Divestitures (705) (4,043) (2,080)
Net Acquisitions and Divestitures $ (521) $ (3,664) $ (1,565)
ACQUISITIONS
For the year ended December 31, 2013, acquisitions totaled $184 million (2012 – $379 million; 2011 – $515 million), which primarily included land and property
purchases with oil and liquids rich natural gas production potential.
DIVESTITURES
For the year ended December 31, 2013, amounts received on the sale of assets were $705 million (2012 – $4,043 million; 2011 – $2,080 million). In 2013,
divestitures were $685 million in the Canadian Division and $18 million in the USA Division.
The Canadian Division and USA Division divestitures included the following transactions:
CANADIAN DIVISION
In 2013, divestitures in the Canadian Division included the sale of the Company’s Jean Marie natural gas assets in the Greater Sierra resource play in northeast
British Columbia and other assets.
In 2012, Encana entered into a partnership agreement with a Mitsubishi Corporation subsidiary (“Mitsubishi”) to jointly develop certain Cutbank Ridge lands
in British Columbia. Under the agreement, Encana owns 60 percent and Mitsubishi owns 40 percent of the partnership. Mitsubishi agreed to invest approximately
C$2.9 billion for its partnership interest, with C$1.45 billion received in February 2012. Mitsubishi agreed to invest the remaining amount of approximately
C$1.45 billion, in addition to its 40 percent of the partnership’s future capital investment, over an expected commitment period of five years, thereby reducing
Encana’s capital funding commitment to 30 percent of the total expected capital investment.
In 2012, the Company entered into an agreement with a PetroChina Company Limited subsidiary (“PetroChina”) to jointly explore and develop certain liquids
rich natural gas Duvernay lands in Alberta. PetroChina agreed to invest approximately C$2.18 billion for a 49.9 percent working interest in the lands. PetroChina
invested C$1.18 billion in December 2012 and agreed to further invest approximately C$1.0 billion which will be used to fund half of Encana’s capital funding
commitment over an expected commitment period of four years.
In 2012, Encana entered into an agreement with a Toyota Tsusho Corporation subsidiary (“Toyota Tsusho”) under which Toyota Tsusho agreed to invest approximately
C$600 million to acquire a 32.5 percent gross overriding royalty interest in natural gas production from a portion of Encana’s Clearwater resource play. Toyota Tsusho
invested C$100 million in April 2012 and agreed to further invest approximately C$500 million over an expected commitment period of seven years.
In 2012, the Company also closed the sale of two natural gas processing plants in British Columbia and Alberta for proceeds of approximately C$920 million.
USA DIVISION
In December 2011, the Company closed the majority of the North Texas asset sale for proceeds of $836 million. The remainder of the sale closed in March 2012
for proceeds of $114 million. During 2011, Encana also sold its Fort Lupton natural gas processing plant for proceeds of $296 million and its South Piceance
natural gas gathering assets for proceeds of $547 million.
Amounts received from these transactions have been deducted from the respective Canadian and U.S. full cost pools.
Annual Report 2013 | Encana Corporation
NO
TE
S T
O
CO
NS
OL
IDA
TE
D
FIN
AN
CIA
L S
TAT
EM
EN
TS
P
RE
PA
RE
D I
N
AC
CO
RD
AN
CE
WIT
H
U.S
. G
AA
P I
N U
S$
MM
63
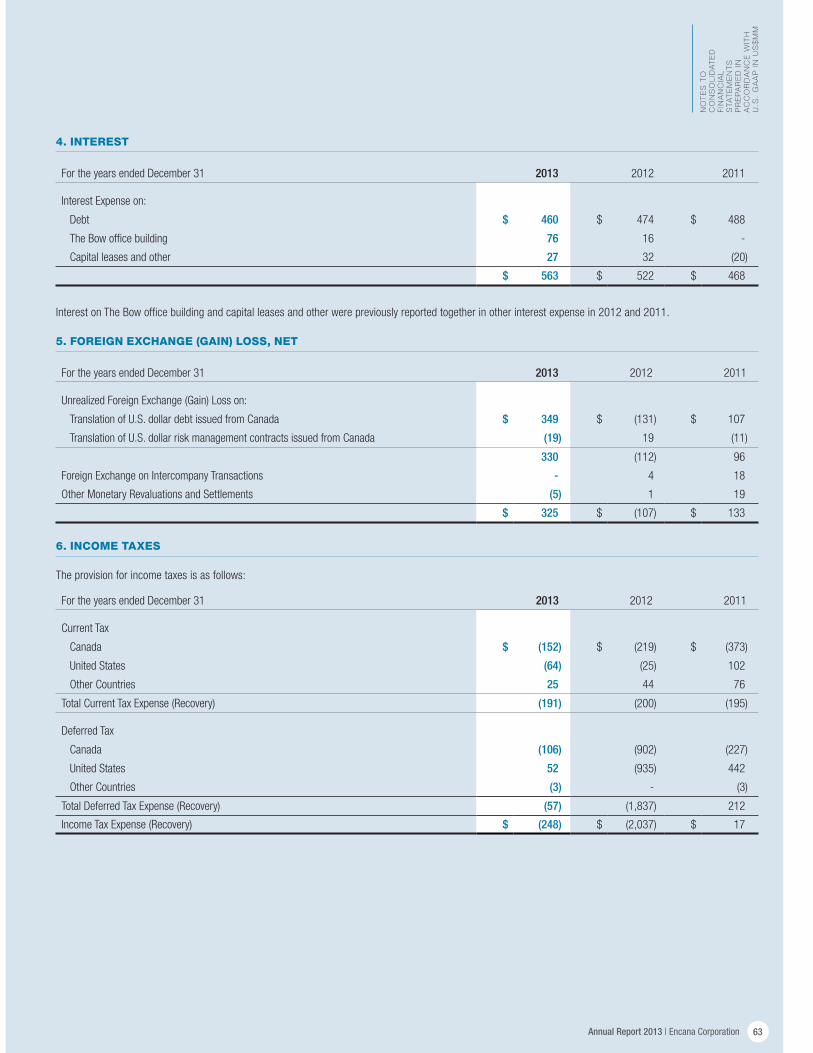
4. INTEREST
For the years ended December 31 2013 2012 2011
Interest Expense on:
Debt $ 460 $ 474 $ 488
The Bow office building 76 16 -
Capital leases and other 27 32 (20)
$ 563 $ 522 $ 468
Interest on The Bow office building and capital leases and other were previously reported together in other interest expense in 2012 and 2011.
5. FOREIGN EXCHANGE (GAIN) LOSS, NET
For the years ended December 31 2013 2012 2011
Unrealized Foreign Exchange (Gain) Loss on:
Translation of U.S. dollar debt issued from Canada $ 349 $ (131) $ 107
Translation of U.S. dollar risk management contracts issued from Canada (19) 19 (11)
330 (112) 96
Foreign Exchange on Intercompany Transactions - 4 18
Other Monetary Revaluations and Settlements (5) 1 19
$ 325 $ (107) $ 133
6. INCOME TAXES
The provision for income taxes is as follows:
For the years ended December 31 2013 2012 2011
Current Tax
Canada $ (152) $ (219) $ (373)
United States (64) (25) 102
Other Countries 25 44 76
Total Current Tax Expense (Recovery) (191) (200) (195)
Deferred Tax
Canada (106) (902) (227)
United States 52 (935) 442
Other Countries (3) - (3)
Total Deferred Tax Expense (Recovery) (57) (1,837) 212
Income Tax Expense (Recovery) $ (248) $ (2,037) $ 17

Encana Corporation | Annual Report 2013
NO
TE
S T
O
CO
NS
OL
IDA
TE
D
FIN
AN
CIA
L S
TAT
EM
EN
TS
P
RE
PA
RE
D I
N
AC
CO
RD
AN
CE
WIT
H
U.S
. G
AA
P I
N U
S$
MM
64
The following table reconciles income taxes calculated at the Canadian statutory rate with the actual income taxes:
For the years ended December 31 2013 2012 2011
Net Earnings (Loss) Before Income Tax
Canada $ (316) $ (2,246) $ (1,973)
United States 46 (2,978) 1,477
Other Countries 258 393 518
Total Net Earnings (Loss) Before Income Tax (12) (4,831) 22
Canadian Statutory Rate 25.1% 25.0% 26.5%
Expected Income Tax (3) (1,208) 6
Effect on Taxes Resulting From:
Statutory rate and other foreign differences (42) (412) 53
Effect of legislative changes (70) - -
Non-taxable capital (gains) losses 48 (16) 20
Tax differences on divestitures and transactions (28) (307) -
Partnership tax allocations in excess of funding (41) (40) -
Amounts in respect of prior periods (103) (64) (60)
Other (9) 10 (2)
$ (248) $ (2,037) $ 17
Effective Tax Rate 2,066.7% 42.2% 77.3%
Statutory rate and other foreign differences above include statutory and other rate differences and international financing, which were previously reported
separately in 2012 and 2011.
The net deferred income tax asset (liability) consists of:
As at December 31 2013 2012
Deferred Income Tax Assets
Property, plant and equipment $ 786 $ 995
Compensation plans 109 113
Accrued and unpaid expense 61 65
Non-capital and net capital losses carried forward 429 119
Alternative minimum tax and foreign tax credits 199 122
Less valuation allowance (6) -
Other 95 61
Deferred Income Tax Liabilities
Property, plant and equipment (407) -
Risk management (63) (176)
Unrealized foreign exchange gains (120) (205)
Other (29) (14)
Net Deferred Income Tax Asset (Liability) $ 1,054 $ 1,080
The net deferred income tax asset (liability) is reflected in the Consolidated Balance Sheet as follows:
As at December 31 2013 2012
Current deferred income tax asset $ 118 $ 23
Non-current deferred income tax asset 939 1,116
Current deferred income tax liability (3) (59)
Net Deferred Income Tax Asset (Liability) $ 1,054 $ 1,080

Annual Report 2013 | Encana Corporation
NO
TE
S T
O
CO
NS
OL
IDA
TE
D
FIN
AN
CIA
L S
TAT
EM
EN
TS
P
RE
PA
RE
D I
N
AC
CO
RD
AN
CE
WIT
H
U.S
. G
AA
P I
N U
S$
MM
65
Tax pools, loss carryforwards, charitable donations and tax credits that can be utilized in future years are as follows:
As at December 31 2013 Expiration Date
Canada
Tax pools $ 4,792 Indefinite
Net capital losses 269 Indefinite
Non-capital losses 505 2015 - 2033
Charitable donations 26 2015 - 2018
United States
Tax basis $ 3,642 Indefinite
Non-capital losses 647 2033
Charitable donations 6 2018
Alternative minimum tax credits 55 Indefinite
Foreign tax credits (net of valuation allowance) 138 2021 - 2023
As at December 31, 2013, approximately $2.6 billion of Encana’s unremitted earnings from its foreign subsidiaries were considered to be permanently reinvested
outside of Canada and, accordingly, Encana has not recognized a deferred tax liability for Canadian income taxes in respect of such earnings. If such earnings were
to be remitted to Canada, Encana may be subject to Canadian income taxes and foreign withholding taxes. However, determination of any potential amount of
unrecognized deferred income tax liabilities is not practicable.
The following table presents changes in the balance of Encana’s unrecognized tax benefits excluding interest:
For the years ended December 31 2013 2012
Balance, Beginning of Year $ 164 $ 165
Additions for tax positions taken in the current year - 2
Additions for tax positions of prior years - 3
Reductions for tax positions of prior years (2) (2)
Lapse of statute of limitations (4) (4)
Settlements (29) (4)
Foreign currency translation (10) 4
Balance, End of Year $ 119 $ 164
The unrecognized tax benefit is reflected in the Consolidated Balance Sheet as follows:
For the years ended December 31 2013 2012
Income tax receivable $ - $ 59
Other liabilities and provisions (See Note 13) 133 134
Current deferred income tax liability 2 5
Non-current deferred income tax asset (16) (34)
Balance, End of Year $ 119 $ 164
If recognized, all of Encana’s unrecognized tax benefits as at December 31, 2013 would affect Encana’s effective income tax rate. Encana does not anticipate
that the amount of unrecognized tax benefits will significantly change during the next 12 months.
Encana recognizes interest accrued in respect of unrecognized tax benefits in interest expense. During 2013, Encana recognized a recovery of $6 million
(2012 – $8 million; 2011 – $18 million) in interest expense. As at December 31, 2013, Encana had a liability of $1 million (2012 – $3 million) for interest
accrued in respect of unrecognized tax benefits.
Encana Corporation | Annual Report 2013
NO
TE
S T
O
CO
NS
OL
IDA
TE
D
FIN
AN
CIA
L S
TAT
EM
EN
TS
P
RE
PA
RE
D I
N
AC
CO
RD
AN
CE
WIT
H
U.S
. G
AA
P I
N U
S$
MM
66
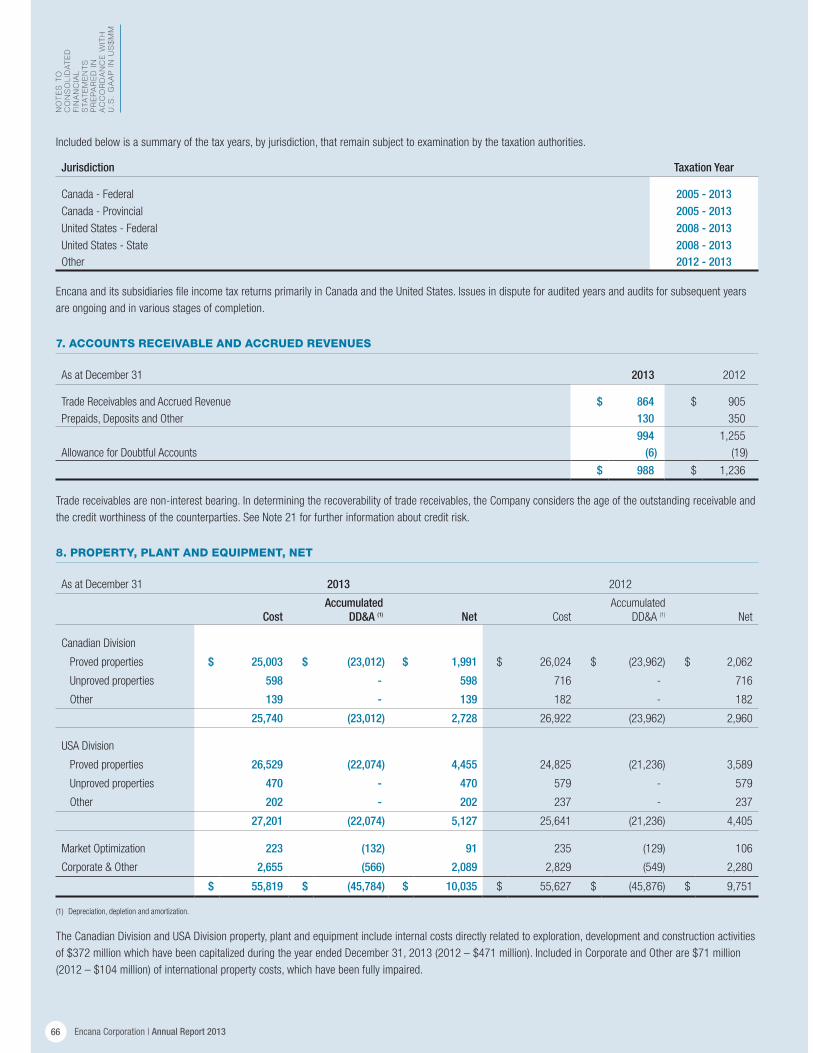
Included below is a summary of the tax years, by jurisdiction, that remain subject to examination by the taxation authorities.
Jurisdiction Taxation Year
Canada - Federal 2005 - 2013Canada - Provincial 2005 - 2013United States - Federal 2008 - 2013United States - State 2008 - 2013Other 2012 - 2013
Encana and its subsidiaries file income tax returns primarily in Canada and the United States. Issues in dispute for audited years and audits for subsequent years
are ongoing and in various stages of completion.
7. ACCOUNTS RECEIVABLE AND ACCRUED REVENUES
As at December 31 2013 2012
Trade Receivables and Accrued Revenue $ 864 $ 905
Prepaids, Deposits and Other 130 350
994 1,255
Allowance for Doubtful Accounts (6) (19)
$ 988 $ 1,236
Trade receivables are non-interest bearing. In determining the recoverability of trade receivables, the Company considers the age of the outstanding receivable and
the credit worthiness of the counterparties. See Note 21 for further information about credit risk.
8. PROPERTY, PLANT AND EQUIPMENT, NET
As at December 31 2013 2012
Cost Accumulated
DD&A (1) Net Cost
Accumulated
DD&A (1) Net
Canadian Division
Proved properties $ 25,003 $ (23,012) $ 1,991 $ 26,024 $ (23,962) $ 2,062
Unproved properties 598 - 598 716 - 716
Other 139 - 139 182 - 182
25,740 (23,012) 2,728 26,922 (23,962) 2,960
USA Division
Proved properties 26,529 (22,074) 4,455 24,825 (21,236) 3,589
Unproved properties 470 - 470 579 - 579
Other 202 - 202 237 - 237
27,201 (22,074) 5,127 25,641 (21,236) 4,405
Market Optimization 223 (132) 91 235 (129) 106
Corporate & Other 2,655 (566) 2,089 2,829 (549) 2,280
$ 55,819 $ (45,784) $ 10,035 $ 55,627 $ (45,876) $ 9,751
(1) Depreciation, depletion and amortization.
The Canadian Division and USA Division property, plant and equipment include internal costs directly related to exploration, development and construction activities
of $372 million which have been capitalized during the year ended December 31, 2013 (2012 – $471 million). Included in Corporate and Other are $71 million
(2012 – $104 million) of international property costs, which have been fully impaired.

Annual Report 2013 | Encana Corporation
NO
TE
S T
O
CO
NS
OL
IDA
TE
D
FIN
AN
CIA
L S
TAT
EM
EN
TS
P
RE
PA
RE
D I
N
AC
CO
RD
AN
CE
WIT
H
U.S
. G
AA
P I
N U
S$
MM
67
For the year ended December 31, 2013, the Company recognized a ceiling test impairment of nil (2012 – $1,822 million; 2011 – $2,249 million) in the Canadian
cost centre and nil (2012 – $2,842 million; 2011 – nil) in the U.S. cost centre. The impairments resulted primarily from the decline in the 12-month average
trailing natural gas prices which reduced proved reserves volumes and values.
The 12-month average trailing prices used in the ceiling test calculations reflect benchmark prices adjusted for basis differentials to determine local reference
prices, transportation costs and tariffs, heat content and quality. The benchmark prices are disclosed in Note 24.
CAPITAL LEASE ARRANGEMENTS
The Company has several lease arrangements that are accounted for as capital leases, including an office building, equipment and an offshore production platform.
In December 2013, Encana commenced commercial operations at its Deep Panuke facility located offshore Nova Scotia following successful completion of the
Production Field Centre (“PFC”) and issuance of the Production Acceptance Notice. As at December 31, 2013, Canadian Division property, plant and equipment
and total assets include the PFC, which is under a capital lease totaling $536 million. As at December 31, 2012, $612 million in accumulated costs related to the
PFC were recorded as an asset under construction.
During 2011, the Company entered into a capital lease arrangement in the U.S. whereby the beneficial rights of ownership of specific equipment would
be conveyed to Encana over five years. The Company recorded an asset under capital lease with a corresponding capital lease obligation totaling $158 million,
which was subsequently paid by Encana.
As at December 31, 2013, the total carrying value of assets under capital lease was $683 million (2012 – $207 million).
OTHER ARRANGEMENT
As at December 31, 2013, Corporate and Other property, plant and equipment and total assets include Encana’s accumulated costs to date of $1,617 million
(2012 – $1,668 million) related to The Bow office building. In 2012, Encana assumed partial occupancy of The Bow office premises and commenced payments
to the third party developer under a 25-year lease agreement. As of March 31, 2013, Encana had assumed full occupancy of the building. The Bow asset is being
depreciated over the 60-year estimated life of the building. At the conclusion of the 25-year term, the remaining asset and corresponding liability are expected
to be derecognized as disclosed in Note 13.
Liabilities for the capital lease arrangements and The Bow office building are included in other liabilities and provisions in the Consolidated Balance Sheet and
are disclosed in Note 13.
9. OTHER ASSETS
As at December 31 2013 2012
Deferred Charges and Debt Transaction Costs $ 58 $ 61
Long-Term Receivables 184 180
Long-Term Investments and Other 284 225
$ 526 $ 466
10. GOODWILL
As at December 31 2013 2012
Canada $ 1,171 $ 1,252
United States 473 473
$ 1,644 $ 1,725
There have been no additions or dispositions of goodwill during 2013 or 2012 and the Company has not recognized any previous goodwill impairments.
The change in the Canada goodwill balance between December 31, 2013 and December 31, 2012 reflects movements due to foreign currency translation.
Goodwill was assessed for impairment as at December 31, 2013 and December 31, 2012. The fair values of the Canada and United States reporting units
were determined to be greater than the respective carrying values of the reporting units. Accordingly, no goodwill impairments were recognized.

Encana Corporation | Annual Report 2013
NO
TE
S T
O
CO
NS
OL
IDA
TE
D
FIN
AN
CIA
L S
TAT
EM
EN
TS
P
RE
PA
RE
D I
N
AC
CO
RD
AN
CE
WIT
H
U.S
. G
AA
P I
N U
S$
MM
68
11. ACCOUNTS PAYABLE AND ACCRUED LIABILITIES
As at December 31 2013 2012
Trade Payables $ 265 $ 417
Capital Accruals 398 415
Royalty and Production Accruals 473 497
Other Accruals 514 490
Interest Payable 111 117
Outstanding Disbursements 2 27
Current Portion of Capital Lease Obligations (See Note 13) 66 7
Current Portion of Asset Retirement Obligation (See Note 14) 66 33
$ 1,895 $ 2,003
Payables and accruals are non-interest bearing. Interest payable represents amounts accrued related to Encana’s unsecured notes as disclosed in Note 12.
12. LONG-TERM DEBT
As at December 31 Note C$ Principal Amount 2013 2012
Canadian Dollar Denominated Debt
Revolving credit and term loan borrowings A $ - $ - $ -
Canadian Unsecured Notes: B
5.80% due January 18, 2018 750 705 754
$ 750 705 754
U.S. Dollar Denominated Debt
Revolving credit and term loan borrowings A - -
U.S. Unsecured Notes: B
4.75% due October 15, 2013 - 500
5.80% due May 1, 2014 1,000 1,000
5.90% due December 1, 2017 700 700
6.50% due May 15, 2019 500 500
3.90% due November 15, 2021 600 600
8.125% due September 15, 2030 300 300
7.20% due November 1, 2031 350 350
7.375% due November 1, 2031 500 500
6.50% due August 15, 2034 750 750
6.625% due August 15, 2037 500 500
6.50% due February 1, 2038 800 800
5.15% due November 15, 2041 400 400
6,400 6,900
Total Principal F 7,105 7,654
Increase in Value of Debt Acquired C 40 46
Debt Discounts D (21) (25)
Current Portion of Long-Term Debt E (1,000) (500)
$ 6,124 $ 7,175
Annual Report 2013 | Encana Corporation
NO
TE
S T
O
CO
NS
OL
IDA
TE
D
FIN
AN
CIA
L S
TAT
EM
EN
TS
P
RE
PA
RE
D I
N
AC
CO
RD
AN
CE
WIT
H
U.S
. G
AA
P I
N U
S$
MM
69
A) REVOLVING CREDIT AND TERM LOAN BORROWINGS
During 2012, the Company issued commercial paper. There are no outstanding balances related to the Company’s commercial paper or revolving credit facilities
as at December 31, 2013 or December 31, 2012. Standby fees paid in 2013 relating to Canadian and U.S. revolving credit and term loan agreements were
approximately $14 million (2012 – $15 million; 2011 – $5 million).
Encana is subject to certain financial covenants in its credit facility agreements and is in compliance with all financial covenants.
CANADIAN REVOLVING CREDIT AND TERM LOAN BORROWINGS
At December 31, 2013, Encana had in place a committed revolving bank credit facility for C$3.5 billion or its equivalent amount in U.S. dollars ($3.3 billion),
all of which remained unused. In June 2013, the Company extended the maturity date of its existing revolving bank credit facility and reduced the facility
from C$4.0 billion to C$3.5 billion. The facility, which matures in June 2018, is fully revolving up to maturity. The facility is extendible from time to time, but
not more than once per year, for a period not longer than five years plus 90 days from the date of the extension request, at the option of the lenders and upon
notice from Encana. The facility is unsecured and bears interest at the lenders’ rates for Canadian prime, U.S. base rate, Bankers’ Acceptances or LIBOR,
plus applicable margins.
U.S. REVOLVING CREDIT AND TERM LOAN BORROWINGS
At December 31, 2013, one of Encana’s subsidiaries had in place a committed revolving bank credit facility for $1.0 billion, of which $999 million remained
unused. In June 2013, the Company extended the maturity date of its existing revolving bank credit facility. The facility, which matures in June 2018, is guaranteed
by Encana Corporation and is fully revolving up to maturity. The facility is extendible from time to time, but not more than once per year, for a period not longer than
five years plus 90 days from the date of the extension request, at the option of the lenders and upon notice from the subsidiary. This facility bears interest at either
the lenders’ U.S. base rate or at LIBOR plus applicable margins.
B) UNSECURED NOTES
Unsecured notes include medium-term notes and senior notes that are issued from time to time under trust indentures and have equal priority with respect
to the payment of both principal and interest.
CANADIAN UNSECURED NOTES
At December 31, 2012, Encana had in place an unutilized debt shelf prospectus for Canadian unsecured medium-term notes in the amount of C$2.0 billion
which expired in June 2013 and was not renewed.
U.S. UNSECURED NOTES
Encana has in place a debt shelf prospectus for U.S. unsecured notes in the amount of $4.0 billion under the multijurisdictional disclosure system. The shelf
prospectus provides that debt securities in U.S. dollars or other foreign currencies may be issued from time to time in one or more series. Terms of the notes,
including interest at either fixed or floating rates and maturity dates, are determined by reference to market conditions at the date of issue. The shelf prospectus
was filed in May 2012 and expires in June 2014. As at December 31, 2013, $4.0 billion of the shelf prospectus remained unutilized, the availability of which
is dependent upon market conditions.
In November 2011, Encana completed a public offering in the U.S. of senior unsecured notes of $600 million with a coupon rate of 3.90 percent due
November 15, 2021 and $400 million with a coupon rate of 5.15 percent due November 15, 2041. The net proceeds of the offering totaling $989 million
were used to repay a portion of Encana’s commercial paper indebtedness, a portion of which was incurred to repay Encana’s $500 million 6.30 percent
notes that matured November 1, 2011.
The 5.80 percent notes due May 1, 2014 were issued by the Company’s indirect 100 percent owned subsidiary, Encana Holdings Finance Corp. This note is fully
and unconditionally guaranteed by Encana Corporation.
C) INCREASE IN VALUE OF DEBT ACQUIRED
Certain of the notes and debentures of the Company were acquired in business combinations and were accounted for at their fair value at the dates of acquisition.
The difference between the fair value and the principal amount of the debt is being amortized over the remaining life of the outstanding debt acquired,
approximately 17 years.
D) DEBT DISCOUNTS
Long-term debt premiums and discounts are capitalized within long-term debt and are being amortized using the effective interest method. During 2013 and 2012,
no discounts were capitalized relating to the issuance of U.S. unsecured notes.
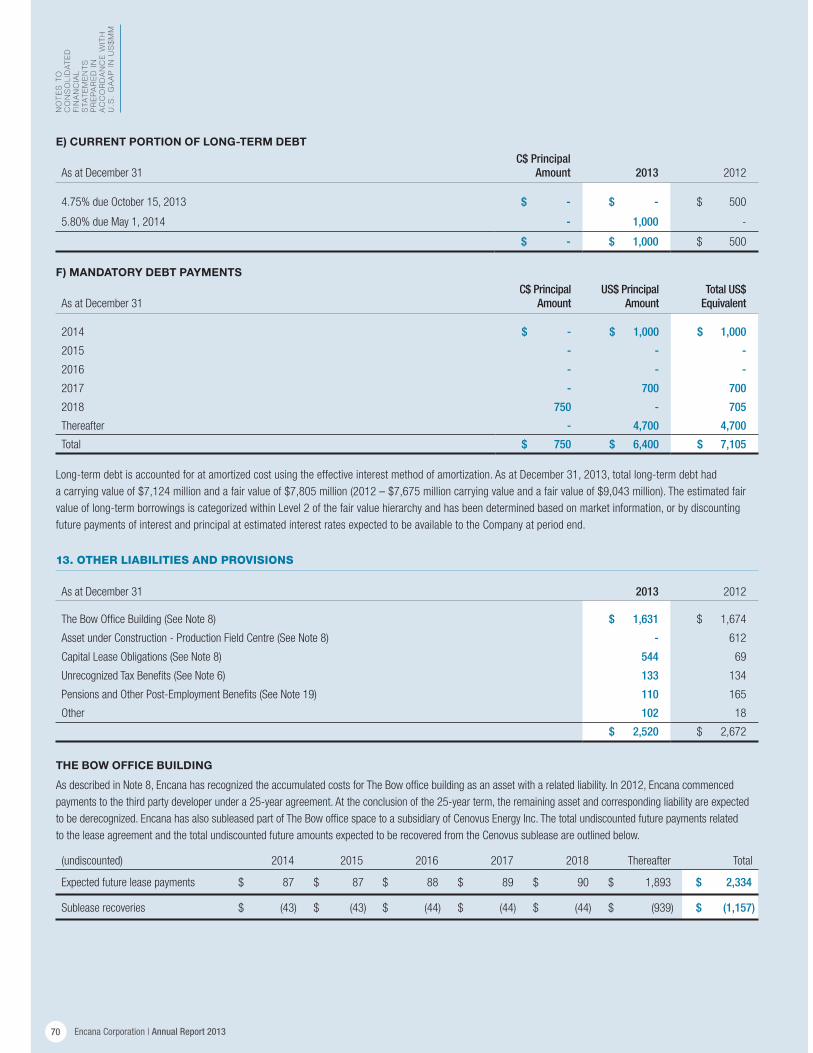
Encana Corporation | Annual Report 2013
NO
TE
S T
O
CO
NS
OL
IDA
TE
D
FIN
AN
CIA
L S
TAT
EM
EN
TS
P
RE
PA
RE
D I
N
AC
CO
RD
AN
CE
WIT
H
U.S
. G
AA
P I
N U
S$
MM
70
E) CURRENT PORTION OF LONG-TERM DEBT
As at December 31
C$ Principal Amount 2013 2012
4.75% due October 15, 2013 $ - $ - $ 500
5.80% due May 1, 2014 - 1,000 -
$ - $ 1,000 $ 500
F) MANDATORY DEBT PAYMENTS
As at December 31
C$ Principal Amount
US$ Principal Amount
Total US$ Equivalent
2014 $ - $ 1,000 $ 1,000
2015 - - -
2016 - - -
2017 - 700 700
2018 750 - 705
Thereafter - 4,700 4,700
Total $ 750 $ 6,400 $ 7,105
Long-term debt is accounted for at amortized cost using the effective interest method of amortization. As at December 31, 2013, total long-term debt had
a carrying value of $7,124 million and a fair value of $7,805 million (2012 – $7,675 million carrying value and a fair value of $9,043 million). The estimated fair
value of long-term borrowings is categorized within Level 2 of the fair value hierarchy and has been determined based on market information, or by discounting
future payments of interest and principal at estimated interest rates expected to be available to the Company at period end.
13. OTHER LIABILITIES AND PROVISIONS
As at December 31 2013 2012
The Bow Office Building (See Note 8) $ 1,631 $ 1,674
Asset under Construction - Production Field Centre (See Note 8) - 612
Capital Lease Obligations (See Note 8) 544 69
Unrecognized Tax Benefits (See Note 6) 133 134
Pensions and Other Post-Employment Benefits (See Note 19) 110 165
Other 102 18
$ 2,520 $ 2,672
THE BOW OFFICE BUILDING
As described in Note 8, Encana has recognized the accumulated costs for The Bow office building as an asset with a related liability. In 2012, Encana commenced
payments to the third party developer under a 25-year agreement. At the conclusion of the 25-year term, the remaining asset and corresponding liability are expected
to be derecognized. Encana has also subleased part of The Bow office space to a subsidiary of Cenovus Energy Inc. The total undiscounted future payments related
to the lease agreement and the total undiscounted future amounts expected to be recovered from the Cenovus sublease are outlined below.
(undiscounted) 2014 2015 2016 2017 2018 Thereafter Total
Expected future lease payments $ 87 $ 87 $ 88 $ 89 $ 90 $ 1,893 $ 2,334
Sublease recoveries $ (43) $ (43) $ (44) $ (44) $ (44) $ (939) $ (1,157)

Annual Report 2013 | Encana Corporation
NO
TE
S T
O
CO
NS
OL
IDA
TE
D
FIN
AN
CIA
L S
TAT
EM
EN
TS
P
RE
PA
RE
D I
N
AC
CO
RD
AN
CE
WIT
H
U.S
. G
AA
P I
N U
S$
MM
71
CAPITAL LEASE OBLIGATIONS
As described in Note 8, the PFC commenced commercial operations in December 2013. Accordingly, Encana derecognized the asset under construction and
related liability and recorded the PFC as a capital lease asset with a corresponding capital lease obligation. Under the lease contract, Encana has a purchase
option and the option to extend the lease for 12 one-year terms at fixed prices after the initial lease term expires in 2021. As a result, the lease contract qualifies
as a variable interest and the related leasing entity qualifies as a variable interest entity (“VIE”). Encana is not the primary beneficiary of the VIE as the Company
does not have the power to direct the activities that most significantly impact the VIE’s economic performance. Encana is not required to provide any financial
support or guarantees to the lease entity and its affiliates, other than the contractual payments under the lease and operating contracts.
The total expected future lease payments related to the Company’s capital lease obligations are outlined below.
2014 2015 2016 2017 2018 Thereafter Total
Expected future lease payments $ 106 $ 93 $ 93 $ 94 $ 94 $ 315 $ 795
Less amounts representing interest 40 32 28 25 20 40 185
Present value of expected future
lease payments $ 66 $ 61 $ 65 $ 69 $ 74 $ 275 $ 610
14. ASSET RETIREMENT OBLIGATION
As at December 31 2013 2012
Asset Retirement Obligation, Beginning of Year $ 969 $ 921
Liabilities Incurred 38 43
Liabilities Settled (126) (90)
Change in Estimated Future Cash Outflows 68 28
Accretion Expense 53 53
Foreign Currency Translation (36) 14
Asset Retirement Obligation, End of Year $ 966 $ 969
Current Portion (See Note 11) $ 66 $ 33
Long-Term Portion 900 936
$ 966 $ 969
Encana is responsible for the retirement of long-lived assets related to its oil and gas assets and midstream assets at the end of their useful lives.

Encana Corporation | Annual Report 2013
NO
TE
S T
O
CO
NS
OL
IDA
TE
D
FIN
AN
CIA
L S
TAT
EM
EN
TS
P
RE
PA
RE
D I
N
AC
CO
RD
AN
CE
WIT
H
U.S
. G
AA
P I
N U
S$
MM
72
15. SHARE CAPITAL
AUTHORIZED
The Company is authorized to issue an unlimited number of no par value common shares, an unlimited number of first preferred shares and an unlimited number
of second preferred shares.
ISSUED AND OUTSTANDING
As at December 31 2013 2012
Number (millions) Amount
Number
(millions) Amount
Common Shares Outstanding, Beginning of Year 736.3 $ 2,354 736.3 $ 2,354
Common Shares Cancelled (0.8) (2) - -
Common Shares Issued under Dividend Reinvestment Plan 5.4 93 - -
Common Shares Outstanding, End of Year 740.9 $ 2,445 736.3 $ 2,354
During the year ended December 31, 2013, Encana cancelled 767,327 common shares reserved for issuance to shareholders upon exchange of predecessor
companies’ shares. In accordance with the terms of the merger agreement which formed Encana, shares which have remained unexchanged were extinguished.
Accordingly, the weighted average book value of the common shares extinguished of $2 million has been transferred to paid in surplus.
During the year ended December 31, 2013, Encana issued 5,385,845 common shares totaling $93 million under the Company’s dividend reinvestment plan.
DIVIDENDS
For the year ended December 31, 2013, Encana paid dividends of $0.67 per common share totaling $494 million (2012 – $0.80 per common share totaling
$588 million; 2011 – $0.80 per common share totaling $588 million). The Company’s quarterly dividend payment in 2013 was $0.20 per common share for the first
three quarters and $0.07 per common share for the fourth quarter. The Company’s quarterly dividend payment in 2012 and 2011 was $0.20 per common share.
For the year ended December 31, 2013, the dividends paid included $93 million in common shares as disclosed above, which were issued in lieu of cash
dividends under the Company’s dividend reinvestment plan (2012 – nil; 2011 – nil).
On February 12, 2014, the Board declared a dividend of $0.07 per common share payable on March 31, 2014 to common shareholders of record as of March 14, 2014.
EARNINGS PER COMMON SHARE
The following table presents the computation of net earnings per common share:
For the years ended December 31 (millions, except per share amounts) 2013 2012 2011
Net Earnings (Loss) $ 236 $ (2,794) $ 5
Number of Common Shares:
Weighted average common shares outstanding - Basic 737.7 736.3 736.3
Effect of dilutive securities - - 0.9
Weighted average common shares outstanding - Diluted 737.7 736.3 737.2
Net Earnings (Loss) per Common Share
Basic $ 0.32 $ (3.79) $ 0.01
Diluted $ 0.32 $ (3.79) $ 0.01

Annual Report 2013 | Encana Corporation
NO
TE
S T
O
CO
NS
OL
IDA
TE
D
FIN
AN
CIA
L S
TAT
EM
EN
TS
P
RE
PA
RE
D I
N
AC
CO
RD
AN
CE
WIT
H
U.S
. G
AA
P I
N U
S$
MM
73
ENCANA STOCK OPTION PLAN
Encana has share-based compensation plans that allow employees to purchase common shares of the Company. Option exercise prices are not less than the
market value of the common shares on the date the options are granted. Options granted are exercisable at 30 percent of the number granted after one year,
an additional 30 percent of the number granted after two years, are fully exercisable after three years and expire five years after the date granted.
All options outstanding as at December 31, 2013 have associated Tandem Stock Appreciation Rights (“TSARs”) attached. In lieu of exercising the option, the
associated TSARs give the option holder the right to receive a cash payment equal to the excess of the market price of Encana’s common shares at the time
of the exercise over the original grant price. In addition, certain stock options granted are performance-based. The Performance TSARs vest and expire under
the same terms and conditions as the underlying option. Vesting is also subject to Encana attaining prescribed performance relative to predetermined key
measures. Historically, most holders of options with TSARs have elected to exercise their stock options as a Stock Appreciation Right (“SAR”) in exchange for
a cash payment. See Note 18 for further information on Encana’s outstanding and exercisable TSARs and Performance TSARs.
At December 31, 2013, there were 19.1 million common shares reserved for issuance under stock option plans (2012 – 18.8 million; 2011 – 10.9 million).
ENCANA RESTRICTED SHARE UNITS (“RSUs”)
Encana has a share-based compensation plan whereby eligible employees are granted RSUs. An RSU is a conditional grant to receive an Encana common share,
or the cash equivalent, as determined by Encana, upon vesting of the RSUs and in accordance with the terms of the RSU Plan and Grant Agreement. The value
of one RSU is notionally equivalent to one Encana common share. RSUs vest three years from the date granted, provided the employee remains actively employed
with Encana on the vesting date. The Company intends to settle vested RSUs in cash on the vesting date. As a result, Encana does not consider RSUs to be
potentially dilutive securities. See Note 18 for further information on Encana’s outstanding RSUs.
ENCANA SHARE UNITS HELD BY CENOVUS EMPLOYEES
On November 30, 2009, Encana completed a corporate reorganization to split into two independent publicly traded energy companies – Encana Corporation and
Cenovus Energy Inc. (the “Split Transaction”). In conjunction with the Split Transaction, each holder of Encana share units disposed of their right in exchange for
the grant of new Encana share units and Cenovus share units. Share units include TSARs, Performance TSARs, SARs and Performance SARs. The terms and
conditions of the share units are similar to the terms and conditions of the original share units.
With respect to the Encana share units held by Cenovus employees and the Cenovus share units held by Encana employees, both Encana and Cenovus have
agreed to reimburse each other for share units exercised for cash by their respective employees. Accordingly, for Encana share units held by Cenovus employees,
Encana has recorded a payable to Cenovus employees and a receivable due from Cenovus. The payable to Cenovus employees and the receivable due from
Cenovus are based on the fair value of the Encana share units determined using the Black-Scholes-Merton model (See Notes 18 and 20). There is no impact on
Encana’s net earnings for the share units held by Cenovus employees. TSARs and Performance TSARs held by Cenovus employees will expire by December 2014.
No further Encana share units have been granted to Cenovus employees since the Split Transaction.
Cenovus employees may exercise Encana TSARs and Encana Performance TSARs in exchange for Encana common shares. As at December 31, 2013, there were
1.5 million Encana TSARs and 2.4 million Encana Performance TSARs with a weighted average exercise price of C$29.09 and C$29.04, respectively, held by
Cenovus employees, which were outstanding and exercisable.
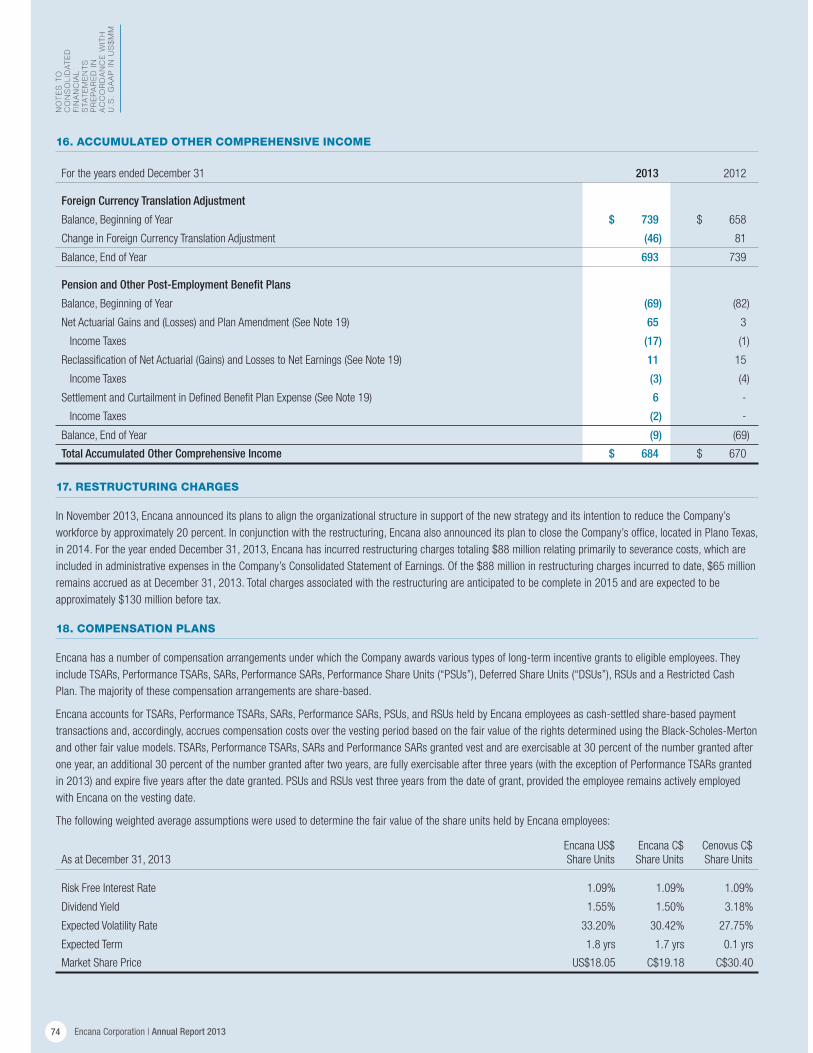
Encana Corporation | Annual Report 2013
NO
TE
S T
O
CO
NS
OL
IDA
TE
D
FIN
AN
CIA
L S
TAT
EM
EN
TS
P
RE
PA
RE
D I
N
AC
CO
RD
AN
CE
WIT
H
U.S
. G
AA
P I
N U
S$
MM
74
16. ACCUMULATED OTHER COMPREHENSIVE INCOME
For the years ended December 31 2013 2012
Foreign Currency Translation Adjustment
Balance, Beginning of Year $ 739 $ 658
Change in Foreign Currency Translation Adjustment (46) 81
Balance, End of Year 693 739
Pension and Other Post-Employment Benefit Plans
Balance, Beginning of Year (69) (82)
Net Actuarial Gains and (Losses) and Plan Amendment (See Note 19) 65 3
Income Taxes (17) (1)
Reclassification of Net Actuarial (Gains) and Losses to Net Earnings (See Note 19) 11 15
Income Taxes (3) (4)
Settlement and Curtailment in Defined Benefit Plan Expense (See Note 19) 6 -
Income Taxes (2) -
Balance, End of Year (9) (69)
Total Accumulated Other Comprehensive Income $ 684 $ 670
17. RESTRUCTURING CHARGES
In November 2013, Encana announced its plans to align the organizational structure in support of the new strategy and its intention to reduce the Company’s
workforce by approximately 20 percent. In conjunction with the restructuring, Encana also announced its plan to close the Company’s office, located in Plano Texas,
in 2014. For the year ended December 31, 2013, Encana has incurred restructuring charges totaling $88 million relating primarily to severance costs, which are
included in administrative expenses in the Company’s Consolidated Statement of Earnings. Of the $88 million in restructuring charges incurred to date, $65 million
remains accrued as at December 31, 2013. Total charges associated with the restructuring are anticipated to be complete in 2015 and are expected to be
approximately $130 million before tax.
18. COMPENSATION PLANS
Encana has a number of compensation arrangements under which the Company awards various types of long-term incentive grants to eligible employees. They
include TSARs, Performance TSARs, SARs, Performance SARs, Performance Share Units (“PSUs”), Deferred Share Units (“DSUs”), RSUs and a Restricted Cash
Plan. The majority of these compensation arrangements are share-based.
Encana accounts for TSARs, Performance TSARs, SARs, Performance SARs, PSUs, and RSUs held by Encana employees as cash-settled share-based payment
transactions and, accordingly, accrues compensation costs over the vesting period based on the fair value of the rights determined using the Black-Scholes-Merton
and other fair value models. TSARs, Performance TSARs, SARs and Performance SARs granted vest and are exercisable at 30 percent of the number granted after
one year, an additional 30 percent of the number granted after two years, are fully exercisable after three years (with the exception of Performance TSARs granted
in 2013) and expire five years after the date granted. PSUs and RSUs vest three years from the date of grant, provided the employee remains actively employed
with Encana on the vesting date.
The following weighted average assumptions were used to determine the fair value of the share units held by Encana employees:
As at December 31, 2013
Encana US$
Share Units
Encana C$
Share Units
Cenovus C$
Share Units
Risk Free Interest Rate 1.09% 1.09% 1.09%
Dividend Yield 1.55% 1.50% 3.18%
Expected Volatility Rate 33.20% 30.42% 27.75%
Expected Term 1.8 yrs 1.7 yrs 0.1 yrs
Market Share Price US$18.05 C$19.18 C$30.40

Annual Report 2013 | Encana Corporation
NO
TE
S T
O
CO
NS
OL
IDA
TE
D
FIN
AN
CIA
L S
TAT
EM
EN
TS
P
RE
PA
RE
D I
N
AC
CO
RD
AN
CE
WIT
H
U.S
. G
AA
P I
N U
S$
MM
75
As at December 31, 2012
Encana US$
Share Units
Encana C$
Share Units
Cenovus C$
Share Units
Risk Free Interest Rate 1.14% 1.14% 1.14%
Dividend Yield 4.05% 4.07% 2.64%
Expected Volatility Rate 34.31% 30.51% 30.18%
Expected Term 2.0 yrs 1.3 yrs 0.5yrs
Market Share Price US$19.76 C$19.66 C$33.29
For both Encana and Cenovus share units held by Encana employees, volatility was estimated using historical volatility rates.
The Company has recognized the following share-based compensation costs:
For the years ended December 31 2013 2012 2011
Compensation Costs of Transactions Classified as Cash-Settled $ 63 $ 42 $ 28
Compensation Costs of Transactions Classified as Equity-Settled (1) 3 5 -
Total Share-Based Compensation Costs 66 47 28
Less: Total Share-Based Compensation Costs Capitalized (22) (14) (14)
Total Share-Based Compensation Expense $ 44 $ 33 $ 14
Recognized on the Consolidated Statement of Earnings in:
Operating expense $ 18 $ 13 $ 8
Administrative expense 26 20 6
$ 44 $ 33 $ 14
(1) RSUs may be settled in cash or equity as determined by Encana. The Company’s decision to cash settle RSUs was made subsequent to the original grant date.
As at December 31, 2013, the liability for share-based payment transactions totaled $169 million, of which $111 million is recognized in accounts payable and
accrued liabilities.
For the years ended December 31 2013 2012 2011
Liability for Unvested Cash-Settled Share-Based Payment Transactions $ 121 $ 85 $ 69
Liability for Vested Cash-Settled Share-Based Payment Transactions 48 71 86
Liability for Cash-Settled Share-Based Payment Transactions $ 169 $ 156 $ 155
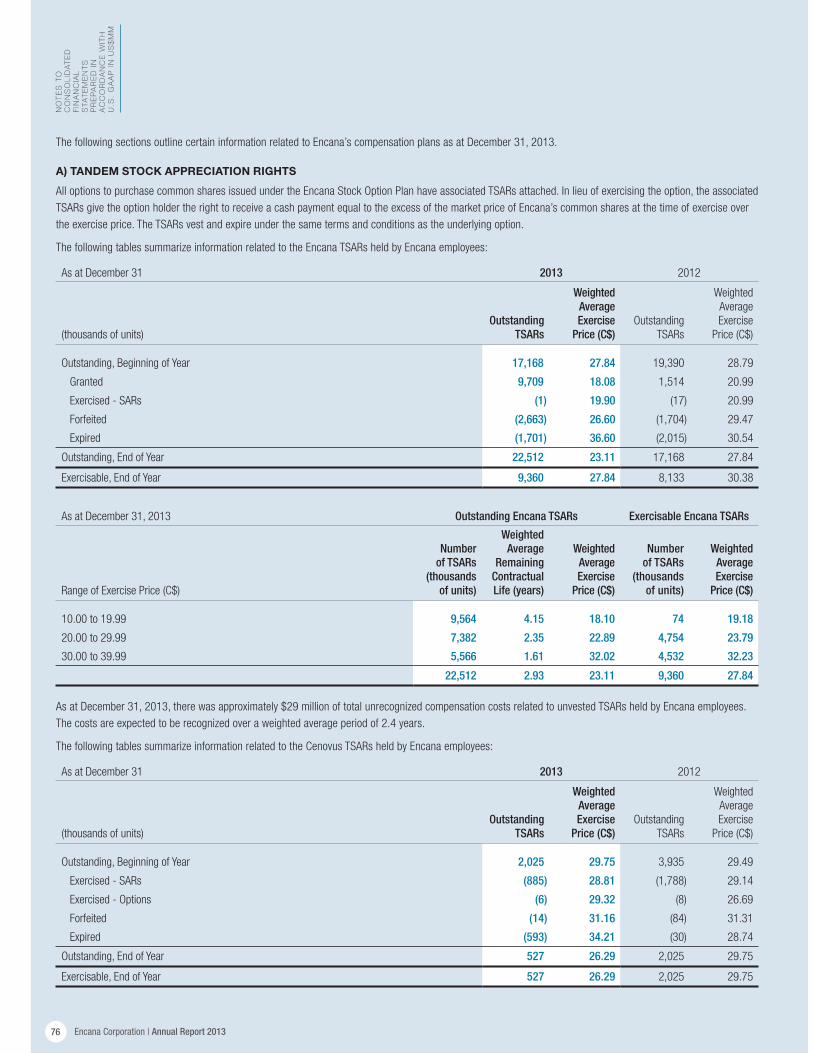
Encana Corporation | Annual Report 2013
NO
TE
S T
O
CO
NS
OL
IDA
TE
D
FIN
AN
CIA
L S
TAT
EM
EN
TS
P
RE
PA
RE
D I
N
AC
CO
RD
AN
CE
WIT
H
U.S
. G
AA
P I
N U
S$
MM
76
The following sections outline certain information related to Encana’s compensation plans as at December 31, 2013.
A) TANDEM STOCK APPRECIATION RIGHTS
All options to purchase common shares issued under the Encana Stock Option Plan have associated TSARs attached. In lieu of exercising the option, the associated
TSARs give the option holder the right to receive a cash payment equal to the excess of the market price of Encana’s common shares at the time of exercise over
the exercise price. The TSARs vest and expire under the same terms and conditions as the underlying option.
The following tables summarize information related to the Encana TSARs held by Encana employees:
As at December 31 2013 2012
(thousands of units)
Outstanding TSARs
Weighted Average Exercise
Price (C$)Outstanding
TSARs
Weighted
Average
Exercise
Price (C$)
Outstanding, Beginning of Year 17,168 27.84 19,390 28.79
Granted 9,709 18.08 1,514 20.99
Exercised - SARs (1) 19.90 (17) 20.99
Forfeited (2,663) 26.60 (1,704) 29.47
Expired (1,701) 36.60 (2,015) 30.54
Outstanding, End of Year 22,512 23.11 17,168 27.84
Exercisable, End of Year 9,360 27.84 8,133 30.38
As at December 31, 2013 Outstanding Encana TSARs Exercisable Encana TSARs
Range of Exercise Price (C$)
Number of TSARs
(thousands of units)
Weighted Average
Remaining Contractual Life (years)
Weighted Average Exercise
Price (C$)
Number of TSARs
(thousands of units)
Weighted Average Exercise
Price (C$)
10.00 to 19.99 9,564 4.15 18.10 74 19.18
20.00 to 29.99 7,382 2.35 22.89 4,754 23.79
30.00 to 39.99 5,566 1.61 32.02 4,532 32.23
22,512 2.93 23.11 9,360 27.84
As at December 31, 2013, there was approximately $29 million of total unrecognized compensation costs related to unvested TSARs held by Encana employees.
The costs are expected to be recognized over a weighted average period of 2.4 years.
The following tables summarize information related to the Cenovus TSARs held by Encana employees:
As at December 31 2013 2012
(thousands of units)
Outstanding TSARs
Weighted Average Exercise
Price (C$)Outstanding
TSARs
Weighted
Average
Exercise
Price (C$)
Outstanding, Beginning of Year 2,025 29.75 3,935 29.49
Exercised - SARs (885) 28.81 (1,788) 29.14
Exercised - Options (6) 29.32 (8) 26.69
Forfeited (14) 31.16 (84) 31.31
Expired (593) 34.21 (30) 28.74
Outstanding, End of Year 527 26.29 2,025 29.75
Exercisable, End of Year 527 26.29 2,025 29.75

Annual Report 2013 | Encana Corporation
NO
TE
S T
O
CO
NS
OL
IDA
TE
D
FIN
AN
CIA
L S
TAT
EM
EN
TS
P
RE
PA
RE
D I
N
AC
CO
RD
AN
CE
WIT
H
U.S
. G
AA
P I
N U
S$
MM
77
As at December 31, 2013 Outstanding Cenovus TSARs Exercisable Cenovus TSARs
Range of Exercise Price (C$)
Number of TSARs
(thousands of units)
Weighted Average
Remaining Contractual Life (years)
Weighted Average Exercise
Price (C$)
Number of TSARs
(thousands of units)
Weighted Average Exercise
Price (C$)
20.00 to 29.99 527 0.13 26.29 527 26.29
During the year, Encana recorded compensation costs of $21 million related to the Encana TSARs and a reduction in compensation costs of $4 million related
to the Cenovus TSARs (2012 – compensation costs of $6 million related to the Encana TSARs and a reduction of compensation costs of $1 million related
to the Cenovus TSARs; 2011 – reduction of compensation costs of $4 million related to the Encana TSARs and compensation costs of $6 million related
to Cenovus TSARs).
B) PERFORMANCE TANDEM STOCK APPRECIATION RIGHTS
From 2007 to 2009, Encana granted Performance TSARs. Upon vesting, in lieu of exercising the option, the option holder has the right to receive a cash payment equal
to the excess of the market price of Encana’s common shares at the time of exercise over the exercise price. The Performance TSARs vest and expire under the same
terms and conditions as the underlying option. Vesting is also subject to Encana attaining prescribed performance relative to an internal recycle ratio and predetermined
performance targets. Performance TSARs that do not vest when eligible are forfeited and cancelled.
In 2013, Encana granted Performance TSARs to the President & Chief Executive Officer (“CEO”). Upon vesting, in lieu of exercising the option, the CEO has the right
to receive a cash payment equal to the excess of the market price of Encana’s common shares at the time of exercise over the exercise price. The Performance TSARs
vest and expire over the same terms and conditions as the underlying option. Under this 2013 grant, vesting is also subject to Encana achieving prescribed
performance targets over a four-year period based on Encana’s share price performance. Performance TSARs that do not vest when eligible are forfeited and cancelled.
The following tables summarize information related to the Encana Performance TSARs held by Encana employees:
As at December 31 2013 2012
(thousands of units)
Outstanding Performance
TSARs
Weighted Average Exercise
Price (C$)
Outstanding
Performance
TSARs
Weighted
Average
Exercise
Price (C$)
Outstanding, Beginning of Year 4,879 32.44 7,879 31.50
Granted 935 18.00 - -
Forfeited (453) 29.12 (779) 31.50
Expired (2,236) 36.44 (2,221) 29.45
Outstanding, End of Year 3,125 25.74 4,879 32.44
Exercisable, End of Year 2,190 29.04 4,879 32.44
As at December 31, 2013 Outstanding Encana Performance TSARsExercisable Encana Performance TSARs
Range of Exercise Price (C$)
Number of TSARs
(thousands of units)
Weighted Average
Remaining Contractual Life (years)
Weighted Average Exercise
Price (C$)
Number of TSARs
(thousands of units)
Weighted Average Exercise
Price (C$)
10.00 to 19.99 935 4.45 18.00 - -
20.00 to 29.99 2,190 0.11 29.04 2,190 29.04
3,125 1.41 25.74 2,190 29.04

Encana Corporation | Annual Report 2013
NO
TE
S T
O
CO
NS
OL
IDA
TE
D
FIN
AN
CIA
L S
TAT
EM
EN
TS
P
RE
PA
RE
D I
N
AC
CO
RD
AN
CE
WIT
H
U.S
. G
AA
P I
N U
S$
MM
78
As at December 31, 2013, there was approximately $1 million of total unrecognized compensation costs related to unvested Performance TSARs held by Encana
employees. The costs are expected to be recognized over a weighted average period of 3.4 years.
The following tables summarize information related to the Cenovus Performance TSARs held by Encana employees:
As at December 31 2013 2012
(thousands of units)
Outstanding Performance
TSARs
Weighted Average Exercise
Price (C$)
Outstanding
Performance
TSARs
Weighted
Average
Exercise
Price (C$)
Outstanding, Beginning of Year 3,205 29.00 5,751 28.60
Exercised - SARs (1,466) 28.72 (2,188) 28.33
Exercised - Options (9) 29.69 (12) 26.61
Forfeited (13) 26.27 (314) 26.69
Expired (764) 32.96 (32) 26.66
Outstanding, End of Year 953 26.27 3,205 29.00
Exercisable, End of Year 953 26.27 3,205 29.00
As at December 31, 2013 Outstanding Cenovus Performance TSARsExercisable Cenovus Performance TSARs
Range of Exercise Price (C$)
Number of TSARs
(thousands of units)
Weighted Average
Remaining Contractual Life (years)
Weighted Average Exercise
Price (C$)
Number of TSARs
(thousands of units)
Weighted Average Exercise
Price (C$)
20.00 to 29.99 953 0.11 26.27 953 26.27
During the year, Encana recorded compensation costs of $1 million related to the Encana Performance TSARs and a reduction in compensation costs of $6 million
related to the Cenovus Performance TSARs (2012 – reduction of compensation costs of $1 million related to the Encana Performance TSARs and reduction
of compensation costs of $2 million related to the Cenovus Performance TSARs; 2011 – reduction of compensation costs of $12 million related to the Encana
Performance TSARs and compensation costs of $14 million related to the Cenovus Performance TSARs).
C) STOCK APPRECIATION RIGHTS
During 2008 and 2009, Canadian dollar denominated SARs were granted to employees, which entitle the employee to receive a cash payment equal to the excess
of the market price of Encana’s common shares at the time of exercise over the exercise price of the right.
The following tables summarize information related to the Encana SARs held by Encana employees:
As at December 31 2013 2012
(thousands of units)
Outstanding SARs
Weighted Average Exercise
Price (C$)Outstanding
SARs
Weighted
Average
Exercise
Price (C$)
Outstanding, Beginning of Year 1,843 33.79 1,973 33.81
Forfeited (156) 30.02 (130) 34.08
Expired (957) 37.98 - -
Outstanding, End of Year 730 29.11 1,843 33.79
Exercisable, End of Year 730 29.11 1,843 33.79

Annual Report 2013 | Encana Corporation
NO
TE
S T
O
CO
NS
OL
IDA
TE
D
FIN
AN
CIA
L S
TAT
EM
EN
TS
P
RE
PA
RE
D I
N
AC
CO
RD
AN
CE
WIT
H
U.S
. G
AA
P I
N U
S$
MM
79
As at December 31, 2013 Outstanding Encana SARs Exercisable Encana SARs
Range of Exercise Price (C$)
Number of SARs
(thousands of units)
Weighted Average
Remaining Contractual Life (years)
Weighted Average Exercise
Price (C$)
Number of SARs
(thousands of units)
Weighted Average Exercise
Price (C$)
20.00 to 29.99 711 0.12 29.05 711 29.05
30.00 to 39.99 19 0.61 31.59 19 31.59
730 0.14 29.11 730 29.11
Since 2010, U.S. dollar denominated SARs have been granted to eligible U.S. based employees. The terms and conditions are similar to the Canadian dollar
denominated SARs. The following tables summarize information related to U.S. dollar denominated Encana SARs held by Encana employees:
As at December 31 2013 2012
(thousands of units)
Outstanding SARs
Weighted Average Exercise
Price (US$)Outstanding
SARs
Weighted
Average
Exercise
Price (US$)
Outstanding, Beginning of Year 12,165 26.50 12,645 26.78
Granted 5,048 17.95 482 20.54
Exercised (2) 17.95 (29) 20.88
Forfeited (2,281) 25.30 (933) 27.36
Outstanding, End of Year 14,930 23.79 12,165 26.50
Exercisable, End of Year 7,328 27.32 4,685 27.75
As at December 31, 2013 Outstanding Encana SARs Exercisable Encana SARs
Range of Exercise Price (US$)
Number of SARs
(thousands of units)
Weighted Average
Remaining Contractual Life (years)
Weighted Average Exercise
Price (US$)
Number of SARs
(thousands of units)
Weighted Average Exercise
Price (US$)
10.00 to 19.99 4,729 4.15 17.96 23 18.86
20.00 to 29.99 4,973 2.77 21.59 2,981 21.92
30.00 to 39.99 5,228 1.58 31.16 4,324 31.09
14,930 2.79 23.79 7,328 27.32
As at December 31, 2013, there was approximately $18 million of total unrecognized compensation costs related to unvested SARs held by Encana employees.
The costs are expected to be recognized over a weighted average period of 2.4 years.

Encana Corporation | Annual Report 2013
NO
TE
S T
O
CO
NS
OL
IDA
TE
D
FIN
AN
CIA
L S
TAT
EM
EN
TS
P
RE
PA
RE
D I
N
AC
CO
RD
AN
CE
WIT
H
U.S
. G
AA
P I
N U
S$
MM
80
The following tables summarize information related to the Cenovus SARs held by Encana employees:
As at December 31 2013 2012
(thousands of units)
Outstanding SARs
Weighted Average Exercise
Price (C$)Outstanding
SARs
Weighted
Average
Exercise
Price (C$)
Outstanding, Beginning of Year 1,027 31.25 1,641 30.73
Exercised (385) 28.38 (591) 29.69
Forfeited (23) 33.62 (23) 34.45
Expired (389) 36.82 - -
Outstanding, End of Year 230 26.42 1,027 31.25
Exercisable, End of Year 230 26.42 1,027 31.25
As at December 31, 2013 Outstanding Cenovus SARs Exercisable Cenovus SARs
Range of Exercise Price (C$)
Number of SARs
(thousands of units)
Weighted Average
Remaining Contractual Life (years)
Weighted Average Exercise
Price (C$)
Number of SARs
(thousands of units)
Weighted Average Exercise
Price (C$)
20.00 to 29.99 228 0.14 26.38 228 26.38
30.00 to 39.99 2 0.77 30.63 2 30.63
230 0.14 26.42 230 26.42
During the year, Encana recorded compensation costs of $1 million related to the Encana SARs and a reduction in compensation costs of $2 million related to the
Cenovus SARs (2012 – compensation costs of $7 million related to the Encana SARs and a reduction in compensation costs of $1 million related to the Cenovus
SARs; 2011 – a reduction in compensation costs of $5 million related to the Encana SARs and compensation costs of $3 million related to the Cenovus SARs).
D) PERFORMANCE STOCK APPRECIATION RIGHTS
During 2008 and 2009, Encana granted Performance SARs to certain employees, which entitle the employee to receive a cash payment equal to the excess of the
market price of Encana’s common shares at the time of exercise over the grant price. Performance SARs are subject to Encana attaining prescribed performance
relative to an internal recycle ratio and predetermined key measures. Performance SARs that do not vest when eligible are forfeited.
The following tables summarize information related to the Encana Performance SARs held by Encana employees:
As at December 31 2013 2012
(thousands of units)
Outstanding Performance
SARs
Weighted Average Exercise
Price (C$)
Outstanding
Performance
SARs
Weighted
Average
Exercise
Price (C$)
Outstanding, Beginning of Year 2,455 32.20 2,710 32.07
Forfeited (239) 29.48 (255) 30.81
Expired (1,035) 36.44 - -
Outstanding, End of Year 1,181 29.04 2,455 32.20
Exercisable, End of Year 1,181 29.04 2,455 32.20

Annual Report 2013 | Encana Corporation
NO
TE
S T
O
CO
NS
OL
IDA
TE
D
FIN
AN
CIA
L S
TAT
EM
EN
TS
P
RE
PA
RE
D I
N
AC
CO
RD
AN
CE
WIT
H
U.S
. G
AA
P I
N U
S$
MM
81
As at December 31, 2013 Outstanding Encana Performance SARsExercisable Encana Performance SARs
Range of Exercise Price (C$)
Number of SARs
(thousands of units)
Weighted Average
Remaining Contractual Life (years)
Weighted Average Exercise
Price (C$)
Number of SARs
(thousands of units)
Weighted Average Exercise
Price (C$)
20.00 to 29.99 1,181 0.11 29.04 1,181 29.04
The following tables summarize information related to the Cenovus Performance SARs held by Encana employees:
As at December 31 2013 2012
(thousands of units)
Outstanding Performance
SARs
Weighted Average Exercise
Price (C$)
Outstanding
Performance
SARs
Weighted
Average
Exercise
Price (C$)
Outstanding, Beginning of Year 1,319 28.74 2,282 28.88
Exercised (631) 28.32 (835) 29.46
Forfeited (9) 26.47 (128) 26.56
Expired (294) 32.96 - -
Outstanding, End of Year 385 26.27 1,319 28.74
Exercisable, End of Year 385 26.27 1,319 28.74
As at December 31, 2013 Outstanding Cenovus Performance SARsExercisable Cenovus Performance SARs
Range of Exercise Price (C$)
Number of SARs
(thousands of units)
Weighted Average
Remaining Contractual Life (years)
Weighted Average Exercise
Price (C$)
Number of SARs
(thousands of units)
Weighted Average Exercise
Price (C$)
20.00 to 29.99 385 0.11 26.27 385 26.27
During the year, Encana recorded no compensation costs related to the Encana Performance SARs and a reduction in compensation costs of $3 million related
to the Cenovus Performance SARs (2012 – no compensation costs related to the Encana Performance SARs and no compensation costs related to the Cenovus
Performance SARs; 2011 – a reduction of compensation costs of $4 million related to the Encana Performance SARs and compensation costs of $5 million related
to the Cenovus Performance SARs).
E) PERFORMANCE SHARE UNITS
Since 2010, PSUs have been granted to eligible employees, which entitle the employee to receive, upon vesting, a cash payment equal to the value of one common
share of Encana for each PSU held, depending upon the terms of the PSU Plan. PSUs vest three years from the date of grant, provided the employee remains
actively employed with Encana on the vesting date.
The ultimate value of the PSUs will depend upon Encana’s performance relative to predetermined corresponding performance targets measured over a three-year
period. For grants during 2010 through 2012, performance is measured relative to an internal recycle ratio as assessed by the Board on an annual basis
to determine whether the performance criteria have been met. Based on this assessment, up to a maximum of two times the original PSU grant may be eligible
to vest in respect of the year being measured. The respective proportion of the original PSU grant deemed eligible to vest for each year will be valued and the
notional cash value deposited to a PSU account, with payout deferred to the final vesting date. For grants made in 2013, performance is measured over
a three-year period relative to a specified performance peer group.

Encana Corporation | Annual Report 2013
NO
TE
S T
O
CO
NS
OL
IDA
TE
D
FIN
AN
CIA
L S
TAT
EM
EN
TS
P
RE
PA
RE
D I
N
AC
CO
RD
AN
CE
WIT
H
U.S
. G
AA
P I
N U
S$
MM
82
The following tables summarize information related to the PSUs:
(thousands of units)
Canadian Dollar Denominated Outstanding PSUs
As at December 31 2013 2012
Outstanding, Beginning of Year 961 1,238
Granted 856 213
Deemed Eligible to Vest (552) (427)
Units, in Lieu of Dividends 40 37
Forfeited (171) (100)
Outstanding, End of Year 1,134 961
(thousands of units)
U.S. Dollar Denominated Outstanding PSUs
As at December 31 2013 2012
Outstanding, Beginning of Year 693 1,089
Granted 192 27
Deemed Eligible to Vest (474) (393)
Units, in Lieu of Dividends 14 27
Forfeited (62) (57)
Outstanding, End of Year 363 693
As at December 31, 2013, there was approximately $16 million of total unrecognized compensation costs related to unvested PSUs held by Encana employees.
The costs are expected to be recognized over a weighted average period of 1.6 years.
During the year, Encana recorded compensation costs of $11 million related to the outstanding PSUs (2012 – $12 million; 2011 – $15 million).
F) DEFERRED SHARE UNITS
The Company has in place a program whereby Directors and certain key employees are issued DSUs, which vest immediately, are equivalent in value to a common
share of the Company and are settled in cash.
Under the DSU Plan, employees have the option to convert either 25 or 50 percent of their annual High Performance Results (“HPR”) award into DSUs. The number
of DSUs converted is based on the value of the award divided by the closing value of Encana’s share price at the end of the performance period of the HPR award.
For both Directors and employees, DSUs can only be redeemed following departure from Encana in accordance with the terms of the respective DSU Plan and must
be redeemed prior to December 15th of the year following the departure from Encana.
The following table summarizes information related to the DSUs:
(thousands of units)
Canadian Dollar Denominated Outstanding DSUs
As at December 31 2013 2012
Outstanding, Beginning of Year 974 905
Granted 106 109
Converted from HPR awards 37 38
Units, in Lieu of Dividends 41 39
Redeemed (131) (117)
Outstanding, End of Year 1,027 974
During the year, Encana recorded compensation costs of $2 million related to the outstanding DSUs (2012 – $2 million; 2011 – reduction of $5 million).
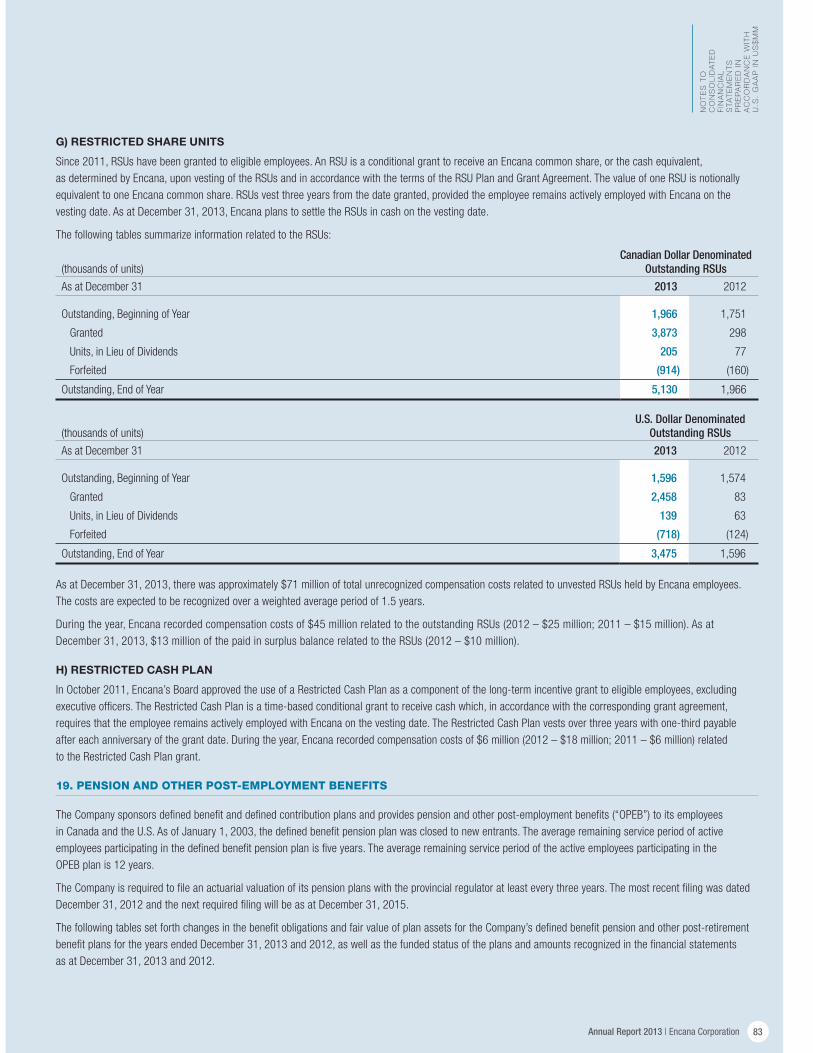
Annual Report 2013 | Encana Corporation
NO
TE
S T
O
CO
NS
OL
IDA
TE
D
FIN
AN
CIA
L S
TAT
EM
EN
TS
P
RE
PA
RE
D I
N
AC
CO
RD
AN
CE
WIT
H
U.S
. G
AA
P I
N U
S$
MM
83
G) RESTRICTED SHARE UNITS
Since 2011, RSUs have been granted to eligible employees. An RSU is a conditional grant to receive an Encana common share, or the cash equivalent,
as determined by Encana, upon vesting of the RSUs and in accordance with the terms of the RSU Plan and Grant Agreement. The value of one RSU is notionally
equivalent to one Encana common share. RSUs vest three years from the date granted, provided the employee remains actively employed with Encana on the
vesting date. As at December 31, 2013, Encana plans to settle the RSUs in cash on the vesting date.
The following tables summarize information related to the RSUs:
(thousands of units)
Canadian Dollar Denominated Outstanding RSUs
As at December 31 2013 2012
Outstanding, Beginning of Year 1,966 1,751
Granted 3,873 298
Units, in Lieu of Dividends 205 77
Forfeited (914) (160)
Outstanding, End of Year 5,130 1,966
(thousands of units)
U.S. Dollar Denominated Outstanding RSUs
As at December 31 2013 2012
Outstanding, Beginning of Year 1,596 1,574
Granted 2,458 83
Units, in Lieu of Dividends 139 63
Forfeited (718) (124)
Outstanding, End of Year 3,475 1,596
As at December 31, 2013, there was approximately $71 million of total unrecognized compensation costs related to unvested RSUs held by Encana employees.
The costs are expected to be recognized over a weighted average period of 1.5 years.
During the year, Encana recorded compensation costs of $45 million related to the outstanding RSUs (2012 – $25 million; 2011 – $15 million). As at
December 31, 2013, $13 million of the paid in surplus balance related to the RSUs (2012 – $10 million).
H) RESTRICTED CASH PLAN
In October 2011, Encana’s Board approved the use of a Restricted Cash Plan as a component of the long-term incentive grant to eligible employees, excluding
executive officers. The Restricted Cash Plan is a time-based conditional grant to receive cash which, in accordance with the corresponding grant agreement,
requires that the employee remains actively employed with Encana on the vesting date. The Restricted Cash Plan vests over three years with one-third payable
after each anniversary of the grant date. During the year, Encana recorded compensation costs of $6 million (2012 – $18 million; 2011 – $6 million) related
to the Restricted Cash Plan grant.
19. PENSION AND OTHER POST-EMPLOYMENT BENEFITS
The Company sponsors defined benefit and defined contribution plans and provides pension and other post-employment benefits (“OPEB”) to its employees
in Canada and the U.S. As of January 1, 2003, the defined benefit pension plan was closed to new entrants. The average remaining service period of active
employees participating in the defined benefit pension plan is five years. The average remaining service period of the active employees participating in the
OPEB plan is 12 years.
The Company is required to file an actuarial valuation of its pension plans with the provincial regulator at least every three years. The most recent filing was dated
December 31, 2012 and the next required filing will be as at December 31, 2015.
The following tables set forth changes in the benefit obligations and fair value of plan assets for the Company’s defined benefit pension and other post-retirement
benefit plans for the years ended December 31, 2013 and 2012, as well as the funded status of the plans and amounts recognized in the financial statements
as at December 31, 2013 and 2012.

Encana Corporation | Annual Report 2013
NO
TE
S T
O
CO
NS
OL
IDA
TE
D
FIN
AN
CIA
L S
TAT
EM
EN
TS
P
RE
PA
RE
D I
N
AC
CO
RD
AN
CE
WIT
H
U.S
. G
AA
P I
N U
S$
MM
84
Pension Benefits OPEB
As at December 31 2013 2012 2013 2012
Change in Benefit Obligations
Projected Benefit Obligation, Beginning of Year $ 357 $ 344 $ 105 $ 95
Service cost 4 5 12 14
Interest cost 12 14 4 4
Actuarial (gains) losses (22) 9 (6) (5)
Exchange differences (19) 8 - -
Benefits paid (22) (23) (4) (3)
Plan amendment - - (13) -
Settlement (26) - - -
Curtailment - - (5) -
Special termination benefits 3 - - -
Projected Benefit Obligation, End of Year $ 287 $ 357 $ 93 $ 105
Change in Plan Assets
Fair Value of Plan Assets, Beginning of Year $ 309 $ 275 $ - $ -
Actual return on plan assets 40 26 - -
Exchange differences (21) 6 - -
Employer contributions 12 25 4 3
Benefits paid (22) (23) (4) (3)
Settlement (26) - - -
Special termination benefits (1) - - -
Fair Value of Plan Assets, End of Year $ 291 $ 309 $ - $ -
Funded Status of Plan Assets, End of Year $ 4 $ (48) $ (93) $ (105)
Total Recognized Amounts in the Consolidated Balance Sheet Consist of:
Other assets $ 10 $ 3 $ - $ -
Current liabilities - - (6) (4)
Non-current liabilities (6) (51) (87) (101)
Total $ 4 $ (48) $ (93) $ (105)
Total Recognized Amounts in Accumulated Other Comprehensive Income Consist of:
Net actuarial (gain) loss $ 37 $ 94 $ (6) $ 1
Prior service costs (6) - (8) 1
Net transitional obligation - - - 3
Total recognized in accumulated other comprehensive income, before tax $ 31 $ 94 $ (14) $ 5
The accumulated defined benefit obligation for all defined benefit plans was $362 million as at December 31, 2013 (2012 – $437 million). The following sets forth
the defined benefit plans with accumulated benefit obligation and projected benefit obligation in excess of the plan assets fair value:
Pension Benefits OPEB
As at December 31 2013 2012 2013 2012
Projected Benefit Obligation $ (87) $ (357) $ (93) $ (105)
Accumulated Benefit Obligation (72) (332) (93) (105)
Fair Value of Plan Assets 81 305 - -

Annual Report 2013 | Encana Corporation
NO
TE
S T
O
CO
NS
OL
IDA
TE
D
FIN
AN
CIA
L S
TAT
EM
EN
TS
P
RE
PA
RE
D I
N
AC
CO
RD
AN
CE
WIT
H
U.S
. G
AA
P I
N U
S$
MM
85
Following are the weighted average assumptions used by the Company in determining the defined benefit pension and other post-employment benefit obligations:
Pension Benefits OPEB
As at December 31 2013 2012 2013 2012
Discount Rate 4.50% 3.75% 4.45% 3.55%
Rates of Increase in Compensation Levels 3.99% 3.99% 6.38% 6.32%
The following sets forth total benefit plan expense recognized by the Company in 2013, 2012 and 2011:
Pension Benefits OPEB
For the years ended December 31 2013 2012 2011 2013 2012 2011
Defined Benefit Plan Expense $ 21 $ 6 $ 14 $ 11 $ 18 $ 17
Defined Contribution Plan Expense 43 44 43 - - -
Total Benefit Plans Expense $ 64 $ 50 $ 57 $ 11 $ 18 $ 17
Of the total benefit plans expense, $60 million (2012 – $55 million; 2011 – $60 million) was included in operating expense and $15 million (2012 – $13 million;
2011 – $14 million) was included in administrative expense.
The defined periodic pension and OPEB expense is as follows:
Pension Benefits OPEB
For the years ended December 31 2013 2012 2011 2013 2012 2011
Current service cost $ 4 $ 5 $ 5 $ 12 $ 14 $ 12
Interest cost 12 14 15 4 4 4
Expected return on plan assets (16) (28) (15) - - -
Amounts reclassified from accumulated other
comprehensive income:
Amortization of net actuarial (gains) and losses 11 15 8 - - -
Amortization of transitional obligation - - - - - 1
Amortization of net prior service costs - - 1 - - -
Settlement 5 - - - - -
Curtailment 1 - - - - -
Curtailment - - - (5) - -
Special termination benefits 4 - - - - -
Total Defined Benefit Plan Expense $ 21 $ 6 $ 14 $ 11 $ 18 $ 17
The amounts recognized in other comprehensive income are as follows:
Pension Benefits OPEB
For the years ended December 31 2013 2012 2011 2013 2012 2011
Net actuarial (gains) losses $ (46) $ 2 $ 58 $ (6) $ (5) $ (3)
Plan amendment - - - (13) - -
Amortization of net actuarial gains and losses (11) (15) (8) - - -
Amortization of transitional obligation - - - - - (1)
Amortization of net prior service costs - - (1) - - -
Net prior service costs (credit) - - - - - 1
Settlement (5) - - - - -
Curtailment (1) - - - - -
Total amounts recognized in other comprehensive (income) loss, before tax $ (63) $ (13) $ 49 $ (19) $ (5) $ (3)
Total amounts recognized in other comprehensive (income) loss, after tax $ (46) $ (9) $ 36 $ (14) $ (4) $ (2)

Encana Corporation | Annual Report 2013
NO
TE
S T
O
CO
NS
OL
IDA
TE
D
FIN
AN
CIA
L S
TAT
EM
EN
TS
P
RE
PA
RE
D I
N
AC
CO
RD
AN
CE
WIT
H
U.S
. G
AA
P I
N U
S$
MM
86
The estimated net actuarial loss and net prior service costs for the pension and other post-retirement plans that will be amortized from accumulated other
comprehensive income into net benefit plan expense in 2014 is nil.
Following are the weighted average assumptions used by the Company in determining the net periodic pension and other post-retirement benefit costs for 2013,
2012 and 2011.
Pension Benefits OPEB
For the years ended December 31 2013 2012 2011 2013 2012 2011
Discount Rate 4.25% 4.00% 5.00% 3.59% 4.31% 5.11%
Long-Term Rate of Return on Plan Assets 6.75% 6.75% 6.75% - - -
Rates of Increase in Compensation Levels 3.99% 4.11% 4.11% 6.35% 6.41% 6.42%
The Company’s assumed health care cost trend rates are as follows:
For the years ended December 31 2013 2012 2011
Health care cost trend rate for next year 7.31% 7.70% 8.99%
Rate to which the cost trend rate is assumed to decline (ultimate trend rate) 4.61% 4.63% 4.64%
Year that the rate reaches the ultimate trend rate 2026 2025 2026
A one percent change in the assumed health care cost trend rate over the projected period would have the following effects:
(millions) 1% Increase 1% Decrease
Effect on total of service and interest cost components $ 2 $ (1)
Effect on other post-retirement benefit obligations $ 6 $ (5)
The Company expects to contribute $7 million to its defined benefit pension plans in 2014. The Company’s OPEB plans are funded on an as required basis.
The following provides an estimate of benefit payments for the next 10 years. These estimates reflect benefit increases due to continuing employee service.
(millions)
Defined Benefit Pension Payments
Other Benefit Payments
2014 $ 18 $ 6
2015 19 6
2016 19 7
2017 19 7
2018 20 7
2019 - 2023 99 35

Annual Report 2013 | Encana Corporation
NO
TE
S T
O
CO
NS
OL
IDA
TE
D
FIN
AN
CIA
L S
TAT
EM
EN
TS
P
RE
PA
RE
D I
N
AC
CO
RD
AN
CE
WIT
H
U.S
. G
AA
P I
N U
S$
MM
87
The Company’s defined benefit pension plan assets are presented by investment asset category and input level within the fair value hierarchy as follows:
As at December 31 2013
Level 1 Level 2 Level 3 Total
Investments:
Cash and Cash Equivalents $ 51 $ 1 $ - $ 52
Fixed Income - Canadian Bond Funds - 57 - 57
Equity - Domestic 35 62 - 97
Equity - International - 71 - 71
Real Estate and Other 1 - 13 14
Fair Value of Plan Assets, End of Year $ 87 $ 191 $ 13 $ 291
As at December 31 2012
Level 1 Level 2 Level 3 Total
Investments:
Cash and Cash Equivalents $ 50 $ 1 $ - $ 51
Fixed Income - Canadian Bond Funds - 75 - 75
Equity - Domestic 34 63 - 97
Equity - International - 72 - 72
Real Estate and Other 1 - 13 14
Fair Value of Plan Assets, End of Year $ 85 $ 211 $ 13 $ 309
Fixed income investments consist of Canadian bonds issued by investment grade companies. Equity investments consist of both domestic and international
securities. The fair values of these securities are based on dealer quotes, quoted market prices, and net asset values as provided by the investment managers.
Real Estate and Other consists mainly of commercial properties and is valued based on a discounted cash flow model.
Real Estate and Other
As at December 31 2013 2012
Balance, Beginning of Year $ 13 $ 12
Purchases, issuances and settlements
Purchases - -
Settlements - -
Actual return on plan assets
Relating to assets sold during the reporting period - -
Relating to assets still held at the reporting date - 1
Balance, End of Year $ 13 $ 13
The Company’s pension plan assets were invested in the following as at December 31, 2013: 39 percent Domestic Equity (2012 – 37 percent), 29 percent
Foreign Equity (2012 – 26 percent), 26 percent Bonds (2012 – 30 percent), and 6 percent Real Estate and Other (2012 – 7 percent). The expected long-term rate
of return is 6.75 percent. The expected rate of return on pension plan assets is based on historical and projected rates of return for each asset class in the plan
investment portfolio. The actual return on plan assets was $40 million (2012 – $26 million). The asset allocation structure is subject to diversification requirements
and constraints, which reduce risk by limiting exposure to individual equity investment, credit rating categories and foreign currency exposure.

Encana Corporation | Annual Report 2013
NO
TE
S T
O
CO
NS
OL
IDA
TE
D
FIN
AN
CIA
L S
TAT
EM
EN
TS
P
RE
PA
RE
D I
N
AC
CO
RD
AN
CE
WIT
H
U.S
. G
AA
P I
N U
S$
MM
88
20. FAIR VALUE MEASUREMENTS
The fair values of cash and cash equivalents, accounts receivable and accrued revenues, and accounts payable and accrued liabilities approximate their carrying
amounts due to the short-term maturity of those instruments except for the amounts associated with share units issued as part of the Split Transaction,
as disclosed below. The fair value of cash in reserve approximates its carrying amount due to the nature of the instruments held. Fair value information related
to pension plan assets is included in Note 19.
Recurring fair value measurements are performed for risk management assets and liabilities and for share units resulting from the Split Transaction, which are
discussed further in Notes 21 and 18, respectively. These items are carried at fair value in the Consolidated Balance Sheet and are classified within the three
levels of the fair value hierarchy in the following tables. There have been no transfers between the hierarchy levels during the period.
As at December 31, 2013
Level 1 Quoted Prices
in Active Markets
Level 2 Other
Observable Inputs
Level 3 Significant
Unobservable Inputs
Total Fair Value Netting (4)
Carrying Amount
Risk Management
Risk Management Assets
Current $ - $ 71 $ - $ 71 $ (15) $ 56 Long-term - 204 - 204 - 204 Risk Management Liabilities Current - 38 2 40 (15) 25 Long-term - - 5 5 - 5
Share Units Resulting from the Split Transaction
Encana Share Units Held by Cenovus Employees
Accounts receivable and accrued revenues (1) $ - $ - $ - $ - $ - $ -
Accounts payable and accrued liabilities (2) - - - - - -
Cenovus Share Units Held by Encana Employees
Accounts payable and accrued liabilities (3) - - 8 8 - 8
As at December 31, 2012
Level 1
Quoted Prices
in Active
Markets
Level 2
Other
Observable
Inputs
Level 3
Significant
Unobservable
Inputs
Total
Fair Value Netting (4)
Carrying
Amount
Risk ManagementRisk Management Assets
Current $ 2 $ 505 $ - $ 507 $ (28) $ 479
Long-term - 112 - 112 (1) 111
Risk Management Liabilities
Current - 25 8 33 (28) 5
Long-term - 7 4 11 (1) 10
Share Units Resulting from the Split Transaction
Encana Share Units Held by Cenovus Employees
Accounts receivable and accrued revenues (1) $ - $ - $ 1 $ 1 $ - $ 1
Accounts payable and accrued liabilities (2) - - 1 1 - 1
Cenovus Share Units Held by Encana Employees
Accounts payable and accrued liabilities (3) - - 36 36 - 36
(1) Receivable from Cenovus.
(2) Payable to Cenovus employees.
(3) Payable to Cenovus.
(4) Netting to offset derivative assets and liabilities where the legal right and intention to offset exists, or where counterparty master netting arrangements contain provisions for net settlement.

Annual Report 2013 | Encana Corporation
NO
TE
S T
O
CO
NS
OL
IDA
TE
D
FIN
AN
CIA
L S
TAT
EM
EN
TS
P
RE
PA
RE
D I
N
AC
CO
RD
AN
CE
WIT
H
U.S
. G
AA
P I
N U
S$
MM
89
The Company’s Level 1 and Level 2 risk management assets and liabilities consist of commodity fixed price contracts and basis swaps with terms to 2016. The fair
values of these contracts are based on a market approach and are estimated using inputs which are either directly or indirectly observable at the reporting date,
such as exchange and other published prices, broker quotes and observable trading activity.
LEVEL 3 FAIR VALUE MEASUREMENTS
As at December 31, 2013, the Company’s Level 3 risk management assets and liabilities consist of power purchase contracts with terms to 2017. The fair values
of the power purchase contracts are based on the income approach and are modelled internally using observable and unobservable inputs such as forward power
prices in less active markets. The unobservable inputs are obtained from third parties whenever possible and reviewed by the Company for reasonableness.
Changes in amounts related to risk management assets and liabilities are recognized in revenues and transportation and processing expense according to their
purpose. Changes in amounts related to share units resulting from the Split Transaction are recognized in operating expense, administrative expense and
capitalized within property, plant and equipment as described in Note 18.
A summary of changes in Level 3 fair value measurements during 2013 and 2012 is presented below:
Risk Management
Share Units Resulting from
Split Transaction
2013 2012 2013 2012
Balance, Beginning of Year $ (12) $ 18 $ (36) $ (83)
Total gains (losses) 3 (18) 16 4
Purchases, issuances and settlements
Purchases - - - -
Settlements 2 (12) 12 43
Transfers in and out of Level 3 - - - -
Balance, End of Year $ (7) $ (12) $ (8) $ (36)
Change in unrealized gains (losses) related to assets and liabilities
held at end of year $ (2) $ (21) $ 20 $ (7)
Quantitative information about unobservable inputs used in Level 3 fair value measurements is presented below:
Valuation Technique Unobservable Input 2013 2012
Risk Management - Natural Gas Options Option Model Price Volatility - 0.3% - 28.3%
Risk Management - Power Discounted Cash Flow
Forward prices
($/Megawatt Hour) $49.25 - $54.47 $48.25 - $57.97
Share Units Resulting from the Split Transaction Option Model
Cenovus share
unit volatility 27.75% 30.18%
A five percentage point increase or decrease in natural gas price volatility would cause no decrease or increase (2012 – nil) to net risk management assets.
A 10 percent increase or decrease in estimated forward power prices would cause a corresponding $7 million (2012 – $6 million) increase or decrease
to net risk management assets. A five percentage point increase or decrease in Cenovus share unit estimated volatility would cause no increase or decrease
(2012 – $2 million) to accounts payable and accrued liabilities.

Encana Corporation | Annual Report 2013
NO
TE
S T
O
CO
NS
OL
IDA
TE
D
FIN
AN
CIA
L S
TAT
EM
EN
TS
P
RE
PA
RE
D I
N
AC
CO
RD
AN
CE
WIT
H
U.S
. G
AA
P I
N U
S$
MM
90
21. FINANCIAL INSTRUMENTS AND RISK MANAGEMENT
A) FINANCIAL INSTRUMENTS
Encana’s financial assets and liabilities are recognized in cash and cash equivalents, accounts receivable and accrued revenues, cash in reserve, accounts payable
and accrued liabilities, risk management assets and liabilities and long-term debt.
B) RISK MANAGEMENT ASSETS AND LIABILITIES
Risk management assets and liabilities arise from the use of derivative financial instruments and are measured at fair value. See Note 20 for a discussion of fair
value measurements.
UNREALIZED RISK MANAGEMENT POSITION
As at December 31 2013 2012
Risk Management Asset
Current $ 56 $ 479
Long-term 204 111
260 590
Risk Management Liability
Current 25 5
Long-term 5 10
30 15
Net Risk Management Asset $ 230 $ 575
SUMMARY OF UNREALIZED RISK MANAGEMENT POSITIONS – BY PRODUCT
As at December 31 2013 2012
Risk Management Risk Management
Asset Liability Net Asset Liability Net
Commodity Prices
Natural gas $ 183 $ 15 $ 168 $ 545 $ 6 $ 539
Crude oil 77 8 69 45 - 45
Power - 7 (7) - 9 (9)
Total Fair Value $ 260 $ 30 $ 230 $ 590 $ 15 $ 575

Annual Report 2013 | Encana Corporation
NO
TE
S T
O
CO
NS
OL
IDA
TE
D
FIN
AN
CIA
L S
TAT
EM
EN
TS
P
RE
PA
RE
D I
N
AC
CO
RD
AN
CE
WIT
H
U.S
. G
AA
P I
N U
S$
MM
91
COMMODITY PRICE POSITIONS AS AT DECEMBER 31, 2013
Notional Volumes Term Average Price Fair Value
Natural Gas Contracts
Fixed Price Contracts
NYMEX Fixed Price 2,138 MMcf/d 2014 4.17 US$/Mcf $ (13)
NYMEX Fixed Price 825 MMcf/d 2015 4.37 US$/Mcf 65
Basis Contracts (1) 2014-2016 116
Natural Gas Fair Value Position 168
Crude Oil Contracts
Fixed Price Contracts
WTI Fixed Price 9.5 Mbbls/d 2014 94.19 US$/bbl (5)
Basis Contracts (2) 2014-2015 74
Crude Oil Fair Value Position 69
Power Purchase Contracts
Fair Value Position (7)
Total Fair Value $ 230
(1) Encana has entered into swaps to protect against widening natural gas price differentials in Canada. These basis swaps are priced using differentials determined as a percentage of NYMEX.
(2) Encana has entered into swaps to protect against widening oil price differentials between Brent and WTI. These basis swaps are priced using fixed price differentials.
EARNINGS IMPACT OF REALIZED AND UNREALIZED GAINS (LOSSES) ON RISK MANAGEMENT POSITIONS
Realized Gain (Loss)
For the years ended December 31 2013 2012 2011
Revenues, Net of Royalties $ 544 $ 2,149 $ 955
Transportation and Processing - 12 (7)
Gain (Loss) on Risk Management $ 544 $ 2,161 $ 948
Unrealized Gain (Loss)
For the years ended December 31 2013 2012 2011
Revenues, Net of Royalties $ (347) $ (1,441) $ 854
Transportation and Processing 2 (24) 25
Gain (Loss) on Risk Management $ (345) $ (1,465) $ 879
RECONCILIATION OF UNREALIZED RISK MANAGEMENT POSITIONS FROM JANUARY 1 TO DECEMBER 31
2013 2012 2011
Fair ValueTotal Unrealized
Gain (Loss)Total Unrealized
Gain (Loss)
Total Unrealized
Gain (Loss)
Fair Value of Contracts, Beginning of Year $ 575
Change in Fair Value of Contracts in Place at Beginning of Year
and Contracts Entered into During the Year 199 $ 199 $ 696 $ 1,827
Fair Value of Contracts Realized During the Year (544) (544) (2,161) (948)
Fair Value of Contracts, End of Year $ 230 $ (345) $ (1,465) $ 879

Encana Corporation | Annual Report 2013
NO
TE
S T
O
CO
NS
OL
IDA
TE
D
FIN
AN
CIA
L S
TAT
EM
EN
TS
P
RE
PA
RE
D I
N
AC
CO
RD
AN
CE
WIT
H
U.S
. G
AA
P I
N U
S$
MM
92
C) RISKS ASSOCIATED WITH FINANCIAL ASSETS AND LIABILITIES
The Company is exposed to financial risks including market risks (such as commodity prices, foreign exchange and interest rates), credit risk and liquidity risk.
Future cash flows may fluctuate due to movement in market prices and the exposure to credit and liquidity risks.
COMMODITY PRICE RISK
Commodity price risk arises from the effect that fluctuations in future commodity prices may have on future cash flows. To partially mitigate exposure to commodity
price risk, the Company has entered into various derivative financial instruments. The use of these derivative instruments is governed under formal policies and
is subject to limits established by the Board. The Company’s policy is to not use derivative financial instruments for speculative purposes.
Natural Gas – To partially mitigate natural gas commodity price risk, the Company uses contracts such as NYMEX-based swaps and options. Encana also enters
into basis swaps to manage against widening price differentials between various production areas and various sales points.
Crude Oil – To help protect against widening crude oil price differentials between North American and world prices, the Company has entered into fixed price
contracts and basis swaps.
Power – The Company has entered into Canadian dollar denominated derivative contracts to manage its electricity consumption costs.
The table below summarizes the sensitivity of the fair value of the Company’s risk management positions to fluctuations in commodity prices, with all other
variables held constant. The Company has used a 10 percent variability to assess the potential impact of commodity price changes. Fluctuations in commodity
prices could have resulted in unrealized gains (losses) impacting pre-tax net earnings as at December 31 as follows:
2013 2012
10% Price Increase
10% Price Decrease
10% Price
Increase
10% Price
Decrease
Natural gas price $ (441) $ 441 $ (446) $ 446
Crude oil price (19) 19 (20) 20
Power price 7 (7) 6 (6)
CREDIT RISK
Credit risk arises from the potential that the Company may incur a loss if a counterparty to a financial instrument fails to meet its obligation in accordance with
agreed terms. This credit risk exposure is mitigated through the use of Board-approved credit policies governing the Company’s credit portfolio, including credit
practices that limit transactions according to counterparties’ credit quality. Mitigation strategies may include master netting arrangements, requesting collateral
and/or transacting credit derivatives. The Company executes commodity derivative financial instruments under master agreements that have netting provisions
that provide for offsetting payables against receivables. As at December 31, 2013, the Company had no significant collateral balances posted or received and
there were no credit derivatives in place.
As at December 31, 2013, cash equivalents include high-grade, short-term securities, placed primarily with financial institutions and companies with strong
investment grade ratings. Any foreign currency agreements entered into are with major financial institutions in Canada and the U.S. or with counterparties having
investment grade credit ratings.
A substantial portion of the Company’s accounts receivable are with customers in the oil and gas industry and are subject to normal industry credit risks. As at
December 31, 2013, approximately 87 percent (2012 – 88 percent) of Encana’s accounts receivable and financial derivative credit exposures were with investment
grade counterparties.
As at December 31, 2013, Encana had four counterparties (2012 – two counterparties) whose net settlement position individually accounted for more than
10 percent of the fair value of the outstanding in-the-money net risk management contracts by counterparty. As at December 31, 2013, these counterparties
accounted for 24 percent, 14 percent, 14 percent and 13 percent (2012 – 22 percent and 15 percent) of the fair value of the outstanding in-the-money net risk
management contracts.

Annual Report 2013 | Encana Corporation
NO
TE
S T
O
CO
NS
OL
IDA
TE
D
FIN
AN
CIA
L S
TAT
EM
EN
TS
P
RE
PA
RE
D I
N
AC
CO
RD
AN
CE
WIT
H
U.S
. G
AA
P I
N U
S$
MM
93
LIQUIDITY RISK
Liquidity risk arises from the potential that the Company will encounter difficulties in meeting a demand to fund its financial liabilities as they come due.
The Company manages liquidity risk using cash and debt management programs.
The Company has access to cash equivalents and a range of funding alternatives at competitive rates through committed revolving bank credit facilities and
debt capital markets. In June 2013, the Company extended the maturity date of its existing revolving bank credit facilities and reduced the Canadian facility from
C$4.0 billion to C$3.5 billion. As at December 31, 2013, the Company had available unused committed revolving bank credit facilities totaling $4.3 billion which
include C$3.5 billion ($3.3 billion) on a revolving bank credit facility for Encana and $999 million on a revolving bank credit facility for a U.S. subsidiary. The
facilities remain committed through June 2018.
Encana also has unused capacity under a shelf prospectus for up to $4.0 billion, or the equivalent in foreign currencies, the availability of which is dependent
on market conditions, to issue up to $4.0 billion of debt securities in the U.S. The shelf prospectus expires in June 2014.
The Company believes it has sufficient funding through the use of these facilities to meet foreseeable borrowing requirements.
The Company minimizes its liquidity risk by managing its capital structure. The Company’s capital structure consists of shareholders’ equity plus long-term debt,
including the current portion. The Company’s objectives when managing its capital structure are to maintain financial flexibility to preserve Encana’s access
to capital markets and its ability to meet financial obligations and finance internally generated growth as well as potential acquisitions. To manage the capital
structure, the Company may adjust capital spending, adjust dividends paid to shareholders, issue new shares, issue new debt or repay existing debt.
The timing of expected cash outflows relating to financial liabilities is outlined in the table below:
Less Than 1 Year 1 - 3 Years 4 - 5 Years 6 - 9 Years Thereafter Total
Accounts Payable and Accrued Liabilities $ 1,895 $ - $ - $ - $ - $ 1,895
Risk Management Liabilities 25 5 - - - 30
Long-Term Debt (1) 1,408 758 2,102 2,150 6,633 13,051
(1) Principal and interest.
FOREIGN EXCHANGE RISK
Foreign exchange risk arises from changes in foreign exchange rates that may affect the fair value or future cash flows of the Company’s financial assets
or liabilities. As Encana operates primarily in North America, fluctuations in the exchange rate between the U.S. and Canadian dollars can have a significant effect
on the Company’s reported results. Encana’s financial results are consolidated in Canadian dollars; however, the Company reports its results in U.S. dollars as most
of its revenue is closely tied to the U.S. dollar and to facilitate a more direct comparison to other North American oil and gas companies. As the effects of foreign
exchange fluctuations are embedded in the Company’s results, the total effect of foreign exchange fluctuations is not separately identifiable.
To mitigate the exposure to the fluctuating U.S./Canadian dollar exchange rate, Encana maintains a mix of both U.S. dollar and Canadian dollar debt and may
also enter into foreign exchange derivatives. As at December 31, 2013, Encana had $5.4 billion in U.S. dollar debt issued from Canada that was subject to foreign
exchange exposure (2012 – $5.9 billion) and $1.7 billion in debt that was not subject to foreign exchange exposure (2012 – $1.8 billion). There were no foreign
exchange derivatives outstanding as at December 31, 2013.
Encana’s foreign exchange (gain) loss primarily includes unrealized foreign exchange gains and losses on the translation of U.S. dollar denominated debt issued
from Canada, unrealized foreign exchange gains and losses on the translation of U.S. dollar denominated risk management assets and liabilities held in Canada
and foreign exchange gains and losses on U.S. dollar denominated cash and short-term investments held in Canada. A $0.01 change in the U.S. to Canadian dollar
exchange rate would have resulted in a $48 million change in foreign exchange (gain) loss as at December 31, 2013 (2012 – $51 million; 2011 – $48 million).
INTEREST RATE RISK
Interest rate risk arises from changes in market interest rates that may affect the fair value or future cash flows from the Company’s financial assets or liabilities.
The Company may partially mitigate its exposure to interest rate changes by holding a mix of both fixed and floating rate debt and may also enter into interest
rate derivatives to partially mitigate effects of fluctuations in market interest rates. There were no interest rate derivatives outstanding as at December 31, 2013.
As at December 31, 2013, the Company had no floating rate debt. Accordingly, the sensitivity in net earnings for each one percent change in interest rates
on floating rate debt was nil (2012 – nil; 2011 – nil).

Encana Corporation | Annual Report 2013
NO
TE
S T
O
CO
NS
OL
IDA
TE
D
FIN
AN
CIA
L S
TAT
EM
EN
TS
P
RE
PA
RE
D I
N
AC
CO
RD
AN
CE
WIT
H
U.S
. G
AA
P I
N U
S$
MM
94
22. SUPPLEMENTARY INFORMATION
A) NET CHANGE IN NON-CASH WORKING CAPITAL
For the years ended December 31 2013 2012 2011
Operating Activities
Accounts receivable and accrued revenues $ (75) $ 82 $ 10
Accounts payable and accrued liabilities (81) (456) 94
Income tax payable and receivable (23) 51 (119)
$ (179) $ (323) $ (15)
B) SUPPLEMENTARY CASH FLOW INFORMATION
For the years ended December 31 2013 2012 2011
Interest Paid $ 575 $ 509 $ 486
Income Taxes Paid, net of Amounts (Recovered) $ (186) $ (124) $ (88)
23. COMMITMENTS AND CONTINGENCIES
COMMITMENTS
The following table outlines the Company’s commitments as at December 31, 2013:
Expected Future Payments
(undiscounted) 2014 2015 2016 2017 2018 Thereafter Total
Transportation and Processing $ 967 $ 985 $ 896 $ 896 $ 848 $ 4,379 $ 8,971
Drilling and Field Services 292 106 71 41 38 35 583
Operating Leases 47 43 38 31 28 38 225
Total $ 1,306 $ 1,134 $ 1,005 $ 968 $ 914 $ 4,452 $ 9,779
CONTINGENCIES
Encana is involved in various legal claims and actions arising in the course of the Company’s operations. Although the outcome of these claims cannot be predicted
with certainty, the Company does not expect these matters to have a material adverse effect on Encana’s financial position, cash flows or results of operations.
If an unfavourable outcome were to occur, there exists the possibility of a material adverse impact on the Company’s consolidated net earnings or loss in the period
in which the outcome is determined. Accruals for litigation and claims are recognized if the Company determines that the loss is probable and the amount can
be reasonably estimated. The Company believes it has made adequate provision for such legal claims.
24. SUPPLEMENTARY OIL AND GAS INFORMATION (UNAUDITED)
STANDARDIZED MEASURE OF DISCOUNTED FUTURE NET CASH FLOWS AND CHANGES THEREIN
In calculating the standardized measure of discounted future net cash flows, constant price and cost assumptions were applied to Encana’s annual future production
from proved reserves to determine cash inflows. Future production and development costs assume the continuation of existing economic, operating and regulatory
conditions. Future income taxes are calculated by applying statutory income tax rates to future pre-tax cash flows after provision for the tax cost of the oil and natural
gas properties based upon existing laws and regulations. The discount was computed by application of a 10 percent discount factor to the future net cash flows. The
calculation of the standardized measure of discounted future net cash flows is based upon the discounted future net cash flows prepared by Encana’s independent
qualified reserves evaluators in relation to the reserves they respectively evaluated, and adjusted to the extent provided by contractual arrangements, such as price risk
management activities, in existence at year end and to account for asset retirement obligations and future income taxes.
Encana cautions that the discounted future net cash flows relating to proved oil and gas reserves are an indication of neither the fair market value of Encana’s oil and
gas properties, nor the future net cash flows expected to be generated from such properties. The discounted future net cash flows do not include the fair market value
of exploratory properties and probable or possible oil and gas reserves, nor is consideration given to the effect of anticipated future changes in oil and natural gas
prices, development, asset retirement and production costs, and possible changes to tax and royalty regulations. The prescribed discount rate of 10 percent may not
appropriately reflect future interest rates. The computation also excludes values attributable to Encana’s Market Optimization interests.

Annual Report 2013 | Encana Corporation
NO
TE
S T
O
CO
NS
OL
IDA
TE
D
FIN
AN
CIA
L S
TAT
EM
EN
TS
P
RE
PA
RE
D I
N
AC
CO
RD
AN
CE
WIT
H
U.S
. G
AA
P I
N U
S$
MM
95
NET PROVED RESERVES (1, 2)
(12-MONTH AVERAGE TRAILING PRICES; AFTER ROYALTIES)
Natural Gas (Bcf) Oil & NGLs (MMbbls)
Canada United States Total Canada United States Total
2011
Beginning of year 6,117 7,183 13,300 54.3 38.2 92.5
Revisions and improved recovery 3 (204) (201) 32.3 (0.7) 31.6
Extensions and discoveries 826 1,121 1,947 18.2 5.4 23.6
Purchase of reserves in place 72 23 95 0.2 0.1 0.3
Sale of reserves in place (158) (927) (1,085) (4.7) (1.3) (6.0)
Production (531) (685) (1,216) (5.3) (3.5) (8.8)
End of year 6,329 6,511 12,840 95.0 38.2 133.2
Developed 3,523 3,286 6,809 39.6 24.4 64.0
Undeveloped 2,806 3,225 6,031 55.4 13.8 69.2
Total 6,329 6,511 12,840 95.0 38.2 133.2
2012
Beginning of year 6,329 6,511 12,840 95.0 38.2 133.2
Revisions and improved recovery (3) (1,497) (1,701) (3,198) (10.0) 38.9 28.9
Extensions and discoveries 638 338 976 25.9 39.2 65.1
Purchase of reserves in place 38 8 46 - 0.1 0.1
Sale of reserves in place (461) (321) (782) (2.2) (3.8) (6.0)
Production (497) (593) (1,090) (7.1) (4.2) (11.3)
End of year 4,550 4,242 8,792 101.6 108.4 210.0
Developed 2,985 2,628 5,613 47.8 43.1 90.9Undeveloped 1,565 1,614 3,179 53.8 65.3 119.1
Total 4,550 4,242 8,792 101.6 108.4 210.0
2013
Beginning of year 4,550 4,242 8,792 101.6 108.4 210.0
Revisions and improved recovery (4) (256) (362) (618) (7.0) (17.3) (24.3)
Extensions and discoveries 499 482 981 28.2 27.6 55.8
Purchase of reserves in place - 7 7 - 0.6 0.6
Sale of reserves in place (295) (1) (296) (1.5) (0.1) (1.6)
Production (523) (491) (1,014) (11.1) (8.6) (19.7)
End of year 3,975 3,877 7,852 110.2 110.6 220.8
Developed 2,744 2,619 5,363 61.1 55.2 116.3
Undeveloped 1,231 1,258 2,489 49.1 55.4 104.5
Total 3,975 3,877 7,852 110.2 110.6 220.8
Notes:
(1) Definitions:
a. “Net” reserves are the remaining reserves of Encana, after deduction of estimated royalties and including royalty interests.
b. “Proved” oil and gas reserves are those quantities of oil and gas which by analysis of geoscience and engineering data, can be estimated with reasonable certainty to be economically producible from a given date forward, from
known reservoirs, and under existing economic conditions, operating methods and government regulations.
c. “Developed” oil and gas reserves are reserves of any category that are expected to be recovered through existing wells with existing equipment and operating methods or in which the cost of the required equipment is relatively
minor compared to the cost of a new well.
d. “Undeveloped” oil and gas reserves are reserves of any category that are expected to be recovered from new wells on undrilled acreage, or from existing wells where a relatively major expenditure is required for recompletion.
(2) Encana does not file any estimates of total net proved natural gas, oil and NGL reserves with any U.S. federal authority or agency other than the Securities and Exchange Commission.
(3) In 2012, revisions and improved recovery for natural gas included a reduction of 4,589 Bcf due to significantly lower 12-month average trailing natural gas prices, partially offset by additions of 1,391 Bcf for technical revisions and
improved recovery.
(4) In 2013, revisions and improved recovery for natural gas included a reduction of 2,872 Bcf due to lower proved undeveloped reserves bookings, partially offset by additions of 2,233 Bcf due to significantly higher 12-month average
trailing natural gas prices and minor positive revisions.

Encana Corporation | Annual Report 2013
NO
TE
S T
O
CO
NS
OL
IDA
TE
D
FIN
AN
CIA
L S
TAT
EM
EN
TS
P
RE
PA
RE
D I
N
AC
CO
RD
AN
CE
WIT
H
U.S
. G
AA
P I
N U
S$
MM
96
12-MONTH AVERAGE TRAILING PRICES
The following reference prices were utilized in the determination of reserves and future net revenue:
Natural Gas Oil & NGLs
Henry Hub
($/MMBtu)
AECO
(C$/MMBtu)
WTI
($/bbl)
Edmonton
Light Sweet
(C$/bbl)
Reserves Pricing (1)
2011 4.12 3.76 96.19 96.53
2012 2.76 2.35 94.71 87.42
2013 3.67 3.14 96.94 93.44
(1) All prices were held constant in all future years when estimating net revenues and reserves.
STANDARDIZED MEASURE OF DISCOUNTED FUTURE NET CASH FLOWS RELATING TO PROVED OIL AND GAS RESERVES
Canada United States
($ millions) 2013 2012 2011 2013 2012 2011
Future cash inflows 19,039 15,471 27,731 17,217 14,124 26,558
Less future:
Production costs 7,377 6,273 9,717 4,484 4,095 6,195
Development costs 4,515 5,117 8,186 3,982 4,210 7,786
Income taxes 652 - 784 1,615 555 2,730
Future net cash flows 6,495 4,081 9,044 7,136 5,264 9,847
Less 10% annual discount for estimated
timing of cash flows 1,836 1,079 3,759 2,978 2,249 4,384
Discounted future net cash flows 4,659 3,002 5,285 4,158 3,015 5,463
Total
($ millions) 2013 2012 2011
Future cash inflows 36,256 29,595 54,289
Less future:
Production costs 11,861 10,368 15,912
Development costs 8,497 9,327 15,972
Income taxes 2,267 555 3,514
Future net cash flows 13,631 9,345 18,891
Less 10% annual discount for estimated
timing of cash flows 4,814 3,328 8,143
Discounted future net cash flows 8,817 6,017 10,748

Annual Report 2013 | Encana Corporation
NO
TE
S T
O
CO
NS
OL
IDA
TE
D
FIN
AN
CIA
L S
TAT
EM
EN
TS
P
RE
PA
RE
D I
N
AC
CO
RD
AN
CE
WIT
H
U.S
. G
AA
P I
N U
S$
MM
97
CHANGES IN STANDARDIZED MEASURE OF DISCOUNTED FUTURE NET CASH FLOWS RELATING TO PROVED OIL
AND GAS RESERVES
Canada United States
($ millions) 2013 2012 2011 2013 2012 2011
Balance, beginning of year 3,002 5,285 5,289 3,015 5,463 6,147
Changes resulting from:
Sales of oil and gas produced during the period (1,649) (1,808) (1,951) (1,490) (2,223) (2,653)
Discoveries and extensions, net of related costs 725 509 1,161 633 319 887
Purchases of proved reserves in place - 7 55 16 8 42
Sales and transfers of proved reserves in place (304) (155) (212) (2) (369) (1,021)
Net change in prices and production costs 2,703 (1,364) 516 1,891 (2,106) 733
Revisions to quantity estimates (178) (1,290) 188 (324) (2,858) (336)
Accretion of discount 311 571 576 333 693 762
Previously estimated development costs incurred,
net of change in future development costs 417 946 (441) 708 3,021 832
Other 14 (7) 54 (68) (79) 63
Net change in income taxes (382) 308 50 (554) 1,146 7
Balance, end of year 4,659 3,002 5,285 4,158 3,015 5,463
Total
($ millions) 2013 2012 2011
Balance, beginning of year 6,017 10,748 11,436
Changes resulting from:
Sales of oil and gas produced during the period (3,139) (4,031) (4,604)
Discoveries and extensions, net of related costs 1,358 828 2,048
Purchases of proved reserves in place 16 15 97
Sales and transfers of proved reserves in place (306) (524) (1,233)
Net change in prices and production costs 4,594 (3,470) 1,249
Revisions to quantity estimates (502) (4,148) (148)
Accretion of discount 644 1,264 1,338
Previously estimated development costs incurred,
net of change in future development costs 1,125 3,967 391
Other (54) (86) 117
Net change in income taxes (936) 1,454 57
Balance, end of year 8,817 6,017 10,748

Encana Corporation | Annual Report 2013
NO
TE
S T
O
CO
NS
OL
IDA
TE
D
FIN
AN
CIA
L S
TAT
EM
EN
TS
P
RE
PA
RE
D I
N
AC
CO
RD
AN
CE
WIT
H
U.S
. G
AA
P I
N U
S$
MM
98
RESULTS OF OPERATIONS
Canada United States
($ millions) 2013 2012 2011 2013 2012 2011
Oil and gas revenues, net of royalties, transportation and processing 2,068 2,205 2,382 2,041 2,713 3,294
Less:
Operating costs, production and mineral taxes, and accretion of asset
retirement obligations 419 397 431 551 490 641
Depreciation, depletion and amortization 601 748 966 818 1,102 1,226
Impairments - 1,822 2,249 - 2,842 -
Operating income (loss) 1,048 (762) (1,264) 672 (1,721) 1,427
Income taxes 264 (191) (335) 243 (623) 517
Results of operations 784 (571) (929) 429 (1,098) 910
Total
($ millions) 2013 2012 2011
Oil and gas revenues, net of royalties, transportation and processing 4,109 4,918 5,676
Less:
Operating costs, production and mineral taxes, and accretion of asset
retirement obligations 970 887 1,072
Depreciation, depletion and amortization 1,419 1,850 2,192
Impairments - 4,664 2,249
Operating income (loss) 1,720 (2,483) 163
Income taxes 507 (814) 182
Results of operations 1,213 (1,669) (19)
CAPITALIZED COSTS
Canada United States
($ millions) 2013 2012 2011 2013 2012 2011
Proved oil and gas properties 25,003 26,024 27,259 26,529 24,825 23,319
Unproved oil and gas properties 598 716 968 470 579 458
Total capital cost 25,601 26,740 28,227 26,999 25,404 23,777
Accumulated DD&A 23,012 23,962 20,906 22,074 21,236 17,294
Net capitalized costs 2,589 2,778 7,321 4,925 4,168 6,483
Other Total
($ millions) 2013 2012 2011 2013 2012 2011
Proved oil and gas properties 71 104 112 51,603 50,953 50,690
Unproved oil and gas properties - - - 1,068 1,295 1,426
Total capital cost 71 104 112 52,671 52,248 52,116
Accumulated DD&A 71 104 112 45,157 45,302 38,312
Net capitalized costs - - - 7,514 6,946 13,804
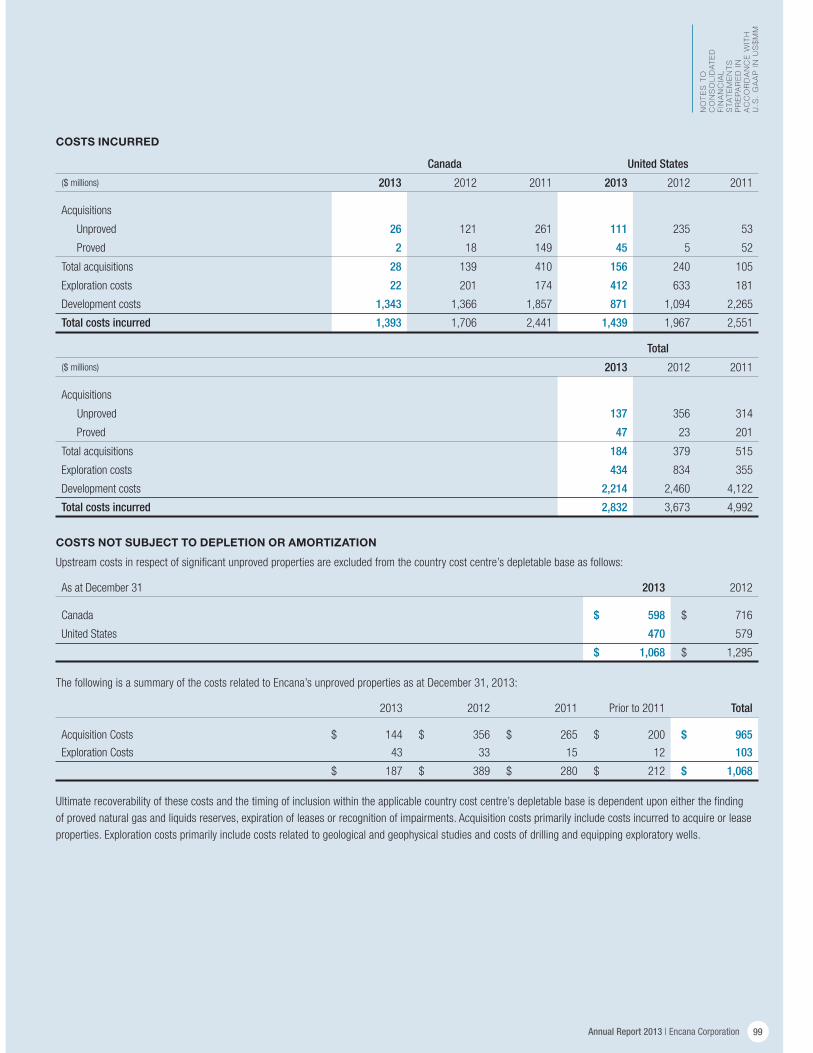
Annual Report 2013 | Encana Corporation
NO
TE
S T
O
CO
NS
OL
IDA
TE
D
FIN
AN
CIA
L S
TAT
EM
EN
TS
P
RE
PA
RE
D I
N
AC
CO
RD
AN
CE
WIT
H
U.S
. G
AA
P I
N U
S$
MM
99
COSTS INCURRED
Canada United States
($ millions) 2013 2012 2011 2013 2012 2011
Acquisitions
Unproved 26 121 261 111 235 53
Proved 2 18 149 45 5 52
Total acquisitions 28 139 410 156 240 105
Exploration costs 22 201 174 412 633 181
Development costs 1,343 1,366 1,857 871 1,094 2,265
Total costs incurred 1,393 1,706 2,441 1,439 1,967 2,551
Total
($ millions) 2013 2012 2011
Acquisitions
Unproved 137 356 314
Proved 47 23 201
Total acquisitions 184 379 515
Exploration costs 434 834 355
Development costs 2,214 2,460 4,122
Total costs incurred 2,832 3,673 4,992
COSTS NOT SUBJECT TO DEPLETION OR AMORTIZATION
Upstream costs in respect of significant unproved properties are excluded from the country cost centre’s depletable base as follows:
As at December 31 2013 2012
Canada $ 598 $ 716
United States 470 579
$ 1,068 $ 1,295
The following is a summary of the costs related to Encana’s unproved properties as at December 31, 2013:
2013 2012 2011 Prior to 2011 Total
Acquisition Costs $ 144 $ 356 $ 265 $ 200 $ 965
Exploration Costs 43 33 15 12 103
$ 187 $ 389 $ 280 $ 212 $ 1,068
Ultimate recoverability of these costs and the timing of inclusion within the applicable country cost centre’s depletable base is dependent upon either the finding
of proved natural gas and liquids reserves, expiration of leases or recognition of impairments. Acquisition costs primarily include costs incurred to acquire or lease
properties. Exploration costs primarily include costs related to geological and geophysical studies and costs of drilling and equipping exploratory wells.

Encana Corporation | Annual Report 2013100
SU
PP
LE
ME
NTA
L IN
FO
RM
AT
ION
U
.S.
DO
LL
AR
S/
U.S
. P
RO
TO
CO
L
SUPPLEMENTAL FINANCIAL INFORMATION (unaudited)
FINANCIAL RESULTS
($ millions, except per share amounts) 2013 2012
Year Q4 Q3 Q2 Q1 Year Q4 Q3 Q2 Q1
Cash Flow (1) 2,581 677 660 665 579 3,537 809 913 794 1,021
Per share - Diluted (3) 3.50 0.91 0.89 0.90 0.79 4.80 1.10 1.24 1.08 1.39
Operating Earnings (2) 802 226 150 247 179 997 296 263 198 240
Per share - Diluted (3) 1.09 0.31 0.20 0.34 0.24 1.35 0.40 0.36 0.27 0.33
Net Earnings (Loss) 236 (251) 188 730 (431) (2,794) (80) (1,244) (1,482) 12
Per share - Diluted (3) 0.32 (0.34) 0.25 0.99 (0.59) (3.79) (0.11) (1.69) (2.01) 0.02
Effective Tax Rate using
Canadian Statutory Rate 25.1% 25.0%
Foreign Exchange Rates (US$ per C$1)
Average 0.971 0.953 0.963 0.977 0.992 1.000 1.009 1.005 0.990 0.999
Period end 0.940 0.940 0.972 0.951 0.985 1.005 1.005 1.017 0.981 1.001
Cash Flow Summary
Cash From (Used in) Operating Activities 2,289 462 935 554 338 3,107 717 1,142 631 617
Deduct (Add back):
Net change in other assets and liabilities (80) (21) (15) (22) (22) (78) (23) (9) (26) (20)
Net change in non-cash working capital (179) (183) 300 (81) (215) (323) (56) 242 (134) (375)
Cash tax on sale of assets (33) (11) (10) (8) (4) (29) (13) (4) (3) (9)
Cash Flow (1) 2,581 677 660 665 579 3,537 809 913 794 1,021
Operating Earnings Summary
Net Earnings (Loss) 236 (251) 188 730 (431) (2,794) (80) (1,244) (1,482) 12
After-tax (addition) deduction:
Unrealized hedging gain (loss) (232) (209) (89) 332 (266) (1,002) (72) (428) (547) 45
Impairments (16) - (16) - - (3,188) (300) (1,193) (1,695) -
Restructuring charges (64) (64) - - - - - - - -
Non-operating foreign exchange gain (loss) (282) (124) 105 (162) (101) 92 (66) 162 (90) 86
Income tax adjustments 28 (80) 38 313 (243) 307 62 (48) 652 (359)
Operating Earnings (2) 802 226 150 247 179 997 296 263 198 240
(1) Cash Flow is a non-GAAP measure defined as cash from operating activities excluding net change in other assets and liabilities, net change in non-cash working capital and cash tax on sale of assets.
(2) Operating Earnings is a non-GAAP measure defined as Net Earnings excluding non-recurring or non-cash items that Management believes reduces the comparability of the Company’s financial performance between periods. These
after-tax items may include, but are not limited to, unrealized hedging gains/losses, impairments, restructuring charges, foreign exchange gains/losses, income taxes related to divestitures and adjustments to normalize the effect of
income taxes calculated using the estimated annual effective tax rate.
(3) Net earnings, operating earnings and cash flow per common share are calculated using the weighted average number of Encana common shares outstanding as follows:
2013 2012
(millions) Year Q4 Q3 Q2 Q1 Year Q4 Q3 Q2 Q1
Weighted Average Common Shares Outstanding
Basic 737.7 740.4 738.3 736.1 736.2 736.3 736.3 736.3 736.3 736.3
Diluted 737.7 740.4 738.3 736.1 736.2 736.3 736.3 736.3 736.3 736.3
SUPPLEMENTAL INFORMATIONFor the period ended December 31, 2013 (U.S. Dollars/U.S. Protocol)

101Annual Report 2013 | Encana Corporation
SU
PP
LE
ME
NTA
L IN
FO
RM
AT
ION
U
.S.
DO
LL
AR
S/
U.S
. P
RO
TO
CO
L
SUPPLEMENTAL FINANCIAL & OPERATING INFORMATION (unaudited)
Financial Metrics 2013 2012
Year Year
Net Debt to Debt Adjusted Cash Flow 1.5x 1.1x
Debt to Debt Adjusted Cash Flow 2.4x 2.0x
Debt to Adjusted EBITDA 2.5x 2.0x
Debt to Adjusted Capitalization 36% 37%
The financial metrics disclosed above are non-GAAP measures monitored by Management as indicators of the Company’s overall financial strength. These
non-GAAP measures are defined and calculated in the Non-GAAP Measures section of Encana’s Management’s Discussion and Analysis.
Net Capital Investment 2013 2012
($ millions) Year Q4 Q3 Q2 Q1 Year Q4 Q3 Q2 Q1
Capital Investment
Canadian Division 1,365 354 301 301 409 1,567 373 356 323 515
USA Division 1,283 343 330 327 283 1,727 352 380 432 563
Market Optimization 3 1 - 2 - 7 - - 1 6
Corporate & Other 61 19 10 9 23 175 55 43 41 36
Capital Investment 2,712 717 641 639 715 3,476 780 779 797 1,120
Net Acquisitions & (Divestitures) (1) (776) (72) (51) (312) (341) (3,664) (1,327) 31 (8) (2,360)
Net Capital Investment 1,936 645 590 327 374 (188) (547) 810 789 (1,240)
(1) Q1 2013 Net Acquisitions & (Divestitures) includes proceeds received from the sale of the Company’s 30 percent interest in the proposed Kitimat liquefied natural gas export terminal in British Columbia and associated undeveloped
lands in the Horn River Basin. The transaction closed on February 8, 2013.
Production Volumes - After Royalties 2013 2012
(average) Year Q4 Q3 Q2 Q1 Year Q4 Q3 Q2 Q1
Natural Gas (MMcf/d)
Canadian Division 1,432 1,528 1,414 1,364 1,422 1,359 1,408 1,299 1,237 1,493
USA Division 1,345 1,216 1,309 1,402 1,455 1,622 1,540 1,606 1,565 1,779
2,777 2,744 2,723 2,766 2,877 2,981 2,948 2,905 2,802 3,272
Oil (Mbbls/d)
Canadian Division 11.9 16.8 12.3 10.3 8.0 7.3 7.6 7.1 7.4 7.2
USA Division 13.9 16.2 14.9 12.6 12.0 10.3 10.9 10.4 10.5 9.3
25.8 33.0 27.2 22.9 20.0 17.6 18.5 17.5 17.9 16.5
NGLs (Mbbls/d)
Canadian Division 18.5 21.7 20.5 15.7 16.0 12.1 16.0 10.9 9.5 12.0
USA Division 9.6 11.3 10.5 9.0 7.5 1.3 1.7 1.9 0.8 0.8
28.1 33.0 31.0 24.7 23.5 13.4 17.7 12.8 10.3 12.8
Oil & NGLs (Mbbls/d)
Canadian Division 30.4 38.5 32.8 26.0 24.0 19.4 23.6 18.0 16.9 19.2
USA Division 23.5 27.5 25.4 21.6 19.5 11.6 12.6 12.3 11.3 10.1
53.9 66.0 58.2 47.6 43.5 31.0 36.2 30.3 28.2 29.3
Oil & NGLs Production Volumes - After Royalties 2013 2012
Year % of Total Year
% of Total
Oil 25.8 49 17.6 57
Plant Condensate 8.7 16 6.5 21
Butane 4.5 8 2.0 6
Propane 7.2 13 2.5 8
Ethane 7.7 14 2.4 8
53.9 100 31.0 100
101

Encana Corporation | Annual Report 2013102
SUPPLEMENTAL FINANCIAL & OPERATING INFORMATION (unaudited)
RESULTS OF OPERATIONS
Product and Divisional Information, Including the Impact of Realized Financial Hedging
2013 2012
($ millions) Year Q4 Q3 Q2 Q1 Year Q4 Q3 Q2 Q1
Natural Gas - Canadian Division
Revenues, Net of Royalties, excluding Hedging 1,771 509 381 459 422 1,263 411 282 223 347
Realized Financial Hedging Gain 271 84 102 19 66 962 187 261 286 228
Expenses
Production and mineral taxes 4 2 1 - 1 1 1 - 1 (1)
Transportation and processing 724 207 183 165 169 549 158 116 143 132
Operating 322 82 72 80 88 327 71 86 78 92
Operating Cash Flow 992 302 227 233 230 1,348 368 341 287 352
Natural Gas - USA Division
Revenues, Net of Royalties, excluding Hedging 1,872 426 440 547 459 1,798 523 446 343 486
Realized Financial Hedging Gain 260 80 84 27 69 1,195 238 300 355 302
Expenses
Production and mineral taxes 77 19 16 27 15 68 28 22 5 13
Transportation and processing 722 175 184 179 184 652 162 169 148 173
Operating 339 97 78 78 86 347 78 90 81 98
Operating Cash Flow 994 215 246 290 243 1,926 493 465 464 504
Natural Gas - Total
Revenues, Net of Royalties, excluding Hedging 3,643 935 821 1,006 881 3,061 934 728 566 833
Realized Financial Hedging Gain 531 164 186 46 135 2,157 425 561 641 530
Expenses
Production and mineral taxes 81 21 17 27 16 69 29 22 6 12
Transportation and processing 1,446 382 367 344 353 1,201 320 285 291 305
Operating 661 179 150 158 174 674 149 176 159 190
Operating Cash Flow 1,986 517 473 523 473 3,274 861 806 751 856
Liquids - Canadian Division
Revenues, Net of Royalties, excluding Hedging 722 222 204 156 140 504 132 114 118 140
Realized Financial Hedging Gain (Loss) 5 6 (7) 2 4 (4) (4) - - -
Expenses
Production and mineral taxes 11 2 7 1 1 8 1 1 2 4
Transportation and processing 32 18 7 4 3 6 2 1 2 1
Operating 39 7 11 9 12 14 7 2 3 2
Operating Cash Flow 645 201 172 144 128 472 118 110 111 133
Liquids - USA Division
Revenues, Net of Royalties, excluding Hedging 602 177 169 134 122 348 89 88 88 83
Realized Financial Hedging Gain (Loss) 4 3 (7) 3 5 - - - - -
Expenses
Production and mineral taxes 42 14 11 9 8 28 6 7 7 8
Transportation and processing - - - - - - - - - -
Operating 59 10 12 14 23 25 8 9 6 2
Operating Cash Flow 505 156 139 114 96 295 75 72 75 73
Liquids - Total
Revenues, Net of Royalties, excluding Hedging 1,324 399 373 290 262 852 221 202 206 223
Realized Financial Hedging Gain (Loss) 9 9 (14) 5 9 (4) (4) - - -
Expenses
Production and mineral taxes 53 16 18 10 9 36 7 8 9 12
Transportation and processing 32 18 7 4 3 6 2 1 2 1
Operating 98 17 23 23 35 39 15 11 9 4
Operating Cash Flow 1,150 357 311 258 224 767 193 182 186 206
SU
PP
LE
ME
NTA
L IN
FO
RM
AT
ION
U
.S.
DO
LL
AR
S/
U.S
. P
RO
TO
CO
L

Annual Report 2013 | Encana Corporation 103
SUPPLEMENTAL OIL AND GAS OPERATING STATISTICS (unaudited)
OPERATING STATISTICS - AFTER ROYALTIES
Per-unit Results, Excluding the Impact of Realized Financial Hedging
2013 2012
Year Q4 Q3 Q2 Q1 Year Q4 Q3 Q2 Q1
Natural Gas - Canadian Division ($/Mcf)
Price 3.35 3.60 2.90 3.69 3.21 2.58 3.18 2.45 2.05 2.56
Production and mineral taxes 0.01 0.02 0.01 - 0.01 - 0.01 - 0.01 (0.01)
Transportation and processing 1.37 1.46 1.38 1.33 1.29 1.12 1.23 1.01 1.31 0.97
Operating 0.61 0.59 0.55 0.65 0.66 0.67 0.55 0.75 0.71 0.68
Netback 1.36 1.53 0.96 1.71 1.25 0.79 1.39 0.69 0.02 0.92
Natural Gas - USA Division ($/Mcf)
Price 3.81 3.81 3.66 4.29 3.50 3.03 3.68 3.02 2.41 3.00
Production and mineral taxes 0.16 0.18 0.13 0.21 0.11 0.11 0.19 0.15 0.03 0.08
Transportation and processing 1.47 1.56 1.53 1.40 1.40 1.10 1.15 1.14 1.04 1.07
Operating 0.69 0.86 0.65 0.61 0.66 0.59 0.55 0.62 0.56 0.61
Netback 1.49 1.21 1.35 2.07 1.33 1.23 1.79 1.11 0.78 1.24
Natural Gas - Total ($/Mcf)
Price 3.57 3.69 3.26 3.99 3.35 2.83 3.45 2.77 2.25 2.80
Production and mineral taxes 0.08 0.09 0.07 0.11 0.06 0.06 0.10 0.08 0.02 0.04
Transportation and processing 1.42 1.51 1.46 1.36 1.35 1.11 1.18 1.08 1.16 1.02
Operating 0.65 0.70 0.60 0.63 0.66 0.62 0.55 0.68 0.63 0.64
Netback 1.42 1.39 1.13 1.89 1.28 1.04 1.62 0.93 0.44 1.10
Liquids - Canadian Division ($/bbl)
Price 65.06 62.80 67.33 65.88 64.72 70.84 61.04 68.80 76.47 79.96
Production and mineral taxes 0.96 0.61 1.91 0.62 0.58 1.13 0.43 0.62 1.28 2.36
Transportation and processing 2.89 5.15 2.41 1.53 1.33 0.75 0.78 0.10 1.18 0.95
Operating 3.56 2.03 3.74 3.77 5.61 2.09 3.60 1.48 1.68 1.15
Netback 57.65 55.01 59.27 59.96 57.20 66.87 56.23 66.60 72.33 75.50
Liquids - USA Division ($/bbl)
Price 70.18 69.46 72.53 68.56 69.91 82.33 77.18 77.12 86.11 91.05
Production and mineral taxes 4.79 5.06 4.90 4.57 4.50 6.63 5.00 6.46 7.17 8.33
Transportation and processing - - - - - 0.06 - - 0.09 0.20
Operating 7.02 4.11 5.13 7.54 13.16 5.88 7.05 7.69 5.52 2.59
Netback 58.37 60.29 62.50 56.45 52.25 69.76 65.13 62.97 73.33 79.93
Liquids - Total ($/bbl)
Price 67.30 65.58 69.60 67.10 67.04 75.12 66.65 72.17 80.32 83.77
Production and mineral taxes 2.63 2.46 3.22 2.41 2.33 3.18 2.02 2.98 3.63 4.41
Transportation and processing 1.63 3.01 1.36 0.84 0.73 0.50 0.51 0.06 0.75 0.69
Operating 5.07 2.90 4.35 5.48 8.98 3.50 4.80 3.98 3.21 1.65
Netback 57.97 57.21 60.67 58.37 55.00 67.94 59.32 65.15 72.73 77.02
SU
PP
LE
ME
NTA
L IN
FO
RM
AT
ION
U
.S.
DO
LL
AR
S/
U.S
. P
RO
TO
CO
L

Encana Corporation | Annual Report 2013104
SUPPLEMENTAL OIL AND GAS OPERATING STATISTICS (unaudited)
OPERATING STATISTICS - AFTER ROYALTIES (continued)
Impact of Realized Financial Hedging
2013 2012
Year Q4 Q3 Q2 Q1 Year Q4 Q3 Q2 Q1
Natural Gas ($/Mcf)
Canadian Division 0.51 0.60 0.78 0.15 0.50 1.97 1.45 2.27 2.61 1.69
USA Division 0.53 0.72 0.69 0.21 0.53 2.01 1.68 2.03 2.49 1.86
Total 0.52 0.65 0.74 0.18 0.51 1.99 1.57 2.14 2.54 1.78
Liquids ($/bbl)
Canadian Division 0.46 1.62 (2.59) 1.00 2.20 - - - - -
USA Division 0.44 1.15 (2.73) 1.32 2.67 - - - - -
Total 0.45 1.43 (2.65) 1.15 2.41 - - - - -
Per-unit Results, Including the Impact of Realized Financial Hedging
2013 2012
Year Q4 Q3 Q2 Q1 Year Q4 Q3 Q2 Q1
Natural Gas Price ($/Mcf)
Canadian Division 3.86 4.20 3.68 3.84 3.71 4.55 4.63 4.72 4.66 4.25
USA Division 4.34 4.53 4.35 4.50 4.03 5.04 5.36 5.05 4.90 4.86
Total 4.09 4.34 4.00 4.17 3.86 4.82 5.02 4.91 4.79 4.58
Natural Gas Netback ($/Mcf)
Canadian Division 1.87 2.13 1.74 1.86 1.75 2.76 2.84 2.96 2.63 2.61
USA Division 2.02 1.93 2.04 2.28 1.86 3.24 3.47 3.14 3.27 3.10
Total 1.94 2.04 1.87 2.07 1.79 3.03 3.19 3.07 2.98 2.88
Liquids Price ($/bbl)
Canadian Division 65.52 64.42 64.74 66.88 66.92 70.84 61.04 68.80 76.47 79.96
USA Division 70.62 70.61 69.80 69.88 72.58 82.33 77.18 77.12 86.11 91.05
Total 67.75 67.01 66.95 68.25 69.45 75.12 66.65 72.17 80.32 83.77
Liquids Netback ($/bbl)
Canadian Division 58.11 56.63 56.68 60.96 59.40 66.87 56.23 66.60 72.33 75.50
USA Division 58.81 61.44 59.77 57.77 54.92 69.76 65.13 62.97 73.33 79.93
Total 58.42 58.64 58.02 59.52 57.41 67.94 59.32 65.15 72.73 77.02
SU
PP
LE
ME
NTA
L IN
FO
RM
AT
ION
U
.S.
DO
LL
AR
S/
U.S
. P
RO
TO
CO
L

Annual Report 2013 | Encana Corporation 105
SUPPLEMENTAL OIL AND GAS OPERATING STATISTICS (unaudited)
RESULTS BY RESOURCE PLAY
2013 2012
Year Q4 Q3 Q2 Q1 Year Q4 Q3 Q2 Q1
Natural Gas Production (MMcf/d) - After Royalties
Canadian Division
Cutbank Ridge 506 517 554 472 482 433 431 447 377 476
Bighorn 255 283 253 242 243 242 244 235 263 227
Peace River Arch 133 160 138 119 115 108 116 99 99 119
Clearwater 335 329 332 331 347 374 366 336 353 440
Greater Sierra 156 97 105 195 232 200 245 182 142 231
Other and emerging 47 142 32 5 3 2 6 - 3 -
Total Canadian Division 1,432 1,528 1,414 1,364 1,422 1,359 1,408 1,299 1,237 1,493
USA Division
Piceance 455 452 444 465 459 475 467 476 470 488
Jonah 323 296 320 332 346 411 365 407 426 448
Haynesville 348 261 336 375 420 475 464 475 418 545
Texas 136 123 132 145 145 167 151 157 158 201
Other and emerging 83 84 77 85 85 94 93 91 93 97
Total USA Division 1,345 1,216 1,309 1,402 1,455 1,622 1,540 1,606 1,565 1,779
Oil & NGLs Production (Mbbls/d) - After Royalties
Canadian Division
Cutbank Ridge 1.8 1.8 2.0 1.9 1.6 1.5 1.5 1.6 1.5 1.2
Bighorn 8.9 10.9 9.9 7.4 7.4 5.8 9.4 5.0 3.4 5.5
Peace River Arch 8.7 12.4 10.4 6.4 5.6 2.9 3.6 2.7 2.5 2.7
Clearwater 9.9 12.2 9.8 9.2 8.5 8.6 8.1 8.0 9.0 9.2
Greater Sierra 0.3 - - 0.5 0.6 0.5 0.6 0.4 0.3 0.6
Other and emerging 0.8 1.2 0.7 0.6 0.3 0.1 0.4 0.3 0.2 -
Total Canadian Division 30.4 38.5 32.8 26.0 24.0 19.4 23.6 18.0 16.9 19.2
USA Division
Piceance 5.1 5.3 5.5 5.2 4.3 2.2 2.5 2.7 2.0 1.6
Jonah 4.7 4.6 4.8 4.9 4.6 4.1 4.0 4.3 4.0 4.1
Haynesville - - - - - - - - 0.1 -
Texas - - - - - 0.1 - 0.1 - 0.2
Other and emerging 13.7 17.6 15.1 11.5 10.6 5.2 6.1 5.2 5.2 4.2
Total USA Division 23.5 27.5 25.4 21.6 19.5 11.6 12.6 12.3 11.3 10.1
Capital Investment ($ millions)
Canadian Division
Cutbank Ridge 143 45 28 19 51 228 60 53 35 80
Bighorn 268 39 68 56 105 333 66 82 63 122
Peace River Arch 435 140 109 85 101 220 55 56 52 57
Clearwater 128 23 26 15 64 131 37 17 14 63
Greater Sierra 17 1 1 6 9 118 14 13 47 44
Other and emerging 374 106 69 120 79 537 141 135 112 149
Total Canadian Division 1,365 354 301 301 409 1,567 373 356 323 515
USA Division
Piceance 241 61 81 51 48 328 42 68 112 106
Jonah 48 12 15 13 8 102 15 13 25 49
Haynesville 210 79 44 55 32 337 16 46 90 185
Texas 23 10 5 3 5 62 3 14 16 29
Other and emerging 761 181 185 205 190 898 276 239 189 194
Total USA Division 1,283 343 330 327 283 1,727 352 380 432 563
SU
PP
LE
ME
NTA
L IN
FO
RM
AT
ION
U
.S.
DO
LL
AR
S/
U.S
. P
RO
TO
CO
L

Encana Corporation | Annual Report 2013106
SUPPLEMENTAL OIL AND GAS OPERATING STATISTICS (unaudited)
RESULTS BY RESOURCE PLAY (continued)
2013 2012
Year Q4 Q3 Q2 Q1 Year Q4 Q3 Q2 Q1
Drilling Activity (net wells drilled)
Canadian Division
Cutbank Ridge 30 10 6 7 7 41 13 14 7 7
Bighorn 21 1 3 9 8 31 5 6 9 11
Peace River Arch 39 9 9 10 11 26 6 7 7 6
Clearwater 283 115 81 - 87 260 84 93 - 83
Greater Sierra 5 1 1 1 2 6 - - - 6
Other and emerging 12 4 4 2 2 8 3 2 2 1
Total Canadian Division 390 140 104 29 117 372 111 122 25 114
USA Division
Piceance 85 20 20 23 22 116 21 21 35 39
Jonah 49 9 13 13 14 41 11 9 7 14
Haynesville 19 7 5 5 2 17 1 - 4 12
Texas 1 1 - - - 4 - 1 - 3
Other and emerging 83 19 24 21 19 107 33 35 14 25
Total USA Division 237 56 62 62 57 285 66 66 60 93
SU
PP
LE
ME
NTA
L IN
FO
RM
AT
ION
U
.S.
DO
LL
AR
S/
U.S
. P
RO
TO
CO
L