Embed Size (px)
Citation preview

2016
Management Highlights


Steamship Mutual Management Highlights 2016
1
02 Chairman of the Board’s Introduction04 Underwriting and Reinsurance14 P&I Claims22 Safety and Loss Prevention28 Current Group Issues34 Investments38 Combined Financial Statements60 Staff Training61 Glossary
Contents

Steamship Mutual Management Highlights 2016
2
Chairman of the Board’s Introduction
I am pleased to report a very strong financial performance by the Club over the past year. Free reserves have increased by US$64 million to US$440 million, substantially due to a strong underwriting performance with a combined ratio of 76%. This comes following the previous year’s combined ratio of 78%, itself an exceptionally good performance. There was a negative investment return of 0.1% but given the market conditions prevailing over the period, restricting the extent of the loss to this degree was an acceptable outcome.
For a second successive year the Club’s capital base has been markedly strengthened and now stands well in excess of the AAA level of target capital measured by Standard & Poor’s (“S&P”). The financial year operating performance was due in large part to releases from prior years’ outstanding claims estimates. Such releases have been a feature across the insurance market in general, and the marine market in particular, and as such they are perhaps not entirely surprising. In the case of Steamship Mutual the releases are higher than has been the experience of the recent past. We do not expect this level of releases to continue indefinitely and are budgeting for a return to the long term average. However, the releases do appear to reflect the prudent reserving policy long pursued by the Club, careful
risk selection and an effective claims handling procedure. A great deal of work has gone into all these aspects of the Club’s business and the results are a consequence of that effort.
The policy year overall was 11% higher in terms of net claims than the preceding year, though very close to the anticipated level of claims in the Club’s forecast. In fact, the year was closer in result to the 2013/14 year. There was a similar number of claims in the layer up to US$250,000 but the average cost per claim rose by 5%. Across the market as a whole the claims environment has been somewhat benign. Experience has taught us that this may not remain the position for long and it is therefore important that the Club’s financial strength ensures that we are well able to cope with any upturn in claims.
The capital strength of the Club means that the Board is in the enviable position of being able to consider options as to how best to use this capital. As a mutual, the interests of the Members are paramount. The Board is determined to maintain financial strength and stability whilst at the same time ensuring that the Members derive real benefits from their membership in and contribution to the Club. Matters under consideration include a return of premium to the membership; greater risk retention within the Club thereby reducing the spend on
external reinsurance the cost of which is inevitably passed on to Members; and a continuation of the policy of keeping rates steady. The Club has already been able to set a zero standard increase for the past two renewals, a policy which has been supported by a rolling three-year average combined ratio of 83%.
In January 2016 Solvency II came into effect. It has taken a great deal of work and effort to prepare the Club for Solvency II compliance. I would like to express my gratitude to all those who have contributed to ensuring that the Club is fully compliant. I would also like to acknowledge the efforts of my fellow Directors for their diligence in acquainting themselves with the new concepts and obligations required by the new regulatory regime. The process has been beneficial to the extent that the Board as a whole better understands the risks inherent in the business and the capital issues confronting the Club. The challenge is to translate the not inconsiderable costs incurred into tangible benefits for the membership.
On 16 January 2016 the majority of EU primary and US secondary sanctions on trade with Iran were lifted. This opens the way for P&I Clubs to be able to offer insurance both for Iranian shipowners and also for Iranian trade for non-Iranian shipowners. The resumption of more normal trading relationships between
A very strong financial performance. Free Reserves increase by US$64 million to US$440 million.

Steamship Mutual Management Highlights 2016
3
Zerostandard increase
76%combined ratio
for the year and 83% rolling three year average.
for the last two renewals.
Iran and the rest of the world is potentially a much needed boost at a very difficult time in the freight market. It is perhaps understandable that the relaxation of one of the most effective and all-encompassing sanction regimes ever imposed involves a period of readjustment before trade can once more flow freely. It has been necessary to establish that a sufficient number of banks are willing to transact business. US primary sanctions continue to restrict the participation of US domiciled companies in the International Group reinsurance programme resulting in the possibility of a shortfall in recovery. That shortfall could have fallen ultimately to the individual shipowners involved in the liability.
This potential for a shortfall in cover concerns not only Iranian shipowners but any shipowner no matter their flag or place of business if the liability has an Iranian nexus. A practical solution to this issue has been achieved by the purchase of a “fall-back” insurance which is sufficient to accommodate a single event loss of US$910 million. However, a lasting resolution of this issue is necessary either by way of a general licence in the United States or a rearrangement of the International Group reinsurance programme. Shipowners are entitled to expect that the International Group ensures the availability of adequate insurance for lawful trades.
The Club’s Managers have continued to play an active role in the many issues being considered by the International Group. Prominent amongst these issues are the requirements of the Maritime Labour Convention due to come into force in 2017 which will require cover for unpaid wages and repatriation expenses, and will necessitate evidence of financial security. Once again shipowners will be looking to their P&I Clubs to enable them to meet these requirements. As always, one of the great benefits of the mutual system is that shipowners have it in their own hands to ensure that the cover they need in order to trade is provided in an efficient, cost-effective manner.
During the course of the year the following Directors retired from the Board: Andrea Marques de Almeida and Heinrich Schoeller. On behalf of the Board I would like to thank them for their valuable contributions. We welcomed Alexandre Albertini, Carsten Sommerhage and Sonia Zagury to the Board and I hope they will enjoy their time with us.
Armand PohanChairman of the Board

4
Underwriting and Reinsurance

5

Steamship Mutual Management Highlights 2016
6
The Club’s strong capital position, following substantial growth in free reserves for another year, enabled it to dispense with any general increase for the 2016/17 renewal.
Underwriting and Reinsurance
OverviewThe 2015/16 policy year was comparable in many respects to the preceding year. Trading conditions continued to disappoint in many sectors, notably dry bulk and container operations. The outlook remained (and is still) uncertain for Members operating in those areas and in others too (offshore support, for example). Growth is predicted to be sluggish, with the slowdown in demand, and oversupply in the worst affected markets, weighing heavily upon earnings.
The Board and Managers are very conscious of these factors, and of the adverse consequences which continue to affect many of the Club’s Members. Premium increases have been avoided when possible, in order to avoid burdening Members with unnecessary increases in cost. Fortunately the Club’s strong capital position, following substantial growth in free reserves for another year, enabled it to dispense with any general increase for the 2016/17 renewal, and to focus instead upon the records and exposures facing individual Members, in order to adjust ratings (down or up) accordingly. At renewal, and in most cases, premium levels remained steady and the majority of Members were not required to pay higher rates than in 2015/16.
As was also the case for the 2015/16 policy year, the Group’s General Excess Loss reinsurance costs reduced again for the 2016/17 (current) policy year, falling by 10.3% in the case of tankers and by over 7% for other vessel types.
As always, the legal and regulatory environment continues to change and impose new obligations upon owners already under pressure from adverse trading conditions. The Maritime Liability Convention will enhance the protection required for abandoned crew members, and the international sanctions regimes affecting Iran and other countries, whilst now partially relaxed in relation to Iran itself, will continue to impact owners and charterers alike. It is an uncertain world, in which the Club can contribute on behalf of Members by being flexible itself and by recognising the need to accommodate changes which will affect the membership. Year to 20 February 2016After last year’s renewal on 20 February 2015 the Club’s entered owned tonnage stood at 74.3 million GT. At the same point one year later, 20 February 2016, owned entered tonnage had increased to 77.8 million GT, reflecting growth of approximately 4.7%, and 3.5 million GT. Most came from additions throughout the policy year (3 million GT) and the balance upon renewal itself.
129m GT
1.8m GT
Club’s overall entered tonnage, including estimated chartered entries of
51.2 million GT, as at 20 February 2016.
and US$2.9 million of additional premium committed over the
next 12 months.

Steamship Mutual Management Highlights 2016
7
Churn, i.e. the reduction in premium per entered owned vessel ton as the year develops and as older higher rated vessels are replaced by younger lower rated vessels, was slightly below the preceding five year average, at 3.3%.
The world fleet is likely to have grown by 3.3% over the last year and the Club’s own growth of 4.7% is thus comfortably ahead of the strategic business plan goal of 110% of annual growth in International Group tonnage (a target of approximately 3.63% in terms of annualised tonnage).
The combined ratio for the financial year was 76.2% and, for three years including 2015/16, 85.2%. As noted elsewhere, free reserves grew by US$64 million to US$440.3 million at year-end. Following the very positive results for 2014/15, which also saw considerable growth in the Club’s reserves, the 2015/16 policy year was highly satisfactory, once again benefiting from reductions in projected claims costs for prior policy years, and reflecting the Board’s aim that claim provisions will, with a statistical confidence of 70% – 80%, be sufficient to meet eventual claims settlement costs.
TONNAGE GROWTH DURING 2015/16 BY VESSEL TYPE – GT MILLIONS
19 Feb 2016
Bulk carrier
Tanker
Container
Cruise and ferry
General cargo
Others
30.630.2
18.017.7
10.312.5
8.89.2
4.55.0
2.32.4
20 Feb 2015

Steamship Mutual Management Highlights 2016
8
OWNED AND CHARTERED TONNAGE 2007-2016 – GT MILLIONS
STEAMSHIP AND WORLD TONNAGE BY AGE OF VESSEL
2007
2008
2009
2010
2011
2012
2013
2014
2015
2016 51.2
46.0
45.0
37.0
30.0
34.0
30.0
25.0
25.0
22.343.5
46.8
49.9
52.8
57.8
62.6
65.3
68.7
74.3
77.8
Owned
Chartered
World
29.3%29.9%
33.3%28.8%
14.6%15.7%
10.3%11.0%
15.6%11.5%
15–19years
20+years
10–14years
5–9years
0–4years
Steamship
Far East
Europe
North America
Latin America
Middle East & IndianSub-continent
38.9%
6.2%
15.1%
6.2%
33.6%

Steamship Mutual Management Highlights 2016
9
Mutual premium
Additional premium
General increase
GROSS TONNAGE BY VESSEL TYPE
GROSS TONNAGE BY REGION
PREMIUM HISTORY
GENERAL INCREASE HISTORY
2007
100.0%
14.0%
2007
9.0%
2008
100.0%
20.0%
2008
15.0%
2009
100.0%
0.0%
2009
17.5%
2010
100.0%
0.0%
2010
5.0%
2011
100.0%
0.0%
2011
0.0%
2012
100.0%
0.0%
2012
5.0%
2013
100.0%
0.0%
2013
7.5%
2014
100.0%
0.0%
2014
10.0%
2015
100.0%
0.0%
2015
0.0%
2016
100.0%
0.0%
2016
0.0%
Bulk carrier
Tanker
Container
Cruise and ferry
General cargo
Others
39.4%
23.7%
16.1%
11.4%
6.5%
2.9%
Far East
Europe
North America
Latin America
Middle East & IndianSub-continent
38.9%
6.2%
15.1%
6.2%
33.6%

Steamship Mutual Management Highlights 2016
10
12 months 310.6 267.6 87.6 226.3 179.1 231.0 368.6 279.8 179.6 198.4
24 months 416.8 348.3 116.2 221.8 241.1 277.9 453.9 327.0 193.6
36 months 463.2 360.4 106.3 223.5 266.9 280.8 467.0 364.0
48 months 455.1 358.5 122.0 219.5 252.5 289.6 465.1
60 months 454.8 392.8 120.0 246.9 250.6 289.3
72 months 461.0 399.9 119.5 266.7 259.0
84 months 464.8 399.4 122.9 263.9
96 months 476.0 386.9 124.9
108 months 500.9 392.5
120 months 500.3
Renewal 20 February 2016Almost all Members renew their Club entries on 20 February, in most cases for a single full policy year, and in a few instances for longer, or from a different start date. This year was no exception, and renewal followed a familiar pattern, with some significant additions, some losses and good growth in overall tonnage.
Against the background of the Board’s decision not to require any general increase, of continuing headwinds in several market sectors, and (not least) the Club’s strong financial position, many Members anticipated reduced or as expiring premium levels for the forthcoming 2016/17 policy year. The Managers were able to meet these expectations in many cases, whilst at the same time seeking premium increases when necessary to bring a Member’s record into or towards underwriting balance.
Overall, premium levels for owned entries renewing on 20 February fell by approximately 0.5%; excluding two year policies, renewals on dates after 20 February, yachts and inland craft, these last two for the most part entered on fixed premium terms. Excess Loss reinsurance costs also fell, as noted above, and in most cases these reductions were passed on directly to Members.
At this renewal as in previous renewals some Members elected to retain more risk through changes in their terms of entry. Generally, this involved raising claims deductibles in order to minimise premium increases, or introducing/increasing annual aggregate deductibles which provide a “one off” annual retention of risk, absorbing routine losses. The value of these changes in terms amounted to approximately US$2 million which, when factored into the renewal outcome, meant that overall premium on like for like renewing mutual business increased by approximately 0.3%. This outcome was very close indeed to the Club’s projections, and met the goals set for renewal.
Overall, the Club’s net entered tonnage grew by approximately 1.3 million GT at renewal, allowing for all additions and losses of both chartered and owned vessels. As at 20 February the Club’s overall entered tonnage (including estimated chartered entries of 51.2 million GT) stood at 129 million GT, an increase over the preceding year’s figure of 120.3 million GT, of which 46 million were chartered.
As is usually the case, renewal of a few fleets was declined by the Managers, either because of concerns over operational issues or because singleton entries offered insufficient spread of risk, with no prospect of expansion.
And again as usual, renewal could not be agreed with a few Members who were not prepared to accept premium adjustments (based on record) in order to ensure an appropriate contribution to their projected future claims.
None of the Members leaving the Club did so because of any stated dissatisfaction with service. In tonnage terms, owned vessel losses, including fleets which were not offered renewal, were less (2.5 million GT) than gains (3.25 million GT). Vessel numbers increased only marginally, however, because most losses were of relatively small vessels, including liftboats, inland vessels, and small bulkers, whilst gains were of comparatively large vessels. Existing Members contributed substantially to this growth, many transferring vessels from their other Clubs. New Members included owners based in South America, Korea, Cyprus and Denmark.
There was speculation over the course of last year and as renewal approached that fixed premium insurance, offered both outside and inside the International Group, would attract and thus erode the mutual entries of owned tonnage in the Clubs. And of course, for some fleets seeking substantially lower limits of cover than those available from Club entry, fixed premium cover has been a familiar choice.
Policy year 2006 2007 2008 2009 2010 2011 2012 2013 2014 2015
INTERNATIONAL GROUP POOL INCURRED CLAIMS BASED UPON HISTORICAL THRESHOLDS – US$ MILLIONSDATA AS AT 20TH FEBRUARY EACH YEAR

Steamship Mutual Management Highlights 2016
11
But owners who have traditionally entered their fleets in an International Group Club, for reasons which include limits as well as many other features of membership, do not appear to have moved out of the mutual system; so far as the Club itself is concerned, for example, only a small number of vessels transferred to the fixed premium market, in each case to non International Group insurers.
Several Members chose to place Hull War cover in the Club, to which reference was made in last year’s Highlights; this area of diversification now attracts regular enquiries.
One reflection of confidence in the Club is whether new vessels have been firmly committed for entry over the course of the forthcoming policy year. It is pleasing to report that some 1.8 million GT, and US$2.9 million of additional premium, has been committed over the next 12 months by 15 Members. This, of course, is in addition to any organic growth from existing Members, and from fleets which may choose to enter the Club for the first time during the policy year.
Current policy year considerationsIn accordance with underwriting policy approved by the Board, the Managers seek steady growth in tonnage, and diversity of vessel/operational types, in order to ensure a satisfactory spread of risk and to avoid growth which
might outrun the Club’s ability to provide effective service. In the run up to Club renewals, the focus is very much upon minimising premium, as is to be expected. Generally, however, and throughout the rest of the year, the loyalty and confidence of Members depends upon more enduring factors, including competence, fairness and efficiency, as well as financial strength.
The Board is conscious, furthermore, that there is considerable scope for growth in areas where the Club has relatively few Members. This includes Greece, of course, where the Club’s office is now in its third year. The Managers’ role is not only to serve the membership as it stands, but also to identify prospective long term Members who endorse mutuality. Equally, the Managers recognise that caution needs to be exercised in some areas, and regularly review the exposure of vessels operating in particularly challenging regions – for example, inland fleets in jurisdictions where the legal system and the claims climate is less predictable than most. In some such cases, it may be impossible to achieve appropriate levels of premium for these risks.
Last year, the level of release calls was reduced, reflecting the Club’s strong capital position. The Directors agreed a further reduction in release calls for open years at their May 2016 meeting, when
closing the 2013/14 year. The basis upon which release calls are calculated is set out in the Club’s website. An excellent capital position has enabled reductions because, with strong reserves, the funds that might be required by regulators (in the event of highly improbable and adverse claims developments and/or other sources of unexpected financial loss) are largely present in such reserves. There is no reason to think that lowering release calls will encourage Members to part company with the Club, but it is one of many factors which promotes confidence in the Association.
The mutual Clubs are rightly characterised by a history of flexibility, so that Members can be insured and accommodated within the system when risks and circumstances invariably change. There are of course many risks that cannot be regarded as “mutual”, including sub-sea construction, dredging, drilling for oil and gas, and other specialist activities which the members of International Group Clubs regard as beyond the normal scope of P&I cover. Equally, however, emerging risks – such as the use of drones – continue to materialise, as technology changes and as new legal and regulatory obligations arise. These risks might or might not be regarded as mutual (for the purposes of sharing risk through pooling), depending upon one’s perspective.
Position at Position at Oct 15 May 16
2013 2.5% Closed
2014 5% 0%
2015 12.5% 2.5%
2016 – 12.5%
RELEASE CALL HISTORY

Steamship Mutual Management Highlights 2016
12
LAYERS OF INTERNATIONAL GROUP PROGRAMME 2016/17
$ 500m
Club Retention US$10m
ICR - Individual Club Retention
US$30m
US$45m
US$80m
US$100m
US$120m
US$580m
US$1.08bn
US$1.10bn
US$2.08bn
US$2.10bn
US$3.08bn
US$3.10bn
Lower Pool
Lower Pool Reinsured by Hydra
Upper Pool Reinsured by Hydra
Hydra
FirstLayer
MarketShare
SecondLayer
MarketShare
Third Layer Excessof Underlying
Hydra
Pollution only
US$1bnCollective Overspill One Reinstatement
Overspill
7.5%ICR
Priv
ate
Pla
cem
ents
Priv
ate
Pla
cem
ents
Non-Pollution

Steamship Mutual Management Highlights 2016
13
Generally speaking, however, the Board prefers and has adopted an inclusive approach to new risks (drones included), and the Managers have adopted this approach in their discussions within the International Group.
The Insurance Act 2015 (“the Act”) will come into force in the United Kingdom during the 2016/17 policy year. The Act will apply to all contracts of insurance and all variations in existing contracts of insurance (when governed by English Law) concluded after 12 August 2016. The Act provides a set of default obligations and outcomes dealing, amongst other things, with pre-contractual disclosure obligations of the insured, and the effect of breaches of warranties. In line with the International Group’s position, the Club’s Rules have been amended from 20 February 2016 so as to adopt the disclosure regime in the Act. This is expected to ensure a fair presentation and a professional assessment of the risk.
However, other provisions of the Act (e.g. remedies for breach) could undermine steps to maintain vessel quality and condition; and they are not necessarily consistent with the aims of mutual insurance. Those provisions are not mandatory, and have not been incorporated into International Group Club rules. The Act is not expected to have a significant impact upon the Club and Members.
Pooling and ReinsurancePooling2015 appears to have been another benign year for large claims, with only 10 exceeding retention declared to the Pool by all Clubs so far. Of these, seven relate to wreck removal, collision and fixed and floating objects incidents. The Club has declared one claim to the Pool which will exceed its retention.
There were small structural changes to the Pooling arrangements for 2016, the Group Clubs’ retention increasing by US$1 million to US$10 million and the top two layers of the Pool now merged. Any Club bringing a claim to the Pool now retains 7.5% of the amount between US$45 million and US$80 million, the balance being apportioned amongst all Clubs.
General Excess Loss contractThe record on the Excess Loss contract has been very good over recent years, although the 2015 policy year incurred one potentially large claim, when the “Alpine Eternity”, entered in another International Group Club, struck a jacket platform in Iranian waters. There is also concern amongst reinsurers about the impact of the recent decision by the Spanish courts in the “Prestige” pollution case (2002 policy year), which could increase the International Group’s exposure to a significantly higher level of claims than would be expected under international convention.
The International Group was able to negotiate an improvement in the cost of the Excess Loss contract, and in most cases the Club was able to pass on this reduction to the Members.
The Group also decided upon a further 5% placement with a single market reinsurer for US$1 billion excess of US$100 million, adding to the two current 5% placements. The US voyage surcharge was maintained at nil.
Club reinsurancesThe Club continues to purchase reinsurance to cover the risk of an accumulation of large claims within its retention, and for the 2016 policy year purchased reinsurance protection against a greater than expected level of claims falling within the Pool. Covers are also in place to support non-pooled risks, defence and the Club’s book of chartered entries.
Stephen MartinManaging Director and Head of Underwriting
Rupert HarrisHead of Reinsurance

14
P&I Claims

15

Steamship Mutual Management Highlights 2016
16
P&I Claims
Higher net claims costs were incurred compared to the previous year, largely due to a worse large claims experience.

Steamship Mutual Management Highlights 2016
17
Whilst not as favourable a claims experience as that of 2014, the Club’s claims performance in 2015 was very close to that forecast at the start of the year.
The cost of claims within the US$9 million retention experienced by the Club in 2015 was 20.6% higher than the comparable figure for the previous year, despite a remarkably similar number of claims. As such, it closely mirrored the 2013 year claims experience.
However, attritional claims – those claims with values of less than US$250,000 which make up the overwhelming majority of all claims in terms of numbers – were largely unchanged both in terms of frequency and severity with the overall cost of attritional claims only 2.7% higher than in the previous year. Despite this, the average size of attritional claims increased by 5%; a continuation of the long term upward trend.
The increase in net claims costs was seen in the larger losses – those involving claims in excess of US$250,000 – where, despite lower claims numbers, severity increased by 30%. Moreover, the rise was most pronounced in claims in the US$1.8 million – US$9 million range; a total reversal of the situation in the previous year.
The composition of large claims had also altered compared to 2014 with crew and passenger claims being responsible for the largest share of these large claims costs.
At year end, only nine Pool claims had been reported for 2015; less than half the number experienced in most previous years. Only one of them involved the Club. Moreover, the preponderance of Pool claims resulting from either collision or damage to fixed or floating objects continued the trend of the previous two years.
The Club’s experience in relation to prior year claims proved very positive with 2015 showing a significant improvement in all prior year results both at the retained and Pool levels, particularly in relation to the 2014 year. However, the Club continued to maintain a prudent reserving appetite as shown in the chart above which indicates a stable trend in the level of IBNR provisions at each financial year-end.
Attritional claims figures provide the most reliable indicator of current claims trends and, thus, their continued low levels are to be welcomed. However, the year is currently only 62% developed and so the scope for volatility in its overall result remains.
Pool claims
Crew and passenger claims
increased in both frequency and severity.
reported for 2015 were less than half that of most previous years.
IBNR AS A PERCENTAGE OF TOTAL NET OUTSTANDING CLAIMS AS AT EACH FINANCIAL YEAR-END
50%
45%
40%
35%
30%201620152014201320122011

Steamship Mutual Management Highlights 2016
18
RETAINED OWNED CLAIMS BY CLAIM CATEGORY AT 12 MONTHS – US$ MILLIONS
RETAINED OWNED CLAIMS BY SIZE AT 12 MONTHS – US$ MILLIONS
2006
2007
2008
2009
2010
2011
2012
2013
2014
2015
20 40 60 80 100 120
Cargo Collision Crew Defence F&FO
Injury Others Passenger Pollution Wreck
2006
2007
2008
2009
2010
2011
2012
2013
2014
2015
20 40 60 80 100 120
Under $100k $100k–$250k $250k–$1.0m $1.0m–$1.8m $1.8m–$9.0m Over $9.0m

Steamship Mutual Management Highlights 2016
19
AVERAGE SIZE OF ATTRITIONAL CLAIMS (UP TO US$250,000) AT 12 MONTHS
Large Claims AnalysisThe Club experienced 54 claims in excess of US$250,000 in 2015 with a total net of deductible (“NOD”) estimate of US$133.4 million. The frequency of those claims was lower than for the two preceding years, but their severity was greater. The comparable figures for the preceding years were:
A notable difference between the 2015 and 2014 experience was the increased frequency and severity of the claims in the layer US$1.8 million – US$9 million. There were 11 such claims in 2015 totalling US$47.8 million, compared with six claims valued at US$18.6 million in 2014. However the 2015 experience was more comparable to that of 2013 when there were 11 claims in this layer valued at US$36.6 million.
The Club had just one Pool claim in both 2014 and 2015, and two Pool claims in 2013. Consequently capping the exposure at the applicable retention level for those years of US$9 million still results in the claim severity for 2015 being greater than in 2014 (US$77.4 million compared with US$59.3 million) and comparable with that of 2013 (US$77.2 million).
On both an overall and capped basis, the largest contributor to the 2015 large claims, by both category and number, were crew. These represented 35% of the number and 64% of the value of these claims. However one of those claims, arising from the total loss of a vessel and its crew, represented 75% of the total large crew claim exposure. However, even if that claim was not taken into account, the remaining crew claims still represent the largest single category at over 15% of the total. The other significant contributions to the total exposure were the Passenger and Fixed and Floating Object (“F&FO”) categories which amounted to approximately 12.5% and 12% by value respectively. Cargo claims were lower in frequency and severity than in 2014, and after including the chartered experience, made up approximately 8.5% of the total.
CargoThere were nine large cargo claims with a total value of US$9.1 million.
The claims involved a wide variety of vessel types and a range of causes. There were familiar issues of deficiencies in operational procedures and maintenance of machinery and systems in a number of cases. Two claims involved cargo damage as the result of an ingress of ballast water. Whilst the precise cause of one of these has yet to be determined, the other was attributable to leakage from an improperly secured manhole cover that had been opened for maintenance work. This has been a recurrent cause and is eminently avoidable through adherence to operating procedures.
One casualty arose from a grounding and underwater damage to the vessel as the result of a pilot taking the vessel into shallow water without this apparently being noticed by the bridge team. Once again, a failure of the bridge watchkeeping team to closely monitor a vessel’s position whilst under pilotage is a recurrent cause of incidents giving rise to various categories of P&I liabilities.
Claims NOD estimate
2013 62 US$88.2m
2014 63 US$111.2m
20,000
18,000
16,000
14,000
12,0002014 201520132012201120102009200820072006

Steamship Mutual Management Highlights 2016
20
Apart from the crew claims that arose from the total loss, it was notable that four of the injury claims, with a total exposure of US$14.3 million arose from incidents during mooring or line handling operations. The other injuries arose either from slips and falls, or a failure to follow proper working procedures.
All of the major illness claims involved either heart attacks or strokes.
PassengerThere were nine large passenger claims with a total value of US$16.7 million. The comparable figures for 2014 were three claims amounting to US$1.3 million.
Only two of these claims involved individual passenger injuries and these claims totalled US$618,000. One of those sadly involved the drowning of a child in a swimming pool on a passenger vessel.
The bulk of the passenger vessel claims exposure was generated by costs and liabilities incurred following the curtailment of cruises as the result of a variety of casualties ranging from machinery breakdown, fire, grounding and contact with a fixed object.
CollisionThe collision claims experience in 2015 was much more favourable than in the last two years, there being only one large claim valued at US$1.2 million. This incident arose due to errors on the part of an assisting pilot. In contrast there were eight such claims in 2013 amounting to US$10.6 million and four claims in 2014 totalling US$6.3 million. However this does not take into account the two large third party injury claims reported later in this section where the largest financial exposure related to loss of life albeit that those liabilities arose from collisions.
CrewThere were 19 large crew claims with a total value of US$85.6 million. This compares with 15 claims in the preceding year valued at US$7.5 million. The Pool claim fell into this category.There were 14 injury claims and five illness claims and the former represented the substantially greater proportion of the total exposure. It was also notable that 12 of the injury claims and three of the illness claims involved US based or operated vessels, and that the majority of the claims arose on smaller vessels such as tugs, barges and supply ships. Ten of the injury claims and two of the illness claims involved these ship types.

Steamship Mutual Management Highlights 2016
21
Fixed and Floating ObjectsThere were eight F&FO claims with a total value of US$15.7 million. This was a much more favourable experience than in 2014 when there were 13 large claims amounting to US$44.1 million.
Four of the claims arose following contact with a dock during berthing manoeuvres and these incidents made up almost 59% of the total exposure. The majority of these incidents involved misjudgement of approach manoeuvres and the effects of wind and tide, and two of the incidents occurred notwithstanding the presence of a pilot.
The largest individual claim of almost US$5.7 million arose from a vessel striking and severely damaging a tidal measurement station whilst underway as the result of poor lookout and a lack of situational awareness on the part of the bridge team.
InjuryThere were four third party injury claims valued at US$2.5 million compared with one such claim in 2014 amounting to US$750,000.
Two of these claims involved collisions with fishing vessels and the resulting injury and loss of life to those on board. These incidents accounted for the majority of the exposure in this category. The two other claims involved accidents to shore-based personnel providing services to the vessel – one was a repair contractor who fell from a mast as the result of not wearing appropriate personal protective equipment, and the other a diver who was injured as a result of the vessel’s main engine movements whilst he was underwater.
PollutionThere was only one pollution claim amounting to US$262,000 which arose from a spillage when tanks overflowed during bunkering operations.
Colin WilliamsHead of Claims

Safety and Loss Prevention
2222

2323

Steamship Mutual Management Highlights 2016
24
Safety and Loss Prevention
The review of the large claims in excess of US$250,000 incurred by the Club in 2015 is contained in the P&I Claims section of this report.
As was the case in 2014, three categories of claim accounted for the majority of the overall large claims exposure. Crew, passenger and F&FO claims, in that order of severity, represented almost 88% of the total. The largest crew claim involved the foundering of a vessel, sadly with the loss of all hands. However, even with the exposure arising from that substantial claim capped at the level of the Club’s retention before pooling, crew still represented the largest single category of claims exposure.
Leaving aside the total loss, it was notable that a very significant proportion of the crew injury claims arose from incidents during mooring or line handling operations, when ropes or wires either parted under load, or rapidly tightened when the seafarers involved were located in areas of danger. This risk is one that should be familiar to all seafarers from their training but nonetheless accidents continue to occur, and the resulting injuries can be extremely serious or fatal. Whilst the Managers have previously published loss prevention bulletins on the dangers associated with mooring lines and mooring operations, this most recent claims experience strongly suggests further loss prevention material on this topic could be beneficial and this will be developed. Although not an obvious feature of the incidents which occurred in 2015, there is a body of opinion which suggests that the practice of delineating “snap-back” zones on mooring decks could have the potential to create a false sense of security, in that seafarers may feel that they are not at risk if located beyond the zones. It may be safer to encourage the view that the whole of the mooring deck is potentially hazardous and thereby increase the level of risk awareness.
Another notable feature of the large injury claims were the number that involved accidents which occurred on small vessels such as tugs, barges and supply vessels. In addition the majority involved vessels based in, or operated from the United States. The injuries arose either from slips and falls, or a failure to follow proper working procedures. It is difficult to establish a common issue in these accidents that would suggest an appropriate loss prevention response, but one possibility may be that on these smaller vessels, in a laudable effort to accomplish work that needs to be done, seafarers may be attempting to undertake tasks unaided and thereby suffering injury that might have been avoided if an additional person had assisted. This may be a suitable area for loss prevention guidance to be issued.
In relation to the claims arising from illness, it was notable that all of these involved either heart attacks or strokes, and that the majority might have been avoided had the seafarers concerned undergone more extensive Pre-Employment Medical Examinations (“PEME”). Several of the individuals were nationals of countries not currently covered by the Club’s PEME scheme and depending upon the overall level of illness claim exposure from those nationalities, consideration will be given to expansion of the scheme to those countries.
It is a concern that serious injuries and fatalities continue to occur as the result of accidents involving ships’ lines and mooring operations.

Steamship Mutual Management Highlights 2016
25
In April 2015 filming took place in London and Manila of the material for the Club’s latest loss prevention DVD “Fit for Life”. The catalyst for this DVD, produced with funding from The Ship Safety Trust, was the substantial and persistent exposure to crew illness claims. The DVD focuses upon crew health and seeks to raise awareness amongst seafarers of the importance of maintaining good health and fitness, and to improve their understanding of the medical conditions that frequently give rise to crew illness claims. The film highlights the measures that individuals can take, through lifestyle choices involving matters such as diet and exercise, to control the risks to their health. The film also explains the scope and objectives of the Club’s PEME scheme. It encourages seafarers to regard the PEME not as a potential obstacle to employment, but rather as the means by which they are able to determine and monitor the status of their health on an ongoing basis, and thereby obtain early warning of the onset of any condition that might ultimately threaten their fitness for sea-going employment. Through such early detection of medical issues, and the use of either medication or lifestyle changes to address such conditions, there is potential for possible career-ending unfitness to be averted, with clear benefits for both the individual seafarer and the employer.
The DVD was launched in September during London International Shipping Week at a preview event at the Managers’ London office that was attended by the UK Minister for Shipping and Ports, Mr Robert Goodwill, MP. This was followed by a premiere screening of the film before an invited audience at The Barbican Theatre in London. Copies of the DVD have been distributed to Members for use onboard their vessels. The DVD was subsequently shortlisted for the “Investment in People” category of the 2016 Seatrade Awards.
The Managers continued to work with Videotel Marine International on the production of onboard safety training programmes, particularly the development of a series of programmes on Healthy Living at Sea because of the alignment of these with many of the objectives of the “Fit for Life” DVD. That series of programmes will be available later this year.
In addition, in a new initiative that is also directed towards crew health, the Managers are working with Marine Catering Training Consultancy on the production of computer based training materials that address safe food handling and nutrition. Funding for this work is again provided by The Ship Safety Trust. The first unit in this production should be available later this year.
“Fit for Life”DVD shortlisted for the 2016
Investment in People Seatrade Award.

Steamship Mutual Management Highlights 2016
26
The Ship Safety Trust is also supporting the Physical Wellbeing module of the Sailors’ Society’s “Wellness at Sea” coaching programme as a further means to provide guidance to seafarers on health issues.
Through this combination of initiatives that are all relevant to crew health, it is to be hoped that some benefit can ultimately be derived through a reduction in the number of avoidable crew illness claims.
The large passenger claims that arose in 2015 predominantly involved the costs and liabilities incurred following the curtailment of cruises as the result of a variety of casualties ranging from machinery breakdown, fire, grounding and contact with a fixed object. There was no common theme to suggest the need for particular loss prevention activity.
With regard the F&FO claims, the majority of the exposure involved contact with docks during berthing manoeuvres. These cases generally involved misjudgement of approach manoeuvres and the effects of wind and tide. The largest individual claim involved contact with a large structure whilst a vessel was underway. These claims all involved familiar and recurrent issues concerning the monitoring of the vessels’ progress by bridge teams, particularly whilst under pilotage.
In view of the recurrent and substantial liabilities that arise from “navigational incidents” the Managers continue to support initiatives that potentially enhance navigational safety. The Nautical Institute‘s publication “The Navigator” continues to be published on the Club’s website and Members are encouraged to ensure that this is distributed within their fleets. The Ship Safety Trust has also continued to support The Nautical Institute through funding of the cost of producing translations of the 10 key points that are made in each issue of the publication. Versions of these key point documents are being produced in Greek, Mandarin, Russian, French, Tagalog and Spanish. In addition, with funding from The Ship Safety Trust, Members have been supplied with a complimentary text book on the human aspects that are frequently the cause of the navigational errors that result in casualties.
The Club’s fourth residential training course for Members took place in London and Southampton in June 2015. Twenty one delegates attended, representing Members based in the United States, the United Kingdom, India, South Korea, the United Arab Emirates, the Philippines, Russia, Italy and Turkey. As in previous years, delegates commenced the course with a visit to the Managers’ London office and thereafter transferred to Southampton for the remainder of the course activities. Extremely positive feedback was once more received from the delegates and the next course will be held in June 2017.
Representatives of the Managers participated during the year in various loss prevention seminars held in Athens, Limassol, London, Manila, St Petersburg and Warnemunde.
Chris AdamsHead of Loss Prevention
Is a false sense of security generated by delineated snap-back zones?
Steamship Mutual Management Highlights 2016
27

28
Current Group Issues

29

30
Steamship Mutual Management Highlights 2016
International SanctionsIn July 2015 the Joint Comprehensive Plan of Action (“JCPOA”) was agreed between the P5+1 countries and Iran outlining a roadmap for the lifting of sanctions in exchange for Iran agreeing to certain measures in respect of its nuclear infrastructure and development programme. On 16 January this year final agreement was reached, the so-called ‘Implementation Day’, resulting in the lifting of most (but not all) EU and US sanctions against Iran affecting, amongst other things, maritime trade with Iran and the associated insurance of vessels engaged in such trade, and also the provision of insurance and reinsurance cover to Iranian vessels and entities. However, US primary sanctions (those applicable to US persons) remain largely intact, meaning that US persons remain generally prohibited from dealing, directly or indirectly, with Iran or Iranian entities, including in relation to the provision of insurance and reinsurance cover to or in connection with Iran. This has thrown up an issue for the International Group concerning the risk of reinsurance shortfall in the Group’s collective reinsurance programme which includes participation by US-domiciled reinsurers. In the absence of a licence granted by the US Office of Foreign Assets Control (“OFAC”) those US-domiciled reinsurers are prevented from paying any claims with an Iranian nexus.
All International Group Clubs’ Rules provide that where there is reinsurance shortfall, that shortfall is passed back to Members and this could affect not only Iranian shipowners but also any shipowner involved in an incident or claim with an Iranian nexus. This need not necessarily be in Iran or Iranian waters, although that is more likely to be the case, but could occur in any part of the world, a collision with an Iranian ship being an obvious example.
In order to address this problem, the Group has placed “fall-back” reinsurance with non-US reinsurers to fill, at least in part, the gap left by US-domiciled reinsurers in the Excess of Loss contract; the reinsurance of the Group’s captive reinsurance vehicle, Hydra; and in the US-domiciled private placement. This fall-back cover has an aggregate limit of €100 million with the option of two full reinstatements and covers US-domiciled reinsurance shortfall for both certificated and non-certificated liabilities, although certificated liabilities (those arising under the CLC Convention, Bunkers Convention, Wreck Removal Convention, Athens Convention, STOPIA and TOPIA) will continue to be re-pooled in accordance with the provisions of the Group’s pooling arrangements. Members’ potential exposure is therefore limited to reinsurance shortfall in respect of non-certificated liabilities.
On the basis of a single event loss the fall-back cover is sufficient to accommodate liabilities up to US$910 million.
Of course the fall-back cover does not provide a long term solution to this issue and the International Group is continuing to liaise with the US authorities with a view to securing licences from OFAC permitting those US-domiciled reinsurers to pay their share of an Iranian related claim. If that is not achievable before the next renewal the International Group will need to consider the ongoing participation of US-domiciled reinsurers in the Group’s collective reinsurances.
The Managers are naturally pleased that the fall-back insurance has been placed and at limits which provide very significant protection indeed against the potential for reinsurance shortfall such that the risk of the fall-back insurance being exhausted is now extremely low. However, the Managers did favour a more comprehensive re-pooling solution to this problem, so that Members’ legitimate and lawful trading aspirations could be fulfilled.
Current Group Issues
Sanctions imposed by the UN, EU and/or US continue to affect a number of countries, but by far the biggest development this year has been in relation to the lifting of sanctions against Iran.

31
Steamship Mutual Management Highlights 2016
Current Pollution Issues Funding of interim payments in Civil Liability Convention (“CLC”) casesWhen the IOPC Fund Administrative Council decided to dissolve the 1971 International Oil Pollution Compensation Fund (“IOPC Fund”) in 2014 despite the fact that a number of 1971 Fund cases involving International Group Clubs remained outstanding, this resulted in a pollution claim having to be funded by the shipowner in excess of the limit imposed under CLC due to the Clubs’ practice of interim funding to ensure speedy compensation of “hardship” cases. As a result, the Clubs have been reviewing their pollution claims settlement guidelines and, following discussion with the Fund, hope in the near future to agree a template and a new set of guidelines to ensure that interim payments can be treated in a way protective of the Clubs’ position in cases where the Convention limits are likely to be exceeded.
Determination of the quantum for which the London P&I Club has been held liable has been deferred to a separate procedure that could last six to 12 months.
In accordance with Spanish procedural rules, an application has been made by the Master to the Supreme Court for a reconsideration of its decision. Depending on the outcome of this application, further appeal proceedings may be brought before the Spanish Constitutional Court and, if necessary thereafter, before the European Court of Human Rights. If the appeal proceedings succeed, and the Master’s conviction by the Supreme Court of a reckless crime against the environment is quashed, it is understood that civil liabilities based on that conviction will likewise be annulled.
Moreover, the London P&I Club had previously obtained London arbitration awards against both the Spanish and French States to the effect that it has no direct liability to third parties other than permitted by the CLC. Accordingly, an alternative defence could be raised under the Brussels Convention, if necessary, arguing that the latest Spanish judgement constitutes an irreconcilable regulatory decision.
“Prestige” – Spanish Supreme Court judgementIn November 2002, the “Prestige”, entered in The London Steam-Ship Owners’ Mutual Insurance Association Limited (“London P&I Club”), broke up in the Bay of Biscay spilling approximately 65,000 MT of fuel oil off the Spanish coast. In 2013, the initial trial court did not find either the Master or the owners criminally liable for the incident. However, in a decision by the Spanish Supreme Court in January 2016, the Master was found guilty of the crime of reckless damage to the environment based on “evidence” completely contrary to that considered in the initial trial. Moreover, on the basis of this finding of criminal liability on the part of the Master, the Supreme Court has imposed civil liability on the Master, the owners, their P&I Club, and the 1992 Fund for the pollution.
With regard to the CLC limit of approximately US$26.7 million, the Court held that the provision of cover in excess of this limit exposes the London P&I Club to direct action outside of the scope of the 1992 CLC but in accordance with Spanish law. Accordingly, the London P&I Club, alongside the owner and Master, have been found civilly liable directly up to the US$1 billion oil pollution policy limit of the owner’s P&I cover.

Steamship Mutual Management Highlights 2016
32
Maritime Labour ConventionThe ILO Maritime Labour Convention, 2006 (“MLC 2006”/”the Convention”) was ratified on 20 August 2012 and entered into force on 20 August 2013.
The basic aims of the MLC 2006 are:• to ensure comprehensive
worldwide protection of the rights of seafarers (the Convention is sometimes called the seafarers’ Bill of Rights);
• to establish a level playing field for countries and shipowners committed to providing decent working and living conditions for seafarers, protecting them from unfair competition on the part of substandard ships.
From a P&I perspective the key components of the Convention govern a right to compensation for death, injury or illness as set out in national law or by employment and for repatriation costs.
Until now International Group Club certificates have been accepted by Flag States as sufficient evidence of financial security for repatriation following abandonment of crew due to insolvency and the Club’s rules were amended in 2013 to allow for such cover.
While some of the elements of the Convention are mutual (such as injury) the Pooling Agreement was not extended to cater for repatriation costs arising from insolvency as such was not deemed to be a mutual risk by the International Group.
The Convention is being revised by the International Maritime Organisation so that as of January 2017, the requirements are extended in that financial security requirements will cover abandonment of seafarers including not just repatriation costs but also unpaid back wages of up to four months and contractual claims for death and injury.
All Club Boards have agreed that Club cover should be extended to include back wages but as with repatriation such loss will not be pooled. To cover such exposure Clubs are currently investigating reinsurance solutions from the commercial market.
While a Club certificate has hitherto been accepted as evidence of MLC 2006 compliance from January 2017 the financial security form will need to meet specific requirements. Such documents will be issued by the Club and their final form is presently being drafted.

Steamship Mutual Management Highlights 2016
33

Investments
3434

3535

Steamship Mutual Management Highlights 2016
36
We would again like to thank the Managers and the Corporate Trustee of The Steamship Mutual Trust (“the Trust”) for providing the information necessary to produce the charts which follow. The combined investment return is calculated on the investment assets of the Trust combined with the property, fixed income and cash balances maintained by the Associations for operational purposes.
MarketsTwo themes have been consistent as the year has evolved; the uncertainty over when and how quickly the US Federal Reserve would raise interest rates, and concern over the impact of global economic instability on markets. While much of the year was dominated by interest rate discussions, financial market volatility was heavily influenced by accommodative monetary policy, weakness in Asian economies and oil prices.
In the first half of the year markets entered an unsettled period triggered by financial problems in Greece, potentially precipitating an exit from the euro, fears over currency devaluations, a possible default by Puerto Rico and a 20% sell-off in the Chinese equity market following a gain of more than 60% in the previous six months. These events overshadowed rising expectations of an increase in US interest rates some time in 2015. The market pushed long-term
bond yields up and fears of challenging liquidity conditions across bond markets increased yields further pushing returns into negative territory. Though equity markets largely shrugged off these developments and the economic progress of most developed countries continued to improve, there were signs that volatility and risk aversion were rising.
In August, a surprise devaluation of the Chinese yuan and collapse of the Chinese stock market stoked fears that China’s economic slowdown was more severe than feared. The knock-on effect of waning demand from the largest importer of oil, iron ore, and industrial metals caused concern in global markets. The S&P 500 index lost 10% in one week, the oil price fell by 25%, closing near to US$45 a barrel in September, and other commodity prices followed. Expectations for the first US interest rate increase declined and ebbed further on stubbornly low US inflation. While volatility picked up in global equity and commodity markets, a flight to quality ensued with bonds generally posting positive returns.
Stresses emerged in the corporate bond markets in the latter part of the year, particularly in the energy sector. The renewed fall in oil to below US$40 a barrel and Russia’s response by maximizing output from easy to reach resources impacted energy and other commodity-related bonds as investors worried about overleveraged producers.
High yield bonds were particularly hard hit and deteriorating fundamentals resulted in corporate bonds as a whole underperforming government bonds. In December the US announced its long awaited 0.25% increase in interest rates, further depressing overall bond returns.
Financial markets experienced a volatile start to 2016 as soft economic data from China and the ensuing rout in the Chinese stock market weighed on global sentiment and put pressure on emerging market currencies and commodity prices. Oil prices plummeted to a multi-year low of US$27 while the S&P 500 Index endured its second 10% correction in just over four months. The Bank of Japan moved to negative deposit rates and China continued to make liquidity injections while the European Central Bank hinted at more easing given stubbornly low inflation. In a flight to quality even investment grade corporate bonds suffered as spreads widened further. By mid-February markets had begun to reverse course. A potential production cap agreement helped the oil price to stabilise and volatility subsided. Rising expectations that US interest rates would remain on hold resulted in falling bond yields helping bonds to post positive total returns.
Investments
Net of the currency loss on the matching assets the portfolio recorded a loss of 0.1%. The minimal loss reflects the impact of a conservative asset allocation in a volatile and unfavourable market.

Steamship Mutual Management Highlights 2016
37
Looking forward, central bank policy remains the most important driver of market stability. Many asset prices depend on a continuation of this policy and are arguably not supported by economic fundamentals. There are negative short term interest rates in an increasing number of countries and for most traditional asset classes there is little prospective return for risk taken by investors.
Although the economic performance of most developed countries continued to improve, global investment markets did not perform as many would have expected. The S&P 500 fell by 9.1% in the year to 20 February 2016, while Japanese and European equity indices fell by 12.6% and 15.7% in local currency and 7.4% and 17.7% in US dollar terms. In contrast the Barclays Global Aggregate index, which represents global bond markets, returned 2.0% over the year in US dollar terms. Heightened risk of default, especially on bonds issued by energy and mining companies, lead government bonds to outperform corporate and high-yield bonds. The strong US dollar significantly reduced returns from overseas assets.
Investment performanceThe Trust recorded an overall investment loss of 0.9% before fees. This includes a currency loss of 0.8% on assets held to match the currency exposure in claims liabilities. The currency loss of US$6.3 million has been allocated to the underwriting section of the Income and Expenditure Account.
Net of the currency loss on the matching assets the portfolio recorded a loss of 0.1%. The minimal loss reflects the impact of a conservative asset allocation in a volatile and unfavourable market. A return of 1.3% on bonds, which form the majority of the portfolio, was offset by an 11.1% loss on equities and a 3.5% loss on hedge fund of funds.
Risk management and asset allocationHaving repositioned the portfolio to reduce interest risk at the beginning of the year the allocation has remained unchanged for the remainder of the period. The matching portfolio, held to back combined net claim liabilities and comprising a mixture of highly rated government and corporate bonds, continues to be managed on a ‘buy and maintain’ basis, holding individual bonds to maturity, with dynamic management of overall portfolio duration and hence interest risk. This portfolio is used to provide collateral for the reinsurance obligation of the Trust to SMUA.
The remaining surplus portfolio is principally invested in two absolute return bond funds run by Wellington and TCW, both of whom have managed bond investments for the Trust for a number of years. These funds are complemented by a small investment in a global equity index fund and investments in two hedge funds of funds which have a strong record of superior risk-adjusted performance. This allocation aims to deliver an appropriate return while carefully managing interest rate risk and maintaining a comfortable margin of capital above the requirements for a S&P financial strength rating of A.
The Corporate Trustee has continued to consult regularly with the Board of SMUAB, which is the ultimate reinsured and whose Members are the beneficiaries of the Trust. That Board receives regular presentations on the utilisation of the agreed risk budget, investment performance and asset allocation.
Steve WardHead of Finance
ALLOCATION BY ASSET TYPE AND PORTFOLIO
Asset Type Government bonds Corporate bonds Cash Absolute return funds Hedge funds of funds Equities Property
Portfolio Matching Operational Surplus
27% 26%
21% 23%23%22%
15% 14%
8%
6%8%
5%
1% 1%
$14m$30m
$599m2015 2016$397m $550m$466m
27% 26%
21% 23%23%22%
15% 14%
8%
6%8%
5%
1% 1%
$14m$30m
$599m2015 2016$397m $550m$466m

Combined Financial Statements
38

39

Steamship Mutual Management Highlights 2016
40
Basis of combinationThe Combined Financial Statements that appear on pages 42 to 59 of these Management Highlights have been prepared by combining the accounts of Steamship Mutual Underwriting Association Limited (“SMUA”) with the consolidated accounts of its principal reinsurer The Steamship Mutual Underwriting Association (Bermuda) Limited (“SMUAB”), and those of that Association’s principal reinsurer The Steamship Mutual Trust (“the Trust”). All the Members of SMUA are also Members of SMUAB who are the beneficiaries of the Trust.
The Combined Financial Statements for “Steamship” are intended to provide an overall summary of the financial position of the three entities which, whilst contractually linked, are not under common management or control.
The consolidated financial statements of SMUAB and the financial statements of SMUA and the Trust are available in separate documents and on the Managers’ website: www.steamshipmutual.com/club-finances/report-and-accounts.html
Free reservesAs at 20 February 2016, the combined free reserves of Steamship were US$440.3 million, an increase of US$64.1 million, or 17.0% over the financial year. For the year under review, the Directors set a 0% general increase in P&I premium. At the 2016 renewal the general increase was again set at 0%.
UnderwritingThe 2012/13 year was closed in May 2015.
Gross premium totalled US$350.3 million compared to US$365.3 million last year.
The financial year combined ratio, calculated by dividing the sum of net incurred claims, allocated currency losses and operating expenses by net earned premium, was 76.2% compared to 82.7% last year.
The Directors have set the release call for both P&I and FD&D at 12.5% of mutual premium for the 2016/17 policy year; 2.5% of mutual premium for the 2015/16 policy year and 0% of mutual premium for the 2014/15 policy year.
ClaimsNet claims paid during the financial year on a combined basis amounted to US$206.1 million, a decrease of 6.7% on the previous year. Net outstanding claims decreased by US$38.2 million to US$613 million, a decrease of 5.9% compared to the previous year.
Gross claims arising in respect of the 2015/16 policy year, including IBNR, are projected to be US$341.7 million, an increase of 11.6% over the 2014/15 policy year (US$306.1 million). Claims net of reinsurance recoveries amounted to US$246 million, an increase of 2.8% compared to the 2014/15 policy year (US$239.4 million).
InvestmentsThere was a combined loss on investments of US$1.8 million, a negative return of 0.2%, but the overall total of cash and investments rose by US$2.3 million, or 0.2%, to US$1,044.1 million.
The Trust recorded an investment loss of 0.1% compared to a gain of 1.6% in the previous year.
A review of investment performance is provided in the Investments section of these Highlights.
Managers’ Report

Steamship Mutual Management Highlights 2016
41
Accountants’ Report
We report on the unaudited Combined Financial Statements of The Steamship Mutual Trust, The Steamship Mutual Underwriting Association (Bermuda) Limited and Steamship Mutual Underwriting Association Limited for the year ended 20 February 2016 (“the combined financial statements”).
Our report is prepared solely for the confidential use of The Steamship Mutual Trust, The Steamship Mutual Underwriting Association (Bermuda) Limited and Steamship Mutual Underwriting Association Limited and solely for the purpose of informing the Members of The Steamship Mutual Underwriting Association (Bermuda) Limited and Steamship Mutual Underwriting Association Limited. To the fullest extent permitted by law, we do not accept or assume responsibility to anyone other than The Steamship Mutual Trust, The Steamship Mutual Underwriting Association (Bermuda) Limited and Steamship Mutual Underwriting Association Limited and of the Members of The Steamship Mutual Underwriting Association (Bermuda) Limited and Steamship Mutual Underwriting Association Limited as a body, for our work, for this report, or for the opinions we have formed.
ResponsibilitiesThe Steamship Mutual Trust, The Steamship Mutual Underwriting Association (Bermuda) Limited and Steamship Mutual Underwriting Association Limited are responsible for the preparation of the combined financial statements.
It is our responsibility to carry out procedures designed to enable us to express an opinion as to whether the combined financial statements have been accurately compiled from the financial statements of The Steamship Mutual Trust, The Steamship Mutual Underwriting Association (Bermuda) Limited and Steamship Mutual Underwriting Association Limited for the year ended 20 February 2016.
Basis of opinionWe have performed the procedures listed below with respect to the combined financial statements. The procedures were performed solely to assist the Corporate Trustee and the Directors with the preparation of the combined financial statements and are summarised as follows: • We agreed the figures used in the combined financial
statements to the signed financial statements of The Steamship Mutual Trust, The Steamship Mutual Underwriting Association (Bermuda) Limited and Steamship Mutual Underwriting Association Limited as at 20 February 2016 respectively, and agreed adjustments on combination to the underlying accounting records;
• The auditor’s reports on the financial statements of The Steamship Mutual Trust, The Steamship Mutual Underwriting Association (Bermuda) Limited and Steamship Mutual Underwriting Association Limited were issued by ourselves on 9 May and 10 May 2016 and were unqualified. Our audit opinions in these financial statements did not cover the policy year statements;
• We checked the numerical accuracy of the combined financial statements; and
• We checked that the stated accounting policies in the combined financial statements are consistent with the accounting policies adopted by The Steamship Mutual Trust, The Steamship Mutual Underwriting Association (Bermuda) Limited and Steamship Mutual Underwriting Association Limited, as defined in their respective financial statements to determine whether they are consistent.
Our procedures did not constitute an audit in accordance with Auditing Standards. In particular we have not verified any information or documentation provided to us and we should not be taken to have done so beyond the procedures described above.
OpinionWe report that: • The combined financial statements have been accurately
compiled from the financial statements of The Steamship Mutual Trust and The Steamship Mutual Underwriting Association (Bermuda) Limited and the statutory accounts of Steamship Mutual Underwriting Association Limited; and
• Accounting policies adopted in the combined financial statements are consistent with those adopted by The Steamship Mutual Trust, The Steamship Mutual Underwriting Association (Bermuda) Limited and Steamship Mutual Underwriting Association Limited.
Deloitte LLPChartered Accountants
London10 May 2016

Steamship Mutual Management Highlights 2016
42
2016 2015Technical Account Note US$000 US$000Gross premium 2 350,329 365,341Outward reinsurance premium 3 (64,830) (69,002)
Net earned premium 285,499 296,339
Allocated currency losses 7 (8,277) (12,093)Claims paidGross amount 4 269,945 425,452Reinsurers’ share 4 (63,864) (204,509)
206,081 220,943
Change in the provision for claims Gross amount 5 (116,680) (180,448)Reinsurers’ share 5 78,529 147,119
(38,151) (33,329)
Net claims incurred 167,930 187,614
Operating expenses 6 41,397 45,421
Underwriting balance 67,895 51,211
Non-Technical AccountUnderwriting balance 67,895 51,211
Investment income 7 8,035 23,085Unrealised losses on investments 7 (16,955) (14,093)
Currency losses allocated to the Technical Account 7 8,277 12,093
Net investment return (643) 21,085
Investment charges (1,940) (2,078)Other income 37 4,778 Other charges 8 (1,190) -Taxation (25) (8)
Surplus for the financial year 64,134 74,988
Combined Income and Expenditure Account for the year ended 20 February 2016

Steamship Mutual Management Highlights 2016
43
2016 2015Assets Note US$000 US$000InvestmentsLand and buildings 8 14,551 15,741Other financial investments 9 1,007,010 1,008,705
Reinsurers’ share of technical provisionsClaims outstanding 5 295,006 373,535
DebtorsDebtors arising out of direct insurance operations 17,730 18,949Debtors arising out of reinsurance operations 3,580 1,397Other debtors 4,475 6,337
Other assetsCash at bank 22,586 17,419
Prepayments and accrued incomeDeferred acquisition costs 248 491Other prepayments and accrued income 7,793 3,335
Total assets 1,372,979 1,445,909
LiabilitiesCapital and reservesFree reserves 10 440,321 376,187
Technical provisions 1,751 1,786
Claims outstanding 5 908,028 1,024,708
Provisions for other risks and charges
Provision for taxation 25 8
Other provisions – 1,387
CreditorsCreditors arising out of direct insurance operations 4,329 6,518Creditors arising out of reinsurance operations 11 11,339 14,307Other creditors 12 7,186 21,008
Total liabilities 1,372,979 1,445,909
Combined Balance Sheet as at 20 February 2016

Steamship Mutual Management Highlights 2016
44
1. Extract of accounting policies(a) Accounting conventionThe financial statements have been prepared in accordance with the European Commission Insurance Accounts Directive (91/674/EEC) as adopted in the United Kingdom through Section 396 of the Companies Act 2006 and Schedule 3 of The Large and Medium-sized Companies and Groups (Accounts and Reports) Regulations 2008 and applicable United Kingdom applicable United Kingdom Financial Reporting Standards (“FRS”) 102 and 103.
(b) Basis of combinationThe financial statements combine the accounts of SMUAB and its subsidiary undertakings, Steamship Mutual Underwriting Association (Reinsurance) Limited (“SMUARI”), Steamship Mutual Property Holdings Limited (“SMPH”) and its share of Hydra Insurance Company Limited (“Hydra”) with those of SMUA and the Trust to 20 February 2016.
Notes on the Combined Financial Statements
2016 20152. Gross premium US$000 US$000Mutual and fixed premium 349,305 363,447Deferred mutual premium and releases 989 1,865Movement in unearned premium 35 29
350,329 365,341
2016 20153. Outward reinsurance premium US$000 US$000Group Excess Loss 37,633 40,061Other reinsurance premium 27,197 28,941
64,830 69,002
2016 2015
4. Claims paid US$000 US$000
Claims and related expenses 221,732 359,664
Group Pool claims 22,206 36,539
Claims administration expenses 26,007 29,249
269,945 425,452
Less reinsurers’ share
Group Excess Loss 44,857 184,718
Group Pool 16,310 10,464
Other reinsurers 2,697 9,327
63,864 204,509
Net claims paid 206,081 220,943

Steamship Mutual Management Highlights 2016
45
2016 20155. Change in net provision for claims US$000 US$000Gross outstanding claimsProvision brought forward (1,024,708) (1,205,156)Provision carried forward 908,028 1,024,708
(116,680) (180,448)
Group Pool and Excess Loss reinsurers’ share of outstanding claimsProvision brought forward 328,700 464,256Provision carried forward (248,189) (328,700)
80,511 135,556
Other reinsurers’ share of outstanding claims
Provision brought forward 44,835 56,398
Provision carried forward (46,817) (44,835)
(1,982) 11,563
Change in reinsurers’ share 78,529 147,119
Change in net provision for claims (38,151) (33,329)
Net claims outstanding 613,022 651,173
A favourable net run-off deviation of US$78.1 million was experienced during the year (2015: US$44.1 million).
2016 2015
6. Operating expenses US$000 US$000
Brokerage 20,763 22,907
Underwriting administration expenses 8,132 9,698
Other administration expenses 11,786 12,096
Directors’ remuneration 467 460
Auditor’s remuneration 249 260
41,397 45,421
Total expensesOperating expenses 41,397 45,421Claims expenses (note 4 above) 26,007 29,249
Investment charges 1,940 2,078
69,344 76,748

Steamship Mutual Management Highlights 2016
46
2016 20157. Net investment return US$000 US$000Dividends and interest 16,309 5,401Realised (losses)/gainsInvestments (1,334) 23,886Currency (6,940) (6,202)
Investment income 8,035 23,085
Unrealised lossesInvestments (15,618) (8,202)Currency (1,337) (5,891)
Currency losses allocated to the Technical Account 8,277 12,093
Net investment return (643) 21,085
Notes on the Combined Financial Statements continued
The allocation to the Technical Account is comprised of all realised and unrealised exchange differences arising on foreign currency investments held to hedge technical provisions in the same currencies.
8. Land and buildingsSMPH owns a freehold property consisting of office premises in London. It is occupied under licence, free of rent, by the Managers. The property was last valued by CBRE Limited at £10,200,000 (US$15,740,741) reflecting the market value at 20 February 2015. The currency loss of US$1.190 million reflects the movement in the US dollar equivalent of £10,200,000 (US$14,550,642) at the balance sheet date. The original costs incurred when the property was purchased in 1987 amounted to US$16,952,226.

Steamship Mutual Management Highlights 2016
47
2016 20159. Other financial investments US$000 US$000Market valueEquities 52,373 58,834Alternative investments 77,625 80,476Bonds 659,412 629,189Money market instruments 118,653 126,654Deposits with credit institutions 93,741 84,316Cash accounts 6,253 29,715Open forward foreign exchange contracts (1,047) (479)
1,007,010 1,008,705
CostEquities 46,491 46,429Alternative investments 79,659 79,659Bonds 669,116 631,936Money market instruments 118,709 126,654Deposits with credit institutions 93,741 84,316Cash accounts 6,253 29,715
1,013,969 998,709
2016 201510. Free Reserves US$000 US$000Brought forward 376,187 301,199Surplus for year 64,134 74,988
440,321 376,187

Steamship Mutual Management Highlights 2016
48
13. Average expense ratio In accordance with Schedule 3 of the International Group Agreement, Steamship is required to calculate and disclose its Combined Average Expense Ratio, being the ratio of operating expenses to income, including premium and investment income.
The operating expenses include all expenditure incurred in operating Steamship, excluding expenditure incurred in handling claims. Investment income includes all incomes and gains whether realised or unrealised, exchange gains and losses, and investment management costs.
The Combined Average Expense Ratio for the P&I business of Steamship for the five years ended 20 February 2016 is 12.1% (2015: 11.8%).
2016 201511. Creditors arising out of reinsurance operations US$000 US$000Group Clubs and Excess Loss reinsurers 5,823 7,154Other reinsurance creditors 5,516 7,153
11,339 14,307
2016 201512. Other creditors US$000 US$000Unsettled investment transactions 482 13,704Other creditors 6,704 7,304
7,186 21,008
Notes on the Combined Financial Statements continued

Steamship Mutual Management Highlights 2016
49
14. Risk ManagementSteamship monitors and manages the risks relating to its operations through its risk management programme which analyses exposures by degree and magnitude of risks. This is evidenced in its Combined Own Risk and Solvency Assessment (ORSA) report.
The Combined ORSA documents Steamship’s risk and capital management processes employed to identify, assess, manage and report the risks it may face and to determine the capital resources required to ensure that its overall solvency needs are met at all times. The ORSA considers the business strategy, how the strategy aligns to risk appetite and the current risk profile.
The principal risks faced by Steamship are insurance risk, credit risk, market risk and operational risk.
Insurance riskInsurance risk is comprised of two elements; premium risk and reserving risk. Premium risk refers to the risk that insurance premium written in the current policy year is insufficient to cover claims and other costs arising in that year. It thus relates to the future, whereas reserving risk is the risk that, over the next year, existing technical provisions are insufficient to cover claims arising in previous policy years. Steamship is exposed to the uncertainty surrounding the timing, frequency and severity of claims made under its insurance contracts. Premium and reserving risk are calculated by reference to risk factors prescribed by the Bermuda Monetary Authority and then combined taking account of dependencies and diversification effects.
Premium is set using assumptions which have regard to trends and the past experience of a specific Member. Steamship transfers a substantial portion of its insurance risk to its reinsurers through the provisions of the reinsurance arrangements and its membership of the International Group.
The key methods used to estimate claims liabilities are Bornhuetter-Ferguson for the most recent policy year reported and the development factor method for all other policy years. Reserves for both reported and unreported claims are calculated using detailed statistical analysis of the past experience as to frequency and average cost of claims. The Audit and Risk Committee compares the proposed claim reserves with an independent calculation performed by qualified actuaries at year end.
Steamship aims to reduce reserving risk by setting claims reserves at a prudent level that provides between 70% and 80% confidence that they will be sufficient to cover actual settlement costs. Actual experience will differ from the expected outcome but this prudent basis is expected to result in releases of prior year claim reserves.
The sensitivity of the overall surplus to two factors, other assumptions being unchanged, is shown below:
2016 2015US$000 US$000
5% increase in claims incurred on current policy yearOverall surplus: gross of reinsurance (17,084) (14,132) net of reinsurance (17,084) (14,132)
Single claim of US$2billion in current policy yearOverall surplus: gross of reinsurance (2,000,000) (2,000,000) net of reinsurance (34,529) (31,725)

Steamship Mutual Management Highlights 2016
50
14. Risk management continued The following tables show the development of claims over five years on both a gross and net of reinsurance basis.
The top half of each table shows how the estimates of total claims for each policy year have developed over time. The lower half of each table reconciles cumulative claims to the amount appearing in the balance sheet.
2011/12 2012/13 2013/14 2014/15 2015/16Insurance claims – gross policy year US$000 US$000 US$000 US$000 US$000End of reporting year 485,127 429,668 364,898 306,136 341,743One year later 764,249 354,164 254,372 237,964Two years later 949,778 334,971 235,589Three years later 1,072,279 314,316Four years later 1,045,184
Current estimate of ultimate claims 1,045,184 314,316 235,589 237,964 341,743
Cumulative payments to date 875,568 229,292 147,345 121,022 55,306
Claims outstanding 169,616 85,024 88,244 116,942 286,437
Claims outstanding relating to last five policy years 746,263Other claims liabilities 161,765Total gross outstanding claims 908,028
2011/12 2012/13 2013/14 2014/15 2015/16Insurance claims – net policy year US$000 US$000 US$000 US$000 US$000End of reporting year 263,946 280,512 266,696 239,384 245,985One year later 253,164 253,863 230,933 214,612Two years later 243,051 255,088 223,774Three years later 246,075 245,586Four years later 241,346
Current estimate of ultimate claims 241,346 245,586 223,774 214,612 245,985
Cumulative payments to date 197,177 189,067 141,802 108,773 51,966
Claims outstanding 44,169 56,519 81,972 105,839 194,019
Claims outstanding relating to last five policy years 482,518Other claims liabilities 130,504Total gross outstanding claims 613,022
Notes on the Combined Financial Statements continued

Steamship Mutual Management Highlights 2016
51
Credit risk Credit risk is the risk that a counterparty owing money to Steamship may default causing a debt to be written off. The reinsurance protection arranged by Steamship effectively transforms a proportion of insurance risk into credit risk as the risk exposure becomes reinsurer default. External reinsurers are generally only used if their financial strength rating is at least A- from Standard & Poor’s or an equivalent rating from another rating agency, except in the case of some members of the International Group and participants on reinsurance contracts placed through the Group. The key areas of exposure to credit risk for Steamship are in relation to its reinsurance recoverables and bonds in the investment portfolio. Credit risk in respect of amounts due from Members is spread across diverse industries and geographical areas. Cover can be cancelled and claims set off against unpaid premium and there are other strong incentives for Members to keep their insurance cover in place. In practice therefore Steamship experiences prompt payment of premium and bad debt experience is immaterial.Credit risk arises on operational balances and deposits held with banks. This is controlled by using a variety of banks and limiting individual exposures to US$10 million for banks rated AA by S&P, or an equivalent rating from another agency, and U$5 million for banks rated A by S&P, or an equivalent rating from another agency. The credit risk of one unrated, privately capitalised bank is monitored by reference to a specific capital ratio. Loans and receivables from Members, agents and intermediaries generally do not have a credit rating. The following table shows the aggregated credit risk exposure for those assets with external credit ratings:
AAA AA A BBB BB & below Not rated TotalAs at 20 February 2016 US$000 US$000 US$000 US$000 US$000 US$000 US$000Equities – – – – – 52,373 52,373Alternative investments – – – – – 77,625 77,625Bonds and loans 65,822 265,563 161,124 134,687 29,842 2,374 659,412Money market instruments 92,929 5,401 20,323 – – – 118,653Deposits with credit institutions – 83,743 9,998 – – – 93,741Cash accounts – – 6,253 – – – 6,253Foreign exchange contracts – – (1,047) – – – (1,047)Cash at bank 334 17,670 423 – – 4,159 22,586Reinsurers’ share of technical provisions – 16,424 240,075 38,387 – 120 295,006Debtors arising out of reinsurance operations – – 2,260 1,320 – – 3,580Accrued interest 162 1,538 1,213 1,226 140 – 4,279
Total assets with credit ratings 159,247 390,339 440,622 175,620 29,982 136,651 1,332,461
Other assets – – – – – 40,518 40,518
Total assets 159,247 390,339 440,622 175,620 29,982 177,169 1,372,979

Steamship Mutual Management Highlights 2016
52
The following table shows the age analysis of debtors arising out of insurance operations and debtors arising out of reinsurance operations after deducting provisions for bad debt:
Not due 0–30 days 31–90 days Over 90 days Impaired TotalAs at 20 February 2016 US$000 US$000 US$000 US$000 US$000 US$000Debtors arising out of direct insurance operations 10,326 4,208 1,675 701 820 17,730Debtors arising out of reinsurance operations – 3,580 – – – 3,580
Total 10,326 7,788 1,675 701 820 21,310
Not due 0–30 days 31–90 days Over 90 days Impaired TotalAs at 20 February 2015 US$000 US$000 US$000 US$000 US$000 US$000Debtors arising out of direct insurance operations 9,984 2,300 2,071 668 3,926 18,949Debtors arising out of reinsurance operations – 1,397 – – – 1,397
Total 9,984 3,697 2,071 668 3,926 20,346
14. Risk management continued AAA AA A BBB BB & below Not rated TotalAs at 20 February 2015 US$000 US$000 US$000 US$000 US$000 US$000 US$000Equities – – – – – 58,834 58,834Alternative investments – – – – – 80,476 80,476Bonds and loans 65,226 307,849 131,685 113,106 9,935 1,388 629,189Money market instruments 100,828 11,043 14,783 – – – 126,654Deposits with credit institutions – 74,331 9,985 – – – 84,316Cash accounts 3,333 – 26,378 – – 4 29,715Foreign exchange contracts – – (479) – – – (479)Cash at bank 334 12,128 632 – – 4,325 17,419Reinsurers’ share of technical provisions
– 19,698 318,794 34,882 – 161 373,535
Debtors arising out of reinsurance operations
– 250 1,041 106 – – 1,397
Accrued interest 75 985 1,100 1,069 33 – 3,262
Total assets with credit ratings 169,796 426,284 503,919 149,163 9,968 145,188 1,404,318
Other assets – – – – – 41,591 41,591
Total assets 169,796 426,284 503,919 149,163 9,968 186,779 1,445,909
Notes on the Combined Financial Statements continued

Steamship Mutual Management Highlights 2016
53
Market risk Market risk is the risk of financial loss as a consequence of movements in prices of equities and bonds, interest rates and currency exchange rates and other price changes. Market risk arises primarily from investment activities.
Steamship’s exposure to changes in interest rates and market prices is concentrated in the investment portfolio. The risk appetite, asset allocation and tolerance ranges are set by the Board of the Corporate Trustee having consulted with the Board of the reinsured. Exposures and compliance with Board policies are monitored and reported by the Managers assisted by independent investment consultants.
Steamship receives the majority of its premium income in US dollars, a significant amount in euro and small amounts in UK sterling and Canadian dollars. Claim liabilities arise in a number of currencies but predominantly in US dollars, euro, UK sterling and Brazilian reals. This exposure is mitigated by holding investments in euro and UK sterling denominated assets and a derivative position held by the Trust in respect of the Brazilian real. To minimise currency translation costs operational bank balances in euro and UK sterling are maintained to fund expected short term claim payments in those currencies.
The following tables show Steamship’s assets and liabilities by currency:
US dollar UK sterling Euro Brazilian real Korean won Other TotalAs at 20 February 2016 US$000 US$000 US$000 US$000 US$000 US$000 US$000Assets 1,263,852 41,329 41,505 1,140 15,937 9,216 1,372,979Liabilities (794,856) (32,821) (27,536) (16,611) (19,448) (41,386) (932,658)
Total assets 468,996 8,508 13,969 (15,471) (3,511) (32,170) 440,321
Derivative position 12,000
US dollar UK sterling Euro Brazilian real Korean won Other TotalAs at 20 February 2015 US$000 US$000 US$000 US$000 US$000 US$000 US$000Assets 1,311,987 33,240 31,608 50,866 17,979 229 1,445,909Liabilities (881,039) (33,968) (26,635) (73,583) (21,789) (32,708) (1,069,722)
Total assets 430,948 (728) 4,973 (22,717) (3,810) (32,479) 376,187
Derivative position 20,000
IBNR and reinsurers’ share of IBNR are classified as US dollar.
The majority of the operating expenses of Steamship are the costs of SIMSL, the service company of SPIM. These expenses are payable in UK sterling giving rise to a currency exchange risk when compared to Steamship’s base currency of US dollars. Steamship has a Hedging Policy which requires that a percentage of forward future costs be fixed in US dollar terms. This is achieved by entering into forward purchase contracts or other option based products with a bank under the terms of an ISDA agreement.

Steamship Mutual Management Highlights 2016
54
14. Risk management continued Steamship’s interest rate risk is in relation to the fluctuation in the fair value of future cash flows of bonds due to changes in interest rates. The table below shows the change in fair value of the investments assuming a 1% increase in interest rates:
Effect on investment valuationUS$000
As at 20 February 2016 (14,960)As at 20 February 2015 (15,628)
The above assumes that all other key market variables are held constant and that the interest rate change is instantaneous, which is rarely the case.
Liquidity riskLiquidity risk is the risk that Steamship cannot meet its financial obligations as they fall due. Steamship maintains a highly liquid portfolio of cash, government and corporate bonds with a maturity equivalent to the expected settlement period of claim liabilities. Most of the remaining assets in the surplus portfolio could be converted into cash in less than one month.
The following table shows the expected maturity profile of Steamship’s undiscounted obligations with respect to its insurance contract liabilities and other liabilities:
0–1 years 1–2 years 2–5 years Over 5 years TotalAs at 20 February 2016 US$000 US$000 US$000 US$000 US$000Claims outstanding 312,534 204,157 275,451 115,886 908,028Other liabilities 24,630 – – – 24,630Total liabilities 337,164 204,157 275,451 115,886 932,658
0–1 years 1–2 years 2–5 years Over 5 years TotalAs at 20 February 2015 US$000 US$000 US$000 US$000 US$000Claims outstanding 333,657 215,406 303,618 172,027 1,024,708Other liabilities 45,014 – – – 45,014Total liabilities 378,671 215,406 303,618 172,027 1,069,722
Notes on the Combined Financial Statements continued
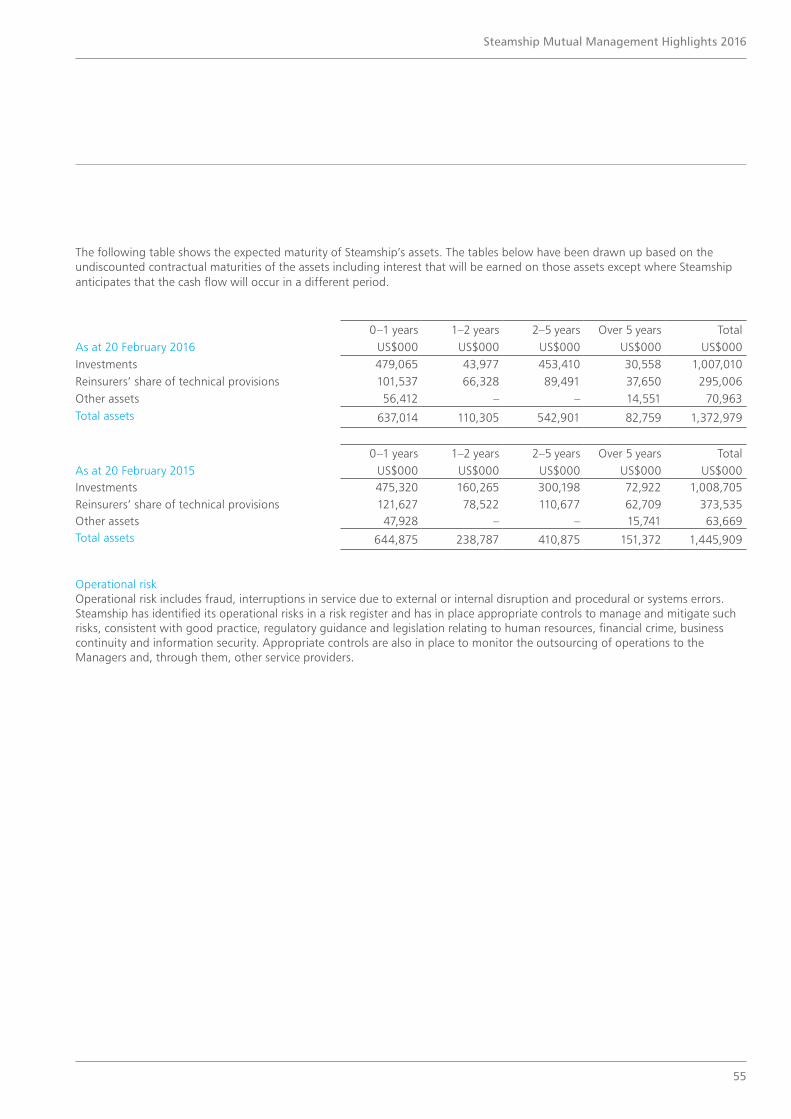
Steamship Mutual Management Highlights 2016
55
The following table shows the expected maturity of Steamship’s assets. The tables below have been drawn up based on the undiscounted contractual maturities of the assets including interest that will be earned on those assets except where Steamship anticipates that the cash flow will occur in a different period.
0–1 years 1–2 years 2–5 years Over 5 years TotalAs at 20 February 2016 US$000 US$000 US$000 US$000 US$000Investments 479,065 43,977 453,410 30,558 1,007,010Reinsurers’ share of technical provisions 101,537 66,328 89,491 37,650 295,006Other assets 56,412 – – 14,551 70,963Total assets 637,014 110,305 542,901 82,759 1,372,979
0–1 years 1–2 years 2–5 years Over 5 years TotalAs at 20 February 2015 US$000 US$000 US$000 US$000 US$000Investments 475,320 160,265 300,198 72,922 1,008,705Reinsurers’ share of technical provisions 121,627 78,522 110,677 62,709 373,535Other assets 47,928 – – 15,741 63,669Total assets 644,875 238,787 410,875 151,372 1,445,909
Operational riskOperational risk includes fraud, interruptions in service due to external or internal disruption and procedural or systems errors. Steamship has identified its operational risks in a risk register and has in place appropriate controls to manage and mitigate such risks, consistent with good practice, regulatory guidance and legislation relating to human resources, financial crime, business continuity and information security. Appropriate controls are also in place to monitor the outsourcing of operations to the Managers and, through them, other service providers.

Steamship Mutual Management Highlights 2016
56
Combined Policy Year Statement All Classes
Development of policy years 2015/16 2014/15 2013/14 TotalOpen policy years US$000 US$000 US$000 US$000Gross premium 351,461 366,013 341,772 1,059,246Reinsurance premium (67,311) (70,361) (61,349) (199,022)
Net earned premium 284,150 295,652 280,423 860,225
Allocated investment return transferred from the non-technical account
(1,910)
(543)
(581)
(3,034)
Net incurred claimsClaims paid net of reinsurance recoveries 38,389 70,676 112,089 221,154Claims administration expenses 13,577 38,098 29,713 81,388Net claims outstanding 92,041 66,329 51,680 210,050IBNR provision 90,568 36,413 29,296 156,277Future claims administration expenses 11,410 3,097 994 15,501
245,985 214,613 223,772 684,370
Operating expensesBrokerage 20,826 22,613 22,497 65,936Other expenses 20,465 22,688 20,357 63,510
41,291 45,301 42,854 129,446
Underwriting balance (5,036) 35,195 13,216 43,375
Allocated net investment income 27,475 (1,004) 19,350 45,821Surplus on open policy years 22,439 34,191 32,566 89,196
Closed policy yearsSurplus in respect of 2011/12 and prior years at 20 February 2015 146,537Balance on 2012/13 year as at 20 February 2015 32,829Movements on policy years prior to 2013/14 376
Surplus on all policy years 268,938
Managers’ notes1. Investment income earned by SMUAB and SMUA is credited to the same policy year as the financial year in which it arises.
Investment income earned by the Trust is only allocated to the policy year to the extent required to bring that year into overall balance.
2. The pure underwriting result excluding additional premium, being the balance of net earned premiums after deducting claims paid net of reinsurance recoveries, net claims outstanding, IBNR provision and brokerage is as follows:
2015/16 2014/15 2013/14US$m US$m US$m
42.3 99.6 64.9

Steamship Mutual Management Highlights 2016
57
Balance available for outstanding 2015/16 2014/15 2013/14 Closed years Totalclaims by Policy year US$000 US$000 US$000 US$000 US$000Gross claims outstandingOwn claims 243,894 102,778 67,655 354,168 768,495Pool claims 31,133 11,067 19,595 58,532 120,327Future claims administration expenses 11,410 3,097 994 3,705 19,206
Reinsurance recoveries outstandingGroup Excess Loss contract – – – (127,449) (127,449)Group Pool (77,954) (10,133) (1,421) (31,231) (120,739)Other (14,464) (970) (4,853) (26,531) (46,818)Net provision for claims outstanding 194,019 105,839 81,970 231,194 613,022
Free reservesSurplus on policy years 22,439 34,191 32,566 179,742 268,938Unallocated investment income – – – 171,383 171,383
22,439 34,191 32,566 351,125 440,321
Balance available for outstanding claims 216,458 140,030 114,536 582,319 1,053,343
Managers’ notes1. Combined projected net outstanding claims at 20 February 2016, amounting to US$613 million, includes IBNR provision
totalling US$238.5 million as follows:
2015/16 2014/15 2013/14 Closed years TotalUS$m US$m US$m US$m US$m
90.6 36.4 29.3 82.2 238.5
2. Combined free reserves at 20 February 2016, amounting to US$440.3 million, are stated net of a provision for future
expenses on outstanding claims amounting to US$19 million.

Steamship Mutual Management Highlights 2016
58
Development of policy years 2015/16 2014/15 2013/14 TotalOpen policy years US$000 US$000 US$000 US$000Gross premium 315,399 327,467 304,484 947,350Reinsurance premium (56,636) (60,064) (53,852) (170,552)
Net earned premium 258,763 267,403 250,632 776,798
Allocated investment return transferred from the non-technical account
(1,645)
(478)
(400)
(2,523)
Net incurred claimsClaims paid net of reinsurance recoveries 36,986 64,821 105,451 207,258Claims administration expenses 12,234 32,509 24,640 69,383Net claims outstanding 89,562 62,566 50,083 202,211IBNR provision 84,122 33,471 28,180 145,773Future claims administration expenses 10,852 2,895 960 14,707
233,756 196,262 209,314 639,332
Operating expensesBrokerage 19,278 20,925 20,870 61,073Acquisition and other expenses 18,408 20,455 18,341 57,204
37,686 41,380 39,211 118,277
Underwriting balance (14,324) 29,283 1,707 16,666
Allocated net investment income 27,769 (905) 19,828 46,692Surplus on open policy years 13,445 28,378 21,535 63,358
Closed policy yearsSurplus in respect of 2011/12 and prior years at 20 February 2015 138,185Balance on 2012/13 year as at 20 February 2015 27,977Movements on policy years prior to 2013/14 2,077
Surplus on all policy years 231,597
Managers’ notes1. Investment income earned by SMUAB and SMUA is credited to the same policy year as the financial year in which it arises.
Investment income earned by the Trust is only allocated to the policy year to the extent required to bring that year into overall balance.
2. The pure underwriting result, being the balance of net earned premiums after deducting claims paid net of reinsurance recoveries, net claims outstanding, IBNR provision and brokerage is as follows:
Combined Policy Year Statement P&I Class
2015/16 2014/15 2013/14US$m US$m US$m
28.8 85.6 46.0
25.4 25.3 23.03. Product of 10% supplementary call.

Steamship Mutual Management Highlights 2016
59
Balance available for outstanding 2015/16 2014/15 2013/14 Closed years Totalclaims by policy year US$000 US$000 US$000 US$000 US$000Gross claims outstandingOwn claims 233,998 95,310 64,811 341,055 735,174Pool claims 31,133 11,067 19,595 58,531 120,326Future claims administration expenses 10,852 2,895 960 3,529 18,236
Reinsurance recoveries outstandingGroup Excess Loss contract – – – (127,449) (127,449)Group Pool (77,954) (10,133) (1,421) (31,231) (120,739)Other (13,493) (207) (4,722) (24,240) (42,662)Net provision for claims outstanding 184,536 98,932 79,223 220,195 582,886
Free reservesSurplus on policy years 13,445 28,378 21,535 168,239 231,597Unallocated investment income – – – 171,383 171,383
13,445 28,378 21,535 339,622 402,980
Balance available for outstanding claims 197,981 127,310 100,758 559,817 985,866
Managers’ notes1. Combined projected net outstanding claims at 20 February 2016, amounting to US$582.9 million, includes IBNR provision
totalling US$222.6 million as follows:
2015/16 2014/15 2013/14 Closed years TotalUS$m US$m US$m US$m US$m
84.1 33.5 28.2 76.8 222.6

Steamship Mutual Management Highlights 2016
60
During the year the staff of the Managers’ London Representatives have attended training courses, or received the benefit of numerous talks and presentations on subjects of topical interest given by several of the Club’s service providers such as lawyers and experts. The Managers are grateful to the following organisations for their co-operation and assistance in passing on the benefit of their knowledge and experience:
4 Pump Court
7Safe
Bentleys Stokes and Lowless
Brookes Bell
Campbell Johnston Clark Ltd
Chartered Insurance Institute
Colin de la Rue – Shipping and the Environment Legal Consultant
Consult Marine Ltd
CWA International
Eversheds
Hill Dickinson LLP
Holman Fenwick Willan LLP
Ince & Co
Indian Maritime Association
Institute of Risk Management
International Group of P&I Clubs
Lawtel
Legge Farrow Kimmitt McGrath & Brown LLP
Lloyd’s Maritime Academy
London Shipping Law Centre
Marsh & McLennan
Mays Brown Solicitors
Staff Training
MBL Seminars
MFB Solicitors
Mills & Co
Moore Stephens LLP
Myton Law Ltd
Nielson Norman Group
Norton Rose Fulbright LLP
P&I Associates (Pty) Ltd
P&I Assurers
Pandiman Philippines Group
Reed Smith LLP
Syndicate Training
Tatham Macinnes LLP
Taylor Marine
Tisdale Law Offices LLC
Thomson Reuters
Wang Jing & Co
Waterson Hicks Solicitors
Weightmans LLP
Wikborg Rein

Steamship Mutual Management Highlights 2016
61
Glossary
Term/Abbreviation Explanation
BMA Bermuda Monetary Authority
churn effect Replacement of older higher rated tonnage with newer lower rated tonnage
CLC International Convention on Civil Liability for Oil Pollution Damage
EU European Union
F&FO Fixed and Floating Objects
GT Gross Tonnage
Hydra Hydra Insurance Company Limited
IBNR Incurred But Not Reported – a term used to describe a claim which may have occurred, but of which the Club is not yet aware, or is only partially aware and for which provision must be made when calculating the Club’s liabilities
IMO International Maritime Organisation
IOPC Fund International Convention on the Establishment of an International Fund for Compensation for Oil Pollution Damage (Fund Convention)
JCPOA Joint Comprehensive Plan of Action
MLC Maritime Labour Convention 2006
NOD Net of Deductible
OFAC US Office of Foreign Assets Control
ORSA Own Risk Solvency Assessment
P5+1 The P5+1 is a group of world powers who have been negotiating with Iran since 2006 with the goal of limiting Iran’s capacity to manufacture a nuclear weapon in exchange for relief from certain economic sanctions and the ability to pursue a civilian nuclear energy programme. The P5+1 is composed of the five permanent members (P5) of the UN Security Council (the United States, China, Russia, France and the United Kingdom) and Germany (+1).
P&I Protection and Indemnity
PEME Pre-Employment Medical Examination
S&P Standard & Poor’s
SIMSL Steamship Insurance Management Services Limited
SMPH Steamship Mutual Property Holdings Limited
SMUA Steamship Mutual Underwriting Association Limited
SMUAB The Steamship Mutual Underwriting Association (Bermuda) Limited
SMUARI The Steamship Mutual Underwriting Association (Reinsurance) Limited
SPIM Steamship P&I Management LLP
UK United Kingdom
UN United Nations
US United States (of America)

Steamship Insurance Management Services LimitedAquatical House39 Bell LaneLondonE1 7LU
Telephone:+44 (0)20 7247 5490 & +44 (0)20 7895 8490
For further information please see our websitewww.steamshipmutual.com
Visit itunes.apple.com to download the AppVisit play.google.com to download the Android App