Embed Size (px)
Citation preview

IOSR Journal of Business and Management (IOSR-JBM)
e-ISSN: 2278-487X, p-ISSN: 2319-7668. Volume 23, Issue 1. Ser. VI (January 2021), PP 52-64
www.iosrjournals.org
DOI: 10.9790/487X-2301045264 www.iosrjournals.org 52 | Page
Management Control Systems in Banking Sector of Nepal
Jitendra Prasad Upadhyay (Ph D) Associate Professor, Tribhuvan University
Abstract Purpose – The purpose of this study is to examine whether the mechanisms of MCS have been adequately
developed and applied in the Nepalese banking sectors or not.
Design/Methods/Approach – Descriptive and analytical research designs have been used for the study. Primary
data has been collected through the questionnaires using convenience and judgmental sampling from the Nepalese commercial banks. Questionnaires have been developed in five scales while mean, standard deviation,
coefficient of variation, correlation and factor analysis have been used as tools. Cronbach’s alpha test has been
done to test the reliability of the data.
Findings – All the commercial banks have adequately developed and applied the mechanisms of MCS.
Similarly, of them have considered the mechanisms of MCS to be equally important.
Research limitations and implications - Only eight mechanisms of MCS, i.e. TQM, TBM, ABC, BSC, BM, RE,
SVA and CIP have been used. There are other mechanisms of MCS also which other researchers can use in the
future.
Key words: Management Control Systems ---------------------------------------------------------------------------------------------------------------------------------------
Date of Submission: 06-01-2021 Date of Acceptance: 21-01-2021
---------------------------------------------------------------------------------------------------------------------------------------
I. Background A management control system (MCS) is a logical integration of techniques to gather and use
information to make planning and control decisions, to motivate employee behavior, and to evaluate
performance. It refers to the design, installation and operation of management planning and control systems.
MCS is the formal, information based, routine and procedure managers use to maintain or alter patterns in organizational activities (Simons, 1995). Conventionally, the term "Management Control Systems" refers to the
deployment of various techniques in hierarchical organizations in order to monitor and measure employee
performance against certain management targets. In this sense, conventional MCS that focuses on improving
operational effectiveness is no longer sufficient to create sustainable competitive advantages. MCS must be
expanded to managerial practices that cultivate employee cooperation and creativity in the discovery and
exploitation of new business opportunities (Cusumano, 1997). MCS embodies the techniques & mechanisms
which companies employ to pursue strategies to accomplish goals successfully. MCS integrates, motivates,
assists decision making, communicates objectives, provides feedback etc.
Management Controls fall into two general categories (Simon, 1995): the first category involves
output controls in which specific outcomes, e.g. division profit and budget variances are measured, monitored,
compared against expectations, and corrective action taken when appropriate. This category also includes administrative controls or action controls that involve formal rules, standard procedures and manuals, and
monitoring compliance there with. The second category includes behavior control, personnel control and social
control. This category involves such controls as shared values and norms, along with group interaction to
maintain them, selection and placement of personnel with desired skills and attitudes, work design and
allocation and observation of the work behavior of personnel.
A well designed MCS aids and coordinates the process of making decisions and motivates individuals
throughout the organization to act. It also facilitates forecasting revenue and cost-driver levels, budgeting,
measuring, and evaluating performance (Kaplan & Atkinson, 2005). Anthony (1997) explained four steps in the
MCS process in sequence as they are found in practice. They are programming, budgeting, execution and
evaluation. Similarly, Jawahar Lal (2003) described three steps of MCS they are strategy formulation,
management control and task control
Thus, MCS is the formal, information-based routine and procedure managers use to maintain or alter patterns in organizational activities. It facilitates the accomplishment of an organization’s strategic objectives. It
defines the decision space of individuals within an organization in order to affect their behavior (Simons, 1995).
It can be defined as a system that comprises a combination of control mechanisms designed and implemented by
management to increase the probability that organizational actors will behave in ways consistent with the
objectives set for the organization. It is a process for motivating and inspiring people to perform organizational

Management Control Systems in Banking Sector of Nepal
DOI: 10.9790/487X-2301045264 www.iosrjournals.org 53 | Page
activities that will help to achieve the organizational goals. It is also a process for detecting and correcting
unintentional performance errors and intentional irregularities, such as theft or misuse of resources.
Mechanisms of Management Control System
The different mechanisms of MCS are Total Quality Management, Time Based Management, Activity Based
Costing, Balance Score Card, Bench Marking, Re-engineering, Shareholder Value Analysis and Continuous
Improvement Process.
Total Quality Management is defined as a philosophy of management that is driven by continued
improvement and responding to customer needs and expectations. Different elements of TQM are “Customer
Satisfaction, Continuous Improvement, Standardized Product Quality, Employee Involvement and Decision
Making and Top Management Commitment”.
Time Based Management is the management philosophy which places the highest value to time as a scarce
resource. This philosophy enlightens managers to properly divide their time and optimally utilize & manage it.
Different elements of TBM are “Time Resource, Time Saving Pattern, Time Management Technique, Category Activities and Productivity Consciousness”.
The Activity-Based Costing is a costing system which focuses on activities performed to produce products.
ABC is that costing in which costs are first traced to activities and then to products. Different elements of ABC
are “Activity Costing, Major Activities, Cost to Cost Pool, Cost Activity and Cost Driver”.
The Balanced Scorecard translates an organization’s mission and strategy into a comprehensive set of
performance measures that provides the framework for a strategies measurement and management system.
Different elements of BSC are “Financial Perspective, Customer Perspective, Internal Business Process and
Learning and Growth”.
Re-Engineering refers to a radical redesign of all or part of a company’s work processes to improve
productivity and financial performance. Different elements of RE are “Degree of Re-design, Traditional
Approach, Organization Restructuring, Organization Effectiveness and Efficiency and Re-engineering
Incentives”. Bench Marking is the continuous process of measuring one’s own product, services and activities against the
best level of performance. These best levels of performance may be found either inside one’s own organization
or in other competing organizations or in organizations having similar processes. Different elements of BM are
“Performance Benchmarking, Improvement Effort, Management Commitment and Benchmarking Types”.
Shareholder Value Analysis calculates the value of a company by looking at the returns it gives to
shareholders, and is based on the view that the objective of company directors is to maximise the wealth of the
company's shareholders. Different elements of SVA are “Estimating Shareholder Value, Wealth & Profit and
Use of Shareholder Value.
Continuous Improvement Process is an ongoing effort to improve product, services or processes. These
efforts can seek “incremental” improvement over time or “breakthrough” improvement all at once. Different
elements of CIP are “Implementing Continuous Improvement, Involvement of Employee, Customer Satisfaction and Organization Quality and Performance.
Commercial Banks in Nepal A bank can be defined as the financial intermediary between depositors and entrepreneurs. The
intermediation takes place when banks accept deposit from general public, corporate bodies and private
organizations and deploy that deposit for profitable purposes in the forms of loans and advances. A bank is also
a financial service institution that generates its earnings primarily by means of intermediations. A bank or
banker is a dealer in debts of his own and others (Shekhar & Shekhar, 2000).
According, to Nepal Commercial Bank Act 2031 B.S. “A commercial bank refers to such type of bank
which deals in money exchange, accepting deposits and advancing loans and other commercial transactions
other than some special functions performed by specified bank such as co-operative, agriculture and industrial
bank.” At present, there are 27 commercial banks in Nepal.
Purposes of the Study
The main purposes of the study are:
To examine whether the mechanisms of MCS have been adequately developed and applied in the Nepalese
banking sector or not
To analyze whether all the elements of MCS mechanisms have been considered to be equally important by all
the selected banks or not
To analyze whether all the commercial banks have adopted mechanisms of MCS in equal degree or not
Management Control Systems in Banking Sector of Nepal
DOI: 10.9790/487X-2301045264 www.iosrjournals.org 54 | Page
Research Questions
Following research questions have been formulated for the study:
Have the mechanisms of MCS been adequately developed and applied in the Nepalese commercial banks? Have all the elements of MCS mechanisms equally been considered important for all the selected banks?
Whether or not all the commercial banks have adopted mechanisms of MCS in equal degree?
Rationales of the Study The rationales of the present study are:
a. The study will be a revelation to the management of the concerned banks regarding how far their banks have
been able to utilize the modern concept of MCS.
b. Not only the concerned, but other organizations in different industries can also apply MCS approaches for
betterment of their organization.
c. The present research will be important for future researchers by providing insights about how to carry out
research on different organizations using the MCS with suitable methodology.
Limitations of the Study
The study has been exposed to the following limitations:
Out of total twenty-seven commercial banks in Nepal only six commercial banks have been considered.
Only eight mechanisms of MCS have been tested, i.e. TQM, TBM, BSC, ABC, BM, RE, CIP AND SVA.
Interviews with top, middle level and lower level employees have been taken.
Methodology Used
This study has followed both descriptive and analytical approach of research. A questionnaire survey
has been conducted for getting the answer of research questions. Both primary and secondary data have been
analyzed using the analytical statistical tools; the means and the standard deviation, coefficient of variance,
correlation and factors have been calculated for analyzing the responses. There are a total of twenty-seven commercial banks in Nepal, which constitute the population of the
study. For this study, only four commercial banks, i.e. Rastriya Banijya Bank Limited, Nepal Bank Limited,
Standard Chartered Bank, and Nabil Bank Limited have been selected as sample banks. Selection of sample
banks was based on convenience and judgmental basis.
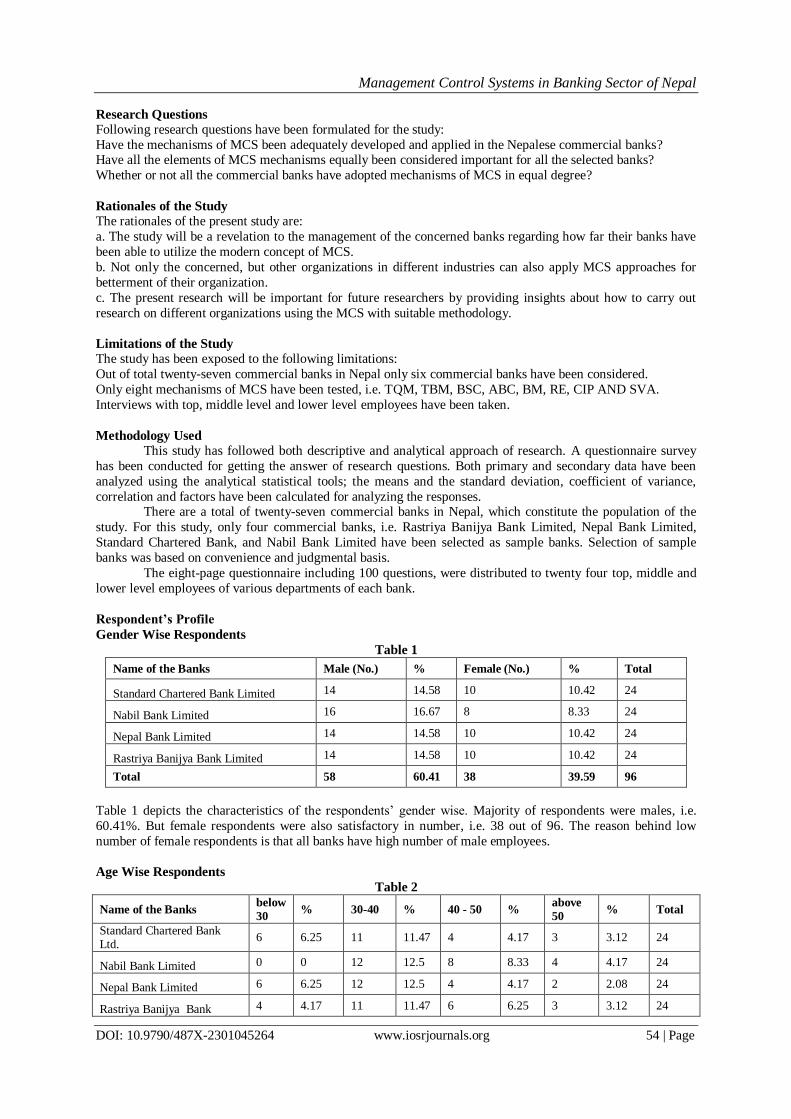
The eight-page questionnaire including 100 questions, were distributed to twenty four top, middle and
lower level employees of various departments of each bank.
Respondent’s Profile
Gender Wise Respondents
Table 1
Name of the Banks Male (No.) % Female (No.) % Total
Standard Chartered Bank Limited 14 14.58 10 10.42 24
Nabil Bank Limited 16 16.67 8 8.33 24
Nepal Bank Limited 14 14.58 10 10.42 24
Rastriya Banijya Bank Limited 14 14.58 10 10.42 24
Total 58 60.41 38 39.59 96
Table 1 depicts the characteristics of the respondents’ gender wise. Majority of respondents were males, i.e.
60.41%. But female respondents were also satisfactory in number, i.e. 38 out of 96. The reason behind low
number of female respondents is that all banks have high number of male employees.
Age Wise Respondents
Table 2
Name of the Banks below
30 % 30-40 % 40 - 50 %
above
50 % Total
Standard Chartered Bank Ltd.
6 6.25 11 11.47 4 4.17 3 3.12 24
Nabil Bank Limited 0 0 12 12.5 8 8.33 4 4.17 24
Nepal Bank Limited 6 6.25 12 12.5 4 4.17 2 2.08 24
Rastriya Banijya Bank 4 4.17 11 11.47 6 6.25 3 3.12 24

Management Control Systems in Banking Sector of Nepal
DOI: 10.9790/487X-2301045264 www.iosrjournals.org 55 | Page
Limited
Total 16 16.67 46 46.94 22 22.92 12 12.39 96
Table 2 presents the characteristics of respondents’ age wise. Majority of respondents were found to be
between 30 to 40 years group, i.e. 46.94%. Very few respondents fall in the category of above 50 years group,
i.e. 12.39%. Respondents in category 40 to 50 years group were higher than below 30 years, i.e. 22.92% is
greater than 16.67%.
Reliability Test of Variables (mechanisms)
Table 3
S.N. Code Variables Reliability %
1 TQM Total Quality Management 79.6
2 TBM Time Based Management 76.8
3 BSC Balance Score Card 92
4 ABC Activity Based Costing 85
5 BM Benchmarking 90,7
6 RE Re-Engineering 85.4
7 SVA Shareholder Value Analysis 90.3
8 CIP Continuous Improvement Process 89.5
Overall Reliability 91
Cronbach’s Alpha test has been done to test the reliability of data. Each and every variable has been tested and it was found that every variable reliability test was above 67%. Maximum 92% reliability has been
seen in variable CIP and 76.8% minimum reliability has been seen in TBM. In other cases, all the variables
reliability has been above 79%. This clearly indicates that Cronbach’s Alpha test was accepted.
Method of Analysis
Five points Likert scale ranging from the best/most acceptable (rating scale of 5) to the worst/most
unacceptable (rating scale of 1) has been extensively used to analyze and interpret the subjective answer of the
respondents. It was done on the basis of average i.e. value of MCS 3 indicates that banks have applied these
approaches moderately. If the value is more than 3 it is either good or best. Similarly, if the value is less than 3 it
is either bad or worst.
Application of MCSs in Nepalese Commercial Banks
Analysis of Total Quality Management
Table 4
S.N. Name of the Banks CS CI SPQ EIDM TMC Total Mean S.D. C.V.
1 Standard Chartered Bank Ltd.
3.38 3.44 3.31 3.88 4.25 18.26 3.65 0.4 10.95
2 Nabil Bank Limited 3.08 3.25 3.08 3.22 3.39 16.02 3.20 0.13 4.06
3 Nepal Bank Limited 2.82 2.95 2.75 2.85 2.95 14.32 2.86 0.90 3.02
4 Rastriya Banijya Bank Limited
3.10 3.14 3.25 3.27 3.33 16.09 3.22 0.10 2.96
CS (Customer Satisfaction) consists of customer satisfaction related variables like consideration of customers’ wants & expectation, addressing to their complaints & feedback.
In all the banks, except NBL, the value has been above average, i.e. 3. In case of SCB highest value has been
found, i.e. 3.38 and in case of NBL, it has been the lowest, i.e. 2.82 compared to others. This indicates that
SCB’s and RBBL’s performance in terms of customers’ satisfaction seems to be the best.
CI (Continuous Improvement) involves organizational efforts towards gradual but continuous improvement,
i.e. improvement of polices implementation and policies technology etc.
The value of ‘CI’ has been above average, i.e. 3 in all the banks. Highest value has been observed in case of
SCB, i.e. 3.44. This shows that SCB’s has good organizational efforts towards gradual but continuous
improvement on policies, implementation, polices technology etc.

Management Control Systems in Banking Sector of Nepal
DOI: 10.9790/487X-2301045264 www.iosrjournals.org 56 | Page
SPQ (Standardized Product Quality) inquires into organization’s effort to maintain the standardized product
quality consistently, i.e. job rotation.
In all the banks, the value of ‘SPQ’ has been above average, i.e. 3. Highest value has been found in case of SCB, i.e. 3.31. This shows that SCB has been best at its organizational efforts to maintain the SPQ consistently.
EIDM (Employee Involvement and Decision Making) entails how far employees are encouraged to
participate in decision- making and problem solving. This includes individual or group creativity.
Only in SCB and Nabil the value of ‘EIDM’ have been above average but in case of other banks it has been
below average. In case of NBL it was only 2.85. Highest value has been observed in case of SCB, i.e. 3.88. This
shows that SCB has given more opportunity to its employees to participate in decision-making and problem
solving.
TMC (Top Management Commitment) has been the most important part of the TQM, since without the
commitment of top-level management, TQM is merely a dream.
In all the banks, the value of ‘TMC’ has been above average, i.e. 3 except in case NBL which was below
average i.e. 2.95. In this context, SCB excels all the banks, i.e. 4.25. This shows that SCB has the highest degree of TMC.
From the Table 4, it has been clear that the mean TQM in all the banks has been above average, i.e. 3 except in
case of NBL, which were only 2.86. This clearly indicates that all the banks have been found adhering to the
principle of TQM. Highest value has been observed in case of SCB, i.e. 3.65. This means SCB was the best in
practicing TQM principles.
In all the cases, the value of standard deviation has been below 1 and coefficient of variation has been 2.96% to
10.95%, which indicates that the average was more representative across the banks and across the different
components of TQM.
Analysis of Time Based Management
Table 5
S.N. Name of the Banks TR TS TMT CA1 PC Total Mean S. D. C.V
1 Standard Chartered Bank Ltd.
5.00 4.50 4.00 4.25 4.13 21.88 4.38 0.39 8.91
2 Nabil Bank Limited 3.83 3.42 3.75 4.33 3.89 19.22 3.84 0.33 8.58
3 Nepal Bank Limited 3.45 3.55 3.88 3.72 3.45 18.05 3.61 0.19 5.18
4 Rastriya Banijya Bank Limited
3.55 3.95 3.85 3.62 3.55 18.52 3.70 0.18 4.98
TR (Time Resource) analyzes whether time has been accepted as the most important resource in the
organization or not.
In all the banks, the value has been above average, i.e. 3. In case of SCB, it has been (i.e. 5.00) the highest and
in case of NBL, it has been the lowest, i.e. 3.45. This indicates that in SCB was more committed in accepting
time as the most important resource in the organization.
TS (Time Saving Pattern) is concerned with an attempt that has been made to explore the time saving pattern
in the banks. The value has been above average, i.e. 3 in all the banks. In Nabil, it was the lowest 3.42. This shows that NBL
has relatively worst time saving pattern of all.
TMT (Time Management Technique) has been made to explore the different techniques used by the
employees to manage time. In fact, this examines the validity of the time utilization.
In all the banks, the value of ‘TMT’ has been above average, i.e. 3. In case of SCB, it has been the highest, i.e. 4
and in case of Nabil, it has been the lowest, i.e. 3.75. This shows that employees of all the banks have used
different techniques for managing time effectively.
CA1 (Category Activities) includes the activities prioritized by the employees. This provides a glimpse of how
activities are dealt with by the employees.
All the banks have recorded the value above average, i.e. 3. Nabil has scored the highest, i.e. 4.33 compare to
others. This shows that in terms of ‘CA1’, employees of all the banks have given high priority to the different activities.
PC (Productivity Consciousness) explains the degree of consciousness and commitment of employees over
productivity.
In all the banks, the value of ‘PC’ has been above average, i.e. 3. Highest value has been observed in
case of SCB, i.e. 4.13 and the lowest value has been observed in case of NBL, i.e. 3.45. Comparatively, SCB’s
employees have high degree of consciousness & commitment over productivity.
From the Table 5, it is observed that mean TBM in all the banks has been above average, i.e. 3. This
indicates that all the banks used the principles of TBM. In case of SCB, the value has been 4.38 and in case of

Management Control Systems in Banking Sector of Nepal
DOI: 10.9790/487X-2301045264 www.iosrjournals.org 57 | Page
NBL it has been 3.61, the highest and the lowest respectively. In other words, all the sample banks’ TBM
performance has been satisfactory and equal.
In all the banks, the value of standard deviation has been below 1 and coefficient of variation has been 4.98% to 8.91%, which indicates that the average has been more representative across the banks and across
different components of TBM and hence mean was trustworthy.
Analysis of Balance Scorecard
Table 6
S.N. Name of the Banks FP CP IBP LG Total Mean S.D. C.V
1 Standard Chartered Bank Ltd.
4.38 3.88 4.13 3.71 16.10 4.03 0.29 7.20
2 Nabil Bank Limited 4.25 3.83 3.42 3.11 14.61 3.65 0.5 13.69
3 Nepal Bank Limited 2.23 2.43 2.75 2.92 10.33 2.58 0.31 12.03
4 Rastriya Banijya Bank Limited
3.15 3.17 3.37 3.86 13.65 3.41 0.31 9.13
FP (Financial Perspective) analyzes the role played by the banks to increase shareholders’ wealth.
In all the banks, the value has been above average, i.e. 3 except in NBL. In case of SCB it was the highest, i.e.
4.38 and in case of NBL it was lowest, i.e. 2.23. This indicates that all the banks have been more concerned
about shareholders’ interest.
CP (Customer Perspective) is concerned with an attempt that has been made to increase market shares and
clientele satisfaction.
The value of ‘CP’ in all the banks has been above average, i.e. 3 except in NBL. In case of NBL has been 2.43,
whereas in Nabil and SCB it has been 3.83 and 3.88 respectively. This shows that all the banks have been
concerned about market shares and customer satisfaction.
IBP (Internal Business Process) is concerned with the activities reducing unnecessary cost in the banks.
This value has been higher than the average in all the banks except in NBL, which is 2.75. Individually SCB outperforms all by scoring 4.13. In case of Nabil it has been 3.42. This shows that all the banks have made
efforts to reduce unnecessary expenditure.
LG (Learning and Growth) has been made to explore the different techniques used by the banks to increase
the skill of the employees, hiring new employees and minimizing employee turnover.
Only in the two banks, i.e. RBBL and SCB, the value of ‘LG’ has been above average, i.e. 3. In case of RBBL,
it has been the highest, i.e. 3.86. However, in other banks it has been below average. In case of NBL, it was the
lowest, i.e. 2.92. This shows that management of all the banks has used different techniques for the employee
development.
From the Table 6, it is observed that mean BSC in all the banks has been above average, i.e. 3 except in case of
NBL, which has been 2.58. This indicates that all the banks used the principle of BSC. In case of SCB, the value
has been 4.03. In terms of BSC, all the banks have performed satisfactorily. In all the cases, the value of standard deviation has been below 1 and coefficient of variation has been 7.2% to
13.69%; this indicates that the mean of different banks has been representative and trustworthy.
Analysis of Activity Based Costing
Table 7
S.N. Name of the Banks AC MA CCP CA CD Total Mean S.D. C.V
1 Standard Chartered Bank Ltd. 4.06 4.13 4.13 4.13 4.50 20.95 4.19 0.18 4.30
2 Nabil Bank Limited 3.33 3.50 4.17 4.17 4.00 19.17 3.83 0.39 10.17
3 Nepal Bank Limited 2.14 2.25 2.63 2.80 2.87 12.69 2.54 0.33 12.90
4 Rastriya Banijya Bank
Limited 3.16 3.65 3.74 3.45 3.27 17.27 3.45 0.25 7.10
AC (Activity Costing) consists of understanding the knowledge and significance of activity based costing
principle in the banks.
In all the banks, the value has been near the average, i.e. 3 except in NBL. In case of SCB, it has been the
highest, i.e. 4.06 and in case of NBL, it has been the lowest, i.e. 2.14. This indicates that all the banks have been
aware of the concepts and use of activity based costing system.
MA (Major Activities) contains organizational efforts in identifying major activities that take place in the
banks.

Management Control Systems in Banking Sector of Nepal
DOI: 10.9790/487X-2301045264 www.iosrjournals.org 58 | Page
The value of ‘MA’ in all the banks has been above average, i.e. 3 except in NBL. Highest value (i.e. 4.13) has
been observed in case of SCB and the lowest value (i.e. 2.25) has been observed in case of NBL. This shows
that SCB has good organizational efforts to identify the major activities that take place in the banks. CCP (Cost to Cost Pool) inquires into organization’s effort to assign cost to cost pool, i.e. a group of individual
costs that is allocated to cost objectives.
In all the banks, the value of ‘CCP’ has been near the average, i.e. 3 but in case of NBL it has been below
average, i.e. 2.63. Highest value has been found in case of Nabil, i.e. 4.17. This shows that Nabil has been the
best at its organizational efforts to assign cost to cost pool but NBL’s performance in this regard is not
satisfactory.
CA (Cost Activity) entails how far organizations accumulate overhead cost for each activity and assign the cost
of activities to the product or services.
The value of ‘CA’ in all the banks has been above average except in case of NBL, which has been below
average. Lowest value has been observed in case NBL, i.e. 2.80. In Nabil and SCB it has been 4.17 and 4.13
respectively. This shows that the performance of all the banks in terms of cost activity has been satisfactory except that of NBL.
CD (Cost Driver) involves the activities that determine the cost for each major activity.
In all the banks, the value of ‘CD’ has been above average, i.e. 3 except in NBL, which is 2.87. In case of SCB
and Nabil it has been 4.5 and 4.00 each. This shows that all banks have not effectively determined the cost for
major activities.
From the Table 7, it is clear that mean ABC in all the banks has been near the average, i.e. 3. In case of SCB, it
has been the highest, i.e. 4.19. This indicates that the performance of all the banks in terms of ABC has been
somewhat satisfactory and somewhat unsatisfactory. SCB and Nabil have scored above the average; similarly,
NBL have scored slightly below the average. In all the cases, the value of standard deviation has been below 1
and coefficient of variation has been 4.3% to 12.9% which indicates that the average has been more
representative across the banks as well as across the different components of ABC.
Analysis of Benchmarking
Table 8
S.N. Name of the Banks PB IE MC BT Total Mean S.D. C.V
1 Standard Chartered Bank Ltd. 4.38 4.44 4.25 4.38 17.45 4.36 0.08 1.83
2 Nabil Bank Limited 4.51 4.18 4.18 3.84 16.71 4.18 0.27 6.46
3 Nepal Bank Limited 2.97 2.55 2.85 2.67 11.04 2.76 0.19 6.67
4 Rastriya Banijya Bank Limited 3.55 3.65 3.37 3.45 14.02 3.51 0.12 3.47
PB (Performance Benchmarking) analyzes the role of the banks in increasing their performance.
In all the banks, the value has been above average, i.e. 3. In case of Nabil it was the highest, i.e.4.51 and in case
of NBL it was the lowest, i.e. 2.97. This indicates that Nabil has been more concerned about the performance of
the bank. IE (Improvement Effort) is concerned with steps taken by the banks to increase their performance.
The value of ‘IE’ in all the banks has been above average, i.e. 3 except in NBL, which was 2.55. It was the
highest in case of SCB, i.e. 4.44. This shows that all the banks have recorded satisfactory performance in terms
of ‘IE’.
MC (Management Commitment) is concerned with the commitment of management in implementing
benchmarking approaches.
Performance of all the banks in terms of ‘MC’ has been satisfactory because all of them have scored 3 or above
except in case of NBL. However, Management of SCB and Nabil seem most committed in implementing
benchmarking approaches of all, which has been warranted by its highest scored 4.25 and 4.18. In other words,
the management of all the banks has been committed to implement the approaches of benchmarking.
BT (Benchmarking Types) has been made to explore the different types of benchmarking used by the banks to increase the performance of the banks.
In all the banks, the value of ‘BT’ has been above average, i.e. 3 but NBL has been below average, i.e. 2.67. In
case of SCB, it has been the highest, i.e. 4.38. This shows that management of all the banks has used different
types of benchmarking to increase the performance of the banks.
From the table 8, it has been cleared that mean BM in all the banks has been above average, i.e. 3 except in case
of NBL, (i.e. 2.76, which was near about 3). This clearly indicates that all the banks have been found adhering
to the principle of BM. Highest value has been observed in case of SCB, i.e. 4.36. In case of Nabil and RBBL
the value has been 4.18 and 3.51 respectively.

Management Control Systems in Banking Sector of Nepal
DOI: 10.9790/487X-2301045264 www.iosrjournals.org 59 | Page
To sum up, performance of all the banks in terms of benchmarking has been satisfactory. Since
standard deviation in all the cases is below 1 and coefficient of variation has been between 1.83% and 6.67%.
This clearly indicates that the mean can be safely accepted as representative.
Analysis of Re-engineering
Table 9
S.N. Name of the Banks DR TA OR OEE RI Total Mean S.D. C.V
1 Standard Chartered Bank Ltd. 4.50 3.88 4.13 4.13 4.13 20.77 4.15 0.22 5.30
2 Nabil Bank Limited 3.67 3.17 3.34 3.51 3.51 17.20 3.44 0.19 5.52
3 Nepal Bank Limited 2.83 2.65 2.75 2.80 2.88 13.95 2.78 0.09 3.15
4 Rastriya Banijya Bank Limited 3.25 3.18 3.27 3.27 3.35 16.32 3.26 0.06 1.86
DR (Degree of Re-design) consists of radical redesign in the banks to improve productivity and performance.
In all the banks, the value has been above average except in NBL i.e. 2.83, which was near about 3. In case of
SCB, it has been the highest, i.e. 4.5. This indicates that all the banks have made efforts to redesign their organizations to improve productivity and performance.
TA (Traditional Approach) explains the extent to which traditional approaches are questioned in the banks.
The value of ‘TA’ in all the banks has been equal to or above average, i.e. 3. Highest value has been observed in
case of SCB, i.e. 3.88 and the value of NBL has been 2.65 each. This shows that in all the banks, traditional
approaches were questioned.
OR (Organization Restructuring) entails how far organization structure was redesigned into the organization.
Except in case of SCB and Nabil all the banks have not performed satisfactorily in terms of OR. Highest value
has been found in case of SCB and Nabil, i.e. 4.13 and 3.34 respectively indicating good performance of SCB
and Nabil in organizational redesign.
OEE (Organization Effectiveness and Efficiency) explains how far banks are able to take and implement right
decisions in most cost effective manner. In all the banks, the value of ‘OEE’ has been above average except in case of NBL i.e. 2.8 (which was
considered near about average). Highest value has been observed in case of SCB, i.e. 4.13. In RBBL and Nabil
it has been 3.27 and 3.51 respectively. This shows that SCB has been more efficient and effective over the years.
RI (Re-engineering Incentives) involves the incentives to re-engineering activities.
The value of ‘RI’ in all the banks has been near to or above average, i.e. 3. In case of NBL, it was near to
average, i.e. 2.88. In case of SCB and RBBL, it has been 4.13 and 3.35 respectively. This showed that all banks
have provided incentives to re-engineering to their employees but SCB leads all of them.
From the Table 9, it has been cleared that mean RE in all the banks have been equal to or above average, i.e. 3
except NBL, which has value of 2.78(near to average). This clearly indicates that all the banks have been found
adhering to the principles of RE.
In all the cases the value of standard deviation has been below 1 and coefficient of variation has been between
1.86% to 5.52%, which indicates that the average has been more representative across the banks as well as across the different components of RE.
Analysis of Shareholder Value Analysis
Table 10
S.N. Name of the Banks ES WP US Total Mean S. D. C.V
1 Standard Chartered Bank Ltd. 4.25 4.44 3.58 12.27 4.09 0.45 11.00
2 Nabil Bank Limited 3.76 4.60 3.61 11.97 3.99 0.53 13.28
3 Nepal Bank Limited 2.98 2.76 2.65 8.39 2.80 0.17 6.01
4 Rastriya Banijya Bank Limited 3.95 3.86 3.55 11.36 3.79 0.21 5.54
ES (Estimating Shareholder Value) consists of estimating shareholder value of the banks.
In all the banks, the value has been above average except in NBL, i.e. 2.98 that was near about 3. In case of SCB, it has been the highest, i.e. 4.25. Similarly, RBBL and Nabil have 3.95 and 3.76 respectively. This
indicates that all the banks have made efforts to estimate shareholder value.
WP (Wealth and Profit) explains the extent to which banks have set the target of profit and emphasize the
objectives of maximizing the wealth of the bank’s shareholders.

Management Control Systems in Banking Sector of Nepal
DOI: 10.9790/487X-2301045264 www.iosrjournals.org 60 | Page
The value of ‘WP’ in all the banks has been near to or above average, i.e. 3. Highest value has been observed in
case of Nabil and SCB, i.e. 4.6 and 4.44 respectively. Similarly, the lowest value has been observed in NBL, i.e.
2.76. This shows that all the banks have set the target of profit and tried to maximize the wealth of the bank’s shareholders.
US (Use of Shareholder Value) entails how frequently banks have been applied and used shareholder value for
taking long-term financial decision and evaluate the performance of the banks.
Except in case of NBL all the banks have performed satisfactorily in terms of ‘US’. Highest value has been
found in case of SCB and Nabil, i.e. 3.58 and 3.61 respectively indicating good performance in using
shareholder value.
From the Table 10, it has been cleared that mean SVA in all the banks have been equal to or above average, i.e.
3 except NBL, which has value of 2.8(near to average). This clearly indicates that all the banks have applied and
used shareholder value for taking decision and evaluating the performance.
In all the cases, the value of standard deviation has been below 1 and coefficient of variation has been 5.54% to
11%, which indicates that the average has been more representative across the banks as well as across the different components of SVA.
Analysis of Continuous Improvement Process
Table 11
S.N. Name of the Banks IC IE1 CS OQP Total Mean S.D. C.V
1 Standard Chartered Bank Ltd. 4.81 4.25 4.38 4.50 17.94 4.49 0.24 5.35
2 Nabil Bank Limited 4.08 3.34 3.17 3.67 14.26 3.57 0.4 11.22
3 Nepal Bank Limited 2.45 2.65 2.55 2.67 10.32 2.58 0.10 3.93
4 Rastriya Banijya Bank Limited 3.25 3.37 3.65 3.72 13.99 3.50 0.22 6.40
IC (Implementing Continuous Improvement) is detailed procedure and effort to improve the services and to
implement the approved policy.
In all the banks, the value has been above average except in NBL, i.e. 2.45, which was near about 3. In case of
SCB, it has been the highest, i.e. 4.81. This indicates that all the banks have made efforts to improve the services
and to implement the approved policy
IE1 (Involvement of Employee) explains the involvement of employees in making planning and decision-
making. The value of ‘IE1’ in all the banks has been equal to or above average, i.e. 3 except in NBL, which was 2.65.
Highest value has been observed in case of SCB, i.e. 4.25 and the value of RBBL was 3.0. This shows that in all
the banks, except in NBL employees have been involved in planning and decision-making procedure
effectively.
CS (Customer Satisfaction) entails how far banks focus on improving customer satisfaction through CIP.
Except in case of NBL, all the banks have performed satisfactorily in terms of CS. Highest value has been found
in case of SCB and Nabil, i.e. 4.38 and 3.17 respectively indicating good performance of SCB and Nabil in
improving customer satisfaction.
OQP (Organization Quality and Performance) explains how far banks are able to identify the area of
opportunity and problem and focus their quality and performance.
In all the banks, the value of ‘OQP’ has been above average except in case of NBL, i.e. 2.67, which were considered near about average. Highest value has been observed in case of SCB, i.e. 4.5. In RBBL and Nabil it
has been 3.72 and 3.67 respectively. This shows that SCB has been more able to identify the area of opportunity
and focus its quality and performance.
From the Table 11, it has been cleared that mean CIP in all the banks have equal to or above average, i.e. 3
except NBL i.e. 2.58(near to average). This clearly indicates that all the banks have been found adhering to the
principles of CIP.
In all the cases, the value of standard deviation has been below 1 and coefficient of variation has been 5.35% to
11.22%, which indicated that the average has been more representative across the banks as well as across the
different components of CIP.

Management Control Systems in Banking Sector of Nepal
DOI: 10.9790/487X-2301045264 www.iosrjournals.org 61 | Page
Management Control Systems in Nepalese Commercial Banks
Table 12
S.N. Name of the
Banks TQM TBM BSC ABC BM RE SVA CIP Total Mean S.D. C.V
1
Standard
Chartered
Bank Ltd.
3.65 4.38 4.03 4.19 4.36 4.15 4.09 4.49 33.33 4.17 0.26 6.24
2 Nabil Bank
Limited 3.20 3.84 3.65 3.83 4.18 3.44 3.99 3.57 29.71 3.71 0.31 8.35
3 Nepal Bank
Limited 2.86 3.61 2.58 2.54 2.76 2.78 2.80 2.58 22.51 2.81 0.34 12.10
4
Rastriya
Banijya Bank
Limited
3.22 3.70 3.41 3.45 3.51 3.26 3.79 3.50 27.84 3.84 0.19 5.46
In all the banks, the value of TQM has been above average, i.e. 3 except in case of NBL it was only
2.86 respectively. SCB leads all the banks in following TQM principles as indicated by its highest score, i.e.
3.65. To sum up, all the banks seem to have used the TQM approach in their organization.
The value of TBM in all the banks has been above average, i.e. 3. In case of SCB, Nabil, and RBBL the
scores are 4.38, 3.84 and 3.61 respectively. This shows that all the banks have applied the principles of TBM effectively.
Similarly, the value of BSC has been above average, i.e. 3 in all the banks except in case of NBL,
which was 2.58. It has ranged between 2.58 (of NBL) to 4.03 (of SCB). This shows that all the banks have
followed the principles of BSC effectively.
In all the banks, the value of ABC has been near to average, i.e. 3.In case of SCB, it was the highest,
i.e. 4.19 and in case of NBL, it was the lowest, i.e. 2.54. This is situation of dilemma since some banks have
scored above 3 and some have scored below 3 (slightly below). This shows that management of some banks has
effectively implemented the approach of ABC.
The value of BM in all the banks has been above average, i.e. 3 except in case of NBL, which was only
2.76. In case of SCB it has been the highest i.e. 4.36. This indicates that all the banks have used the approach of
BM in their organizations.
The value of RE has been above average, i.e. 3 in all the banks except in case of NBL, i.e. 2.78. In case of Nabil and RBBL, it was 3.44 and 3.26 respectively. In SCB, it was 4.15. This shows that all the banks seem
to have followed the principle of RE effectively.
In all the banks, the value of SVA has been above average, i.e. 3 except in case of NBL, which was
only 2.8. SCB leads all the banks in following SVA principles as indicated by its highest score, i.e. 4.09. To sum
up, all the banks seem to have used the SVA approach in their organization.
Similarly, in all the banks, the value of CIP has been above average, i.e. 3 except in case of NBL. In
case of SCB and Nabil, the scores were 4.49 and 3.57 respectively. This shows that all the banks have applied
the principles of CIP effectively.
From the Table 12, it has been observed that different mechanisms of MCSs have been followed by all
the sample banks (the values are above average, i.e. 3 except in case of NBL). However, SCB leads the other
banks in this regard. In all the cases, the value of standard deviation has been below 1 and coefficient of variation has been
5.46% to 12.1%. This clearly indicates the representative nature of the mean calculated. In other words, mean is
dependable.
Correlation Matrix of Management Control System
Table 13
R TQM TBM BSC ABC BM RE SVA CIP
TQM 1
TBM 0.915** 1
BSC 0.828* 0.822* 1
ABC 0.948** 0.787 0.942** 1
BM 0.902* 0.857* 0.932** 0.932** 1
RE 0.980** 0.961** 0.864* 0.913* 0.914* 1
SVA 0.888* 0.787 0.903* 0.924** 0.951** 0.867* 1

Management Control Systems in Banking Sector of Nepal
DOI: 10.9790/487X-2301045264 www.iosrjournals.org 62 | Page
CIP 0.987** 0.933* 0.912* 0.941** 0.941* 0.975** 0.875* 1
** Correlation is significant at the 0.01 level (2-tailed).
* Correlation is significant at the 0.05 level (2-tailed).
In the Table 13, the positive correlations have been found between all the mechanisms. Correlation of
all mechanisms has been found significant at .01 and .05 level except between ABC & TBM and SVA & TBM.
All the mechanisms have been found positively significant with TQM, BSC, BM, RE and CIP. From the above
data, it can be inferred that those banks that have been extensively following principles of TQM have also been
practicing BSC, BM & RE and vice versa. This fact is much dependable which is warranted by the very low
level of significance.
Factor Analysis of Management Control System
Table 14
Factor 1
TQM 0.97
TBM 0.93
BSC 0.95
ABC 0.96
BM 0.97
RE 0.98
SVA 0.94
CIP 0.97
Total 91.25%
Principal components analysis seeks to determine the number and characteristics of the factors or
“variable groups” that affect tools of MCS decisions among the survey respondents. Only one factor was
identified with eigen value 0.5 that explains 91.25% of the variation in the responses. This indicates that the
responses are concerned with the all the mechanisms of MCS in the bank.
II. Findings a. All the commercial banks have adequately developed and applied the mechanisms of MCS.
b. All the commercial banks have considered the mechanisms of MCS to be equally important.
c. All of the commercial banks seem to have used the mechanisms of MCS adequately.
III. Discussion Organizational transformation is situated between design and mobilization of management control
systems.
All managers, either of profit or non-profit making organizations, use control system of one form or
another. As the organization grows in size and complexity, the control system also tends to change from simple
to sophisticated (Rotch, 1993). Even the managers of NPOs have been found to have widely used MCS to
improve their organizational effectiveness. MCS is a necessary tool for leading an organization efficiently
towards its goals (Baraldi, 1998). Noy (1999) used a new approach i.e. cost/benefit aspect of MCS that helps managers decide which control system is suitable to an organization for improving its performance. The study
further concludes that every business enterprise must have some sort of control system i.e. formal or informal
that can always be improved. Similarly, Kimura, (2000) concluded that MCS should not be limited to
operational level but should be expanded to strategic level. Porporato, (2006) concluded that high performers
use MCSs more intensively to overcome the uncertainty faced by the joint venture organization.
The present study differs from the Rotch, Baraldi, Noy’s, Cam Tu’s, Kimura and Porporato study
mainly on the grounds that it has not used cost and benefit analysis, strategic change and operational level as
such but has used several ingredients of MCS to measure and improve organizational performance.
The present research has analyzed profit making organizations in the Nepalese context. In other words,
the present study has examined the nature & magnitude of application of mechanisms of MCS in Commercial
Banks in Nepal. Wingren and et al. (2003) analyzed the state of art of MCS in 110 Finnish technology firms. They
advocated in favor of analyzing MCS in combination (i.e. TQM, TBM, ABC, BSC, BM, RE, PM, MPR, CIP,

Management Control Systems in Banking Sector of Nepal
DOI: 10.9790/487X-2301045264 www.iosrjournals.org 63 | Page
VCA, SVA, EVA and TOC) rather than single MCS. For this purpose, factor analysis and rank correlation were
used. It was concluded that it would be better to use the following four basic types of combinations, i.e. (i)
VCA, SVA and EVA (ii) CIP, BSC and BM (iii) PM and MPR (iv) ABM, RE, TOC and TBM. The present research has analyzed MCS in combination but all the samples are Nepalese banks.
Regarding variables, only eight variables (i.e. TQM, TBM, ABC, BSC, BM, RE, SVA and CIP) have been
analyzed using factor analysis in the present study due to the matter of relevancy of the present subject matter.
It is found that all the commercial banks have adequately developed and applied the mechanisms of MCS.
IV. Conclusion The paper deduces that all the organizations, either of profit or non-profit making, use some kind of
MCS. The success or failure of every modern organization largely depends upon the fact that how effectively it
has adopted and applied MCS. Hence, MCSs are an integral part of every organization. There are various management control systems, which determine the success or failure of the organization. As the organization
grows in size and complexity, the control system also tends to change from simple to sophisticated.
The objectives of effective MCS are to improve operational effectiveness, efficiency, employee
creativity, company competitiveness by means of triggering feedback and corrective actions so that managers
can adjust to changes in the environment.
From the study, it is found that all the commercial banks have adequately developed and applied the
mechanisms of MCS. In terms of TQM, TBM, ABC, BSC, BM, RE, SVA and CIP all the banks have performed
satisfactorily. In other words, MCS has been satisfactorily followed by all the sample banks.
Implications Based on the analysis and findings of the study, the following implication has been recommended.
It can be suggested that organizations in general and banks in particular shall benefit in terms of
improved their performance when they truly understand the significance of MCS and when they develop and
apply MCS in their organizations.
The authorities of the banks are suggested to pursue researches to measure the effectiveness of MCS
mechanisms studies from time to time. In this context, the present research may be of great help and may
provide guidelines to the concerned authority.
This research has opened a door to further researches in the same subject for validity testing of the
findings of the present research.
In this study, only eight mechanisms of MCS, i.e. TQM, TBM, ABC, BSC, BM, RE, SVA and CIP have been used. There are other mechanisms of MCS also, i.e. Production Management (PM), Material
Requirement Planning (MPR), Value Chain Analysis (VCA), and Theory of Constraints (TOC) which can be
used by other researchers in the future.
Only commercial banks have been analyzed, so, it is recommended that other various types of
organizations such as service organizations, manufacturing & non manufacturing organizations, profit making &
nonprofit making organizations have to be analyzed.
References [1]. Anthony, R. & Govindarajan, V. (1998), Management Control System Mc-Graw Hill.
[2]. Anthony, N. (1997), Management Control in Non-Profit Organization. Irwin, Homewood, Illinois.
[3]. Banking and Financial Statistic of Nepal Rastra Bank, 2019
[4]. Baraldi, S. (1998). Management Control Systems in NPOs, Italian Surveys. Blackwell Publishers Ltd.: 1998.
[5]. Bhattacharyya, K. & Camillus, C. (1975). Implementation Problems of Management Control Systems.
[6]. Prentice Hall of India Pvt. Ltd., New Delhi.
[7]. Cusumano, M. (1997), “How Microsoft makes large teams work small teams”, Sloan Management Review, Fall.
[8]. http://bfr.nrb.org.np/list Banks n Non Banks. Php, September, 08, 2019
[9]. Janakala, S. (2005). The Use of Management Control Systems (MCS) Information in the Small Business Sector and the
Relationship between MCS, Strategy and Performance. Kemi-Tornio
[10]. Polytechnique-Department of Business and Administration.
[11]. Jawahar Lal. (2003). Advanced Management Accounting, Text and Cases. S. Chand & Company Ltd., New Delhi.
[12]. Kaplan, S. & Atkinson, A. (2005). Advanced Management Accounting. Prentice Hall of India Pvt. Ltd., New Delhi.
[13]. Kimura, S. & Mourdoukutas, P. (2000). Effective integration of management control systems for competing in global industries.
European Business Review, Volume 12 Number 1, pp. 41- 45.
[14]. Lere, C. & Portz, K. (2005). Management control systems in a Global Economy. Pearson Education, Asia.
[15]. Levine, Krehbiel & Berenson. (2004). Business Statistics, A first course. Pearson Education, Asia.
[16]. Lord, R. (1996). Strategic Management Accounting: the Emperor’s New Clothes?, Management Accounting Research.
[17]. Morse, E. (1965). Pendulum of Management Control. Harvard Business Review, May – June, No. 65310.
[18]. Mouritsen, J. (2005). Beyond Accounting change: design and mobilization of management control systems.
[19]. Department of Operation Management, Copenhagen School, Denmark.
[20]. Noy, E. (1999). There are profits in your management control systems. Managerial Auditing Journal 14/7 (1999) 363-367.
[21]. Porporato, M. (2006). Impact of Management Control Systems’ Intensity of Use of Joint Venture’s
[22]. Performance: An Empirical Assessment. AAA 2007 Management Accounting Section.

Management Control Systems in Banking Sector of Nepal
DOI: 10.9790/487X-2301045264 www.iosrjournals.org 64 | Page
[23]. Rijal, S. (2006). The Application of Management Control System in Nepalese Commercial Banks. The Journal of Nepalese
Business Studies Vol. III No. 1
[24]. Robbins, S. & Coulter, M. (2000). Management. Prentice Hall of India Pvt. Ltd., New Delhi.
[25]. Rotch, W. (1993). Management Control Systems: one view of Components and Their Interdependence.
[26]. British Journal of Management, Vol. 4, pp. 191-203.
[27]. Satyanarayan, Y. (2008). Management Control Systems in Competitive Environment. Icfai Unversity Press.
[28]. Shekhar, C. & Shekhar, L. (2000). Banking Theory and Practice. Vikash Publication Pvt. Ltd., New Delhi.
[29]. Simons, R. (1995). “Control in an age of empowerment,” Harvard Business Review, March-April.
[30]. Sisaya, S. (2006). Management Control System and Organizational Development. New directions for managing work teams.
Leadership & Organization Development Journal, Vol. 26 No. 1, pp. 51-61
[31]. Vancil, F. (1973). What kind of management control do you need? Harvard Business Review, March- April, Number 73213.
[32]. Wingren, T., Laitinen, K. and Nixon, A. (2005). Modern management control systems in Finnish
[33]. Technology Companies: Search for MCS combinations. University of Vaasa, Levon Institute.
Jitendra Prasad Upadhyay. “Management Control Systems in Banking Sector of Nepal.” IOSR
Journal of Business and Management (IOSR-JBM), 23(01), 2021, pp. 52-64.