Embed Size (px)
Citation preview
Management Control andEmployee-Driven Innovation
The Harvard community has made thisarticle openly available. Please share howthis access benefits you. Your story matters
Citation Li, Xin. 2016. Management Control and Employee-Driven Innovation.Doctoral dissertation, Harvard Business School.
Citable link http://nrs.harvard.edu/urn-3:HUL.InstRepos:32744406
Terms of Use This article was downloaded from Harvard University’s DASHrepository, and is made available under the terms and conditionsapplicable to Other Posted Material, as set forth at http://nrs.harvard.edu/urn-3:HUL.InstRepos:dash.current.terms-of-use#LAA

Management Control and Employee-driven Innovation
A dissertation presented
by
Shelley Xin Li
to
The Accounting and Management Unit at Harvard Business School
in partial fulfillment of the requirements
for the degree of
Doctor of Business Administration
in the subject of
Accounting and Management
Harvard University
Cambridge, Massachusetts
May 2016

© 2016 Shelley Xin Li
All rights reserved.
iii
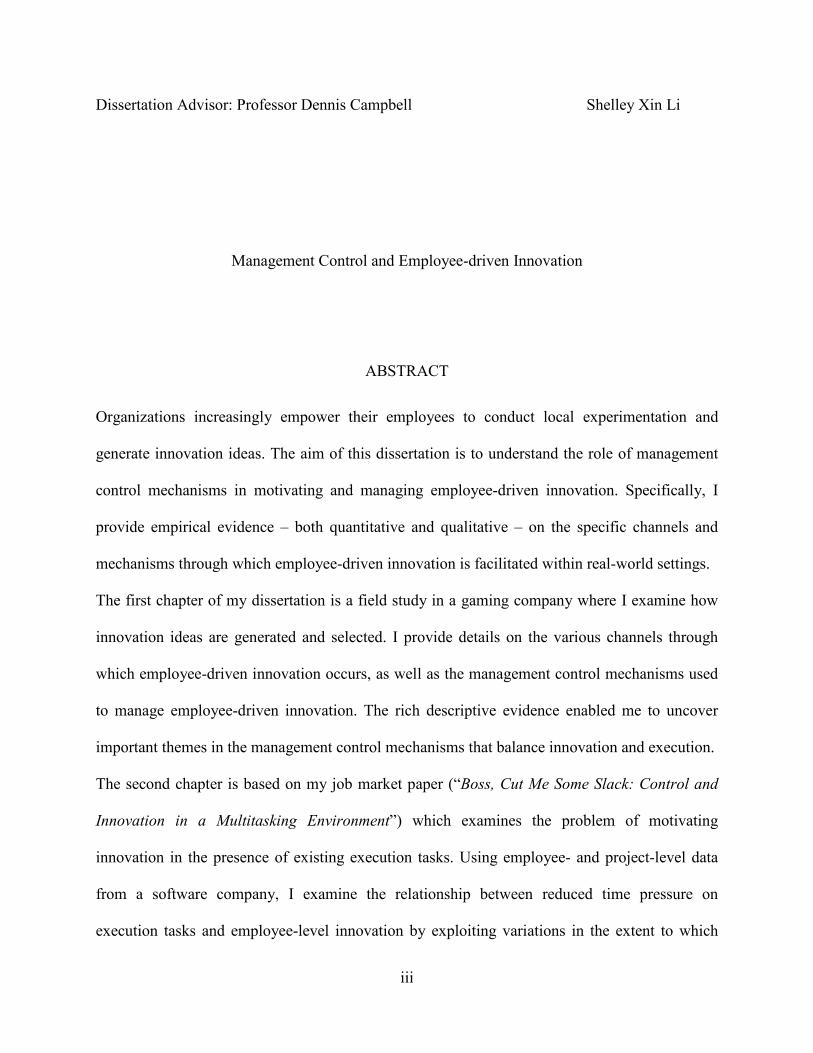
Dissertation Advisor: Professor Dennis Campbell Shelley Xin Li
Management Control and Employee-driven Innovation
ABSTRACT
Organizations increasingly empower their employees to conduct local experimentation and
generate innovation ideas. The aim of this dissertation is to understand the role of management
control mechanisms in motivating and managing employee-driven innovation. Specifically, I
provide empirical evidence – both quantitative and qualitative – on the specific channels and
mechanisms through which employee-driven innovation is facilitated within real-world settings.
The first chapter of my dissertation is a field study in a gaming company where I examine how
innovation ideas are generated and selected. I provide details on the various channels through
which employee-driven innovation occurs, as well as the management control mechanisms used
to manage employee-driven innovation. The rich descriptive evidence enabled me to uncover
important themes in the management control mechanisms that balance innovation and execution.
The second chapter is based on my job market paper (“Boss, Cut Me Some Slack: Control and
Innovation in a Multitasking Environment”) which examines the problem of motivating
innovation in the presence of existing execution tasks. Using employee- and project-level data
from a software company, I examine the relationship between reduced time pressure on
execution tasks and employee-level innovation by exploiting variations in the extent to which

iv
predetermined time constraints on execution tasks were loosely enforced by managers in
decentralized teams. I find that reduced time pressure on execution tasks is significantly
associated with a greater probability of self-initiated innovation. Consistent with theories on
employee selection and relational contract, the above effect is more pronounced (1) for
employees without significantly negative outcomes on past execution tasks, (2) for employees
with a greater preexisting propensity to innovate, or (3) when the supervisor has a history of
working with innovating employees. Conditional on submitting innovation prototypes, reduced
time pressure on execution tasks is also significantly associated with higher-quality innovation.
Despite the formal permission to innovate, many employees in established organizations seem
unable to fully and effectively use the granted discretion to experiment. In the third chapter of
my dissertation, I turn my attention to whether certain informal control mechanisms (such as
social norms) affect the extent of local experimentation. Using detailed loan- and employee-level
data from a financial institution that removed its rule-based formal control system, I analyze
changes in decision-making patterns and find that employees who are exposed to two different
initial control environments (i.e. before and after removing the rule-based control system) have
both increased local experimentation over time after being given the right to make their own
decisions. But employees from the initial control environment with zero-experimentation rely
much more on managers’ or peers’ degree of experimentation to guide their own
experimentation.

v
TABLE OF CONTENTS
Acknowledgments.......................................................................................................................... vi
Chapter 1|Management Control Mechanisms and Employee-driven Innovation: Evidence from a
Field Study .......................................................................................................................................1
Chapter 2 | Control and Innovation in a Multi-tasking Environment ............................................26
Chapter 3 | Norms, Initial Control Environments, and Employee Experimentation .....................67
References ....................................................................................................................................100

vi
ACKNOWLEDGMENTS
The year before I applied for doctoral programs was the most traumatic one. I was stuck in a job
that I didn’t like, living in one of the most depressing areas during one of the most depressing
times. But none of that could be compared to the loss of our first child in a stillbirth, a mystery
that no one was or is able to explain. I had just turned twenty-five, and felt that my previously-
promising life had become a dark vacuum where nobody could hear my scream.
Then, on February 1, 2010, around 2pm EST, I got a call when I was at work. I had to take it
outside. The gentleman on the other end of the call said, “Hi, this is Dennis Campbell, from the
Harvard Business School. I am calling to let you know that we decided to admit you into our
doctoral program”. Not to make it sound overly dramatic – after all, it is a privilege for anyone to
get the opportunity for a Harvard education – but it was more than a privilege for me. It was as if
someone reached out to me when I was drowning in life.
Since that call, I started an amazing journey at HBS and met many more brilliant and kind people
who have deeply influenced my research identify, cognitive style, and attitude towards life.
Dennis Campbell has the “parenting” style and research tastes that best match my motivation
type and research interests. Srikant Datar is one of the sharpest minds I have ever met and has
one of the most infectious laughs. V.G. Narayanan offers not only extremely useful feedback on
research, but also incredibly wise advice on career and life that I am now convinced that I should
vii
always follow. I am incredibly grateful for all that my committee has done for me. I couldn’t
have asked for a wiser, warmer, and more wonderful committee.
In addition to my committee members, I want to give special thanks to two other faculty
members: George Serafeim and Tatiana Sandino, both of them are great mentors and role models
for me. George is a productivity machine that I think someone should study. He is focused,
disciplined, and always full of positive energy. When I am in a state of low motivation or high
doubt, I always ask myself “what would George do” – and instantly feel that I am ready to
conquer anything in my way. Tatiana juggles so many tasks at once, but still always says yes to a
worthy new challenge and always miraculously finds time to offer her help to anyone in need.
She makes me see that what we do in this profession is not and should not be just about climbing
career ladders or achieving one’s own “success” – it is about whole-heartedly throwing ourselves
into every role that we play in life and be caring and kind to those around us.
And of course, I have also learned a great deal from my other brilliant co-authors: Charles Wang,
and Ethan Bernstein. Thank you for putting up with my imperfections and teaching me the craft
of doing research.
I could not make it through the doctoral program without the support of my wonderful friends.
Lingling Zhang and I took the same flight from Michigan to Boston when we attended the Admit
Day. Since then, she has become my go-to statistical consultant, lunch buddy, and the sister that I
always wish I had. Together with Sarah Wolfolds and Bhavya Mohan, you girls have provided

viii
so much support for me through ups and downs. Sa-Pyung (Sean) Shin, entered and will
graduate from the doctoral program in accounting with me, having experienced the same
anxieties and anticipations as we went through every major milestone together. Many thanks also
go to all the other amazing doctoral students in the accounting unit.
As a researcher who discovers and studies research questions in real-world settings, I am
extremely grateful for all the field sites and managers who allowed me to conduct interviews,
field visits, collect and analyze data. You enabled me to do work that I am passionate about.
I also want to thank my family. My husband, Lei Shao, pursued his doctoral degree in economics
from University of Texas at Austin, at the same time as I went through my program. He did most
of the commuting in the first two years and sacrificed time with his advisors in exchange for
more time with his family in the later years. I cannot imagine a more supportive husband and a
better father. My parents, Zhengming Li, and Jifen Ma, are two of the most inspiring people in
my life. I live every day of my life thinking that I cannot under-utilize the DNAs that they’ve
passed on to me, thinking how extraordinary they would have been if they had the same
opportunities as I did. I am proud of them, and eternally grateful for everything that they’ve
given me. My son, Ely, started reading papers and going to seminars with me since he was a
fetus, and always inspires me to be my best self and to set a great example for him.
I dedicate this dissertation to my wonderful family.

1
Chapter 1
Management Control Mechanisms and Employee-driven Innovation:
Evidence from a Field Study
1. Introduction
Established companies are a major driver of innovation – which is in turn the engine of
technological advance and economic growth (Schumpeter 1942). The way established companies
generate innovation has changed over time. Centralized R&D functions became a dominant form
of corporate innovation at the turn of the twentieth century and peaked around World War II and
the subsequent years. However, a trend of decentralization in corporate innovation has emerged
since the 1980s, around the same time that information technologies gained momentum (Lerner,
2012). Decentralized innovation - by business units, employees, and even stakeholders outside of
the organizational boundary in the case of user innovation - has become more feasible and
prevalent. Prior research has provided some empirical evidence on innovation at the business
unit level (Holthausen et al., 1995). We have also seen the emergence of a recent but rapidly
expanding literature on user and open innovation (Gambardella et al., 2015; King and Lakhani,
2013). However, relatively little empirical evidence has been gathered with respect to employee-
driven innovation, perhaps due to the lack of access to granular data within the boundary of
firms. To fill this gap, in this chapter, I use evidence collected from a field study and describe
how employee-driven innovation occurs in an organizational setting, specifically, how
management control mechanisms are used to motivate and manage employee-driven innovation.
I define employee-driven innovation in a relatively broad sense. First, by employees, I mean any
employee who is not formally assigned to the task of operationalizing and implementing an
innovation idea generated by a senior manager (or a group of senior managers). Traditionally, the
2
innovation ideas and related decisions are concentrated in a small group of executives or
specialists. Employee-driven innovation indicates that innovation ideas can come from those
outside of this selected group: customer-facing employees, shop-floor workers, professionals and
middle managers, etc. Second, innovation can be decomposed into stages like idea generation,
idea selection, and idea execution – employees have always been involved in the execution of
ideas. Therefore, by driven, I mean that employees generate and/or select the ideas. Third, by
innovation, I mean any project a firm undertakes to provide a new product or service, or to
generate a new method of producing or delivering an existing product or service.
Employee-driven innovation links two streams of literature in accounting and economics:
decentralized decision-making and motivating innovation. Both of these topics address real
challenges faced by managers. The key challenge in decentralized decision-making, is to balance
the benefit of empowerment with the need for efficient coordination. The key challenge in
motivating innovation, is to design incentives for outcomes that are difficult to measure. How
can management control mechanisms address these two challenges in employee-driven
innovation?
The truth is that we know very little about the phenomenon of employee-driven innovation or
management control mechanisms involved in this process1. How do employee-driven innovation
actually occur in an organization? What are the channels through which employees can engage in
innovative activities? How are these channels organized and coordinated? Prior literature on
motivating innovation fall into two main categories: archival studies and laboratory experiments.
1There is a substantial literature on continuous improvement initiatives where employees generate ideas to improve efficiency in the process of performing their tasks. This literature differs from employee-driven innovation in that: (1) most of the continuous improvement initiatives are team-based, while most of the idea-generation channels for employee-driven innovation are not; (2) the ultimate goal of continuous improvement is to perform one’s assigned task better by achieving difficult targets (usually set by senior managers), while the goal of employee-driven innovation is to generate novel ideas for products and services which are not necessarily related to one’s assigned task and are not driven by the pressure to achieve a target on the assigned task.
3
Archival studies provide some evidence consistent with the predictions from theoretical models,
pointing to the importance of providing long-term incentives (Holthausen et al., 1995; Lerner
and Wulf, 2007; Kachelmeier et al., 2008; Kachelmeier and Williamson, 2010; Chen et al.,
2012). However, these studies mostly focus on higher levels of the organization, i.e. the level of
firms, executives, or business units, lacking enough granularity to provide evidence on
employees’ role in innovation. The growing literature of laboratory experiments that study
individual-level creative activities, has provided a lot of insights into what motivates individuals
to be creative. However, laboratory experiments are unable to replicate the task knowledge and
organizational context surrounding employees’ innovation activities.
This chapter, a qualitative field study, is one of the first to provide detailed description and
analysis on employee-driven innovation. The purpose of this paper is: (1) to provide descriptive
evidence on how employee-driven innovation is motivated, facilitated, and coordinated through
management control mechanisms in an organizational setting; (2) to point out some important
themes that prior literature has largely unexplored; (3) to serve as a starting point for future
research.
The research site is a public company in the Casino and Gaming industry2. Contact with the
company started in October 2013 and ran until June 2014. During that time, I conducted 12 semi-
structured interviews (over the phone and in person) and a two-day site visit to the headquarters
(in Las Vegas). The basis of the analysis in this study are notes from the interviews,
observations during the site visit, internal documents provided by the company, and some
publicly available information. I restrict the scope of the analysis to the process of idea
generation and selection within the company.
2I selected the research site by first interviewing ten HBS executive education program participants and identifying companies that had sufficient employee-driven innovation activities, tracked these employee-driven innovation activities, and were willing to collaborate.

4
Consistent with what prior research suggests, I find: (1) the company has a separate structure (the
innovation lab) to manage long-term and more radical innovations; (2) the company provides
various incentives for employee-driven innovation – the type of incentives tends to match the
type of innovation in ways consistent with theoretical predictions. The study also uncovers some
themes that prior literature has largely unexplored: (1) the objectives of innovation activities at
the employee level are more diverse than the objectives of innovation at the organization level.
At the aggregate level, the eventual commercial success of a company’s innovation activities is
the most important and ultimate objective. At the employee level, depending on their main job
responsibilities, skill sets, and level of interaction with the external world, innovation activities
could serve different purposes (e.g. building the portfolio of intellectual properties, providing
input to brainstorm sessions unrelated to one’s main job responsibilities, coming up with high-
impact long-term innovation projects, engaging and retaining employees, etc.). As a result, there
are different channels for employee-driven innovation in the company. The scope of
participation, the frequency of idea submission, and the incentives of these channels seem to
match the objectives of the innovation activities and the type of employees. (2) The tension
between execution tasks (one’s main job responsibility) and innovation is heightened at the
employee level when the employee is from the mainline business (rather than the innovation
lab). Prior literature has mostly focused on the incentives used to motivate innovation – which
the company provides. But despite these incentives, many employees from the mainline business
still participated little in these employee innovation activities due to the short-term performance
pressure on their main job responsibilities. This led one Vice President in the mainline business
to consider experimenting with giving employees “innovation time”. (3) Various channels for
employee-driven innovation are coordinated through corporate communication and the corporate

5
R&D department. The innovation lab, in addition to being a separate structure protected through
independent reporting and budgeting process, is an important facilitator and coordinator in the
employee-driven innovation process.
The rest of the paper is structured as follows: Section II briefly reviews prior literature on
motivating innovation and discusses the potential benefits and costs of employee-driven
innovation. Section III describes the research site and the reports the findings. Section IV
discusses the implications of these findings. Section V suggests future research questions, and
concludes.
2. Prior Research and Potential Benefits and Costs of Employee-driven Innovation
Companies could benefit from employee-driven innovation for the following reasons. First,
employee-driven innovation utilizes a broader and more diverse set of information. This is
because lower-level employees usually possess more domain- or task- specific knowledge,
especially information from interactions with users, which is key to generating innovative ideas
that quickly adapt to market demands. Such information is often tacit knowledge embedded in
the local task environment and hence difficult to communicate. Employee-driven innovation has
the potential to bring a more complete, timely, and diverse set of information to the innovation
process that overcomes to limitations of having only a small group of people generating
innovation ideas (Kesting and Ulhøi, 2010). Second, employee-driven innovation also brings
together a broader and more diverse set of skills to the creative process. These skills coupled
with the information set could generate a broader and more diverse set of ideas. A larger pool of
ideas with higher variance has the potential to increase the likelihood of exceptionally good ideas
(Girotra, Terwiesch, and Ulrich, 2010). Third, employee-driven innovation could increase
employee visibility and their incentives to actively acquire new information and to invest greater

6
effort in their main job responsibilities. In other words, even if employee-driven innovation does
not increase the amount of high-quality innovation, it could be a great tool to attract, engage, and
retain talents.
However, there are also some potential costs or limitations for employee-driven innovation.
First, limited by their role, skills, or performance pressure related to the main job responsibility,
employees may not be able to come up with ideas that are very novel – they might only be
capable of generating ideas for very incremental innovation.
Second, many employees may not have a sense of the “big picture”, i.e. they have little
knowledge or understanding of the firm’s overall strategy, competitive advantage, or recent
trends in the broader marketplace or in technology. As a result, the ideas generated by these
employees may be unfit for the company to implement or maybe outdated solutions.
Third, employee innovation channels may lead to proliferation of similar ideas (given that
employees are from the same organization, and may share similar environments or a similar
knowledge base), which could lead to further conflicts.
Fourth, employees who are under tight deadlines to complete their assigned tasks, may not even
have the motivation to generate any innovation idea at all, leaving the employee innovation
initiatives or channels idle or underutilized.
These costs and limitations could lead to innovation ideas of low volume and/or low quality,
wasting organization resources that are put into these employee innovation programs.
How can management control mechanisms help address the above costs and limitations and
maximize the benefits of employee-driven innovation? First, prior research in innovation
management has suggested the importance of having a separate structure for managing more
radical innovation (Christensen and Raynor, 2003). This line of literature argues that

7
organizations are unlikely to select and execute radical innovation ideas due to the pressure to
maintain profit or growth in existing mainline business. These arguments could be extended to
employee-driven innovation. Employees in the mainline business are under pressure to meet
deadlines and to achieve targets; and are limited by their role, skill sets, and the extent of
interactions with the external world. Therefore, one of the implications from prior literature is
that a separate structure for radical innovation, as ensured by independent reporting and
budgeting systems, could be used to manage employee-driven innovation.
Second, prior research has focused on incentives used to motivate innovation. Manso (2011)
built a formal model of the optimal incentives for motivating innovation, which is to reward for
long-term success, to tolerate short-term failures, and to provide frequent feedback. A growing
literature in accounting and economics provides some empirical evidence on the role of explicit
incentives in motivating innovation. First, a stream of laboratory studies has examined
motivating individual creativity. Kachelmeier et al. (2008) find that providing bonuses (based on
quantity, creativity, or both) encourages higher creativity-weighted productivity than a fixed
wage does. Subsequent experimental studies (Kachelmeier and Williamson, 2010; Chen et al.,
2012) show that (1) explicit incentives can affect innovation output by inducing more creative
effort or by selecting the “creative” type; (2) explicit incentives at the team level can boost
creative output. Second, researchers have studied the relationship between incentives and
innovation at the firm or business-unit level. Holthausen et al. (1995) find that the proportion of
compensation tied to long-term components is associated with future innovation. Lerner and
Wulf (2007), looking at firms with centralized R&D organizations, find that giving more long-
term incentives to the head of corporate R&D is associated with more and better innovation
outcomes such as patents. Overall these prior studies suggest that “properly” designed incentives
8
can be used to motivate and manage innovation. Furthermore, in the case of employee-driven
innovation, the type of incentives may be more diverse than monetary rewards, because research
has shown that individuals tend to participate in creative activities out of a strong sense of
intrinsic motivation or self-image (Amabile 1988), which is more likely to be enhanced by social
incentives like recognition.
Now we will turn to how employee-driven innovation is motivated and organized at the research
site, and evaluate whether the use of management control mechanisms is consistent with themes
in prior literature, and uncover themes unexplored by prior studies.
3. Research Site and Findings
3.1 Research Site
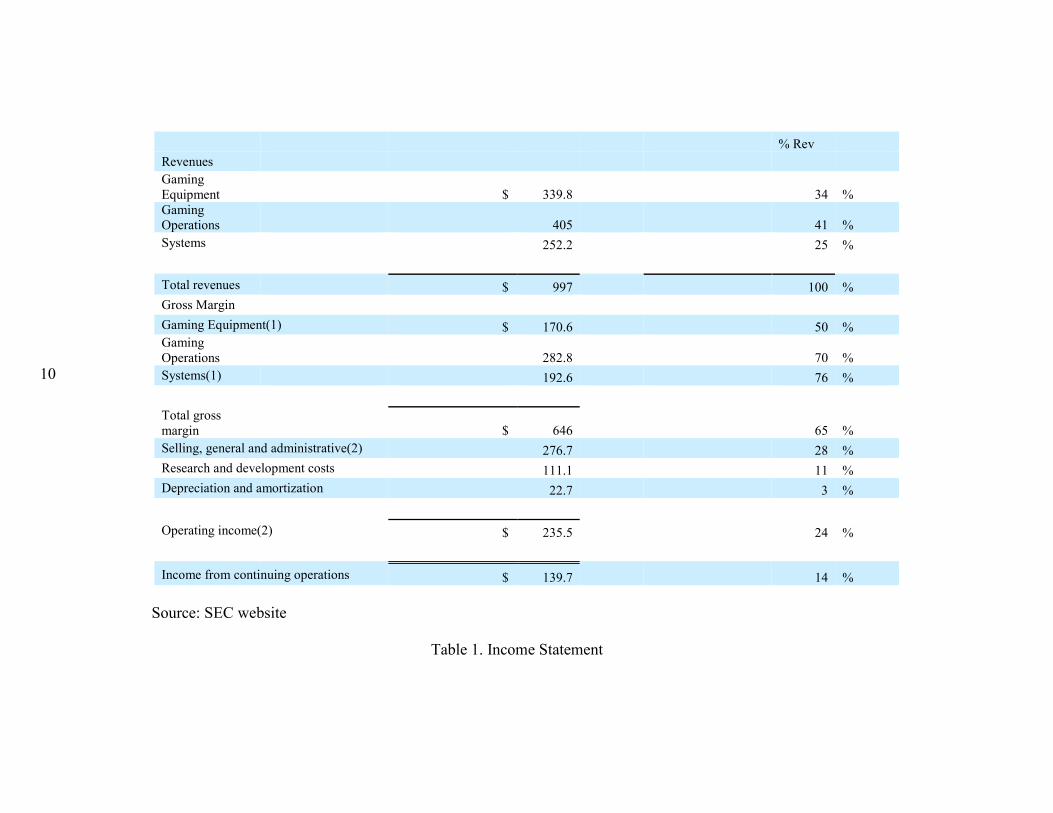
The research site is a public company in the Casino and Gaming industry. The company’s history
goes back to the 1930s. As of the fiscal year end of 2013, the annual revenue of the company
was close to $1 billion (Table 1 – Income Statement). The company offered gaming equipment
and operations (e.g. slot games, table games, etc.) and system solutions (e.g. enterprise
management software) for casinos and had an emerging online gaming business. Clients spread
all over the world. The company had about 4,500 employees, 2,300 out of which were
developers or engineers.
The major divisions of the mainline business were Gaming and Systems. Gaming developed and
delivered casino games and was where the company’s brand name had been initially developed.
Although this was a B2B business where the clients (the casinos) purchased the products,
understanding the end users of the products (the customers of the casinos) was a critical part of
this business. Systems, on the other hand, developed and delivered software solutions to casinos
and operated like a typical B2B enterprise software business. As of the end of 2013, Gaming

9
generated about three quarters of the company’s overall revenue while Systems generated about
one quarter of the revenue. The company was the market leader in Systems among industry
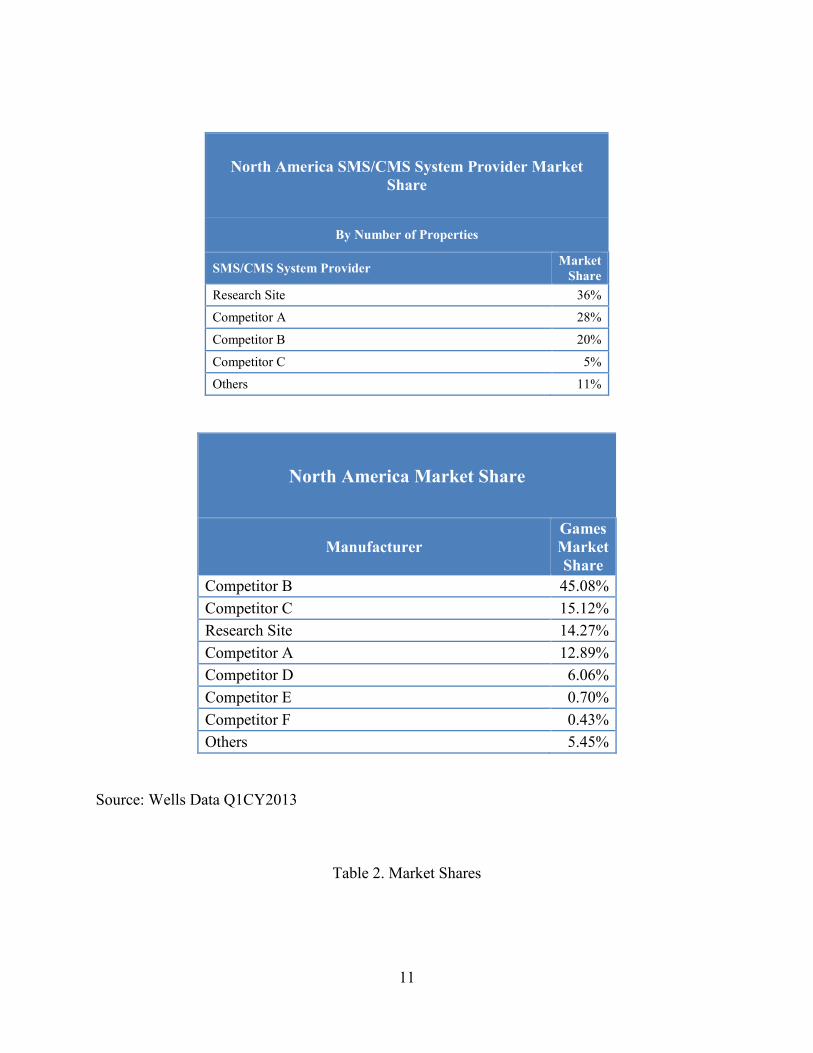
competitors and was the third in Games (Table 2 – Market Shares).
3.2 Innovation Lab
In 2008, the company established a corporate R&D department, outside of the mainline business.
The innovation lab was established subsequently (also in 2008) under this department. The
objective of the innovation lab was to look five to seven years into the horizon in terms of where
the new technologies were going. The lab tracked megatrends, looked for and “hunted” new
technologies around the world by going to technology conferences, trade shows, and by
researching industry literature. The senior Vice President of Technology, who oversaw the
innovation lab, described what was on the agenda of the innovation lab, “We think about how
users are going to interact with slot machines or other gaming devices. Touchscreens are the
current interface. What’s the next generation of that interface? How is mobile going to affect our
industry? What’s the next generation of display or networking technology? We go into the whole
ecosystem (hardware, software, networking, display, database, etc.) and build a team that can
innovate across that ecosystem”.
As a corporate innovation center, people at the innovation lab came from different backgrounds
and multiple locations (Reno, Las Vegas, the San Francisco bay area, Chennai, Bangalore).
Some people had industry experience (e.g. coming from competitors). Some used to work in
other large technology organizations such as Kodak, Corning, etc. Others moved from mainline
business. The majority came from non-gaming backgrounds.
10
% Rev Revenues Gaming Equipment $ 339.8 34 % Gaming Operations 405 41 % Systems 252.2 25 %
Total revenues $ 997 100 % Gross Margin Gaming Equipment(1) $ 170.6 50 % Gaming Operations 282.8 70 % Systems(1) 192.6 76 %
Total gross margin $ 646 65 % Selling, general and administrative(2) 276.7 28 % Research and development costs 111.1 11 % Depreciation and amortization 22.7 3 %
Operating income(2) $ 235.5 24 %
Income from continuing operations $ 139.7 14 % Source: SEC website
Table 1. Income Statement
11
North America SMS/CMS System Provider Market Share
By Number of Properties
SMS/CMS System Provider Market Share
Research Site 36%
Competitor A 28%
Competitor B 20%
Competitor C 5%
Others 11%
North America Market Share
Manufacturer Games Market Share
Competitor B 45.08% Competitor C 15.12% Research Site 14.27% Competitor A 12.89% Competitor D 6.06% Competitor E 0.70% Competitor F 0.43% Others 5.45%
Source: Wells Data Q1CY2013
Table 2. Market Shares

12
Employees at the innovation lab came up with ideas, brainstormed solutions, prototyped and
focus-group-tested the ideas with both external clients and internal customers (i.e. mainline
business). Some of those ideas would eventually be picked up and commercialized by mainline
business. For example, the Pro Curve cabinet, initially conceptualized by the innovation lab, had
already become part of the product lineup for 2014 3 (Figure 1 – Photos of the Pro Curve
Cabinet).
The head of the innovation lab described the difference and the interaction between the lab and
the mainline business: “The mainline business units mostly focus on incremental innovations.
They are mostly short-term oriented, zero to two years into the horizon. The technology cycle in
our industry is about 18 months. We (at the innovation lab) try to predict the market, file IPs,
and wait in advance, trying to get customers to go through the technology changes. We often
prompt mainline business: “you guys got to consider this”, making sure that they have visibility
to new technologies”. The innovation lab actively worked with mainline business through
regular working sessions and open innovation challenges.
Although working with the mainline business to bring concepts to the market, the innovation lab
was deliberately set up to maintain independent reporting and budgeting process. “Some of our
competitors also have similar innovation labs. The trick is not to pull the lab into the mainline
business… So we set up the innovation lab, having the head of the lab report to me (senior VP of
technology) who then reports to the CEO”.
3This slot machine employs a 40-inch concave screen that can handle content from any other setup (from the company’s other games), including the popular V32 portrait-style cabinet.

13
Figure 1. Photos of the Pro-Curve Cabinets

14
3.3 Channels for Employee-driven Innovation
The company established four formal channels for employee-driven innovation, where
employees could submit different types of innovation ideas or technological solutions. Most of
these channels were linked with a selection process and some form of incentives.
Patent Disclosure
Every employee in the organization could and was encouraged to submit ideas for patent
application to the patent committee. The process was usually the following: an employee (e.g.
from engineering, or manufacturing, or customer support) would submit a short document (one
or two pages) describing the idea they generate for the purpose of patent application. Their direct
supervisors would evaluate the ideas first and then send the appropriate ideas to the patent
committee. The patent committee included the head of the innovation lab, a legal person, and a
few other members from different business units. The patent committee would then select the
ideas to file for patents (based on the novelty, technical feasibility, and potential business value
of an idea). Approximately 400 ideas were submitted in 2013, out of which 75 patent
applications were filed.
Even though every employee was eligible to submit ideas through this channel and that the
company offered educational sessions on patents, not many employees had the deep technical
skills for or much experience with patent applications. The nature of the submissions –
patentable ideas – posed an implicit hurdle on the pool of employees who could actually
participate in this channel.
Pitch Documents
The Gaming side of the business bore some similarity with movie studios. In fact, the Gaming
business managed many gaming studios, where in addition to engineers and developers, there

15
were also artists, designers, and applied mathematicians. Each studio tried to come up with the
next “hit” game. In order to generate the best game, every employee in the Gaming business
could submit a “pitch document” to describe an idea for a new game. The novelty could come
from appealing visual and audio designs, exciting themes and stories, engaging user experience
with the device, or better game mechanics. An internal committee consisting of executives from
the Gaming business and people from the innovation lab, usually served as the first-round judges
to select these ideas. For ideas that entered into the next stage, the company would start
interacting and testing with users through the annual user conference, quarterly user focus
groups, and a “slot-machine panel” of over 2,000 experienced users.
Innovation Lab Ideas
Employees at the innovation lab had their own channel of idea generation. This usually started
with scanning the broad technological and market environment before identifying a few
promising areas or topics. They then narrowed down to concrete business applications or patent
ideas. The employees may do independent research, then collaboratively brainstorm and come up
with topics and projects. Once a project was officially established, it would be added to the
project management map with detailed timetables, milestones, and deliverables.
Open Innovation Challenge
In 2012, the company launched an online crowdsourcing platform that was accessible to
employees across all businesses and geographical locations. On this platform, the corporate R&D
department would post a question or topic, and ask for ideas or solutions in an “idea challenge”.
Anyone could post an idea or solution, and comment or build on an already posted idea. An idea
could garner significant support within the firm if many employees offered positive comments or
suggestions to the posted idea or solution. Therefore, employees could both generate ideas on the

16
platform and help select ideas. In addition, the top ideas would also be evaluated by a panel of
internal and external experts. Usually the top one or two ideas would be picked by the senior
management team.
The open innovation challenges asked employees to brainstorm possibilities (e.g. how could we
use technologies similar to “Google Glass” in our products or services?) and resulted in the
widest participation, especially from places where employees were not previously asked to
participate in the innovation process. The head of the innovation lab commented, “Innovation
used to be very US-centered. Now with those online challenges, we engage teams across the
world. In our recent challenges, 70% of the ideas are from folks in India”.
The table below summarizes the different channels for employee-driven innovation.
Channel Submitted Ideas
Objective Official Scope of Eligibility
Actual Scope of Participation
Frequency of Idea Submissions
Patent Disclosure
Patentable ideas.
Build a strong portfolio of IP assets
All Employees
Narrow (those with sufficient skills and experience)
High
Pitch documents
Ideas for a new game.
Generate the best games
Employees in game studios
Medium Medium
i-Lab ideas Ideas for “radical” innovation
Long-term high-impact innovation
Employees in i-lab
Very narrow High
Open Innovation Challenge
Ideas or solutions to the posted question
Brainstorm possibilities
All employees
Wide (employees across different businesses and locations)
Low
Table 3. Channels for Employee-driven Innovation

17
3.4 Incentives for Employee-driven Innovation
The company also offered various incentives for employee-driven innovation, most of which
were associated with the above channels for employee-driven innovation.
Patent Disclosure Incentives
The ideas selected by the patent committee would receive an immediate 300 dollars, regardless
of subsequent outcomes of the patent application. Looking at patent ideas submitted over the past
quarter or the year, the patent committee and the senior executives of the company would also
vote for Inventor of the Quarter (who receives a $5,000 reward), and Inventor of the Year (who
receives a $25,000 reward). Winners’ photos would be displayed prominently in offices across
the world.
Most Valuable Products Posters – MVP Posters
Every quarter, the company would make “Most Valuable Products” Posters for the top selling
games. These MVP posters would show the top selling 5 or 10 games in three major game
categories (Premium Games, Video Sale Games, Stepper Sale Games) with information on
“release date”, “title”, “studio”, “rank”, “consecutive quarters in top 5 (10)”. These posters
would also be displayed prominently in offices across the world (Figure 2 – Photos of MVP
Posters).

18
Figure 2. Photos of the MVP Posters

19
Performance Evaluation for the Innovation Lab Employees
Employees at the innovation had a full-time job for idea generation. Their compensation
consisted of a base salary and an annual bonus. In addition, they were also eligible for the
aforementioned patent disclosure rewards. The bonus was based on objective performance
indicators and subjective performance evaluation. The head of the innovation lab explained, “We
are a very KPI driven organization. We set up yearly key performance indicators. There are
generally five big areas, about 10 to 15 sub-areas. The KPIs include quarterly milestones (e.g
ideation for quarter 1, patent filing for quarter 2, focus group for quarter 3, and presentation to
customers for quarter 4). We measure how much you deliver on time. And those metrics are
linked to incentives”.
Open Innovation Challenge
As mentioned earlier, the winning ideas for an Open Innovation Challenge would be selected by
top management after being evaluated by the “crowd” and by the expert panel. The employees
who posted and substantially contributed to the winning ideas would receive company-wide
recognition and tangible rewards, such as i-Pads.
The table below summarizes the incentives provided for employee-driven innovation.
Incentive Program Nature of the Incentive
Individual or Team
Who is eligible
Patent Disclosure Incentives - Approved by the Patent Committee
Cash Individual All Employees
Patent Disclosure Incentives - Inventor of the Quarter/Year
Recognition + Cash Individual All Employees
MVP poster Recognition Team Employees in Game Studios
i-Lab Salary + Bonus based on KPIs and subjective evaluation
Individual i-Lab Employees

20
Open Idea Challenge Recognition + Tangible Rewards
Individual All Employees
Table 4. Incentives for Employee-driven Innovation
4. Discussion
4.1 Consistent with What Prior Research Suggests
As suggested by prior research, one key feature of this research site is the existence of a separate
structure (the innovation lab) that intends to develop long-term and more radical innovations.
Management control mechanisms are set up to make sure the independence of this innovation lab
from mainline business. Specifically, organizational structure and processes are designed so that
the innovation lab has a separate reporting chain to the CEO and a separate budget to support its
operations. The senior Vice President of technology commented, “The org chart is the key thing
to make sure that the innovation lab does not get brought into the mainline business. Budget is
another key thing to allow this form of innovation to take place. We have a separate budget that
allows for travelling and going to trade shows and tech conferences – most departments don’t
have such budgets”.
One important management control mechanism that prior literature has focused on is the use of
incentives in motivating innovation. Consistent with these prior studies, the company does
provide various incentives to motivate employee-driven innovation. There are a few interesting
observations regarding the incentives for employee-driven innovation. First, other than
incentives for the full-time employees at the innovation lab, all the other incentives take some
form of a tournament. Second, there are various types of incentives offered to employees – that
is, the incentives are not limited to monetary rewards which is the focus of most prior studies.
Third, consistent with prior research, group incentives are provided when it is difficult to clearly
identify individual contribution. Fourth, strong monetary incentives are provided for more

21
measurable outcomes – patents. However, these strong monetary incentives also caused some
conflicts between the innovation lab and the mainline business. Employees from the mainline
business complained, “we have concerns that the people from i-lab are also considered for the
prizes, since their sole responsibility is to come up with ideas”.
4.2 Themes Unexplored by Prior Research
There are also several themes that are important but relatively unexplored by prior literature.
First, there exists multiple channels for employee-driven innovation. These channels seem to be
designed in a way that matches employees and the objective of the innovation.
Table 5 below shows the channels that are accessible to the employees in the Gaming business,
the Systems business, and the innovation lab.
Games Systems i-Lab Main Job Responsibilities
Develop and deliver gaming products
Develop and deliver systems solutions
Generate and test long-term radical innovation ideas
Skills Artistic design, mathematics, hardware engineer, software developer, etc.
Mostly software developers
Various skill sets – most came from outside of the Gaming industry.
Interactions with External World
Interactions with clients and end-users
Interactions with clients
Interactions with clients, end-users, participants at various conferences, etc.
Accessible Idea Generation Channels
Patent disclosure Pitch Document Open Innovation Challenge
Patent disclosure Open Innovation Challenge
Patent disclosure Open Innovation Challenge i-Lab ideas
Table 5. Innovation Channels Accessible to Three Groups of Employees
Table 3 (in the previous section) suggests that the scope and the frequency of submission for
different channels are designed to accommodate the objective of each innovation channel. For
example, when the objective is to brainstorm possibilities (hence greater variance of the ideas is

22
valued), the scope of participation is broad; when the objective is to generate intellectual
property (hence higher quality of the ideas is valued), the scope of participation is relatively
narrow. Table 5 above suggests that the more diverse employees’ skill sets are, the more
interactions they have with the external world, the more idea-generation channels are accessible
to them.
Second, despite the various channels and incentives for employee-driven innovation, many
employees are still not actively participating in innovation activities, due to the tension between
execution and innovation at the employee level. This problem is faced by all employees in the
mainline business, and is particularly severe for employees in Systems where there has
traditionally been a strong focus on execution and where the company enjoys a leader position in
the market. Two factors could potentially explain this tension between execution and innovation
at the employee level. The first is the strong performance pressure faced by employees in the
mainline business, which is partly driven by the company’s strong focus on short-term KPIs that
are linked to incentives. The senior director of corporate communication proudly explained, “We
send quarterly KPI surveys to each department. There are scorecards with color coding (red,
yellow, and green) all the way up to the board. We are really running our business by
scorecards”. The second and a related factor is the lack of time for innovation. A Vice President
in the Systems business commented, “The challenge is to give people enough time to allocate to
innovation and to motivate people to think outside of 8 to 5 (normal work hours)”.
Third, there exist coordinating mechanisms for various employee-driven innovation channels to
avoid proliferation of similar ideas, to provide a “bigger picture”, and to help increase the quality
of the innovation. The first coordinating mechanism is information sharing through corporate
communication. One manager in the mainline business explained, “Our marketing department
23
(which is also in charge of corporate communication) does a phenomenal job with internal
communication about the innovations that are going on in the company, as well as getting our
corporate innovation to the street, to external award programs. We won the bulk of the awards
in the industry, more than our competitors combined. Awareness creates that culture of
innovation”. The second coordinating mechanism is through the corporate R&D department
(which oversees the innovation lab) which helps design consistent selection guidelines across
different channels of employee-driven innovation. People from the corporate R&D department
(and the innovation lab in particular) interact with the mainline business and act as “champions
for new technologies”. The innovation lab also helps organize the open innovation challenge by
identifying the proper question or topic to post to the internal crowdsourcing platform.
The head of the innovation lab explained, “The innovation lab often gives our members
(especially newer members) up for the mainline team to help with new initiatives. We also
identify “ideators” on the open innovation forum and start collaboration with them. Through the
open challenges, some of the innovation talents get exposed and we do bring some from other
departments to work with us”.
The role as “champions for new technologies” means that the innovation lab itself serves as an
information sharing channel that makes innovations external and internal to the company more
visible to everyone. A manager in the innovation lab revealed, “For example, we are exploring
technologies similar to Google Glass. We built some proof of concept, filed some IPs, and
showed users at user conferences. The leaders at India saw this, say, hey, we want this
technology transferred; we want to know more about it. So we held town hall meetings, talked
about the technology, and started open innovation challenges on this. The quicker I can get

24
mainline business to adopt a new technology, e.g. wearable technologies, the quicker I can move
on to the next thing”.
The above relatively unexplored themes point to the importance of: (1) designing the scope of
participation, frequency of idea submissions, and incentives of the different channels for
employee-driven innovation to accommodate the objective of the innovation and the types of
employees; (2) studying the role of management control mechanisms in facilitating employee-
driven innovation in the presence of execution tasks.
5. Conclusion
This chapter employs an in-depth field study to provide descriptive evidence on how employee-
driven innovation occurs in an organization and how management control mechanisms are used
to motivate and organize such innovation. As prior literature suggests, I find that there exists a
separate structure (the innovation lab) to generate long-term, more radical innovation; and that
there exists multiple incentives to motivate employee-driven innovation (although the type of
incentives are more diverse than what prior literature has focused on). I also uncover a few
themes relatively unexplored in prior literature on motivating innovation: (1) there exists
multiple channels for employee-driven innovation. The scope of participation, frequency of idea
submissions, and incentives associated with these channels seem to be designed to accommodate
the various objectives of employee-driven innovation and the types of employees. (2)
Management control mechanisms should look beyond explicit incentives and address the tension
between employee-driven innovation and the performance or time pressure from employees’

25
execution tasks. (3) Various channels for employee-driven innovation are coordinated through
corporate communication and the corporate R&D department4.
The rich descriptive evidence and the above unexplored themes serve as a starting point for
future research. How does performance pressure (e.g. that induced by performance evaluation)
on execution tasks affect employee-driven innovation? What about the time pressure on
execution tasks? The Vice President in Systems, who commented on the challenge of allocating
time to innovation for the employees, mentioned Google’s “20% time” practice and considered
whether practices that deliberately reduce the time pressure on employees’ main job
responsibilities could lead to increased participation and quality of innovation. The observation
that tension between execution and innovation is most severe for employees working in the
Systems business (where there had been a strong focus on execution) suggests that the initial
control environment employees were exposed to and the norms in that environment could also
affect employee-driven innovation.
In the next two chapters of my dissertation, I will begin to address these intriguing research
questions with detailed archival data and quantitative analysis in the context of real-world
organizations. In Chapter 2, I will use project- and employee-level data collected in a software
company to provide empirical evidence on the relationship between employee-initiated
innovation and reduced time pressure on execution tasks. In Chapter 3, I will examine the effects
of norms and initial control environments on local experimentation in the context of a financial
institution.
4 Although they are relatively unexplored in the accounting and economics literature, prior research in organizations and social psychology (Amabile 1988) has touched upon these themes, especially the tension between innovation and performance or time pressure on execution tasks. What distinguishes this dissertation from these prior studies is: (1) the following two chapters of this dissertation provide quantitative evidence at a granular level (employee or decision level) using data from within real organizations; (2) these chapters build on and empirically test predictions from economic theories such as relational contract.

26
Chapter 2 – Control and Innovation in Multi-tasking Environment
1. Introduction
Innovation is an important driver of organizational performance.5 Prior research in accounting
and economics has largely focused on motivating innovation directly, through the provision of
incentives, where innovation output is the only productive output under examination (Holthausen
et al., 1995; Lerner and Wulf, 2007; Kachelmeier et al., 2008). In reality, most employees are not
full-time innovators. Rather, they are responsible for assigned execution tasks, unrelated to
innovation, which they are under pressure to complete on time.6 This multitasking environment
presents a basic management control problem – motivating innovation (the output of which is
difficult to measure and contract on) in the presence of one or more execution tasks (the output
of which is relatively easy to measure and contract on). Companies have been experimenting
with practices that encourage employees to develop new ideas by reducing the time they are
required to spend on their existing execution tasks.7 However, relatively little empirical evidence
5A 2013 innovation survey conducted by PricewaterhouseCoopers(“Breakthrough Innovation and Growth” by Rob Shelton and David Percival, http://www.pwc.com/gx/en/innovationsurvey/index.jhtml) estimated that,over the previous three years, the most innovative 20% of the sample companies grew 16% more quickly than the least innovative 20% and were expected to grow 62% more quickly than the least innovative ones over the next five years. 6I define “execution tasks” as activities that exploit existing solutions, apply tested actions, and generate relatively certain payoffs and define “innovation” as activities that explore new solutions, apply untested actions, and generate relatively uncertain payoffs. These definitions make my argument and findings theoretically generalizable. However, the precise meanings of “execution tasks” and “innovation” depend on the context, task, and unit of analysis. In this study, these definitions are applied at the employee level: execution tasks are client-facing projects that apply the company’s existing products or technologies; innovations are working prototypes of new products or technologies. This is a relatively simple scenario in which “innovation” is separate from “execution tasks,” rather than one in which “innovation” improves performance on “execution tasks.” 7Some organizations (such as Google and 3M) are well known for slack-time policies that allow employees to devote 15 or 20 percent of their time to creative pursuits (Menzel et al., 2007; Vise, 2007). My interviews with executives from a range of technology companies (across the IT, gaming, healthcare, defense contracting, and fashion industries) revealed that some organizations allowed project teams to devote one or two people to a pet project. Most other organizations, however, do not have a formal “innovation time off” policy. Even Google recently dialed back on its 20-percent policy. During the interviews, some executives admitted that extra time could be allocated to individuals by their supervisors on a case-by-case basis. One manager commented “It is common to see that supervisors give some employees more time on their assigned projects because these employees are trying out something new on the side...but it’s hard to justify (to investors) so much unapplied resource if we let everyone take 10% of their work schedule and allocate it to something that may or may not lead to valuable innovation.”

27
has been gathered on the relationship between employee-initiated innovation and the strength of
management control on execution tasks. 8
Filling this gap in the literature, I empirically examine whether and under what conditions
reduced time pressure on execution tasks is associated with more self-initiated innovation at the
employee level. There are two notable differences between this study and much of the earlier
empirical research on motivating innovation. First, I focus on employee-level outcomes in a real-
world setting. Determining appropriate management controls for motivating innovation among
lower-level employees is important to many organizations. Since individuals are at the core of
firms’ search behavior (Wooldridge and Floyd, 1990), it is critical for scholars to understand
how innovation or creativity is managed at the rank-and-file level in addition to what laboratory
experiments can tell us.9 Second, turning away from explicit incentives, this paper looks at how
reduced time pressure on execution tasks could boost employee innovation. Prior research
already suggests that it is difficult to motivate innovation or creativity with explicit incentives
(Holmstrom, 1989) and that individuals are tempted to allocate their efforts to easier-to-measure
performance dimensions at the expense of difficult-to-measure performance dimensions
(Holmstrom and Milgrom, 1991). Therefore, it is useful to examine how management control
choices for non-innovation tasks could affect innovation activities.
To address my research question—whether and under what conditions reduced time pressure on
execution tasks is associated with more self-initiated innovation at the employee level—I utilize
detailed project- and individual-level data on personnel, execution tasks, and an employee
8A recent working paper by Bruggen, Feichter, and Williamson (2015) uses a laboratory experiment to examine the relationship between managing routine tasks and motivating innovation. The authors demonstrate that providing both input and output targets for the routine task leads to greater creative task performance. 9Reviewing the economics literature on technological innovation, Azoulay and Lerner (2012) comment that “the greatest gains in future years will be achieved by looking inside the ‘black box’ of the firm and understanding the internal workings of the innovation process.”

28
innovation program from a mid-sized public company that develops and delivers enterprise
software systems. This setting offers the advantage of a group of employees who are not
formally responsible for idea-generation or new product development, but who are encouraged to
develop and submit working prototypes of new products or solutions through the company’s
bottom-up innovation program. Employees can submit these prototypes for an annual evaluation
by a panel of internal and external experts, receive feedback and evaluation scores, and be
eligible for different levels of public recognition. Thus, this setting allows me to measure (a) the
characteristics and performance outcomes of employees’ execution tasks and (b) whether they
generated meaningful innovation and, if so, its quality. A key feature of the setting is the firm’s
combination of a centralized model of assigning execution tasks and their initial time constraints
and a decentralized model of managing the tasks and enforcing the time constraints. This allows
me to observe variation in the strictness with which these predetermined time constraints are
followed. Comparing employees with similar characteristics and similar portfolios of execution
tasks, I find that reduced time pressure on those tasks (as measured by the looseness with which
their predetermined time constraints were enforced by the managers for 12 months before the
annual submission of innovation prototypes) is significantly associated with a higher probability
of self-initiated innovation. Holding other variables at the mean value, moving the variable
Loose Enforcement of Time Constraints from its 10th percentile to its 90th percentile increases
the implied probability of employee-initiated innovation by 24.5 percent.
On management’s part, a concern for reducing the time pressure on execution tasks is that it is
hard to predict whether this will promote more effort in innovating activities or more shirking
and complacency, especially amongst those employees who derive little utility from developing
new ideas or who have a higher cost of effort. Theories and recent empirical work suggest that

29
when it is difficult to align incentives by contracting on output, aligning preferences (and hence
reducing agency cost) through employee selection can be a useful alternative (Merchant, 1985;
Akerlof and Kranton, 2000; Prendergast, 2008; Campbell, 2012). Consistent with this body of
work, I predict and find that the effect of reduced time pressure on the probability of self-
initiated innovation is more positive for (a) employees who have a greater preexisting propensity
to innovate and (b) employees who have not suffered significantly negative outcomes on past
execution tasks (which suggests the absence of unobserved low ability or higher cost of effort).
Whether reduced time pressure on execution tasks increases employee-initiated innovation also
depends on the relationship between employees and their supervisors. Theories in organizational
economics posit that when a particular type of output is difficult to measure (such as innovation),
an alternative to a formal contract is a relational contract; that is, an informal agreement between
an employee and his or her supervisor (Gibbons and Henderson, 2012). With respect to my
research question, building and sustaining relational contracts would require employees to
perceive a manager’s offer of reduced time pressure on execution tasks as sufficiently credible to
justify the risk of diverting time from execution tasks to innovation activities. Consistent with
theories of relational contracts, I hypothesize and find that the association between reduced time
pressure on execution tasks and the probability of self-initiated innovation is more positive when
supervisors have a history of working with employees who innovate, suggesting to employees
that they can reasonably anticipate loose enforcement of the time constraints and a tolerance for
allocating time to innovating activities.
In addition to the probability of employee-initiated innovation, I also examine the quality of
employee-initiated innovation as an outcome variable. Using the scores and prize outcomes from
the internal and external expert evaluations of the submitted innovation prototypes as proxies for

30
the quality of the innovations, I find that, conditional on submitting an innovation prototype,
reduced time pressure on execution tasks is also associated with higher-quality innovation.
I conduct robustness tests to better isolate the causal effect of reduced time pressure on execution
tasks on employee-initiated innovation. I use an alternative measure for reduced time pressure
which captures a plausibly exogenous variation in the ex ante pressure to meet predetermined
time constraints on execution tasks. Analysis with this alternative measure yields similar results:
reduced time pressure on execution tasks leads to a higher probability of employee-initiated
innovation. To alleviate concerns about reversed causality—that is, the possibility that it is
working on innovation prototypes that causes execution tasks to run over the allotted time—I use
an earlier time window (from 18 months before the annual submission of innovation prototypes
to 6 months before) to measure the time pressure on execution tasks. Results are robust to
varying the time window.
This paper contributes to the growing management accounting and economics literatures on
motivating innovation (Kachelmeier et al., 2008; Kachelmeier and Williamson, 2010; Chen et
al., 2012; Baranchuk et al., 2014; Grabner, 2014) by providing empirical evidence on how
adjusting the performance pressure on easier-to-measure tasks impacts self-initiated innovation
in a real-world organizational setting. This study also contributes to the managerial accounting
literature on the effect of “loose” management control environment on employee performance
(Campbell et al., 2011). My findings also expand the literature on slack resources and
innovation (Merchant and Manzoni, 1989; Nohria and Gulati, 1996; Agrawal et al., 2015) by
extending it to a different form of slack resource—loose enforcement of predetermined time
constraints by local managers—and to employee-level outcomes.

31
This study also sheds light on the various slack-time practices that companies have been
experimenting with to encourage employees to generate and develop new ideas by reducing the
time they are required to spend on their existing projects. Although this paper does not directly
test the formal “innovation time off” policy, it is, to the best of my knowledge, the first to
provide evidence on the relationship between employee innovation and reduced time pressure on
execution tasks in a real organization. My findings suggest that locally implemented slack-time
practices could help motivate employee innovation and that their effectiveness depends on
employee type and the relationship between employees and their managers.
The layout of this paper is as follows: Section 2 discusses the relevant literature and develops
hypotheses. Section 3 describes the research setting, the sample, and research design. Section 4
presents the empirical analyses and discusses the results. Section 5 concludes, discusses caveats,
and suggests avenues for future search.
2. Literature Review and Hypothesis Development
2.1 Motivating Innovation
Motivating innovation is notoriously difficult. As Holmstrom (1989) points out, innovation
projects are highly risky, tend to be idiosyncratic, and involve multiple stages spanning a long
period of time. Furthermore, it is not clear ex ante what action the agent should take. Research in
innovation and creativity has also shown that innovators bring a certain degree of intrinsic
motivation to their work. All these characteristics make it difficult to construct informative
performance metrics on the basis of which to write and enforce formal incentive contracts.
A growing literature in accounting and economics provides some empirical evidence on the role
of explicit incentives in motivating innovation. First, a stream of laboratory studies has examined
motivating individual creativity. Kachelmeier et al. (2008) find that providing bonuses (based on

32
quantity, creativity, or both) encourages higher creativity-weighted productivity than a fixed
wage does. However, consistent with Holmstrom’s (1989) argument, a bonus linked to the output
creativity does not bring about a higher volume of high-creativity output than a bonus linked to
the output quantity does. Subsequent experimental studies (Kachelmeier and Williamson, 2010;
Chen et al., 2012) show that (a) explicit incentives can affect innovation output by inducing more
creative effort or by selecting the “creative” type, (b) explicit incentives at the team level can
boost creative output.
Second, researchers have studied the relationship between incentives, governance mechanisms,
and innovation at the firm or business-unit level. Holthausen et al. (1995), examining the
structure of compensation for divisional CEOs, find that the proportion of compensation tied to
long-term components is associated with future innovation. Lerner and Wulf (2007), looking at
firms with centralized R&D organizations, find that giving more long-term incentives to the head
of corporate R&D is associated with more and better innovation outcomes such as patents. These
studies have documented that long-term incentives are important in motivating innovation
(Manso, 2011). Grabner (2014) shows that performance-based pay and subjective evaluations of
non-task-related performance are complements in a creativity-dependent setting. This suggests
that managerial discretion or subjectivity is critical in motivating innovation.
Despite such insights from the literature, the empirical study of motivating innovation in an
organization is still nascent. It has largely focused on motivating innovation directly, without
examining how non-innovation tasks could interact with and affect innovation activities. In
reality, most employees are not full-time innovators. Rather, they have day-to-day tasks,
unrelated to innovation, which they are under pressure to complete on time. Motivating these
employees to develop meaningful innovations involves both directly motivating innovation

33
activities and indirectly managing their competing execution tasks. How individuals work on
these execution tasks that take up the majority of their work days would have a major impact on
their choices to engage in innovation activities. Furthermore, the literature on motivating
innovation lacks empirical evidence from within the “black box” of a firm. Despite the
perception that established firms are less innovative, most of the innovating activities in the U.S.
economy still take place within firms (Lerner, 2012). Empirical evidence based on non-
perceptual data from within a firm could help us understand a firm’s internal innovation process
and how to motivate employee innovation at the rank-and-file level.
Consistent with the spirit of Manso (2011), I also focus on the tradeoff between the exploration
of untested actions (innovation) and the exploitation of well-known actions (execution tasks).
Specifically, I look at how reduced time pressure on execution tasks could be associated with
more innovations initiated by lower-level employees.
2.2 Control and Innovation in a Multitasking Environment
In any organization, there are established activities—with relatively certain payoffs—which
make up most of its normal operation and account for most of its revenue. But long-term success
also requires explorative activities—with relatively uncertain payoffs—such as search behaviors
and risky investments in order to generate and develop new products and technologies. A vast
literature in economics and management has examined the tension between exploiting and
explorative activities at the firm level and suggested ways toward an “ambidextrous”
organization (March, 1991; Tushman and O’Reilly, 1996). But while it is clear that individuals
are at the core of firms’ search behaviors (Wooldridge and Floyd, 1990) and while businesses
have tried various practices to unleash employee creativity, few studies have examined
exploration-exploitation tension at the individual level.

34
Economic theory on multitasking (Holmstrom and Milgrom, 1991) provides a useful framework
to study the problem of balancing innovation and execution at the individual level. Theory
predicts that agents are tempted to allocate their efforts to easier-to-measure performance
dimensions at the expense of difficult-to-measure ones. Holmstrom and Milgrom (1991: 26)
point out that “the desirability of providing incentives for any one activity decreases with the
difficulty of measuring performance in any other activities that make competing demands on the
agent’s time and attention.” Subsequent empirical studies have provided evidence consistent
with the theoretical predictions: many organizations provide little performance-based
compensation due to the difficulty of capturing important performance dimensions and the fear
of incentive distortions (such as producing large quantities of low-quality output and, in
education, focusing on test scores instead of developing students’ problem-solving capabilities).
An alternative to decreasing the strength of explicit incentives on easier-to-measure tasks is to
reduce the performance pressure on these tasks by providing more resources or allowing a
greater “margin of error.” The rationale is similar to the argument in Manso (2011): allowing
some experimentation in the short-term (in the form of more resources or greater leeway to make
mistakes) could boost innovation and long-term performance.
Literature in accounting, economics, and organizational behavior has examined the relationship
between excess resources—more financial resources, personnel, or time than is needed to
produce necessary outputs—and organizational performance (Love and Nohria, 2005). Agency
theorists have long argued that excess resources—or slack—is a form of inefficiency
accumulated because of principal-agent problems (Williamson, 1963; Jensen and Meckling,
1976), which suggests that excess resources are associated with negative management control
outcomes. However, organizational theorists have long held that organizational slack could lead
35
to some positive outcomes (Cyert and March, 1963). Research shows that a certain amount of
slack can facilitate adaptation, innovation, creativity, and risk-taking by providing resources that
allow for search and experimentation and for the resolution of certain goal conflicts (Bourgeois,
1981; Nohria and Gulati 1996; Singh, 1996; Amabile and Conti, 1999; Lawson, 2001). A stream
of accounting research has also shown that budgetary slack could generate positive management
control outcomes in an organization by (a) allowing people to allocate attention to goals other
than meeting the budget, (b) facilitating performance in the presence of high budgetary emphasis
and uncertainty, (c) isolating risk-averse subordinates from excess risk, and (d) increasing job
satisfaction (Lukka, 1988; Merchant and Manzoni, 1989; Dunk, 1995; Lillis 2002; Davila and
Wouters, 2005).
More broadly, the accounting literature on management control systems has examined the effect
of a “loose” control environment on learning and innovation. Campbell et al. (2011) analyze
archival data at the employee-transaction level and find that employee learning is concentrated in
business units with “loose monitoring” and entirely absent in those with “tight monitoring.”
With respect to my research question, reduced time pressure on execution tasks could lead to
more employee-initiated innovation due to increased experimentation and learning. However, it
could also encourage shirking or other opportunistic behaviors and increase agency cost rather
than leading to more innovation. One can even argue that reduced time pressure on execution
tasks may lead to less innovation because if slack time encourages complacency (e.g. by sending
a signal to employees that their supervisors are not effectively monitoring them), it may lead to
an overall increase in the consumption of leisure and less effort in both execution tasks and
innovation activities. I state my hypothesis on the relationship between reduced time pressure on
execution tasks and employee-initiated innovation in the null form:
36
H1: Reduced time pressure on an employee’s execution tasks has no significant
association with the likelihood of employee-initiated innovation after controlling for
execution task characteristics and individual characteristics.
2.3 Employee Type
Reduced time pressure on execution tasks could divert more effort to innovating activities. But it
could also lead to more shirking, especially for employees who derive little utility from idea-
generation or those who have a high cost of effort. Theories and recent empirical work have
suggested that when it is difficult to align preferences by contracting on output, aligning
preferences through employee selection can be a useful alternative to reduce agency cost
(Merchant, 1985; Akerlof and Kranton, 2000; Merchant and Van der Stede, 2007; Prendergast,
2008; Campbell, 2012). Consistent with this stream of literature, we would expect the effect of
reduced time pressure on execution tasks to be more positive in employees who are less likely to
shirk.
Outcomes on past execution tasks contain a lot of information on an employee’s cost of effort
(one can also think of low ability as high cost of effort). Therefore, I argue that reduced time
pressure on execution tasks is more likely to encourage experimentation and innovation amongst
employees who have not had significantly negative outcomes on past execution tasks than
amongst those who have. It is also possible that employees who did not perform well in the past
are more likely than those who did to use the reduced time pressure on execution tasks to do a
better job on those tasks and less likely to use the time for innovating activities. More formally, I
hypothesize:
37
H2: Reduced time pressure on an employee’s execution tasks has a positive association
with the likelihood of employee-initiated innovation in the absence of significantly
negative outcomes on past execution tasks.
The classic “input, process, output” model of management control posits that control in
organizations can be achieved by managing “inputs,” including employees (Merchant, 1985;
Simons, 2000). In settings where it is difficult to contract on output, organizations devote
significant resources to selecting the right employees. If the principal wants an agent to innovate,
the principal could either pay the agent based on innovation output or select agents who value
innovating activities in their utility functions or who have a higher ability to innovate. Because it
is difficult to distinguish innate preferences from ability (Campbell, 2012), I use the phrase
“preexisting propensity to innovate” to capture both preferences and ability. I hypothesize that
reduced time pressure on execution tasks will be more effectively used by those employees with
a preexisting propensity to innovate.
H3: Reduced pressure on an employee’s execution tasks has a positive association with the
likelihood of employee-initiated innovation for employees with a preexisting propensity to
innovate.
2.4 Relational Contract
When decisions related to managing execution tasks are decentralized, the focal employee’s
supervisor and local environment are important in determining how loosely time constraints are
enforced and whether the extra time will be used for meaningful innovation. When formal
control systems become infeasible due to the lack of relevant and reliable output-based or
behavior-based outcomes, relational contracts (i.e. informal agreements between an employee
and his or her supervisor) provide another way to sustain the collaboration between the employee
38
and the supervisor. With respect to this study, the innovation process (through self-initiated local
experimentation) and the loose enforcement of predetermined time constraints are a joint process
involving informal agreements between supervisors and subordinates. Gibbons and Henderson
(2012) show that building and sustaining these informal contracts can be challenging because it
requires each party to believe the other party’s promise. The more credible the employee
perceives the supervisor’s promise to loosely enforce predetermined time constraints on
execution tasks, the more likely he or she is to use the extra time to learn, experiment, and
innovate for the firm’s benefit. The more credible the supervisor perceives the employee’s
promise to use extra time for innovation (and to some useful effect), the more likely he or she is
to grant that time through loose enforcement of predetermined time constraints on execution
tasks.
One source of credibility comes from past history. Specifically, employees are more likely to
trust a supervisor’s promise of loosely enforcing time constraints on an employee’s execution
tasks in the interests of innovation when that supervisor has a known history of working with
employees who have generated and submitted innovation prototypes in the past (“innovating”
employees). More formally, I hypothesize:
H4: Reduced time pressure on an employee’s execution tasks has a positive association with
the likelihood of employee-initiated innovation when the supervisor has a history of working
with “innovating” employees.

39
3. Research Setting, Sample Selection, and Research Design
3.1 Research Setting
In contrast to previous studies that conduct laboratory experiments or rely on perceptual data
collected through surveys, this paper uses archival data from a firm, supplemented with
qualitative information to better understand the implications of the findings.
The research site for this paper is a public company in China that develops and delivers
enterprise software systems to business corporations and government agencies. As a business-to-
business firm, it makes money deploying solution-development project teams to client
organizations to understand their specific needs and deliver solutions that adapt the company’s
existing offerings. As knowledge workers who interact with clients, project team members
possess specific task-relevant knowledge and are responsible for executing their projects well. In
this study, I focus on the sample of team members whose main responsibility is to generate
profits for the company by delivering satisfactory outcomes to clients, not to develop new ideas
that might benefit the company in the long term.
In the company’s early days, most employees were involved in generating and developing ideas
for products and technical solutions that eventually became a portfolio of profit-generating
products. But as the company grew bigger (from fewer than 20 employees to over 1,400), with
more clients and stable product lines, most employees found themselves deploying existing
products and solutions and were preoccupied with the details of managing these deployment
projects. Client-facing employees participated less and less in idea-generation and product
development. The founders were worried about losing the original entrepreneurial spirit and
creative spark at the frontline, so, in April 2010, they established an employee innovation
program. The program invites all employees to submit innovation prototypes of products and
40
technologies10 for an annual evaluation.11 A panel of internal and external experts listens to the
employee’s presentation, asks questions of the employee and some early users of the prototype,
and evaluates the prototype. Each judge scores the prototypes (or ranks them from most to least
innovative in the most recent two years). There are several evaluation criteria: novelty, potential
impact, and clear individual contribution.12 The founders and top executives then decide which
prototypes win that year’s level-1, level-2, and level-3 awards. The winners are awarded a cash
prize and public recognition at an annual ceremony in front of all employees.13
There are several reasons why this is a good setting to examine the relationship between time
pressure on execution tasks and employee-initiated innovation. First, the research question calls
for a setting in which local experimentation and innovation are valued and highly feasible. The
employee innovation program makes clear that the company values employee-initiated
innovation. The nature of the software industry makes developing working prototypes relatively
quick and inexpensive; that is, the cost of local experimentation and innovation is low.
Interviews with managers revealed that employees and project teams are mostly self-managed,
which also helps enable local experimentation.14
Second, reduced time pressure on execution tasks is more likely to generate positive performance
impact in settings without a high level of preexisting slack or inefficiency. As a public company, 10The innovation program requires that the submitted prototypes can demonstrate or have demonstrated some viability or “value (rather than an early-stage concept). Developing a working prototype is therefore a substantial innovation effort, not just merely recording creative ideas. Submissions have included a new software application based on the company’s proprietary development platform, a mobile-platform-based solution for attendance management, and a new system for managing corporate reimbursement. 11The annual submission period lasts two weeks and ends on the last day of March. 12Neither customization of existing products nor process improvements that directly benefit the employee’s execution tasks are eligible because (a) they are not considered novel and (b) it is difficult for the judges to evaluate an individual’s contribution. 13The expected value of the award (that is, taking into account the probability of winning it) is about a few hundred RMB, significantly less than the average project bonus one would earn on a client-facing project (approximately RMB 2,400).Therefore, most of the “glory” comes from recognition and visibility. Thus, this is a setting in which there are explicit financial incentives to generate innovation output, but the incentives are not very strong compared to the performance pressure on one’s main job responsibilities (execution tasks). 14 This also gives rise to variations in the company’s subcultures and in local project management.

41
this site has established adequate financial control systems and developed a strong focus on
execution which is manifested by a high level of performance pressure in execution tasks (the
solution-deployment projects). Furthermore, the founders still own the majority of shares in the
company and are still firmly in control and actively involved in operations. Thus, the firm is a
setting without much slack or inefficiency in execution tasks.
Third, this research setting allows me to collect, for a set of employees, detailed characteristics of
their execution tasks and information on their self-initiated innovation activities (participation in
the employee innovation program), which provided rich archival data for detailed statistical
analyses.
3.2 Sample Selection and Description
This paper focuses on a sample of employees on the solution-deployment teams. See Table 6 for
a description of these employees’ execution tasks and innovation activities. I collected project
data on 325 solution-deployment projects completed between 2010 and early 2015. Data items
on these projects (i.e. execution tasks) include the predetermined time constraint, the actual
completion time, the budgeted cost, the actual cost, project team members, project contract
revenue, and the customer satisfaction score collected from the client after the project was
completed. I also collected data on the innovation program from 2010 to 2015 which identifies
who submitted an innovation prototype for each year and each prototype’s score and prize
outcome.
I also collected personnel information for all employees from January 2010 through December
2014. The data items include age, gender, tenure, education, job function, and supervisor ID.
The final sample—obtained by merging the project data, personnel data, and innovation program
data—contains 720 employees and 49 submissions of self-initiated innovation projects.

42
Execution tasks
(“solution-deployment projects”) Employee-initiated innovation
Description The company’s revenue-generating projects, in which employees go into a client organization, adapt the site company’s existing software systems or solutions for the client, and deploy the system at the client’s site.
Self-initiated innovation projects (not directly related to currently assigned execution tasks) that have reached the stage of being a viable working prototype.
Examples Providing and launching a financial reporting and control software system for a state-owned telecommunications corporation.
Developing and submitting a working prototype of a software application that manages employee attendance using the company’s newly-developed proprietary development platform.
Table 6. Description and Examples of
Execution Tasks and Innovation Activities for the Sample Employees
43
3.3 Research Design and Variable Construction
The basic research design is to model the probability of an employee submitting an innovation
prototype for the annual evaluation at the end of year t (i.e. the end of every March), using a
logistic model at the employee-year level. Standard errors are clustered at the employee level.
Probability (Innovationit) = f [β0 + (β1 * Reduced Time Pressure on Execution Tasksit) + (β *
Control Variables on Project and Individual Characteristicsit)]. 15
(1)
Where:
i represents employee i, t represents year t. t is defined as the year that starts on the first day of
April and ends on the last day of March in the next calendar year because March 31st is the end
of the company’s annual submission period (which lasts for two weeks) for employee-initiated
innovation prototypes.
The main dependent variable in the analysis is Innovationit, a binary variable that equals one if
employee i submitted an innovation prototype for the employee innovation program at the end of
year t.
Measures for Reduced Time Pressure on Execution Tasks
A key feature of the research setting is its combination of a centralized model of assigning
execution tasks and their initial time constraints and a decentralized model of managing the tasks
and enforcing the time constraints. The company’s Operation Center sets up files for each
execution task (a solution-deployment project) as it starts and sets time constraints on these tasks
(an internal deadline) based on (a) historical data on similar projects and similar customers, (b)
the external deadline, and (c) an initial assessment of resource demand (based on
15I use an OLS regression when the dependent variable is not binary (e.g., quality of innovation).

44
communications with the project team and the client). The Operation Center monitors projects
for progress and cost management, collects data on customer satisfaction once the project has
started, and gives an overall evaluation at the end of the project. On the other hand, day-to-day
project management and client interactions are up to the team members themselves. A team
supervisor could decide to extend a project for various reasons as long as that does not
compromise the external deadline or decrease customer satisfaction. The Operation Center does
not override local decisions (i.e. decisions made by the project teams), but would take the actual
duration of the project into consideration in its final project evaluation.
This flexibility allows me to observe variation in the extent to which time constraints on
execution tasks were followed. Comparing similar employees with similar portfolios of
execution tasks, I can measure the reduced time pressure on these execution tasks by measuring
the extent to which predetermined time constraints are loosely enforced; that is, the extent to
which the actual time taken exceeds the initial time constraint.
The main measure for the construct - Reduced Time Pressure on Execution Tasks- is Loose
Enforcement of Time Constraints. Specifically, Loose Enforcement of Time Constraintsit is
constructed as a project’s actual duration minus the predetermined time constraint on the project
(normalized by the predetermined time constraint), averaged across all of the employees’
projects during year t (i.e. 12 months leading up to the annual submission date).
Through interviews with managers, I learned that extra time for execution tasks is sometimes
granted on an informal basis. Such informal practices allow selectivity and control over how
extra time is allocated depending on the local situation, the employee type, and the trust between
supervisors and employees. Slack built into the predetermined time constraints on these
execution tasks could be another measure of reduced time pressure on these tasks. However,
45
such a measure relates more to setting the initial time constraint than to the loose enforcement of
a time constraint based on the local environment; it does not fit the setting of bottom-up
innovation well because most such innovation cannot be planned in advance.
There are concerns with this measure. First, since it is constructed with the actual time taken by a
project, it could capture the extra work needed on the project rather than the extra time explicitly
granted. Second, factors that cause the predetermined time constraints to be loosely enforced
may be correlated with factors that influence the likelihood of employees initiating innovation
projects, creating omitted variable bias.
I address these concerns in three ways. First, I measure Loose Enforcement of Time Constraintsit
against the predetermined time constraints (i.e. the assigned internal deadlines), which already
take into account the expected work load and the time required based on historical data and the
Operation Center’s assessment.
Second, to the extent that managers systematically underestimate the amount of time needed on
certain projects or with certain employees, I further control for project characteristics and
individual characteristics that could help predict the expected amount of time needed on these
projects and might also relate to an employee’s innovation ability or opportunities.
Third, the measure may not capture managerial discretion, but rather a result of various external
shocks. If such shocks are noise unrelated to innovation opportunities, we would expect a
downward bias in the estimates16.
To further address the concern of the endogenous nature of Loose Enforcement of Time
Constraintsit (which includes concerns for reverse causality, i.e. innovation causes the execution
tasks to run over time; and concerns for omitted variable bias, i.e. Loose Enforcement of Time
16It is also possible that such shocks are related to factors, such as task complexity, that contribute to innovation opportunities, which further justifies the need to control for detailed project characteristics in the statistical analyses.

46
Constraints and innovation are both driven by unobserved factors such as some innovation
opportunities faced by the employee), I construct an alternative measure of reduced time
pressure on execution tasks using % of Projects with 4th-quarter Deadlines. % of Projects with
4th-quarter Deadlinesit is measured as the percentage of an employee’s projects (during year t)
with a planned deadline in the fourth quarter, which captures more exogenous variation in the
time pressure on execution tasks.
Interviews with managers and employees revealed that the fourth quarter of their fiscal year
(October through December) is usually a high-pressure window to get projects done. Sources of
the pressure include the year-end targets and annual performance evaluations. These pressures
are not directly related to the nature of the execution tasks or to the people assigned to these
tasks. Since projects arise somewhat randomly (from external demands) and the assigned time
constraints are based on the Operation Center’s assessment of task complexity and customer
demand (without explicit consideration of the quarter in which the project would end), whether
or not these execution tasks have a planned end-date in the fourth quarter can be considered as
plausibly exogenous variation of the time pressure on execution tasks. Such variation allows me
to better identify the relationship between time pressure on execution tasks and employee-
initiated innovation.
In equation (1), β1 captures the effect of Reduced Time Pressure on Execution Tasks on the
probability of employee-initiated innovation.
Control Variables
In equation (1), I control for the expected innovation opportunity set faced by the employee
(such as factors related to task complexity or importance), performance outcomes of the
execution tasks (such as cost management and customer satisfaction), and individual-level
47
determinants for the ability to innovate. All these variables are measured during year t (i.e. 12
months leading up to the annual submission date – the end of year t).
Project characteristics include contract size (a proxy for the project’s importance and potential
complexity), total number of projects an employee worked on, and other project-level outcomes,
such as cost management and customer satisfaction. All variables are measured during year t (i.e.
for the 12 months leading up to the annual submission date).
Individual characteristics include the employee’s age, tenure, gender, and education level. Prior
research in innovation and creativity has shown that age and experience affect individual
creativity. Gender is considered relevant for risk-taking behaviors and hence may be associated
with the propensity to experiment or to deviate from behavioral norms. Education is a proxy for
the employee’s general ability. Gender and Education are static variables. Age and Tenure are
measured at the beginning of year t.
In equation (1), β represents a vector of coefficients that capture the effects of these control
variables on the probability of employee-initiated innovation.
Other Useful Variables
In half of the specifications, in addition to controlling for the above project and individual
characteristics, I also control for Past Innovation which is equal to one if the employee submitted
an innovation prototype at the end of year t-1. This variable aims to (a) further control for an
employee’s innovation propensity; (b) show whether past participation in the employee
innovation program is an important predictor of future participation.
I use a number of variables to split the sample for subsample analyses. In order to identify the
subsample of employees who are likely to have low ability or high cost of effort, I create the
variable Significantly Negative Past Outcome which is equal to one if the average of customer

48
satisfaction scores (a proxy for the quality of the execution task outcomes) across all of the
employees’ projects in the last period (year t-1) is in the lowest one-third of scores for all
employees during the same period. The rationale is that these quality outcomes on past execution
tasks contain a lot of information on the employee’s ability or cost of effort.
In order to capture whether an employee has a relatively high propensity to innovate, I construct
the variable High Propensity to Innovate which is equal to one if the employee worked in
functions close to research and development; for example, customizing existing software
products or adapting existing technical solutions for the client (rather than functions, such as
sales or business analysts, that do not require the technical skills necessary for developing
innovation prototypes). Employees in these functions are selected based on their ability to
develop products or technical solutions (some of whom used to work or will work in full-time
research and development positions) and face a low cost of experimentation when it comes to
building innovation prototypes many of which requires coding skills.
In order to capture whether a supervisor has a history of working with “innovating” employees—
which reflects how much the supervisor values innovation and is likely to loosely enforce time
constraints on execution tasks for the purpose of experimentation and innovation—I construct
the variable Innovation-nurturing Supervisor by counting whether at least two employees under
the focal employee’s current supervisor participated in the innovation program in the past period
(at the end of year t-1).
For a complete list of the main variables and their definitions, please see Table 7

49
Variable name Definition Dependent variables
Innovation = 1 if the employee submitted an innovation prototype to the employee innovation program at the end of year t (i.e. the end of March – last day of the two-week annual submission period).
Outcome = 0 if the submitted prototype didn’t receive any prize; =1 (2, 3) if the prototype received a level-3 (2, 1) prize. Score The average score given to a prototype by a panel of internal and external experts (normalized between 0 and 100). Measures for reduced time pressure Loose Enforcement ofTime Constraints
A project’s actual duration minus its predetermined time constraint (normalized by the predetermined time constraint), averaged across all of the employees’ projects during year t.
% Projects with 4th-quarter Deadlines % of projects (during year t) with a planned internal deadline in the last quarter of the fiscal year (October through December).
Project characteristics Contract Size Average of contract revenue across all of the employees’ projects during year t. Total # of Projects Total # of projects that the employee was working on during year t. Cost Management Average of how much a project is over the budgeted cost (measured in %) across all of the employees’ projects during year t. Customer Satisfaction Average of project's customer satisfaction scores across all of the employees’ projects during year t. Individual characteristics Past Innovation = 1 if the employee submitted an innovation prototype to the employee innovation program at the end of year t-1. Tenure Employee’s tenure at the company (in years) measured at the beginning of year t. Age Employee’s age (in years) measured at the beginning of year t. Male = 1 if the employee is male. Education = 1 if the employee has a bachelor’s degree or more advanced degree. Variables used to split sample Significantly Negative Past Outcome
= 1 if the average of customer satisfaction scores across all of the employees’ projects in the past period (year t-1) is in the lowest one-third of scores for all employees during the same period.
High Propensity to Innovate = 1 if the employee worked in functions close to research and development; for example,customizing existing software products or adapting existing technical solutions for the client.
Innovation-nurturing Supervisor = 1 if at least two employees innovated under this supervisor in year t-1.
Table 7. Definitions of Variables

50
3.4 Descriptive Statistics
Table 8 shows the summary statistics and Pearson’s correlation coefficients for the main
variables. On average, the predetermined time constraints on execution tasks are loosely
enforced by four percent. Note that the median for Loose Enforcement of Time Constraints is
zero; that is, the actual time taken on execution tasks is the same as the planned time, suggesting
that for the median task, the time constraint is set accurately. There is, however, considerable
variation in Loose Enforcement of Time Constraints, which is consistent with the site firm’s
decentralized model of managing and enforcing time constraints. The projects have an average
contract revenue of four million RMB and an average customer satisfaction score of 93.9 (out of
100). The employees on these projects were, on average, 26.63 years old and had been in the
firm for close to three years at the beginning of the focal year. Eighty-eight percent of the
employees are males with a college education.
Table 8 also reveals some interesting correlations between the main variables. Note that there is
no significant unconditional association between Innovation and Loose Enforcement of Time
Constraints, which is consistent with the notion that reduced time pressure on execution tasks
could have both negative and positive effects and that it is difficult to predict an unconditional
average effect. Innovation has positive (and statistically significant) correlations with contract
size, customer satisfaction, age, and tenure (the latter two are, unsurprisingly, highly correlated).
Loose Enforcement of Time Constraints has negative (and statistically significant) correlations
with contract revenue, education, and % Projects with 4th-quarter Deadlines, consistent with the
notion that the more important the project or the higher the ex ante pressure to meet its deadline,
the less discretion managers have to enforce the time constraints loosely.

Variable name Obs. Mean Median Std. dev. I. II. III. IV. V. VI. VII. VIII. IX. X. XI.
I. Innovation 1,746 0.02 0.00 0.13 1.000
II. Loose Enforcement of Time Constraints
1,746 0.04 0.00 0.18 0.017 1.000
III. Cost Management
1,746 1.60 0.46 5.39 -0.003 -0.022 1.000
IV. Customer Satisfaction
1,746 93.89 94.50 3.19 0.051 -0.028 0.122 1.000
V. Contract Size
1,746 4.14 1.46 6.27 0.113 -0.143 0.053 0.124 1.000
VI. Total # of Projects
1,746 2.30 2.00 1.70 -0.008 -0.083 -0.004 0.100 -0.018 1.000
VII. Tenure
1,746 2.85 2.08 2.23 0.145 -0.026 -0.053 0.061 -0.028 0.216 1.000
VIII. Age
1,746 26.63 26.24 3.07 0.098 0.013 -0.026 0.024 -0.027 0.101 0.585 1.000
IX. Male
1,746 0.88 1.00 0.33 0.009 -0.002 -0.040 -0.035 -0.089 0.039 -0.035 0.060 1.000
X. Education
1,746 0.88 1.00 0.32 0.020 -0.075 0.070 0.039 0.043 0.001 -0.149 -0.099 0.004 1.000
XI. % Projects with 4th-quarter Deadlines
1,746 0.40 0.39 0.33 -0.0193 -0.057 -0.103 -0.008 0.106 0.021 0.069 0.037 -0.005 0.051 1.000
Table 8. Summary Statistics and Pearson’s Correlation Coefficients
Bold indicates statistical significance at the 10% level.
52
4. Results
Testing H1: Reduced Time Pressure on Execution Tasks and Employee-initiated
Innovation
Table 9 shows the results from a logistic regression that models the probability of an employee
submitting an innovation prototype at the end of year t. The independent variable of interest is
Loose Enforcement of Time Constraints. This regression aims to test H1; that is, whether reduced
time pressure on execution tasks has no association with the probability of self-initiated
innovation. The regression in Column 1 controls for all project and individual characteristics.
The regression in Column 2 adds Past Innovation as a control variable; that is, whether the
employee submitted an innovation prototype in the last period (at the end of year t-1). The
coefficients on Loose Enforcement of Time Constraints in both columns are positive and
statistically significant, indicating that loose enforcement ofthe time constraints on execution
tasks is associated with a higher probability of self-initiated innovation after controlling for
project and individual characteristics. In Column 1, holding the control variables at their mean
value, moving Loose Enforcement of Time Constraints from its 10th percentile to its 90th
percentile would move the implied probability of self-initiated innovation from 0.85 percent to
1.05 percent, a 24.5-percent increase.

53
(1) (2)
Innovation Innovation
Loose Enforcement of Time Constraints 1.154*** 1.016**
(0.38) (0.43)
Cost Management 0.003 0.004
(0.03) (0.03)
Customer Satisfaction 0.076 0.077
(0.09) (0.08)
Contract Size 0.083*** 0.076***
(0.02) (0.02)
Total # of Projects -0.085 -0.09
(0.11) (0.10)
Tenure 0.334*** 0.307***
(0.10) (0.09)
Age 0.047 0.052
(0.07) (0.06)
Gender 0.875 0.937
(0.78) (0.71)
Education 1.167 1.033
(1.14) (1.12)
Past Innovation
1.474*
(0.78)
Obs. 1,746 1,746
Pseudo R^2 0.1668 0.1802
Table 9. Loose Enforcement of Time Constraints and Self-initiated Innovation
Innovation =1 if the employee submitted an innovation prototype at the end of year t. Loose Enforcement of Time Constraints = project’s actual duration minus its predetermined time constraint (normalized by the predetermined time constraint), averaged across all of the employee’s projects during year t. Standard errors are clustered at the employee level and reported in brackets. Significance levels are indicated by ∗, ∗∗, and ∗∗∗ for 10%, 5%, and 1%, respectively.

54
Among the control variables, contract size and an employee’s tenure at the company are
positively and significantly associated with the probability of self-initiated innovation, indicating
that work experience17 and the value (and potential complexity) of the execution tasks have a
positive impact on employee-initiated innovation. In Column 2, I find that past innovation
experience is also positively and significantly associated with innovation, consistent with the
notion that a person’s innovative propensity persists over time (or “success breeds success”, i.e.
those who have experienced the recognition and visibility associated with initiating innovation
projects are more motivated to continue their innovation efforts).
Testing H2 and H3: Employee Type and Self-initiated Innovation
To test H2, I split the sample by the presence of a significantly negative outcome on a past
execution task. I define “significantly negative past outcome” as the customer satisfaction score
on the employee’s execution tasks being in the lower one-third of scores for all employees in that
period. I choose customer satisfaction, because it is an external evaluation of the quality of an
execution task18 and reflects the employee’s underlying ability or effort aversion; highly capable
and diligent employees are much less likely to get a low customer satisfaction scores tasks.
Columns 1 and 3 of Table 10 show the logit regressions for the subsample with significantly
negative outcomes on past execution tasks. (Column 3 controls for Past Innovation, although due
to the low frequency of past innovation in this subsample, it is difficult to estimate a meaningful
coefficient on this variable.) Columns 2 and 4 show the regressions for the subsample without
significantly negative past outcomes. The coefficients are statistically significant and positive in
the subsample without significantly negative past outcomes, but negative (although not
17Tenure at the company is also related to an employee’s sense of workplace security; that is, when the employee has had a longer relationship with supervisors or other colleagues, he or she feels less likely to be punished for a small mistake. 18 I didn’t choose the other project outcome cost management because it is directly related to the time pressure on execution tasks (the independent variable of interest) and does not directly measure the task output.

55
statistically significant) in the subsample with significantly negative past outcomes. These results
are consistent with H2, suggesting that employees use the reduced time pressure more effectively
in generating innovation output when they do not have low ability or high cost of effort.
To test H3, I split the sample by preexisting propensity to innovate. The data on team members
indicate whether an employee was in an R&D role for the execution task; that is, he or she had to
customize an existing product or technical solution for the client (as opposed to the nontechnical
roles on the team, such as business analyst).19 To the extent that those who were in these roles
have a higher ability or a lower cost for experimenting with new ideas or developing prototypes,
they were the type of employee with a higher propensity to innovate in this setting. Columns 1
and 3 of Table 11 show the logit regression results for the subsample of employees with a high
propensity to innovate, while Columns 2 and 4 show the results for the subsample with a low
propensity to innovate. The coefficients for Loose Enforcement of Time Constraints are positive
across all columns, but the magnitudes are much larger in Columns 1 and 3 (although not
statistically significant). This is consistent with H3: employees with a high propensity to
innovate would make better use of the reduced time pressure in order to innovate than those with
a low propensity to innovate would do.
19Note that these are not the employees who work in full-time R&D roles, such as developing the company’s planned new products or technologies. Those employees (a small proportion of the company’s workforce) are not solution-deployment project team members and are therefore not in my sample.

56
(1) (2) (3) (4)
Significantly Negative Past Outcome
No Significantly Negative Past Outcome
Significantly Negative Past Outcome
No Significantly Negative Past Outcome
Loose Enforcement of Time Constraints -1.605 2.830** -2.193 3.089***
(1.09) (1.18) (1.93) (1.12)
Cost Management -0.688 -0.004 -0.723 0.003
(1.64) (0.05) (1.50) (0.05)
Customer Satisfaction -0.18 -0.098 -0.204* -0.137
(0.14) (0.14) (0.12) (0.13)
Contract Size 0.190* 0.091*** 0.186* 0.073**
(0.11) (0.03) (0.10) (0.03)
Total # of Projects -0.03 -0.034 -0.055 -0.034
(0.47) (0.11) (0.49) (0.10)
Tenure 0.584*** 0.478*** 0.580*** 0.462***
(0.14) (0.13) (0.16) (0.14)
Age 0.323 -0.003 0.32 -0.007
(0.25) (0.11) (0.24) (0.11)
Gender
0.881
1.018
(0.87)
(0.91)
Education
1.643
1.4
(1.36)
(1.31)
Past Innovation
n.e. 2.327***
(0.89)
Obs. 294 775 290 775 Pseudo R^2 0.3851 0.209 0.4014 0.2588
Table 10. Employees With versus Without Significantly Negative Outcomes on Past Execution Tasks
Innovation =1 if the employee submitted an innovation prototype at the end of year t. Loose Enforcement of Time Constraints = project’s actual duration minus its predetermined time constraint (normalized by the predetermined time constraint), averaged across all of the employee’s projects during year t. Significantly Negative Past Outcome =1 if the average of customer satisfaction scores across all of the employee’s projects in the past period (year t-1) is in the lowest one-third of scores for all employees during the same period. Standard errors are clustered at the employee level and reported in brackets. Significance levels are indicated by ∗, ∗∗, and ∗∗∗ for 10%, 5%, and 1%, respectively.

57
(1) (2) (3) (4)
High Propensity to Innovate
Low Propensity to Innovate
High Propensity to Innovate
Low Propensity to Innovate
Loose Enforcement of Time Constraints 6.717 1.760*** 7.084 1.901***
(4.75) (0.55) (4.76) (0.60)
Cost Management 0.023 -0.098 0.027 -0.106
(0.06) (0.17) (0.06) (0.18)
Customer Satisfaction 0.101 -0.036 0.081 -0.04
(0.13) (0.08) (0.13) (0.09)
Contract Size 0.038 0.111*** 0.043 0.117***
(0.05) (0.03) (0.04) (0.03)
Total # of Projects -0.222 -0.218 -0.242 -0.233
(0.16) (0.22) (0.16) (0.23)
Tenure 0.332*** 0.546*** 0.330*** 0.578***
(0.11) (0.12) (0.11) (0.15)
Age 0.126 -0.221* 0.118 -0.237
(0.08) (0.13) (0.08) (0.15)
Gender
0.435
0.439
(0.83)
(0.87)
Education 0.057
0.043
(1.83)
(1.60)
Past Innovation
1.325** -0.781
(0.60) (1.15)
Obs. 260 1026 260 1026 Pseudo R^2 0.2051 0.3739 0.2291 0.3744
Table 11. Employees with High versus Low Propensity to Innovate
Innovation =1 if the employee submitted an innovation prototype at the end of year t. Loose Enforcement of Time Constraints = project’s actual duration minus its predetermined time constraint (normalized by the predetermined time constraint), averaged across all of the employee’s projects during year t. High Propensity to Innovate =1 if the employee worked in functions close to research and development; for example, customizing existing software products or adapting existing technical solutions for the client. Standard errors are clustered at the employee level and reported in brackets. Significance levels are indicated by ∗, ∗∗, and ∗∗∗ for 10%, 5%, and 1%, respectively.

58
Testing H4: Relational Contract and Self-initiated Innovation
H4 tests whether the association between reduced time pressure on execution tasks and
employee-initiated innovation is more positive when the supervisor has a history of working with
“innovating” employees; I refer to such supervisors as “innovation-nurturing.” An employee
could reasonably expect that the supervisor would loosely enforce the time constraints on
execution tasks and tolerate the use of extra time for experimentation or innovation when there is
a preexisting innovation environment under that supervisor. Columns 1 and 3 of Table 12 show
the regression results for the subsample of employees whose current supervisor had a history of
working with innovating employees, while Columns 2 and 4 show the regression results for the
subsample of employees whose current supervisor did not. We can see that the magnitudes (and
statistical significance) of the coefficients on Loose Enforcement of Time Constraints are much
greater in Columns 1 and 3 than in Columns 2 and 4. This is consistent with H4.
Quality of Innovation
Table 13 shows the OLS regression results for estimating the effect of Loose Enforcement of
Time Constraints on the quality of the submitted innovation prototypes. Column 1 uses the prize
level as the dependent variable, while Column 2 uses the score given by the panel of internal and
external exports. Year fixed effects are included in the regression. Although the sample of
submitted innovation prototypes with evaluation outcomes is small, I find that Loose
Enforcement of Time Constraints seems to have a positive and statistically significant effect on
the quality of these prototypes, consistent with the idea that more time released from execution
tasks is associated with more time spent on innovation activities, leading to not only higher
probability of employee-initiated innovation, but also higher-quality innovation output.
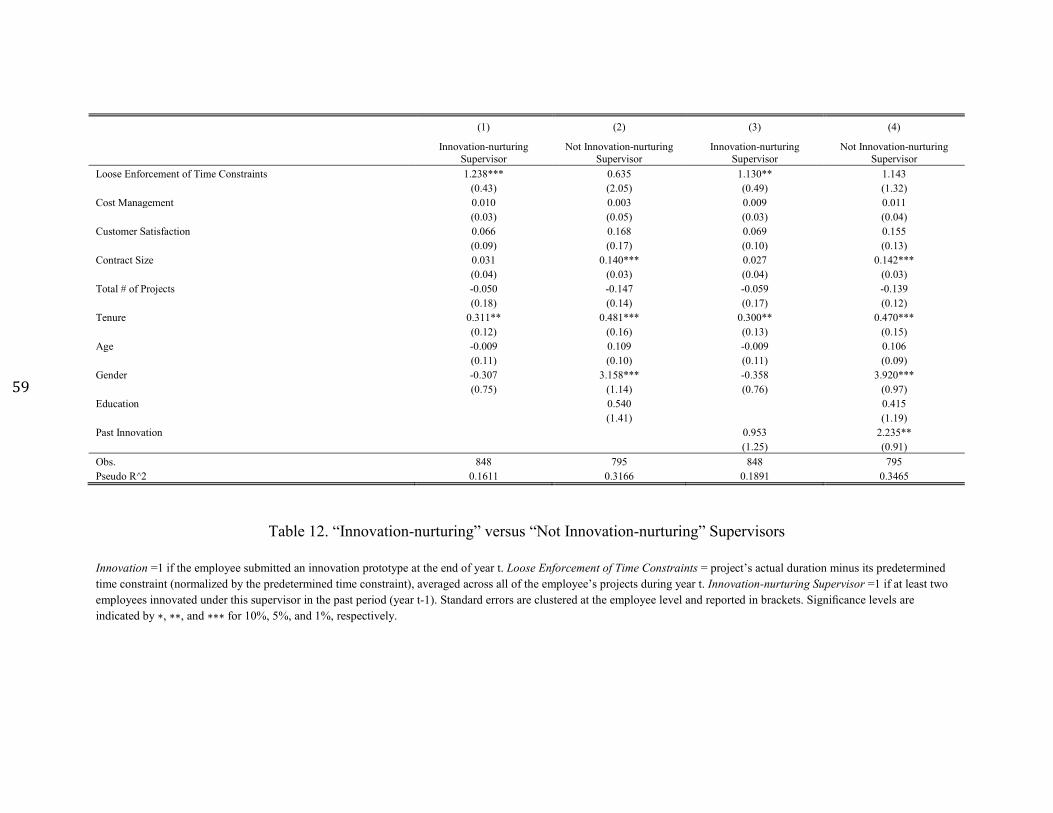
59
(1) (2) (3) (4)
Innovation-nurturing Supervisor
Not Innovation-nurturing Supervisor
Innovation-nurturing Supervisor
Not Innovation-nurturing Supervisor
Loose Enforcement of Time Constraints 1.238*** 0.635 1.130** 1.143
(0.43) (2.05) (0.49) (1.32)
Cost Management 0.010 0.003 0.009 0.011
(0.03) (0.05) (0.03) (0.04)
Customer Satisfaction 0.066 0.168 0.069 0.155
(0.09) (0.17) (0.10) (0.13)
Contract Size 0.031 0.140*** 0.027 0.142***
(0.04) (0.03) (0.04) (0.03)
Total # of Projects -0.050 -0.147 -0.059 -0.139
(0.18) (0.14) (0.17) (0.12)
Tenure 0.311** 0.481*** 0.300** 0.470***
(0.12) (0.16) (0.13) (0.15)
Age -0.009 0.109 -0.009 0.106
(0.11) (0.10) (0.11) (0.09)
Gender -0.307 3.158*** -0.358 3.920***
(0.75) (1.14) (0.76) (0.97)
Education
0.540
0.415
(1.41)
(1.19)
Past Innovation
0.953 2.235**
(1.25) (0.91)
Obs. 848 795 848 795 Pseudo R^2 0.1611 0.3166 0.1891 0.3465
Table 12. “Innovation-nurturing” versus “Not Innovation-nurturing” Supervisors
Innovation =1 if the employee submitted an innovation prototype at the end of year t. Loose Enforcement of Time Constraints = project’s actual duration minus its predetermined time constraint (normalized by the predetermined time constraint), averaged across all of the employee’s projects during year t. Innovation-nurturing Supervisor =1 if at least two employees innovated under this supervisor in the past period (year t-1). Standard errors are clustered at the employee level and reported in brackets. Significance levels are indicated by ∗, ∗∗, and ∗∗∗ for 10%, 5%, and 1%, respectively.
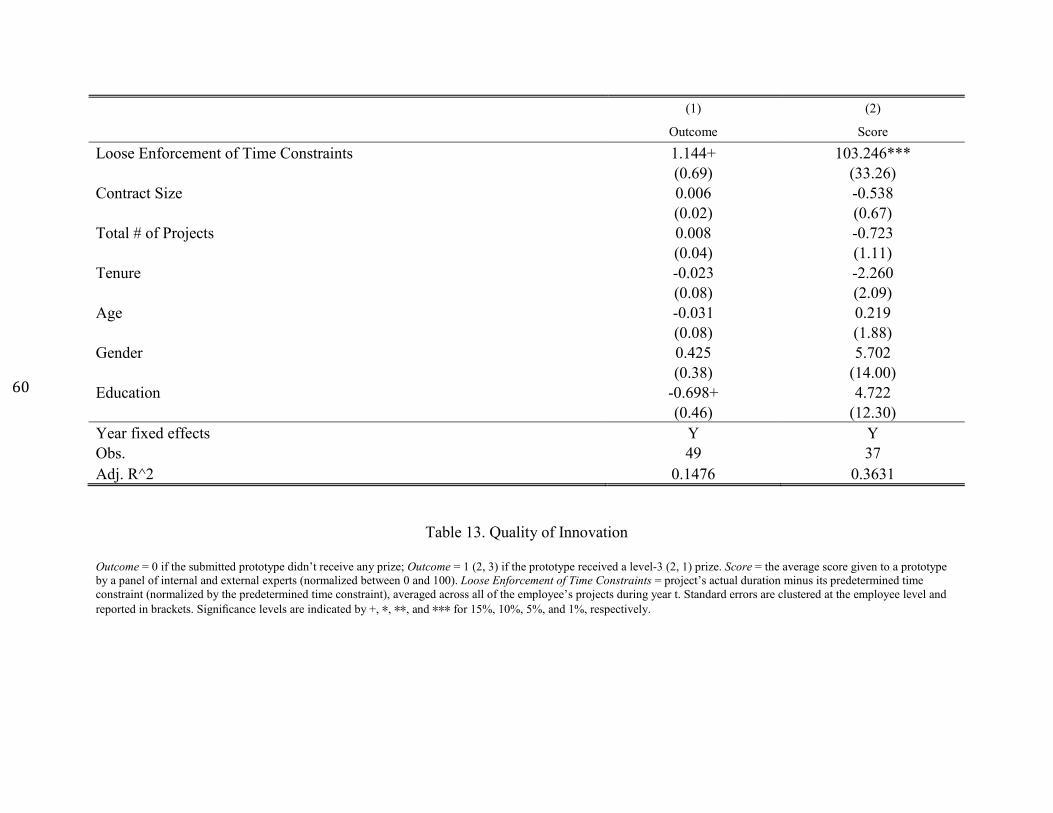
60
(1) (2)
Outcome Score
Loose Enforcement of Time Constraints 1.144+ 103.246***
(0.69) (33.26)
Contract Size 0.006 -0.538
(0.02) (0.67)
Total # of Projects 0.008 -0.723
(0.04) (1.11)
Tenure -0.023 -2.260
(0.08) (2.09)
Age -0.031 0.219
(0.08) (1.88)
Gender 0.425 5.702
(0.38) (14.00)
Education -0.698+ 4.722
(0.46) (12.30)
Year fixed effects Y Y Obs. 49 37 Adj. R^2 0.1476 0.3631
Table 13. Quality of Innovation
Outcome = 0 if the submitted prototype didn’t receive any prize; Outcome = 1 (2, 3) if the prototype received a level-3 (2, 1) prize. Score = the average score given to a prototype by a panel of internal and external experts (normalized between 0 and 100). Loose Enforcement of Time Constraints = project’s actual duration minus its predetermined time constraint (normalized by the predetermined time constraint), averaged across all of the employee’s projects during year t. Standard errors are clustered at the employee level and reported in brackets. Significance levels are indicated by +, ∗, ∗∗, and ∗∗∗ for 15%, 10%, 5%, and 1%, respectively.

61
Alternative Measure of Time Pressure on Execution Tasks
An alternative and plausibly more exogenous measure of reduced time pressure on execution
tasks is % of Projects with 4th-quarter Deadlines. As explained earlier, projects arrive at the
company at a pace exogenous to individual employees’ or their supervisors’ control and are
assigned based on factors mostly outside of employees’ control. However, some projects would
be less likely to be granted reduced time pressure because their planned end-dates happen to fall
in the fourth quarter, when many year-end activities unrelated to specific execution tasks make it
difficult to be flexible. Therefore, % Projects with 4th-quarter Deadlines is an alternative and
more exogenous measure of the variation in the time pressure on these execution tasks. More
projects with fourth-quarter deadlines indicates higher (ex ante) time pressure on an employee’s
execution tasks. Table 14 shows the logit regression results with this alternative measure of time
pressure on execution tasks. We find that % Projects with 4th-quarter Deadlines has a negative
and statistically significant association with the probability of innovation, suggesting that higher
(ex ante) time pressure on execution tasks makes self-initiated innovation less likely. The results
from this alternative measure give us greater confidence in the positive relation between reduced
time pressure on execution tasks and employee-initiated innovation.
Alternative Measurement Window for Loose Enforcement of Time Constraints
One concern for this study is reverse causality: Could it be that employees first allocate more
time from execution tasks to innovation activities which then leads their supervisors to loosely
enforce the time constraints for execution tasks? I already measure Loose Enforcement of Time
Constraints over the 12 months leading up to the submission of the innovation prototype. To
further alleviate the concern of reverse causality, I instead construct Loose Enforcement of Time
Constraints between 6 and 18 months leading up to the annual submission of the innovation

62
prototypes and re-run the baseline regressions. Given the short prototype development cycle in
the software industry, it is unlikely that a prototype submitted at the end of year t could have
caused project delays 6 to 18 months earlier. Table 15 shows the logit regression results for this
alternative measurement window. Consistent with Table 9, the coefficients on Loose
Enforcement of Time Constraints are positive and statistically significant 20 .
20 The fact that supervisors on these execution tasks exhibit considerable variations in their styles of enforcing the time constraints on execution tasks even before the start of the innovation program and that they are not explicitly rewarded for their subordinates’ participation in the innovation program alleviates the concern that supervisors systematically allocate “slack time” to the employees who are more likely to participate and succeed in innovation. However, the research design here cannot completely rule out the possibility that some supervisors may be implicitly incentivized to encourage employee innovation and are able to strategically assign more “slack time” to those who can use the time to participate in innovation.

63
(1) (2)
Innovation Innovation % Projects with 4th-quarter Deadlines -1.209** -1.187**
(0.55) (0.52)
Cost Management -0.013 -0.012
(0.03) (0.03)
Customer Satisfaction 0.067 0.068
(0.08) (0.07)
Contract Size 0.089*** 0.082***
(0.02) (0.02)
Total # of Projects -0.080 -0.085
(0.11) (0.10)
Tenure 0.352*** 0.329***
(0.09) (0.09)
Age 0.055 0.058
(0.07) (0.06)
Gender 1.111 1.205
(0.78) (0.74)
Education 1.246 1.119
(1.15) (1.13)
Past Innovation
1.491**
(0.74)
Obs. 1746 1746 Pseudo R^2 0.1763 0.1902
Table 14. Alternative Measure for Reduced Time Pressure on Execution Tasks
Innovation =1 if the employee submitted an innovation prototype at the end of year t. % Projects with 4th-quarter Deadlines = % of projects with a planned internal deadline in the last quarter of the fiscal year (October through December) during year t. Standard errors are clustered at the employee level and reported in brackets. Significance levels are indicated by ∗, ∗∗, and ∗∗∗ for 10%, 5%, and 1%, respectively.

64
(1) (2)
Innovation Innovation Loose Enforcement of Time Constraints 1.585*** 1.597***
(0.37) (0.37)
Cost Management 0.025 0.022
(0.03) (0.03)
Customer Satisfaction 0.082 0.08
(0.09) (0.09)
Contract Size 0.091*** 0.087***
(0.02) (0.02)
Total # of Projects 0.079 0.082
(0.10) (0.10)
Tenure 0.392*** 0.368***
(0.09) (0.09)
Age -0.005 -0.006
(0.07) (0.07)
Gender 1.172 1.166
(0.80) (0.76)
Education 2.085* 1.926
(1.20) (1.20)
Past Innovation
1.457*
(0.75)
Obs. 2014 2014 Pseudo R^2 0.1841 0.1977
Table 15. Alternative Measurement Window for Loose Enforcement of Time Constraints
Innovation =1 if the employee submitted an innovation prototype at the end of year t. Loose Enforcement of Time Constraints = project’s actual duration minus its predetermined time constraint (normalized by the predetermined time constraint), averaged across all of the employee’s projects measured between 6 and 18 months leading up to the end of year t. Standard errors are clustered at the employee level and reported in brackets. Significance levels are indicated by ∗, ∗∗, and ∗∗∗’ for 10%, 5%, and 1%, respectively.

65
5. Conclusion
This paper uses archival data from a software company’s solution-deployment teams to examine
the relationship between reduced time pressure on employees’ execution tasks and the
probability of employee-initiated innovation. Using a logistic regression at the employee-year
level, I find that reduced time pressure on execution projects is significantly associated with a
higher probability of self-initiated innovation after controlling for project and individual
characteristics. Consistent with prior research in employee selection and relational contracts, this
effect is more positive (a) for employees without significantly negative outcomes on past
execution tasks, (b) for employees with a greater preexisting propensity to innovate, and (c)
when the project supervisor has a history of working with “innovating” employees. Conditional
on submitting innovation prototypes, loose enforcement of time constraints on execution tasks is
also significantly associated with higher-quality innovation. The main results are robust to (a) an
alternative measure of reduced time pressure on execution tasks that exploits more exogenous
variations in the ex ante pressure to meet time constraints on these tasks and to (b) alternative
measurement windows.
Together, these results suggest that reduced time pressure on execution tasks could motivate
bottom-up innovation and that employee selection and relational contracts, play an important
role in facilitating innovation.
This study is subject to some caveats. First, it focuses on bottom-up innovation in a research site
without a high level of preexisting slack or inefficiencies in execution tasks. This limits the
generalizability of the findings (although the conditions under which loose enforcement of time
constraints on execution tasks is positively associated with employee-initiated innovation should
be more robust to a change in research setting than the average effect is). Second, this paper only
looks at one form of reduced time pressure on execution tasks—loose enforcement of
66
predetermined time constraints—as it is the most relevant form of slack time in this particular
setting. Future research could examine whether and how other forms of slack-time practice, such
as a formal “innovation time off” policy for all employees and slack time granted at the team
level, could affect innovation.
67
Chapter 3 – Norms, Initial Control Environments, and Employee Experimentation
1. Introduction
Empowering employees to take initiatives and experiment with their tasks at workplace has long
been understood as an important tool to motivate creativity, problem-solving, and productivity.
Such employee empowerment sometimes involves the removal or loosening of previously strict
(e.g. rule-based) formal control systems, which creates two concerns: (1) what if there is not
enough employee experimentation despite the formally granted permission to do so? (2) What if
there is too much experimentation that the organization faces the risk of losing control (e.g.
opportunistic behaviors, decisions of poor quality, lack of coordination, etc.)? In order to address
these concerns, one empirical question needs to be answered first: in the absence of a formal
control system, how would local experimentation occur? Are there certain informal control
mechanisms? If so, what factors play a role in building and sustaining these informal
mechanisms?
This chapter studies whether a particular form of informal control mechanisms, conformity to
social norms, shapes the degree of employee experimentation after the removal of formal control
systems; and examines whether the effect of such social norms depend on the initial control
environment an employee was exposed to. Specifically, we hypothesize that informal control
mechanisms (such as norms) rely on relational contracts (i.e. collaboration or informal
agreements enforced by the shadow of future). Using employees’ exposure to different initial
control environments as proxy for different perceptions of the credibility and clarity of the
relational contract underlying the emerging norms, we test how the emergence of informal
control mechanisms is affected by exposure to initial control environments, as well as predictions
derived from relational contract theories.

68
The extant management accounting research largely focuses on the study of formal control
systems. Prior literature has shown that the adoption or existence of formal control systems can
have an impact on employees’ behaviors and organizational performance (Sandino, 2007;
Shields et al. 2000; Taylor and Pierce 1999). However, there is little empirical evidence on how
the removal or absence of formal control systems would affect the emergence of informal control
mechanisms and the degree of employee experimentation in a real-world setting. We address this
gap using personnel data and loan data from an organization that underwent a radical
decentralization in decision-making rights, i.e. employees who used to have no discretion in
making loan decisions were given the decision rights in approving and structuring loans since the
decentralization. This setting allows us to observe whether employees’ degree of
experimentation in loan decisions followed certain informal control mechanisms after the formal
rule-based decision system was removed. We explore the variations within the organization in
whether the employees were initially exposed to the old control environment (i.e. the formal
rule-based control system where there was no experimentation) or the new control environment
(i.e. the environment that empowers employees with the authority to experiment on loan
decisions), as well as the time-series dynamics of how employees adjusted the degree of
experimentation relative to their leaders’ and their group’s average degree of experimentation.
In particular, we make use of the feature that this organization provided a rate-sheet to
employees for deciding what rate should be given to a loan. Under the old system, this rate-sheet
dictated the rate given to a certain loan by providing the standard rates an employee had to
follow. Under the new system, the rate-sheet simply provided a benchmark. Employees were
given complete authority to decide whether they would follow the rate-sheet rates or to what
extent they would follow such rates. The rate-sheet rates offer a natural and objective benchmark
69
for us to accurately assess employees’ use of discretion on each loan – which is our measure for
an employee’s degree of experimentation with respect to deciding the loan rate. Moreover, it
allows us to measure the aggregate degree of experimentation used by a group (i.e. branch or
department) or an employee’s leader during a given time period, which enables us to examine
how an employee’s degree of experimentation on loan decisions were affected by the group
norm or leaders’ behaviors. Secondly, employees who were hired into the old system (OLD
employees) used to rely on rate-sheet rates for all loan decisions and were then told to make their
own decisions, while employees hired into the new system (NEW employees) started with
making their own decisions right away. In our research setting, the interesting contrast between
these two groups of employees serves as an indicator for differences in initial control
environments and provides us with a unique opportunity to examine in a real-world setting
whether differences in initial control environments lead to differences in employees’ perceived
credibility (i.e. whether they believe management’s promise of granting them unrestricted
decision-making authority) and clarity (i.e. whether they understand what actions are expected
from them in terms of exercising decision-making authority) of the underlying relational
contracts, and hence differences in the degree to which employees conform to others’ behaviors.
Our study finds that informal control mechanisms, in the form of conforming to others’
behaviors (e.g. leaders’ behaviors or group norms), do emerge and provide powerful guidance
for employees’ decision-making when formal control systems are removed. The effect of such
informal mechanism depends on which initial control environment an employee is exposed to.
Compared to NEW employees, OLD employees are likely to perceive management’s promise of
granting unrestricted decision-making authority to be less credible. Therefore, they will be more
likely to follow leaders’ behaviors assuming that acting within the boundary set by the leaders’

70
(i.e. members of the management) behaviors would offer a “safe ground” that reduces
management’s reneging temptations. We also show that the effect of such informal control
mechanisms comes from employees’ perceived credibility of management’s promise, rather than
actual punishment for exerting too much discretion in decision-making. Furthermore, OLD
employees have a different understanding of what actions are expected from them in terms of
exercising this newly gained decision-making authority, since they were trained to understand
and respect rules and are more aware of the risks associated with deviating from rules. Therefore,
they will be more likely to follow the group norm knowing that the group norm likely embodies
a shared understanding of appropriate actions.
This study makes three primary contributions. First, we contribute to the literature in
management accounting on the impact of change in formal control systems and the effect of
informal control mechanisms. Our research sheds light on addressing the challenge of balancing
employee empowerment and the risk of losing control by showing the emergence of informal
control mechanisms and how initial control environments play a role in building and sustaining
such informal mechanisms. Prior research in management accounting has mostly focused on
formal control systems, leaving informal control mechanisms largely unexamined. Moreover, the
study of formal control systems has focused on the adoption or existence of formal control
systems, rather than what would happen after the removal or in the absence of formal control
systems. We provide direct empirical evidence on how the removal of formal control systems
could affect employees’ decision-making. We show that in addition to formal control systems,
“unofficial norms” such as leaders’ behaviors and group norms could provide powerful
instructions in guiding employee behaviors. The effect of such informal control mechanisms
becomes more visible when the formal control system is removed or absent.

71
Second, we contribute to the literature on relational contracts by providing empirical evidence
testing predictions derived from the relational contract theories. Many successful organizations
obtain competitive advantages from management practices that rely on informal agreements such
as relational contracts and hence are difficult to imitate. Gibbons and Henderson (2012)
hypothesize that building and sustaining relational contracts requires solving two problems: the
problem of credibility and the problem of clarity. Credibility refers to the problem of
“persuading others that one is likely to keep one’s promises”. Clarity refers to the problem of
“communicating the terms of the relational contract”. In our setting, NEW and OLD employees
perceived the credibility of management’s promise differently and have different understanding
of the terms of the emerging relational contracts. This allows us to test whether a difference in
the perception of credibility and clarity can lead to different relational contracts and different
behaviors that underlie the informal control mechanisms. Our empirical work explores the
emergence of relational contracts within organizations, tests how the problem of credibility and
clarity shapes the building of relational contracts, and shows the power of relational contract
theories in explaining management practices that rely on such informal mechanisms (e.g. norms,
culture, etc.)
Third, our study contributes to understanding the lasting effect of formal control systems on
individuals’ subsequent decisions or behaviors. Tayler and Bloomfield (2010) use lab
experiments to demonstrate that formal control systems directly influence people’s sense of what
behaviors are appropriate in the setting and indirectly alter people’s tendency to conform to the
behaviors of those around them. They also show that these effects persist even after the controls
are changed, suggesting that initial control environment could leave a long-lasting effect on
individual behaviors. Similarly, our study shows how initial formal control environment can
72
affect individuals’ decision-making and leave a long-lasting effect by providing, to the best of
our knowledge, the first empirical evidence from a real workplace setting. In contrast to the prior
study, we show that other than changing individuals’ psychological motivations by activating
either self-interested or socially-interested personal norms (Tayler and Bloomfield 2010), the
initial formal control environment can affect how individuals perceive the credibility and clarity
of the relational contracts underlying organizational practices. Exposure to strong formal control
environments do not necessarily lead to less conformity to others’ behaviors by activating
individuals’ self-interested personal norms as suggested by Tayler and Bloomfield (2010).
Rather, it could lead to more conformity to others’ behaviors, since those initially exposed to
strong formal control systems are likely to “seek control” by following leaders’ behaviors or
group norms due to a lowered perceived credibility of management’s promises or a greater
difficulty in understanding what actions are expected in the new environment. Therefore,
whether the formal control system would lead to more or less social conformity is likely to
depend on the specific decision or task at hand (e.g. making a business decision versus making a
public donation decision), the type of initial formal control systems under examination (e.g.
centralized decision rules versus audit), as well as the situations surrounding particular relational
contracts between particular parties. Our study indicates that further research would yield deeper
insights on this topic.
The remaining of the paper proceeds as follows. Section 2 presents a review of relevant literature
and develops hypotheses. Section 3 presents the research setting and data. Section 4 discusses the
empirical tests and the results from the analyses. Finally, Section 5 concludes.
73
2. Literature Review and Hypotheses Development
2.1 Formal control systems and informal control mechanisms
There is a long tradition for organizations to use formal management control systems as tools for
implementing goals set by the strategic planning processes and reducing deviations from
established guidelines. Formal management control systems are “information-based routines and
procedures managers used to maintain or alter patterns in organizational activities” (Simons,
1995). Extant literature on management control systems has mostly focused on the study of such
formal control systems, especially the impact of adopting various formal control systems on
employee behaviors and organizational performance (Shields et al. 2000, Sandino 2007).
However, it has long been emphasized in organization theory the importance of some informal
control mechanisms within organizations. As the mix of industries and the nature of job tasks
change, organizations recognize the need to delegate more decision-making authority to lower-
level employees whose active learning, experimentation, and adaptation are critical to satisfying
customer needs and developing innovative products or services. Consequently, formal control
mechanisms that aim to reduce deviation by dictating behavioral rules either become less
relevant or need to be complemented by alternative control mechanisms.
Research on social control has shown us some informal control mechanisms that could be at play
in addition to (and/or in the absence of) formal control systems. Ouchi (1979) illustrates how
“clan control”, a control approach based on social norms, dominates formal control mechanisms
in environments that require significant innovation from employees (such as an R & D
department). Prior research in psychology has also shown that norms (even those without a direct
economic impact) can exert powerful influences on behavior (Cialdini, Kallgren and Reno,
1991). Kreps (1984) provides an economic framework to model corporate culture, in which he

74
claims that control in organizations can be based on adherence to the corporate culture, a focal
principle establishing general principles that should be applied when members make decisions or
coordinate behaviors. Costly communication to accommodate local adaptations would render
infeasible the completely centralized decision-making under the formal rule-based control
system. Yet it would be advantageous to have some consistency or coordination in the
decentralized decisions. Adherence to certain general principles, as Kreps suggests, is very likely
to emerge within organizations (even in the presence of formal control systems).
However, there’s little empirical research on how the removal or absence of formal control
systems would affect employee behaviors and the emergence of potential informal control
mechanisms. More specifically, what types of informal control mechanisms would emerge and
what factors would play a role in forming such informal control mechanisms is unclear. Prior
studies in economics, sociology, and psychology have shown that social norms or social
incentives are quite prevalent in workplace (Akerlof and Kranton 2005). In this paper, we set out
to test whether a particular form of informal control mechanism, conformity to others’ behaviors,
would emerge after the removal of formal control systems and how such informal control is
affected by employees’ exposure to different initial control environments.
2.2 The effect of initial control environments
Management accounting research on initial control environments provides some evidence on
formal control systems’ lasting effect on employee behaviors. We argue that such lasting effects
from past control environments would affect the emergence of informal control mechanisms
after the removal of formal control systems. Tayler and Bloomfield (2010) use lab experiments
to demonstrate that the formal control systems people are initially exposed to can alter their
tendency to conform to the behaviors of those around them. Different from our study, their
75
research focuses on how initial formal control systems (in the form of auditing) can activate
different personal norms in a public-goods game. Strong formal control systems (i.e. high
probability of being audited) activate self-interested personal norms (rather than socially-
interested personal norms) and hence lead to less conformity to others’ behaviors when it comes
to contributing money to public goods. Our study, however, does not focus on the effect of
formal control systems on social conformity through psychological motivations in public-goods
settings. Rather, we focus on the effect of formal control systems through how past control
environments affect building and sustaining the relational contracts that underlie the emergence
of informal control mechanisms in the setting of decentralizing decision rights within
organizations. People who were exposed to a formal control system characterized by “command
and control” and strictly following centralized decision rules are likely to perceive management’s
promise of unrestricted decision-making discretion to be less credible, and hence more likely to
follow leaders’ behaviors as a “safe ground” to reduce management’s reneging temptations.
Also, their understanding of what actions are expected with this newly gained decision-making
authority would be different from NEW employees, which makes them more likely to follow
group norms as an external benchmark for what they consider “shared understanding” of the
terms in the relational contracts.
2.3 The lens of relational contracts
In economics, relational contract is collaboration or informal agreements sustained by the
shadow of the future. Many management practices require relational contracts because such
practices involve actions that cannot be fully specified in advance. In our setting, after the radical
decentralization of decision rights, employees were given and encouraged to use complete
decision-making authority over virtually any decision involving a member as long as the

76
employee is doing “what is right” for the member21. To encourage the effective use of decision-
making authority, a general framework (the “MOE” framework, i.e. when making decisions, first
consider the members, then the organization, then the employees) had been offered to help
employees set their priorities in a particular situation. However, management cannot define in
advance exactly “what is right” (e.g. the “right” interest rates) for a particular member, a
particular loan, at a particular time and location. Also, what “MOE” means in terms of actual
actions in a specific scenario had to be worked out over time (and will remain difficult to
communicate to outsiders). Because these actions cannot be specified in advance, it is usually
impossible to motivate employees’ performance or control their behaviors with formal contracts
or formal control systems. This is when informal control mechanisms that rely on relational
contracts play an important role.
There is a huge theoretical literature on how relational contract can facilitate efficient behaviors,
both on their own and with formal contracts (Bull 1987, Levin 2003, Baker et al. 1999, 2002,
2011, Malcomson 2012). Relational contract is typically modeled as a repeated game of
“cooperation versus defection”. The message is that if players are sufficiently patient (i.e. with a
low discount rate or expecting the game to last for a long time), it is optimal to cooperate by
foregoing the short-term temptation of breaking promises for the long-term gain of cooperation.
That is, cooperation may be met with defection, but under some circumstances, defection can be
met with enough punishment to induce cooperation. The potential actions for cooperation,
defection, and punishment between employees and the management in our setting are sketched in
Table 16.
21Our setting is in a credit union (more details on the setting in Section 3). Credit unions differ from traditional banks in that they are mutually owned and organized by their depositors. Due to the mutual ownership structure, credit unions typically refer to customers as “members”.
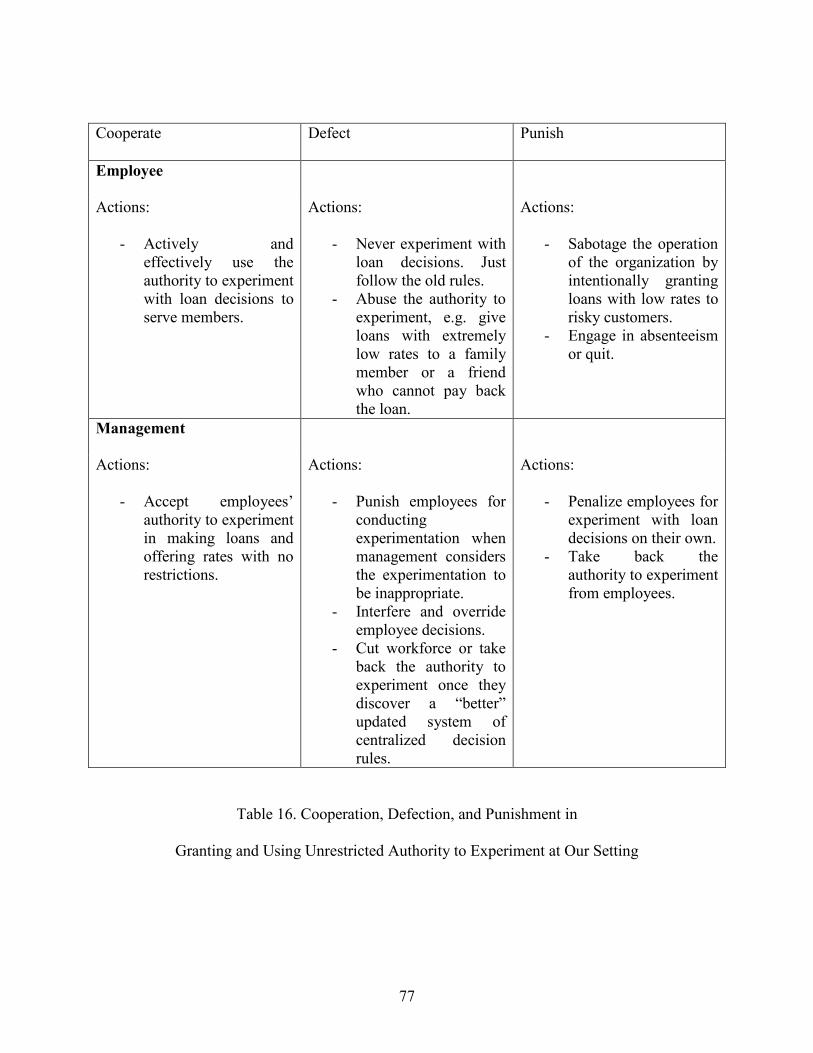
77
Cooperate Defect Punish
Employee
Actions:
- Actively and effectively use the authority to experiment with loan decisions to serve members.
Actions:
- Never experiment with loan decisions. Just follow the old rules.
- Abuse the authority to experiment, e.g. give loans with extremely low rates to a family member or a friend who cannot pay back the loan.
Actions:
- Sabotage the operation of the organization by intentionally granting loans with low rates to risky customers.
- Engage in absenteeism or quit.
Management
Actions:
- Accept employees’ authority to experiment in making loans and offering rates with no restrictions.
Actions:
- Punish employees for conducting experimentation when management considers the experimentation to be inappropriate.
- Interfere and override employee decisions.
- Cut workforce or take back the authority to experiment once they discover a “better” updated system of centralized decision rules.
Actions:
- Penalize employees for experiment with loan decisions on their own.
- Take back the authority to experiment from employees.
Table 16. Cooperation, Defection, and Punishment in
Granting and Using Unrestricted Authority to Experiment at Our Setting
78
Gibbons and Henderson (2012) argue that building and refining relational contracts require
solving two problems: the problem of credibility and the problem of clarity. The problem of
credibility refers to the problem of persuading others that one is likely to keep one’s promises. It
is about whether the other party will believe one’s promises. In our setting, in order to build
relational contracts management needs to believe employees’ promise of effectively using (and
not abusing) the decision-making authority granted to them, while employees need to believe
that management’s promise of not taking back the decision-making rights or punishing people
for using such rights. OLD and NEW employees are likely to have different perceptions of how
credible management’s promises are. OLD employees, having witnessed the consequences of
breaking rules and being punished under the previous rule-based formal control system,
understand that despite what management says they still retain the power of final explanation
with respect to the new decision-making system and can take back the decision-making rights or
punish someone if they want. This leads to an increased level of perceived possibility that
management will renege on their promises. Therefore, we expect OLD employees to follow
leaders’ behaviors (which we operationalize as leaders’ degree of experimentation in offering
loan rates) more closely than NEW employees, since following leaders’ (who are members of the
management) behaviors provides a “safe ground”, i.e. leaders would be less likely to punish
employees or break their promises if employees are acting within the boundary set by leaders’
actions.
H1a: Holding loan, borrower, and employee characteristics constant, OLD employees
will follow leaders’ degree of experimentation more closely than NEW employees when
offering rates on loans.

79
Furthermore, to test that OLD employees’ closer following of leaders’ behaviors is really driven
by a lower perceived credibility of management’s promises, we hypothesize:
H1b: OLD employees will follow leaders’ degree of experimentation more closely when
they perceive an increase in management’s temptation to renege on their promises
(which we operationalize as when charge-off rates on loans become high).
The problem of clarity refers to the problem of communicating the terms of the relational
contract. It is about whether the other party understands one’s promises. In our setting, both
management and employees need to understand the scope of employees’ decision-making rights,
what actions are appropriate given the circumstances, and potential boundary conditions. OLD
employees, trained to understand and respect the rules (e.g. following the standard rate-sheet
rates) and more aware of the risks associated with deviating from such rules, would have more
difficulty understanding what this newly gained authority to experiment means and are more
likely to gravitate toward an external benchmark of the group’s shared understanding of
appropriate actions, i.e. group norms (which we operationalize as the branch or department’s
average degree of experimentation in offering loan rates).
H2a: Holding loan, borrower, and employee characteristics constant, OLD employees
will follow group average degree of experimentation more closely than NEW employees
when offering rates on loans.
Furthermore, we argue that in situations where risk is high and it is more uncertain what the
appropriate actions should be, OLD employees would gravitate even more toward the group
norm as an external benchmark for the shared understanding of appropriate actions.

80
H2b: OLD employees will follow group average degree of experimentation more closely for
loans that are riskier (which we operationalize as loans whose applicants have credit scores
lower than 620).
3. Research Setting and Data
The data for this study comes from a federal credit union’s22 personnel and lending records
during the period January 2005 to Dec 2010. The most important feature of this organization for
the purpose of our study is a radical change in its business model and management control
systems at the end of 2004. Before the change (“the old system”), centralized rules and policies
were strictly followed by employees for everything from waiving fees to underwriting loans.
After the change (“the new system”), employees were given and encouraged to use complete
decision-making authority over virtually any decision involving a member.
Despite executives’ extensive communication to employees encouraging them to circumvent
previous formal controls and to use more discretion in decision-making, hesitance to deviate
from standard protocols was still pervasive when the formal control system was removed. In
order to change the culture and really have employees make their own decisions, the
organization used a variety of mechanisms to motivate the effective use of decision-making
authority – the authority to conduct local experimentation on loan decisions, including giving
general framework (“MOE”, i.e. when making decisions, consider members first, then the
organization, then employees) that helps employees set their priorities in a particular situation,
mentorship and coaching, and selecting employees whose preferences are more aligned with
organizational goals under the new system. Over time, employees adapted to the new system by
using more and more decision-making authority.
22This organization had approximately $1.45 billion in assets, 150,000 members, and 26 branches operating in a single state in the U.S.
81
This setting provides us with a unique opportunity to examine how the removal of a strict formal
control system affects employees’ behaviors and the emergence of informal control mechanisms.
Without the pressure to follow standard protocols, would employees actively collect private
information and use their own judgment independently or would they follow some implicit
norms? Moreover, this research setting allows us to study how the previous formal control
system would have a lasting effect on employees’ behaviors through examining how employees
hired into the old system adjusted their behaviors differently from those hired into the new
system. The unit of our analysis is a loan (made by an employee to a member). Our analysis does
not depend critically on any organizational feature other than the organization’s removal of its
previous formal control system. As we will explain later, the fact that this is a credit union only
makes our measurement of employee behaviors on particular decisions easier due to the
availability of loan data and a standard rate-sheet. The conclusion from this study is
generalizable to any group or organization that removes (or loosens) its formal control system or
empowers its employees by granting them greater decision-making authority.
3.1 The old system versus the new system on making loan decisions
Under the old system, decisions on loans were governed by standard protocols provided by top
management. One senior executive elaborated “Controls were extremely tight here. Our
divisions were run as fiefdoms. You couldn’t even get a fee waived without going through
accounting”. In deciding what rate to give on a certain loan, employees under such a tight control
system had to follow the standard rate given on the rate-sheet for particular loan and member
characteristics. No personal input or discretion was needed or allowed.
Under the new system, a rate-sheet was still given to employees. But the “standard rates” from
the rate-sheet only served as a reference point. Employees were encouraged to take initiatives to

82
know the members they were serving and to gather information on a particular loan decision.
They were encouraged to deviate from the “standard rates” in order to do “what is right” for the
members. Without an explicit instruction on what rate should be given, there was extensive
reliance in this organization on norms and shared values to guide employee decisions. One of the
mechanisms for norm development is that employees interacted extensively with each other
when facing significant exceptions (i.e. deviation from the standard rates on loan decisions), both
to elicit views of others who had made similar exceptions and to sharpen their own rationale for
decision-making.
In the context of lending decisions, it is easy to directly observe how much individual discretion
is put into decision making. Moreover, we can then empirically test whether an individual’s
decision follows certain norms, such as the leader’s or the group’s (department or branch)
average degree of experimentation.
3.2 Measuring employees’ degree of local experimentation in the context of lending
decisions
In order to study how employees change (or not change) their behaviors, we need a
counterfactual of what employees’ behaviors would have been if they were still under the old
system. The lending decision provides us with such a counterfactual because the organization
provided the standard rate-sheet rates to employees under both the old and the new system. We
know that under the old system, employees were required to follow the standard rate-sheet rates.
Therefore, such rate-sheet rates would be the rates employees would have followed if they were
still under the old system. Deviation from such rate-sheet rates not only captures whether
employees made exceptions to the standard protocol using their private information and
judgment, but also accurately measures the magnitude of discretion used on particular loans.
83
The sample used in our analyses consists of observations on loan, borrower, employee
characteristics, as well as information on employees’ direct leaders.
Data on loan characteristics include the type and the dollar amount of a loan, the rate-sheet rate
for a loan, and the actual interest rate given on a loan. We also observe the charge-off rates for
non-performing loans from 2008 to 2010.
Data on borrower characteristics include the borrower’s credit score and debt-to-income ratio
when the loan application was processed.
Data on employee characteristics include an employee’s job title, direct leader, branch or
department, hire date, termination date, whether he or she had experience in making loans, and
whether he/she had experience with this particular member (customer). Using the hire date, we
can classify employees into two categories: old system employees (those hired into the old
system) and new system employees (those hired into the new system).
4. Empirical Tests and Results
4.1 Variable Construction and Descriptive Statistics
To measure the degree of local experimentation on a particular loan, we define “degree of
experimentation” in loan rate as the difference between the rate-sheet rate and the actual rate for
a given loan (i.e. rate-sheet rate – actual rate). A positive sign means a rate deviation favorable to
the member (customer). Once we calculate the “degree of experimentation” in loan rate for a
given loan, we can average the degree of experimentation across all the loans made by a given
employee or a given group in month t. This gives us the average degree of experimentation for a
given employee (who could be in a leadership position) and for a given group during a given
month. We also construct a binary variable “Old System” that equals one if an employee was
hired into the old system (i.e. before January 2005).

84
Table 17 provides the definitions and summary statistics of the main variables used in our
analyses. On average, employees gave an almost 60-basis-point favorable rate exception (i.e. the
actual rate was almost 60 basis points lower than the rate-sheet rate) on the individual loan level,
personal average level, and group average level. Those in the leadership positions, on average,
gave an even higher level of favorable rate exception (1.027% or over 100 basis points) on the
loans they made, which is consistent with the notion that those in leadership positions were more
comfortable with the degree of experimentation.
53.6% of the loans were made by old-system employees. Employees, on average, made 392.6
loan decisions and interacted with a particular member (customer) for more than one times
(1.38). The average loan amount is 13,302 dollars, while the average credit score is 682.56.
Table 18 shows the correlation between the main variables. As expected, the degree of
experimentation in individual loan decisions is positively correlated with both the group’s and
the leader’s average degree of experimentation. Old-system employees experimented less in loan
decisions (i.e. a negative correlation between “old-system employees” and “degree of
experimentation”). More experience in making loans and more experience with this particular
member are positively correlated with making favorable rate exceptions in loan decisions.
Interestingly, credit score is negatively correlated with favorable rate exceptions, suggesting that
employees were less likely to give favorable rate exceptions to members with a high credit score
(who could get a low standard rate-sheet rate without any exception being made).

85
Variable Definition Obs Mean Std. Dev. Min Max Degree of Experimentation in Loan Rates =Ratesheet Rate – Actual Rate
81,523
0.599
1.896 -1
18
Personal Average Degree of Experimentation
Average degree of experimentation in loan rates for person i in month t
94,745
0.581
0.762 -1
18
Group Average Degree of Experimentation
Average degree of experimentation in loan rates for branch/department j in month t
95,340
0.587
0.486 -1
16
Leader Average Degree of Experimentation
Average degree of experimentation in loan rates for leader l in month t
53,729
1.027
1.971 -1
18
Debt Ratio Borrower’s debt to income ratio
90,647
287.642 7,803.855 0
675,793
Credit Score Borrower’s FICO score
90,337
682.561
151.934 -1
835
Loan Amount Dollar amount of the loan size
92,036
13,301.910 17,350.850 0
700,000
Old System Indicator=1 if an employee was hired before Jan 2005
95,385
0.536
0.499 0
1
Leader from Old System Indicator=1 if an employee’s leader is an old-system employee
55,023
0.811
0.392 0
1
Experience in Making Loans # of past loans made by employee
95,385
392.638
348.651 0
1,732
Experience with this Member # of past loans made by employee to a specific customer
95,385
1.380
0.974 1
20
Table 17. Variable Definitions and Summary Statistics

86
I II III IV V VI VII VIII IX X XI Degree of Experimentation 1.000
Personal Average Experimentation 0.407 1.000 0.000 Group Average Experimentation 0.230 0.553 1.000 0.000 0.000 Leader Average Experimentation 0.029 0.084 0.294 1.000 0.000 0.000 0.000 Debt Ratio 0.016 0.025 0.013 -0.001 1.000 0.000 0.000 0.000 0.802 Credit Score -0.467 -0.203 -0.172 -0.052 0.009 1.000 0.000 0.000 0.000 0.000 0.007 Loan Amount -0.034 -0.038 -0.065 -0.024 0.010 0.189 1.000 0.000 0.000 0.000 0.000 0.003 0.000 Old System Employees -0.047 -0.115 -0.142 -0.043 0.005 0.103 0.080 1.000 0.000 0.000 0.000 0.000 0.131 0.000 0.000 Leader from Old System 0.012 0.025 0.019 -0.111 0.005 -0.004 -0.028 0.092 1.000 0.010 0.000 0.000 0.000 0.246 0.397 0.000 0.000 Experience in Making Loans 0.037 0.093 0.162 0.040 0.004 -0.062 -0.011 0.159 0.073 1.000 0.000 0.000 0.000 0.000 0.212 0.000 0.001 0.000 0.000 Experience with this Member 0.037 0.044 0.041 0.016 0.015 -0.031 0.002 0.043 0.057 0.258 1.000 0.000 0.000 0.000 0.000 0.000 0.000 0.500 0.000 0.000 0.000
Table 18. Correlation Matrix

87
4.2 Hypotheses Testing
To test H1a and H1b, i.e. whether old-system employees follow their leader’s and their group’s
average degree of experimentation more closely than new-system employees, we develop the
following model specification.
Degree_of_Experimentationibt = β1 + β2 deviation_from_leaderaverageibt-1 + β3oldi *
(deviation_from_ leaderaverageibt-1) + β4 deviation_from_groupaverageibt-1 + β5oldi *
(deviation_from_ groupaverageibt-1) + β6 {controls: loan characteristics, customer
characteristics, employee characteristics} + group fixed effects + loan type fixed effects + time
(month) fixed effects + (employee fixed effects) + εibt
i represents the loan, b represents branch or department (i.e. group), and t represents the time
period (month). “Degree of Experimentation” is defined as “Degree of Experimentation in Loan
Rates” in Table 16, i.e. (rate-sheet rate – actual rate). If old-system employees follow their
leader’s average degree of experimentation in loan rate more closely than new-system
employees, we expect to find a negative β3. That is to say, the more old-system employees
deviated from their leader’s average degree of experimentation in the previous period, the less
they would experiment in making the current loan decision, holding other decision-relevant
factors constant. Similarly, if old-system employees follow their group’s average degree of
experimentation more closely than new-system employees, we expect to find a negative β5. We
control for loan characteristics (loan amount), member (customer) characteristics (debit ratio,
credit score) and employee characteristics (whether he/she had experience in making loans or
interacting with this particular member, whether his/her current leader was an old-system
employee). We include group fixed effects, as well as loan type fixed effects, to capture time

88
invariant effects specific to a certain group or a certain loan type. We also include time fixed
effects to capture effects specific to a certain time period (month).
Table 19 shows the regression results. The results in the left two columns are from the regression
without employee fixed effects. All continuous independent variables are standardized as the
number of standard deviations away from the mean value. The coefficients on the interaction
terms between “old-system employees” and “lagged deviation from leader (group) average” are
negative and significant, indicating that old-system employees did follow the leader’s and the
group’s average degree of experimentation more closely by adjusting in the opposite direction of
their previous deviation from the leader’s and the group’s average degree of experimentation.
The negative and significant coefficient on “Credit score” suggests that the lower a member’s
credit score is, the more likely employees would adjust rates in favor of the member, which is
consistent with the spirit of giving employees the authority to decide rate exceptions, i.e. to do
“what is best” for the members. As expected, the more experience one had with a particular
member, the more favorable rate he/she would give to this member. Note that the positive and
significant coefficients on “lagged deviation from leader (group) average” suggests that the more
favorable rate exception was made on loans (compared with the leader’s or the group’s average
degree of experimentation) in the previous period, the more favorable rate exception would be
made on loans in the current period. We suspect this effect is due to employees’ individual
tendencies to experiment. In other words, those employees with a greater tendency to use
favorable rate exception will have higher degree of experimentation in every period compared to
those with a lower tendency to experiment. This difference in employees’ individual tendencies
to experiment leads to the positive and significant coefficients we observe on “lagged deviation
from leader (group) average”.

89
The two columns on the right show the results with employee fixed effects. As we can see, after
controlling for employee fixed effects (which includes the time-invariant individual tendencies to
experiment), the coefficient on “lagged deviation from group average” becomes insignificant.
And the coefficient on “lagged deviation from leader average” becomes much less significant (to
a t-stat of 1.65). The coefficients on the two interaction terms remain negative and significant,
consistent with old-system employees adjust their degree of experimentation to the leader’s and
the group’s average degree of experimentation more closely than new-system employees. The
average degree of experimentation in loan decisions for old-system employees is 51 basis points
in our sample. A negative 3.3 (7.2) basis point adjustment in response to an increase of one
standard deviation from the lagged leader (group) average represents a more than 6.5% (14.1%)
decrease in the degree of experimentation (using the average degree of experimentation as a
benchmark).
Overall, results in Table 19 suggest that consistent with our hypotheses H1a and H2a, old-system
employees do follow their leader’s and group’s average degree of experimentation more closely
than new system employees through dynamically adjusting their behaviors from period to
period23.
23We also test the behaviors of following the leader’s or the group’s average degree of experimentation in the subsamples of loans made by old-system employees and those made by new-system employees. We find that the effect of following the leader’s or the group’s average degree of experimentation is only seen in the sample of old-system employees. This suggests that the difference in “norm-following” behaviors is driven by old-system employees. New-system employees seem to be making their decisions independently, while old-system employees follow the trend of experimentation by dynamically adjusting to the boundaries set by others’ behaviors.

90
Without Employee FE With Employee FE
Degree of
Experimentation Degree of
Experimentation Coefficient t-stat Coefficient t-stat Lagged Deviation from Leader Average 0.017 1.36 0.016 1.15 Old System * Lagged Dev from Leader Average -0.039 -2.39 -0.033 -1.91 Lagged Deviation from Group Average 0.037 2.77 0.008 0.55 Old System * Lagged Dev from Group Average -0.063 -2.58 -0.072 -2.48 Debt Ratio 0.012 2.30 0.009 1.17 Credit Score -0.790 -33.16 -0.787 -35.59 Loan Amount 0.152 6.73 0.149 6.76 Leader from Old System -0.032 -0.61 -0.002 -0.03 Experience in Making Loans -0.003 -0.20 -0.034 -0.61 Experience with this Member 0.038 3.70 0.036 3.44 Group Fixed Effects Y Y Employee Fixed Effects N Y Loan Type Fixed Effects Y Y Time (month) Fixed Effects Y Y R2 27.83% 29.04% N 40,388 40,388
Table 19. Testing H1a and H2a

91
To test H1b, i.e. whether old-system employees will follow leaders’ degree of experimentation
more closely when they perceive an increase in management’s temptation to renege on their
promises, we first have to operationalize a perceived “increase in management’s temptations to
renege on their promises. We argue that when the loans made by an employee performed badly
(i.e. charge-off rates became high), the employee would perceive an increase in management’s
temptation to break their promise by taking back the employee’s decision-making rights or
punishing the employee in other ways. Using the charge-off rates data from 2008 and 2010, we
construct an indicator variable whether the charge-off rates on the loans made by an employee
was in the top quartile among all employees during the past year (the charge-off data are only
available by year), and interact this variable with “Old” (i.e. the employee was hired under the
old system) and “lagged deviation from leader average”. We expect the coefficient on this three
way interaction to be negative and significant, indicating that when old-system employees’ loans
performed badly (and hence would perceive a higher likelihood that the management would
renege on the promises) they would adjust to the leader’s degree of experimentation even more
closely. To make the regression comparable to the baseline regressions in Table 19, we also
include a three-way interaction for “lagged deviation from group average”, all the two-way
interactions between the components of the three-way interaction, as well as the same control
variables and fixed effects.
Table 20 shows the regression results (using loans made in 2009 and 2010). The results show
that whether an employee’s average charge-off rate in the previous year was in the top quartile
does not significantly affect old-system employees’ adjustment to deviation from group average.
However, it does negatively and significantly affect old-system employees’ adjustment to
deviation from leader average, i.e. it is mostly those old-system employees whose average

92
charge-off rate was in the top quartile in the previous year who made the significant adjustment
to follow their leaders’ degree of experimentation more closely. This is consistently with H1b,
suggesting that employees who perceive a lower credibility of management’s promise would
seek a “safer ground” by following the boundaries set by the leader’s degree of experimentation
(it’s almost like “surrendering” some decision-making authority back to the management).
To test H2b, i.e. old-system employees would follow group norms on the degree of
experimentation more closely for loans that are riskier; we first operationalize “risky loans” as
loans whose applicants have credit scores lower than 620. We run the baseline regressions for
two subsamples: loans whose applicants have credit scores lower than 620 and those with scores
above (or equal to) 620. We expect to see a stronger effect of following the group norms for the
subsamples with scores lower than 620 (i.e. a statistically significant and more negative
coefficient on the interaction term between “Old System” and “lagged deviation from group
average”).
Table 21 shows the regression results. The magnitude of the coefficient on the interaction term
between “old-system employee” and “lagged deviation from group average” increases from
0.072 in the full sample result (Table 19) to 0.222 for loans with low credit scores, while the
corresponding coefficient for loans with high credit scores becomes insignificant. This is
consistent with H2b, suggesting that old-system employees would follow group average more
closely than new-system employees when decision risks are high and the need for external
information guidance (on what actions are appropriate) is greater.
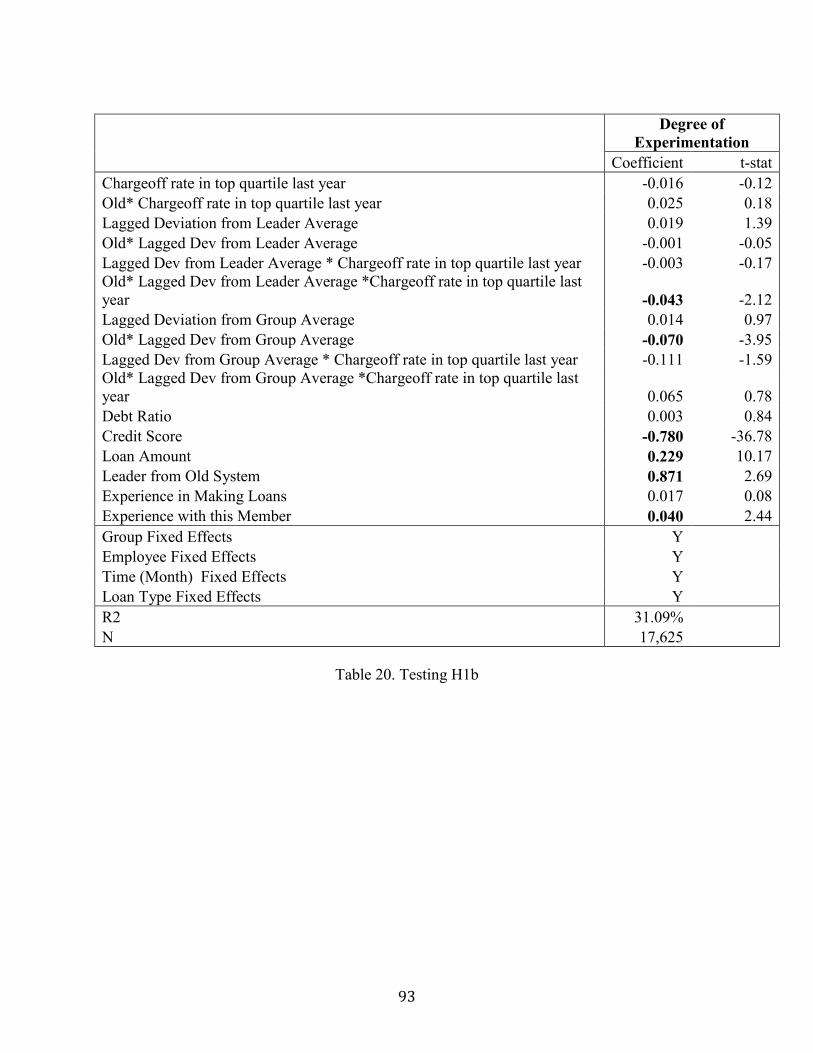
93
Degree of
Experimentation Coefficient t-stat Chargeoff rate in top quartile last year -0.016 -0.12 Old* Chargeoff rate in top quartile last year 0.025 0.18 Lagged Deviation from Leader Average 0.019 1.39 Old* Lagged Dev from Leader Average -0.001 -0.05 Lagged Dev from Leader Average * Chargeoff rate in top quartile last year -0.003 -0.17 Old* Lagged Dev from Leader Average *Chargeoff rate in top quartile last year -0.043 -2.12 Lagged Deviation from Group Average 0.014 0.97 Old* Lagged Dev from Group Average -0.070 -3.95 Lagged Dev from Group Average * Chargeoff rate in top quartile last year -0.111 -1.59 Old* Lagged Dev from Group Average *Chargeoff rate in top quartile last year 0.065 0.78 Debt Ratio 0.003 0.84 Credit Score -0.780 -36.78 Loan Amount 0.229 10.17 Leader from Old System 0.871 2.69 Experience in Making Loans 0.017 0.08 Experience with this Member 0.040 2.44 Group Fixed Effects Y Employee Fixed Effects Y Time (Month) Fixed Effects Y Loan Type Fixed Effects Y R2 31.09% N 17,625
Table 20. Testing H1b
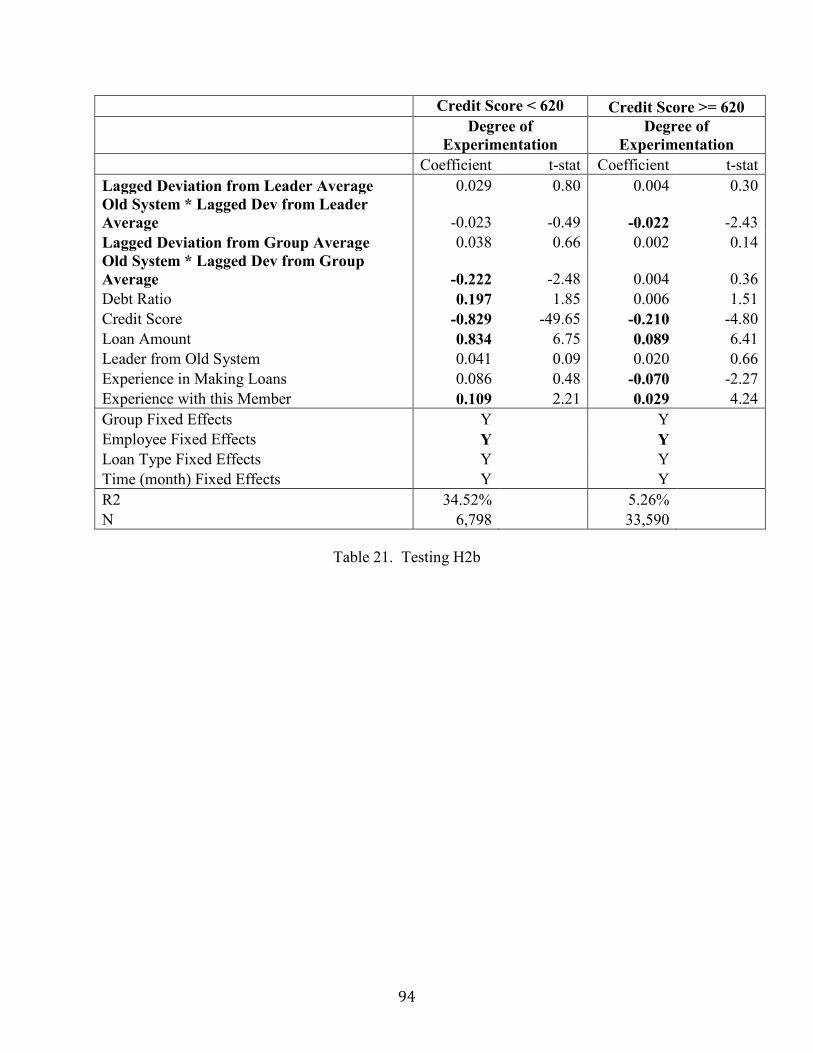
94
Credit Score < 620 Credit Score >= 620
Degree of
Experimentation Degree of
Experimentation Coefficient t-stat Coefficient t-stat Lagged Deviation from Leader Average 0.029 0.80 0.004 0.30 Old System * Lagged Dev from Leader Average -0.023 -0.49 -0.022 -2.43 Lagged Deviation from Group Average 0.038 0.66 0.002 0.14 Old System * Lagged Dev from Group Average -0.222 -2.48 0.004 0.36 Debt Ratio 0.197 1.85 0.006 1.51 Credit Score -0.829 -49.65 -0.210 -4.80 Loan Amount 0.834 6.75 0.089 6.41 Leader from Old System 0.041 0.09 0.020 0.66 Experience in Making Loans 0.086 0.48 -0.070 -2.27 Experience with this Member 0.109 2.21 0.029 4.24 Group Fixed Effects Y Y Employee Fixed Effects Y Y Loan Type Fixed Effects Y Y Time (month) Fixed Effects Y Y R2 34.52% 5.26% N 6,798 33,590
Table 21. Testing H2b
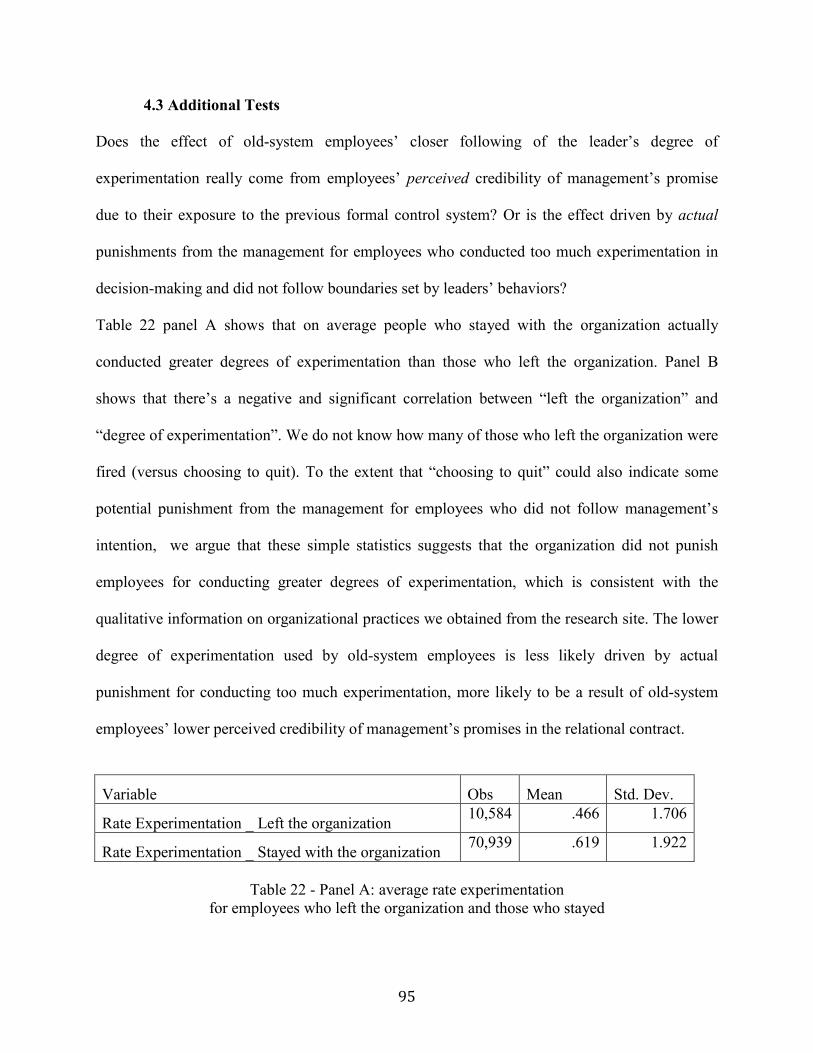
95
4.3 Additional Tests
Does the effect of old-system employees’ closer following of the leader’s degree of
experimentation really come from employees’ perceived credibility of management’s promise
due to their exposure to the previous formal control system? Or is the effect driven by actual
punishments from the management for employees who conducted too much experimentation in
decision-making and did not follow boundaries set by leaders’ behaviors?
Table 22 panel A shows that on average people who stayed with the organization actually
conducted greater degrees of experimentation than those who left the organization. Panel B
shows that there’s a negative and significant correlation between “left the organization” and
“degree of experimentation”. We do not know how many of those who left the organization were
fired (versus choosing to quit). To the extent that “choosing to quit” could also indicate some
potential punishment from the management for employees who did not follow management’s
intention, we argue that these simple statistics suggests that the organization did not punish
employees for conducting greater degrees of experimentation, which is consistent with the
qualitative information on organizational practices we obtained from the research site. The lower
degree of experimentation used by old-system employees is less likely driven by actual
punishment for conducting too much experimentation, more likely to be a result of old-system
employees’ lower perceived credibility of management’s promises in the relational contract.
Variable Obs Mean Std. Dev.
Rate Experimentation _ Left the organization 10,584 .466 1.706
Rate Experimentation _ Stayed with the organization 70,939 .619 1.922
Table 22 - Panel A: average rate experimentation
for employees who left the organization and those who stayed

96
Degree of Experimentation Left the organization
Discretion of Experimentation 1
Left the organization -0.030*** 1
Table 22 - Panel B: correlation between “Degree of Experimentation” and “left the organization”
Another concern is that we do not know whether the effect is really driven by employees’
exposure to different initial control environments (i.e. the old system versus the new system), or
it is the employees’ innate preferences to rely more on external decision rules and a greater
tendency to follow others’ behaviors that led certain types of individuals to be sorted into the
previous formal control system. We assume that people who were hired into the old system are
the same type, i.e. with similar innate preferences to rely on external decision rules (versus
experiment on one’s own) and similar tendencies to follow others’ behaviors. We then construct
an indicator variable “Older” that equals one if an old-system employee was hired before 2004,
breaking the old-system-employee sample into those who were hired earlier and those who were
hired later. The assumption is that those old-system employees who were hired earlier have
similar innate preferences or tendencies to follow external rules or others’ behaviors, but those
who were hired earlier obviously have longer period of exposure in the old rule-based formal
control system. We run the baseline regression in the old-system-employee only sample and
interact “Older” with “lagged deviation from leader (group) average”. If the effect is driven by a
selection of certain types of employees into the old system, rather than by the length of exposure
under the old system, we would expect to the coefficient on the interaction term to be
insignificant.
97
Table 23 shows the regression results (the baseline regression results are also listed as a
comparison). The coefficient on the interaction term between “Older” and “lagged deviation
from leader average” is still negative and significant, suggesting that those old-system employees
who were hired earlier would follow the leader’s degree of experimentation more closely than
those who were hired later. This suggests that the effect of a closer following of the leader’s
degree of experimentation is driven by the length of exposure under the previous formal control
system, which is consistent with the notion that the longer one is exposed under the old system;
the less credible he/she perceives the management’s promises. On the other hand, the coefficient
on the interaction term between “Older” and “lagged deviation from group average” becomes
insignificant. This suggests that the effect of a closer following of the group degree of
experimentation could be driven by the type of employees selected into the previous formal
control system, i.e. the type that was sorted into the old system has a different understanding of
what actions are expected in terms of exercising decision-making authority and doing “what is
right” for the members.

98
Old versus New Older versus Old
Degree of
Experimentation Degree of
Experimentation Coefficient t-stat Coefficient t-stat Lagged Deviation from Leader Average 0.016 1.15 0.019 1.14 Older * Lagged Dev from Leader Average -0.033 -1.91 -0.069 -2.92 Lagged Deviation from Group Average 0.008 0.55 -0.130 -1.98 Older * Lagged Dev from Group Average -0.072 -2.48 0.086 1.46 Debt Ratio 0.009 1.17 0.011 0.97 Credit Score -0.787 -35.59 -0.815 -17.52 Loan Amount 0.149 6.76 0.114 7.65 Leader from Old System -0.002 -0.03 -0.022 -0.30 Experience in Making Loans -0.034 -0.61 0.030 0.33 Experience with this Member 0.036 3.44 0.025 2.42 Group Fixed Effects Y Y Employee Fixed Effects Y Y Time (Month) Fixed Effects Y Y Loan Type Fixed Effects Y Y R2 29.04% 28.39% N 40,388 18,197
Table 23. Old versus Older
5. Conclusion
There has been little empirical evidence on the effect of emerging informal control mechanisms
(social norms, in particular) on local experimentation after the loosening of formal control
systems and how the effect of such informal control mechanisms depend on the exposure to
initial control environments. Using the personnel and loan data from a financial institution that
underwent a radical decentralization in decision-making rights, we provide direct empirical
evidence showing that informal control mechanisms (in the form of conforming to the leader’s or
the group’s average degree of experimentation) do emerge and provide powerful guidance for
employee behaviors after removing the formal control system. The effect of such informal

99
control mechanisms depends on which initial control environment an employee was exposed to.
Connecting the emergence of informal control mechanisms to the analytical construct of a
relational contract, we argue that employees who were exposed to the previous rule-based formal
control system are likely to perceive management’s promise to be less credible and to have a
greater need for external benchmarks to understand what actions are expected under the
emerging relational contract. Consistent with our hypotheses, we find that old-system employees
do follow the leader’s and the group’s degree of experimentation more closely than the new-
system employees. Old-system employees follow the leader’s degree of experimentation more
closely when they perceive an increase in management’s reneging temptations. They follow the
group’s degree of experimentation much more closely than new-system employees when
decision risks are high and the need for an external decision benchmark is greater24.
Our discussion here focuses only on one small aspect of the organization’s practice to balance
empowering employees with the authority to experiment in their decisions and maintaining
organizational control. Nonetheless, this small aspect illustrates the importance of informal
control mechanisms and how exposure to initial control environments can shape the development
of the relational contracts underlying such informal mechanisms by affecting one party’s
perception of the credibility and clarity of the other party’s promises. Future research can make
progress by shedding light on other factors and mechanisms behind the development of such
relational contracts and the strategic choices made by both parties during the process.
24 This chapter does not directly assess the performance impact of these “norm-following” behaviors in employee experimentation. The intended goal of local experimentation is that each employee can actively seek and process local information and improve decision-making quality compared to that under the centralized rule-based system. If “norm-following” reflects the formation of a shared understanding of “appropriate” decision rules under similar circumstances, then such behavior might not be sub-optimal. However, if “norm-following” reflects the fear of fully utilizing the decision-making rights to seek and process information, then such behavior could lead to sub-optimal performance outcomes. Future research could help disentangle the performance consequences of these two types of “norm-following” behaviors in local experimentation.
100
REFERENCES
Agrawal, Ajay, Christian Catalini, and Avi Goldfarb. Slack Time and Innovation. No. w21134. National Bureau of Economic Research, 2015. Akerlof, George A., and Rachel E. Kranton. "Economics and identity." Quarterly journal of Economics (2000): 715-753. Akerlof, George A., and Rachel E. Kranton. Identity and the Economics of Organizations. Journal of Economic Perspectives 19, no. 1 (2005): 9-32. Amabile, Teresa. "A Model of Creativity and Innovation in Organizations." Research in Organizational Behavior 10 (1988): 123-167. Amabile, Teresa M., and Regina Conti. "Changes in the work environment for creativity during downsizing." Academy of Management Journal 42, no. 6 (1999): 630-640. Azoulay, Pierre, and Josh Lerner. "Technological innovation and organizations." (2012). Baker, George, Robert Gibbons, and Kevin J. Murphy. "Informal authority in organizations." Journal of Law, Economics, Organization 15, no. 1 (1999): 56–73. Baker, George, Robert Gibbons, and Kevin J. Murphy." Relational contracts and the theory of the firm." Quarterly Journal of Economics 117, no. 1 (2002): 39–84. Baker, George, Robert Gibbons, and Kevin J. Murphy. "Relational adaptation." Working paper, National Bureau of Economic Research, 2011. Baranchuk, Nina, Robert Kieschnick, and Rabih Moussawi. "Motivating innovation in newly public firms." Journal of Financial Economics 111, no. 3 (2014): 578-588. Bloom, Nicholas, and John Van Reenen. "Measuring and Explaining Management Practices Across Firms and Countries." The Quarterly Journal of Economics 122, no. 4 (2007): 1351-1408. Bourgeois, L. Jay. "On the measurement of organizational slack." Academy of Management review 6, no. 1 (1981): 29-39. Brueggen, Alexander, Christoph Feichter, and Michael G. Williamson. "The Effect of Time and Output Targets for Routine Tasks on Creative Task Performance." Available at SSRN 2480917 (2015). Bull, Clive. "The existence of self-enforcing implicit contracts." Quarterly Journal of Economics 102, no. 1(1987): 147–159.

101
Campbell, Dennis, Marc J. Epstein, and F. Asis Martinez-Jerez. "The learning effects of monitoring." The Accounting Review 86, no. 6 (2011): 1909-1934. Campbell, Dennis. "Employee selection as a control system." Journal of Accounting Research 50, no. 4 (2012): 931-966. Chen, Clara Xiaoling, Michael G. Williamson, and Flora H. Zhou. "Reward system design and group creativity: An experimental investigation." The Accounting Review 87, no. 6 (2012): 1885-1911. Christensen, Clayton M., and Michael E. Raynor. The Innovator's Solution: Creating and Sustaining Successful Growth. Boston: Harvard Business School Press, 2003. Cialdini, Robert B., Raymond R. Reno, and Carl A. Kallgren."A Focus Theory of Normative Conduct: Recycling the Concept of Norms to Reduce Littering in Public Places." Journal of Personality and Social Psychology58, no. 6 (1990): 1015–1026. Cyert, Richard M., and James G. March. "A behavioral theory of the firm." Englewood Cliffs, NJ 2 (1963). Davila, Tony, and Marc Wouters. "Managing budget emphasis through the explicit design of conditional budgetary slack." Accounting, Organizations and Society 30, no. 7 (2005): 587-608. Drake, Andrea R., Susan F. Haka, and Sue P. Ravenscroft. "Cost system and incentive structure effects on innovation, efficiency and profitability in teams." The Accounting Review 74, no. 3 (1999): 323-345.
Dunk, Alan S. "The joint effects of budgetary slack and task uncertainty on subunit performance." Accounting & Finance 35, no. 2 (1995): 61-75.
Ederer, Florian, and Gustavo Manso. "Is Pay for Performance Detrimental to Innovation?." Management Science 59, no. 7 (2013): 1496-1513.
Gambardella, Alfonso, Christina Raasch, and Eric von Hippel (2015) "The user innovation paradigm: impacts on markets and welfare." Management Science, forthcoming Geoffrey, Love E., and Nitin Nohria. "Reducing slack: the performance consequences of downsizing by large industrial firms, 1977–93." Strategic Management Journal 26, no. 12 (2005): 1087-1108.
Gibbons, Robert, and Rebecca Henderson. "Relational contracts and organizational capabilities." Organization Science 23, no. 5 (2012): 1350-1364. Girotra, Karan, Christian Terwiesch, and Karl T. Ulrich. “Idea Generation and the Quality of the Best Idea”. Management Science 56, no. 4 (2010): 591–605.

102
Grabner, Isabella. "Incentive system design in creativity-dependent firms." The Accounting Review 89, no. 5 (2014): 1729-1750. Holmstrom, Bengt. "Agency costs and innovation." Journal of Economic Behavior & Organization 12, no. 3 (1989): 305-327. Holmstrom, Bengt, and Paul Milgrom. "Multitask principal-agent analyses: Incentive contracts, asset ownership, and job design." Journal of Law, Economics, & Organization (1991): 24-52. Holthausen, Robert W., David F. Larcker, and Richard G. Sloan. "Business unit innovation and the structure of executive compensation." Journal of Accounting and Economics 19, no. 2 (1995): 279-313. Jensen, Michael C., and William H. Meckling. "Theory of the firm: Managerial behavior, agency costs and ownership structure." Journal of financial economics 3, no. 4 (1976): 305-360. Kachelmeier, Steven J., Bernhard E. Reichert, and Michael G. Williamson. "Measuring and motivating quantity, creativity, or both." Journal of Accounting Research 46, no. 2 (2008): 341-373. Kachelmeier, Steven J., and Michael G. Williamson. "Attracting creativity: The initial and aggregate effects of contract selection on creativity-weighted productivity." The Accounting Review 85, no. 5 (2010): 1669-1691. Kaplan, Sarah, and Rebecca Henderson, 2005. "Inertia and Incentives: Bridging Organizational Economics and Organizational Theory." Organization Science16, no. 5 (2005): 509-521. Kesting, Peter, and John ParmUlhøi, "Employee‐driven innovation: extending the license to foster innovation." Management Decision48, no. 1 (2010): 65 – 84. King, Andrew, and Karim R. Lakhani. "Using Open Innovation to Identify the Best Ideas." MIT Sloan Management Review55, no. 1 (Fall 2013): 41–48 Kirby, Alison J., Stefan Reichelstein, Pradyot K. Sen, and Tae-Young Paik. "Participation, slack, and budget-based performance evaluation." Journal of Accounting Research (1991): 109-128. Lawson, MB Buff. "In praise of slack: Time is of the essence." The Academy of Management Executive 15, no. 3 (2001): 125-135. Lazear, Edward P. "Performance Pay and Productivity." American Economic Review (2000): 1346-1361. Lerner, Josh, and Julie Wulf. "Innovation and incentives: Evidence from corporate R&D." The Review of Economics and Statistics 89, no. 4 (2007): 634-644.

103
Lerner, Joshua. The architecture of innovation: The economics of creative organizations. Harvard Business Press, 2012. Levin, Jonathan. "Relational incentive contracts." American Economic Review93, no. 3 (2003): 835–857. Lillis, Anne M. "Managing multiple dimensions of manufacturing performance—an exploratory study." Accounting, Organizations and Society 27, no. 6 (2002): 497-529. Lukka, Kari. "Budgetary biasing in organizations: theoretical framework and empirical evidence." Accounting, Organizations and Society 13, no. 3 (1988): 281-301. Malcomson, James M. "Relational incentive contracts." Robert Gibbons, and John Roberts, eds. The Handbook of Organizational Economics. Princeton University Press, Princeton, NJ, 2012. Manso, Gustavo. "Motivating innovation." The Journal of Finance 66, no. 5 (2011): 1823-1860. March, James G. "Exploration and exploitation in organizational learning." Organization science 2, no. 1 (1991): 71-87. Menzel, Hanns C., IirisAaltio, and Jan M. Ulijn. "On the way to creativity: Engineers as intrapreneurs in organizations." Technovation 27, no. 12 (2007): 732-743. Merchant, Kenneth A. Control in business organization. Financial Times/Prentice Hall, 1985. Merchant, Kenneth A., and Jean-François Manzoni. "The Achievability of Budget Targets in Profit Centers: A Field Study." Accounting Review (1989): 539-558. Merchant, Kenneth A., and Wim A. Van der Stede. Management control systems: performance measurement, evaluation and incentives. Pearson Education, 2007. Nohria, Nitin, and Ranjay Gulati. "Is slack good or bad for innovation?" Academy of management Journal 39, no. 5 (1996): 1245-1264. Ouchi, William G. "A Conceptual Framework for the Design of Organizational Control Mechanisms." Management Science 25,no. 9 (1979): 833-848. Prendergast, Canice. "Intrinsic motivation and incentives." The American economic review (2008): 201-205. Sandino, T., 2007. Introducing the First Management Control Systems: Evidence from the Retail Sector. The Accounting Review, 82(1):265-293. Joseph A. Schumpeter, Capitalism, Socialism and Democracy. New York: Harper & Row, 1942, 381 pp.; Third edition, 1950, 431 pp.

104
Simmons, Robert. Performance measurement and control systems for implementing strategy. Prentice Hall,2000. Singh, Jitendra V. "Performance, slack, and risk taking in organizational decision making." Academy of management Journal 29, no. 3 (1986): 562-585. Shields, Michael D., F. Johnny Deng, and Yutaka Kato."The Design and Effects of Control Systems: Tests of Direct- and Indirect-effects Models." Accounting, Organizations and Society 25, (2000): 185-202. Tayler, William B., and Robert Bloomfield. "Norms, Conformity and Controls." Journal of Accounting Research 49, no. 3(2011): 753-790. Taylor, Paul J., and Jon L. Pierce. "Effects of Introducing a Performance Management System on Employees’ Subsequent Attitudes and Effort." Public Personnel Management 28, no. 3 (1999): 423-452. Tushman, Michael L., and Charles A. O’Reilly III. "Managing evolutionary and revolutionary change." California Management Review 38, no. 4 (1996): 8-28. Vise, David. "The google story." Strategic Direction 23, no. 10 (2007). Williamson, Oliver E. "A model of rational managerial behavior." A behavioral theory of the firm (1963): 237-252. Wooldridge, Bill, and Steven W. Floyd. "The strategy process, middle management involvement, and organizational performance." Strategic Management Journal 11, no. 3 (1990): 231-241.