Embed Size (px)
Citation preview

MANAGEMENT ACCOUNTING CHANGE: AN EXPLORATORY
STUDY OF LARGE MANUFACTURING COMPANIES IN KENYA.
BY:
BANGARA SAMWEL NDAITA
D61/76541/2009
A MANAGEMENT RESEARCH PROJECT SUBMITTED FOR THE
PARTIAL FULFILLMENT OF THE REQUIREMENT FOR THE
DEGREE OF MASTER OF BUSINESS ADMINISRATION (MBA),
SCHOOL OF BUSINESS, UNIVERSITY OF NAIROBI.
NOVEMBER, 2011

DECLARATIONThis management research project report is my original work and has not been presented
for an award of a degree in any other University.
SAMWEL NDAITA BANGARA
This research project report has been submitted for examination with my approval as
university supervisor.
DR.JOSIAH ADUDA
CHAIRMAN, DEPARTMENT OF FINANCE AND ACCOUNTING
SCHOOL OF BUSINESS
UNIVERSITY OF NAIROBI

DEDICATIONI dedicate this work to my parent, Mrs. Peris kwamboka, my wife, Gladys Moraa and my
children; daughters Kwamboka, Kemunto and son Bangara junior.
iii

ACKNOWLEDGEMENTI am highly indebted to Dr. Josiah Aduda of the Department of Finance and Accounting,
with whose invaluable guidance, constant advice and positive criticism this work
materialized. I would like to thank him especially for his tireless efforts, encouragement
and patience in seeing through the accomplishment of this project.
Further thanks go to Mr. Herick Ondigo who reshaped this project paper and all the
lecturers who encouraged me during the period of undertaking this study. To many who
contributed in one way or another including all MBA colleagues to the fulfillment of this
project I express my sincere gratitude.
IV

ABSTRACTThis study explores the changes in management accounting as well as the potential
influence of contextual variables on management accounting practices in Kenyan large
manufacturing companies located in Nairobi. This paper reports on a descriptive survey
of management accounting change in Kenyan context. The findings indicate
considerable changes in management accounting techniques within the surveyed
companies. Both traditional and advanced management accounting techniques are
practiced by the surveyed organizations.
Advanced management accounting techniques notably; customer satisfaction, quality and
innovation and on time delivery have been adopted, while traditional management
accounting techniques notably; incremental budgeting, variable costing, standard costing
and variance analysis, sales and return on investment are being maintained. Regarding
changes in management accounting techniques the study established that majority of the
responding organizations indicated change relating to introduction of new techniques as
replacements, modification of information or output of MAS and introduction of new
techniques where none existed.
The study suggests that increased global competition, organization strategy and
organization structure as contextual variables that largely facilitate management
accounting change within the surveyed manufacturing companies. On the other hand,
lack of adequate computing resources and lack of top management support were
identified as the most hindrances to management accounting change within the surveyed
organizations.
v
TABLE OF CONTENTS
Declaration........................................................................................................................... ii
Dedication........................................................................................................................... iii
Acknowledgement.............................................................................................................. iv
Abstract................................................................................................................................v
Table of Contents................................................................................................................vi
List of Tables...................................................................................................................... ix
List of Acronyms.................................................................................................................x
CHAPTER ONE:INTRODUCTION...............................................................................1
1.1 Background to the study.................................................................................................1
1.1.1 Management accounting change............................................................................. 3
1.1.2 Large manufacturing firms in Kenya...................................................................... 5
1.2 Statement of the problem............................................................................................... 6
1.3 Objectives of the study......................... 9
1.4 Importance of the study..................................................................................................9
CHAPTER TWO:LITERATURE REVIEW................................................................10
2.1 Introduction.................................................................................................................. 10
2.2 Theoretical frameworks............................................................................................... 10
2.2.1 Contingency theory............................................................................................... 10
2.2.2 Institutional theory.................................................................................................11
2.3 Changes in management accounting systems.............................................................. 12
2.3.1 Costing systems..................................................................................................... 12
2.3.2 Planning and control systems................................................................................ 13
2.3.3 Performance measurement systems.......................................................................15
2.3.4 Cost management and Strategic management accounting systems...................... 16
2.3.4.1 Target costing................................................................................................. 16
2.3.4.2 Lifecycle costing................................................................................................ 172.3.4.3 Benchmarking.................................................................................................... 18
VI

2.3.4.4 Just-in-time systems............................................................................................182.3.4.5 Total quality management (TQM)........................................................................182.3.4.6 Attribute costing..................................................................................................182.3.4.7 Competitive position monitoring.............................................................................192.3.4.8 Competitor cost assessment...................................................................................192.3.4.9 Competitor performance appraisal.......................................................................... 192.3.4.10 Customer profitability analysis...........................................................................192.3.4.11 Integrated performance measurement....................................................................202.3.4.12 Lifetime customer profitability analysis............................................................... 202.3.4.13 Quality costing.................................................................................................. 202.3.4.14 Strategic pricing............................................................................................... 202.3.4.15 Value chain costing...........................................................................................21
2.4 Factors facilitating management accounting systems change..................................... 21
2.4.1 Deregulation/global competition...........................................................................22
2.4.2 Manufacturing Technological advancements.........................................................22
2.4.3 Size and type of organization............................................................................... 23
2.4.4 Organizational strategy........................................................................................ 23
2.4.5 Organisation structure...........................................................................................24
2.5 Factors limiting management accounting systems change..........................................24
2.6 Empirical researches................................................................................................... 25
2.7 Chapter Summary........................................................................................................30
CHAPTER THREE METHODOLOGY.......................................................................31
3.1 Introduction..................................................................................................................31
3.2 Research design............................................................................................................31
3.3 Study setting.................................................................................................................31
3.4 Population of the study................................................................................................ 31
3.5 Sampling......................................................................................................................32
3.6 Data collection............................................................................................................. 33
3.7 Data analysis................................................................................................................33
3.8 Validity and Reliability................................................................................................33
vii

CHAPTER FOUR:DATA ANALYSIS AND PRESENTATION................................35
4.1 Introduction.................................................................................................................. 35
4.2 Profile of companies.................................................................................................... 35
4.3 Management accounting systems.................................................................................38
4.5 Factors facilitating management accounting change................................................... 42
4.5.1 Competition...........................................................................................................42
4.5.2 Manufacturing technology.................................................................................... 43
4.5.3 Organization strategy............................................................................................ 44
4.5.4 Organization size and type....................................................................................45
4.5.5 Organization structure...........................................................................................46
4.5.6 Overall rating of the contextual factors facilitating management accounting
change............................................................................................................................ 47
4.6 Hindrances to management accounting change...........................................................49
4.7 Group parent company pressures influence on management accounting change.......50
4.8 Summary and interpretation of findings...................................................................... 51
CHAPTER FIVE: SUMMARY, CONCLUSIONS AND RECOMMENDATIONS.54
5.1 Summary...................................................................................................................... 54
5.2 Conclusions..................................................................................................................55
5.3 Policy recommendations..............................................................................................56
5.4 Limitations of the study............................................................................................... 58
5.5 Suggestions for further research.................................................................................. 59
References..........................................................................................................................60
Appendix I: Questionnaire on management accounting change:.................................. 69
Appendix II: Management accounting change frequencies............................................. 76
Appendix III: Management accounting change index.......................................................78
Appendix IV: Factors facilitating management accounting change..................................80
Appendix V: Regression analysis......................................................................................86
Appendix VI: Hindrances to management accounting change......................................... 87
Appendix VII: List of the sampled manufacturing companies that participated in the
survey.................................................................................................................................88
viii

LIST OF TABLESTable 3.1 Sampling procedures......................................................................................... 32
Table 4.1: Descriptive statistics of responding companies............................................... 37
Table 4.2 Management Accounting Systems.....................................................................39
Table 4.3 Change in management accounting techniques................................................ 40
Table 4.4: Management accounting change dimensions.................................................. 42
Table 4.5 Competition.......................................................................................................43
Table 4.7 Organization strategy.........................................................................................45
Table 4.8 Organization size and type.................................................................................46
Table 4.9 Structural changes..............................................................................................47
Table 4.10 Overall rating of contextual variables............................................................. 48
Table 4.11: Factors facilitating management accounting change regression analysis......49
Table 4.12 Factors hindering management accounting change........................................ 50
IX

LIST OF ACRONYMSABB - Activity Based Budgeting
ABC - Activity Based Costing
ABM - Activity Based Management
BSC - Balanced Scorecard
CBS - Central Bureau of Statistics
EVA - Economic Value Added
GoK - Government of Kenya
IRR - Internal Rate of Return
JIT - Just in Time
KAM - Kenya Association of Manufacturers
KIRDI - Kenya Industrial Research Development Institute
LDC’s - Less Developed Countries
MAP - Management Accounting Practice
MAS - Management Accounting system
NPV - Net Present Value
ROCE - Return on Capital Employed
ROI - Return on Investment
SMA - Strategic Management Accounting
TC - Target Costing
TMATs - Traditional Management Accounting Techniques

CHAPTER ONE
1.0 INTRODUCTION
1.1 Background to the study.Management accounting is concerned with the provision of information to people within
the organization to help them make better decisions and improve the efficiency and
effectiveness of existing operations. The information provided is as a result of the
established management accounting practices that encompass activities undertaken by
staff within the organization (Drury, 2008). The organizations management accounting
system serves as a vital two way communication link between senior and subordinate
managers. It is the means by which senior executives communicate the organization goals
and objectives to subordinates and decentralized managers. In the reverse direction, the
management accounting system is the channel by which information about the firm’s
product performance and production efficiencies is reported to upper levels of
management (Kaplan, 1987).
The origins of today’s management accounting can be traced back to the industrial
revolution of the nineteenth century. The emergence of managed, hierarchical enterprises
during this period such as armories and textile mills resulted in management accounting
costing techniques being established to provide information on costs in an attempt to
improve the cost structure. Further innovations in management accounting systems
occurred in the early decades of the twentieth century to support the growth of multi
activity, diversified corporations. Several important operating and budgeting activities
were devised to coordinate activities and allocate resources to groups. The most
important management accounting innovation was the retum-on-investment (ROI) that
1

provided an overall measure of the commercial success of each operating unit and of the
entire organization.(Kaplan and Artkinson,2007).
According to Johnson and Kaplan (1987), most of the management accounting practices
that were in use in the mid 1980s had been developed by 1925 and for the next 60 years
there was a slow down or even a halt, in management accounting innovation. They claim
that over the years, organizations have become fixated on the cost and management
accounting systems of 1920s that are obsolete and no longer relevant to the changing
competitive and manufacturing environment. In the 1980s, major new challenges
emerged for management accounting. Companies rediscovered the critical role that
manufacturing plays in creating competitive advantage for their organizations. Quality in
manufacturing and in product design became more emphasized, reduction in inventory
levels and manufacturing lead times represented by just-in-time production and the
introduction of computer controlled manufacturing operations. In this new manufacturing
environment management accounting systems must be designed to support the drive for
manufacturing excellence. Measurement systems must evolve to support efforts to
increase quality and productivity, move to just-in-time and computer-integrated -
manufacturing production systems and investment in new technologies. Since the mid-
1980s management accounting practitioners and academics has sought to modify and
implement new techniques that are relevant to today’s business environment. (Kaplan and
Atkinson, 2007).
2

1.1.1 Management accounting change.
Management accounting change refers to a move from the way a particular management
accounting practice or technique is applied. As such, management accounting change is
found to consist of addition, replacement, output modification, operational modification
and reduction (Sulaiman and Mitchell, 2005). Replacement of existing techniques and
information output modifications have been found significant, with high frequency and
importance. Management accounting change ranges from introduction of a
comprehensive costing system, to tentative, partial and temporary change of a more
modest type (Anderson and Young, 2001, Innes and Mitchell, 1990). Instances of change
have also been found to involve the supplementation of information in existing
performance measurement packages (Vaivio, 1999).
Management accounting change is not a uniform phenomenon. Consequently one might
expect the causal factors of change to be varied and this has indeed been confirmed by
management accounting researchers. It is evident that both the external factors
(environmental) and internal factors (relating to the organization concerned) have
influenced the recent development of new management accounting systems and
techniques. According to Shields (1997), the potential change drivers are competition,
technologies, organizational design and strategies. These drivers of change also indicate
the differing roles which causal factors can have in the process of change. Change in
environment also implies uncertainty and risk which create a demand for further
management accounting change (Vaivio, 1999).
3

In Kenya, liberalization of the economy opened door for intensive competition from
overseas companies in 1990s in the domestic market. This has resulted to a situation
where most firms are now competing in a highly competitive global market. Protection
policy by the government limited the ability by foreign companies to compete in
domestic markets. This implied that there were little incentives for firms to maximize
efficiency, improve management accounting practices or minimize costs. However, in the
mid 1990s many organizations including manufacturing firms began to encounter severe
competition from foreign competitors that offered high quality products at low prices.
Privatization of government controlled entities in the same period contributed to the
change in the business environment.
Organizations commonly utilize traditional management accounting techniques
(TMATs), such as full costing, job order costing and process costing. Developments in
management accounting in the past two decades provided more advanced management
accounting techniques, including activity based costing (ABC), activity based
management (ABM), target costing, value added accounting, cost of quality reporting,
economic value added, life cycle costing, throughput accounting and back flush costing.
These forms a set of contemporary management accounting practices. Each technique has
its advantages and disadvantages and may be applicable under certain circumstances.
Szendi and Elmore (1993) drew a distinction between contemporary and traditional
management accounting practices. They found that new management accounting
techniques are being adopted while traditional systems are being maintained, thus
suggesting that management accounting is in a transitional stage. The inclination of
4

organizations towards new management accounting techniques has been explained as
facilitated by management accountants whose behavior is innovative cognitive in style
are more likely to initiate radical changes to the practices of their organizations (Emsley
et al., 2006).
To compete successfully in today’s highly competitive global environment, companies
are adopting new management accounting practices, changing their manufacturing
systems and investing in new technologies. This study focuses on the change in
management accounting and how such changes have been adopted by large
manufacturing companies in Kenya.
1.1.2 Large manufacturing firms in Kenya.
Kenya’s manufacturing firms are diverse in terms of the products that they are engaged in
and size as determined by the number of employees in such firms. These firms range
from small and medium sized to large. Large manufacturing firms are those employing
more than one hundred employees and an annual turnover or production level in excess
of kshs.500 million (International Finance Corporation,2002). Whereas these firms
engage in production of a wide range of products, food and beverage, metal engineering
and textile firms’ account for 63 % of manufacturing value added (GOK, 2006).The
sector was developed under import substitution policy (1967) but the policy emphasis
now is export oriented industrialization. The sector is heavily relied on production of
consumer goods. Government participation in manufacturing sector is smaller as
compared to private enterprises due to privatization policy. Within the private sector,
companies are owned and operated by both local and foreign investors. Most companies
are subsidiaries of multinational corporations.
5

Business environment in Kenya has rapidly changed as a result of globalization. Since the
liberalization of the Kenyan economy in 1990s this sector continues to experience both
global and local competition. In this regard, the manufacturing firms are required to
rethink and improve their processes. According to the directory of manufacturing
industries ,the firms are classified as either; food, beverage and tobacco; textile, wearing
apparel and leather industries; manufacture of wood and wood products; manufacture of
chemical, petroleum, rubber and plastic products; manufacture of non-metallic mineral
products; basic metal industries ;and manufacture of fabricated metal products,
machinery and equipment.
Large manufacturing firms sector has been selected for this study because it is claimed
that the origin of today’s management accounting systems can be traced back to the
industrial revolution, therefore making it reasonable to assume that manufacturing firms
will pioneer in the adoption of management accounting changes. Also, large
manufacturing firms have adequate resources, hence easy to meet the implementation
costs of adopted changes in management accounting systems.
1.2 Statement of the problem.
The operating environment of manufacturing entities in which management accounting is
practiced has faced dramatic changes with advances in information technology, highly
competitive environments, change in customer demands and focus on quality. In many
developed countries management accounting practice has introduced new cost and
management accounting systems in order to cope with these changes in the operating
environment. Such management accounting systems include; activity-based costing
6

(ABC), activity-based management (ABM), target costing, product life cycle costing,
quality cost management, customer accounting, and the balanced scorecard (BSC)
approach to performance measures. For example, in Canada Libby and Waterhouse
(1996) reported a 31 per cent change in management accounting systems within a period
of three years, refuting claims that management accounting is generally resistant. In the
U.K Bums et al (1999) found significant changes in management accounting practices in
the last decade. They argued that the change is in regard to the way management
accounting is used and not necessarily introduction of new systems or techniques. A 1990
UK survey reported by Bromwich and Bhimani (1994) indicates that the cost
management techniques most commonly used or planned to be used by UK firms were;
ABC, cost modeling, and costs of quality. Other techniques were; target costing, strategic
management accounting, and throughput accounting. The 1990 survey is consistent with
Boer (2000) that found an emphasis on strategic management. A USA survey by Silk
(1998) estimated that 60% of Fortune 1000 firms have experienced with the balanced
scorecard.
However, there is little research on the adoption of these practices in developing
countries for example, Cadez and Guilding (2007) surveyed manufacturing companies in
Slovenia benchmarked with Australia on strategic management accounting usage, and
they found a non-uniform adoption. Some techniques that have popularly high ranking in
one country were relatively low in another country. They attributed this to contextual
variables of difference in economies and cultures of the countries. Wallace, (1990) found
no different techniques in rich and poor countries or that Less Developed Countries
(LDCs) import grossly inappropriate practices. No management accounting system is
7
unique to LDCs has been found. Wallace (1990) claims accounting in LDCs is a tale of
importation of western practices and institutions by transnational accounting firms.
Bromwich and Bhimani (1989) argue that merely transplanting new management
accounting systems devised in foreign settings for coping with a changing business
environment is not totally satisfactory because of the diverse conditions under which
different companies operate. They further argue that consideration should always be
made of the political, economic, social and cultural environments that surround the firm.
The evidence on the use of more contemporary and more sophisticated management
accounting tools and techniques in emerging and/or developing nations remains mixed
and is currently not suggestive of a “natural” evolution as argued by the above-mentioned
authors (Van Triest and Elshahat, 2007).
A number of studies have been carried out in Kenya addressing the application of specific
management accounting practices. The studies have examined the kind of practices that
organizations apply most (Wangari 2008, Arithi 2001, Nzule 1999, Waweru 1999, Osewe
1998 Gathumbi 1997 and, Minja 1995,).None of these studies has sought to explore why
and how management accounting systems have changed and why new or innovative
practices have or have not been adopted in Kenyan context. This study is intended to
bridge this knowledge gap. It is against this background that the following research
questions arise;
i. What changes have occurred in management accounting systems in the last two
decades?
ii. What factors facilitate/hinder management accounting system change in large
manufacturing companies in Kenya?
8

1.3 Objectives of the study.
The specific objective;
To explore management accounting systems change.
Other objectives;
i. Establish the management accounting systems adopted by Kenyan large
manufacturing companies.
ii. Identify the factors that facilitate /hinder the management accounting systems
change in large manufacturing companies in Kenya.
1.4 Importance of the study.
The study will be of importance to the management accountants of large manufacturing
firms as its findings will provide an understanding on management accounting systems
change and the drivers of change.
Professional bodies would find this study of importance to understand the state and trends
in management accounting practices.
Academicians will find this study of interest as it will show the extent to which
management accounting system changes are adopted by organizations and the drivers of
change hence relate theory with practice.
9

CHAPTER TWO
2.0 LITERATURE REVIEW
2.1 Introduction.This chapter presents the theoretical framework for the study, change in management
accounting systems, factors facilitating management accounting systems change and the
factors limiting the adoption of these practices. Empirical researches and the summary of
the literature.
2.2 Theoretical frameworks.Management accounting systems change is grounded on some theories that try to explain
why organizations tend to change their practices. This study is based on the following
theories:
2.2.1 Contingency theory.To design effective management accounting control systems it is necessary to consider
the circumstances in which they will be used. It should be apparent that there is no
universally best management accounting control system which can be applied to all
organizations. The applicability of management accounting control system is contingent
on the situational factors faced by organizations. This is the contingent theory approach
to management accounting. The situational factors represent the contingent factors (also
known as contingent variables or contextual factors. Examples of the contextual factors
that have been examined in the literature include the external environment faced by the
organizations, the type of competitive strategy adopted, organization structure, nature of
the production process) (Drury, 2008 pg. 407).
10

Contingency theory (Bums and Stalker, 1961; Lawrence and Lorsch, 1967) provides an
explanation of why management accounting systems vary between firms operating in
different settings (Otley, 1980; Innes and Mitchell, 1990; Fisher, 1995). As Otley (1980)
suggests: The contingency theory of management accounting is based on the premise that
there is no universally appropriate accounting system applicable to all organizations in all
circumstances. Rather the contingency theory attempts to identify specific aspects of an
accounting system that are associated with certain defined circumstances and to
demonstrate an appropriate matching.
2.2.2 Institutional theory.The concept of institutionalization is important in explaining management accounting
change. Oliver (1997) has noted that institutional activities tend to be long-lasting,
socially accepted, resistant to change, and not directly dependent on rewards or
monitoring of their permanence. In the context of management accounting, Scapens
(1994) has observed that, over time, management accounting can constitute a structure
that reflects a particular organisation's way of thinking and acting which is taken for
granted and detached from its specific historical circumstances. It thus becomes an
unquestioned way of doing things. A particular management accounting system can be
accepted if it conforms to the socially accepted norms. The work of DiMaggio and
Powell (1983) suggests that the various actors operating in and around organisations can
create the institutional pressures that lead individual organisations to adopt specific
structures and procedures. For instance, the government and its agencies can be a source
of coercive pressures, professional bodies can contribute to the creation of normative
pressures and consultants may have an important role in the emergence of mimetic
pressures. In this paper, we suggest that the institutional context in and around
11

organisations can be envisaged as a field in which multiple actors undertake strategies of
power to enroll others, including top managers, to specific representations of the
organization. Therefore, such pressures may lead to the change in management
accounting practices in order for an organization to comply.
2.3 Changes in management accounting systems.The changes in management accounting systems entail a move from use of traditional
management accounting techniques/tools to the use of innovative or contemporary
management accounting practices. The changes may also encompass the way in which
management accounting is used and not necessary adopting new management techniques.
2.3.1 Costing systems.The costing system (or cost accounting system) estimates the cost of goods and services,
as well as the cost of organisational units, such as departments. Managers may need
information about product costs for a range of strategic and operational purposes
including setting prices, controlling operations and making decisions about the
continuation of a particular product. Traditional absorption costing systems have long
been subject to criticism. Two long-standing issues have been the choice of appropriate
overhead recovery rates i.e. plant wide or more specific, and secondly the controversy
about the need to recover/allocate (absorb) overheads at all. During the last two decades
the problems of traditional absorption costing were again brought under the spotlight.
This time the focus of criticism was that these systems do not accurately measure costs
for decision making purposes and activity based costing (ABC) has been developed and
promoted.
12

ABC is a theoretical approach that has provided manufacturing firms with a better grasp
of their costs, and has led to important practical implications for operating managers in
both the manufacturing and service industries. Kaplan and Cooper (1988)_demonstrated
that the domain of traditional contribution margin analysis could be greatly enhanced by
the use of ABC. ABC has major advantages over other costing methods by showing the
ability to trace overhead costs to individual products, which allows for more accurate unit
costing [Cooper and Kaplan, 1992; Garrison and Noreen, 1997). The key to proper use of
ABC methods is to trace overhead costs to products and not merely to allocate them
(although some cost allocation may be necessary during the ABC process). Furthermore,
ABC infers that activities cause costs and that cost objects create the demand for
activities. The general conditions that make companies good candidates for the
application of ABC systems have been pointed out, such as a diversity of resource
consumption, or the fact that product and resource consumption are not correlated with
traditional cost allocation methods.
2.3.2 Planning and control systems.Planning and control systems are a vital element of management accounting. As part of
strategy implementation, organisations need to put in place plans to set the direction of
the organisation, and control systems to ensure that operations are proceeding according
to plan. Planning and control systems provide the framework for effective resource
management to generate customer and shareholder value. Long-term planning entails
capital budgeting. The appraisal of capital budgeting decisions requires the use of
methods that take into account the time value for money, such as net present value
(NPV), internal rate of return (IRR). Frequently used methods in practice include the
payback period method and the accounting rate of return. These methods are
13

theoretically weak and they will not necessarily lead to maximization of the market value
of ordinary shareholders (Drury, 2008).
A budget is an example of a plan that summarizes the financial consequences of an
organization’s operating activities for a specified future time period, usually one year.
Even if traditional budgeting has been questioned in the past decades, we can observe
that for many companies it is still a key element of their management control system. Due
to environmental uncertainty, the budget is being subject to considerable criticism and
debate (Hope & Fraser, 2000, 2003a; Bogsnes, 2009).Recent budget process
developments have focused on two practices: improving the budgeting system or
abandoning it (Hansen et al, 2003, p. 95). The first type aims at maintaining the process,
improving it with complementary techniques such as activity-based budgeting or rolling
forecasts and zero- based budgeting systems. The second category is more radical and
advocates for the complete elimination of the budgetary process, to enable firms to
respond faster and therefore, cope better with uncertainty (Hope & Fraser, 2001, p. 23).
As a matter of fact, some European companies, such as Volvo, Rhodia, Borealis, have
already dismantled their budgeting process (Hope & Fraser, 2003a).
Activity-based budgeting (ABB) has been defined by Ayvaz & Pehlivanli (2011, p. 150)
as “the budgeting of resources according to target activities.” The application of this type
of budgeting system is easy to use, as it focuses on the activities within the process rather
than cost objects. Its primary purpose is to collect all costs within the process which
14

includes materials, setup time, number of hours worked and manufacturing overhead that
is to be included in the budget.
2.3.3 Performance measurement systems.The choice of measures to guide and evaluate the performance of business units is one of
the most critical challenges facing organizations (Ittner and Larcker, 1998). Management
accounting should report all relevant information related to the evaluation of business
units' performance. Systems which focus solely on financial measures such as profits,
sales growth, return on investment(ROI),return on capital employed(ROCE) standard
costs and variance analysis have been widely criticized (e.g. Ittner et al., 1997; Kaplan
and Norton, 1996; Shields, 1997). The criticisms arise because these measures are
distorted by external reporting conventions; they promote short-termism and accounting
manipulation, and do not take into consideration the cost of capital or non-financial
“leading” measures such as customer satisfaction, labour efficiency, on time delivery,
quality or innovation.
To incorporate the cost of capital into financial measures a variety of “economic value”
measures have been introduced (Ittner and Larcker, 1998)._Residual income was
developed in 1950s but more recently “Economic Value Added” (EVA®) was promoted
as a proprietary adaptation of residual income. EVA® can be defined as adjusted
operating income minus a capital charge, and implies that a manager's action only adds
economic value when the resulting profits exceed the incremental cost of capital. Kaplan
and Norton (1996) introduced the Balanced Scorecard (BSC) as a way of integrating
financial and non-financial performance measures. In their model business unit
15

performance should be evaluated from four perspectives: financial, customer-related,
internal business processes, and learning and growth.
2.3.4 Cost management and Strategic management accounting systems.Since, the mid 1980s criticisms about the current state of management accounting
practices were widely publicized in the professional and academic literature (Johnson and
Kaplan, 1987; Ashton et al. 1991 ;). Revisions of management accounting practices have
produced a variety of novel approaches in the fields of costing, strategic investment
appraisal, strategic control and performance management. Paralleling developments at
the level of individual accounting techniques the new term “strategic management
accounting” has emerged. Hoque (2001) sees the significance of SMA to be such as to
view it as a whole new discipline. Simmonds (1981) was the first to use the term “strategic
management accounting.” He defined it as “the provision and analysis of management
accounting data about a business and its competitors for use in developing and
monitoring the business strategy”. What constitutes SMA techniques is not clear.
However, Guilding et al. (2000) highlighted that techniques qualifying as “strategic
management accounting” should exhibit degrees of one or more of the following
orientations: environmental, competitive, marketing, or long-term, forward-looking
orientation. Departing from the position taken by Cooper and Kaplan (1988), it is felt
that activity-based costing is more concerned with costing accuracy rather than the
adoption of a strategic-orientation, hence excluded as SMA technique. The following are
presumed to be the SMA techniques;
2.3.4.1 Target costing.According to the technique, the target cost (TC) results from the difference between the
product price, derived from how much the market can support, and a desired target profit.
16

Through an accurate product design, the costs must be contained to achieve the TC
(Monden & Hamada, 1991; Morgan, 1993).External market factors intervene frequently
in this strategic management accounting technique. In a wide-reaching review paper of
TC, Ansari et al. (2007) claimed that TC is being increasingly adopted by a number of
leading firms through the world, even pointing to some diffusion in India and Malaysia.
They point to individual companies in the USA, like Chrysler and Caterpillar, who
attribute their financial success in the mid-1990s to the adoption of target costing. They
argued that while TC is fairly mature in Japanese assembly industries, it is fairly young in
the USA and Europe and is found in some auto and assembly companies. They stated that
many managers underestimate the potential of target costing, and this may be one reason
for low adoption.
Ansari et al. (2007) presented a comprehensive review of more than 80 publications in
English and 100 in Japanese that deal with target costing. These are mostly normative or
technical papers, but also include case studies of TC success, including those in the US
automotive industry. But they do point to the work of Koga (1999) and Koga and
Monden (2000) who found many companies in the camera manufacturing industry did
not meet cost targets. There are only a few surveys of practice. Tani et al. (1994) found
that 109 of the corporations surveyed had implemented TC. Boer and Ettlie (1999), in a
survey of 126 US corporations, found that many estimated costs in the product design
phase. This could be interpreted as a very partial or preliminary implementation of TC.
2.3.4.2 Lifecycle costing.It aims at calculating the total cost of a product along its life cycle (from the design to the
decline, through introduction, growth and maturity (Shields & Young, 1991; Wilson,
17

1991). Its clear long term accounting perspective and market orientation make it part of
the SMA techniques.
2.3.4.3 BenchmarkingBenchmarking is a technique that is increasingly being adopted as a mechanism for
achieving continuous improvement. It is a continuous process of measuring a firm’s
products, services or activities against the other best performing organizations, either
internal or external to the firm. The objective is to ascertain how the processes and
activities can be improved (Drury, 2008).
2.3.4.4 Just-in-time systems.The just-in-time (JIT) approach involves a continuous commitment to the pursuit of
excellence in all phases of manufacturing systems design and operations. The aims of just
in time are to produce the required items, at the required quality and in the required
quantities, at the precise time they are required (Drury, 2008).
2.3.4.5 Total quality management (TQM).Is a cost management tool that is based on continuous improvement (kaizen) principles to
facilitate change on a constant and progressive basis. It does not merely focus on
satisfying the customer’s needs, but also on exceeding the expectations of the customer
(Blocher et al 2002).
2.3.4.6 Attribute costing.This SMA technique is concerned with costing the benefits that products provide to
customers (Roslender and Hart, 2003). Bromwich (1990) sees these benefits as
constituting the ultimate cost drivers. The customer (external orientation highlights why
attribute costing may be considered as an example of SMA).
18

2.3.4.7 Competitive position monitoring.Simmonds (1986) talks of competitive position as an asset with finite earning potential.
As part of competitive position assessment, Simmonds suggests that trends with
respect to sales, market share, volume, profit, unit cost, and cash flow should be
appraised when formulating strategy. Although Simmonds noted that accounting is still a
long way from being able to quantitatively express an organisation’s competitive
position in a single-figure, Rangone (1997) describes an analytical framework that results
in a single-figure denominated quantitative assessment of an organisation’s competitive
standing.
2.3.4.8 Competitor cost assessment.This technique can be distinguished from competitive position monitoring due to its
specific concentration on the cost structures of competitors. Advocates of this technique
(Simmonds, 1981; Jones, 1988; Bromwich, 1990; Ward, 1992) argue that an assessment of
a key competitor’s relative cost position can yield an enhanced appreciation of an
organisation’s strategic decision-making environment.
2.3.4.9 Competitor performance appraisal.Moon and Bates (1993) propose that strategic performance and key sources of
competitive advantage can be assessed by applying an appropriately conducted
analysis of competitors’ published financial statements. Moon and Bates illustrate this
analytical technique by investigating and interpreting the accounts of two UK retailers.
2.3.4.10 Customer profitability analysis.This appears to be most widely-discussed customer-focused accounting technique.
Commentaries have been provided by Shapiro et al. (1987) and Ward (1992). The
technique is concerned with tracing customer specific costs and sales to individual
19

customer accounts (Guilding and McManus, 2002).
2.3.4.11 Integrated performance measurement.Integrative performance measurement systems provide financial and non-financial
performance measures that cut across a range of organizational perspectives. When
combined together, “these measures provide a way of translating strategy into a coherent
set of performance measures” (Chenhall, 2005, p. 396). This SMA technique can be seen
to be closely related to the balanced scorecard that has been popularized largely through
the writings of (Kaplan and Norton, 1996).
2.3.4.12 Lifetime customer profitability analysis.This approach moves beyond computing the annual profit that will be generated from
a particular customer to considering all future projected profits that will result from a
trading relationship with a particular customer (Guilding and McManus, 2002). The use of
profitability analysis over multiple years is motivated by marketing practitioners’ common
observation that customer profitability changes with the length of the trading relationship
(Foster and Gupta, 1994; Jacob, 1994).
2.3.4.13 Quality costing.Belohlav (1993, pg.55) argues that “a common denominator in many discussions on
competitiveness and strategy is the issue of quality.” Typically, quality costs are
classified into four categories: prevention, appraisal, internal failure, external failure
(Albright and Roth, 1992).Today, in many firms quality is typically defined in terms of
customer satisfaction.
2.3.4.14 Strategic pricing.Pricing decisions based on a conventional internally-oriented and historically-based
analysis can result in sub-optimality. The data used in making pricing decisions
20

should be supplemented with information regarding possible competitor reactions to
any proposed change in pricing policy. This was illustrated in a case study by Rickwood
et al. (1990).
2.3.4.15 Value chain costing.Shank and Govindarajan (1992) developed a costing method that represents a management
accounting operationalisation of Porter’s (1985) value chain analysis. The focus of this
technique is external to the firm as it involves viewing the organization as a link in the
chain of all value-creating activities associated with the provision of a product or service.
Shank and Govindarajan (1992) demonstrate that traditional value added analysis can
be seen to be somewhat narrow as it fails to consider any latent cost savings that lie
unrealized in the firm’s linkages with its suppliers and customers.
2.4 Factors facilitating management accounting systems change.
Studies on the determinants of MASs and change found various organizational, technical,
and economic factors that influence the diffusion and adoption of these practices. The
prevailing factors found in prior studies are global competition and changes in technology
(Waweru et al., 2004), performance gap (Lin and Yu, 2002), organizational structure
(Abemethy and Bouwens, 2005; Cavalluzzo and Ittner, 2004), top management support
(Cavalluzzo and Ittner, 2004), and the influence of government (Lapsley and Wright,
2004). Contradictorily, Libby and Waterhouse (1996) found that organizational structure,
size, and competition did not predict changes in management accounting systems.Based
on the literature I identified the following contingent factors which might influence the
adoption of contemporary management accounting systems in the participating
organizations;
21

2.4.1 Deregulation/global competition.The period between 1990 and 2000 was characterized by the opening up of most
developing economies. Many state owned enterprises have since been privatised, while
most of the protectionist barriers have been removed, substantially altering the
competitive environment in these economies (IMF, 1990; Narayan et al., 2000).
Globalisation has exposed companies in developing countries to stiff competition. Most
of them now have to cope with the declining market share while several have been forced
out of the market. Companies operating in these countries now require quality and timely
information and hence the need to change their management accounting systems.
Research provides evidence that managers faced with high levels of competition require a
variety of both financial and non-financial information for making organisational
decisions (Libby and Waterhouse, 1996; Hoque et al., 2001; Cooper, 1995).
2.4.2 Manufacturing Technological advancements.The introduction of fast microcomputers and the widespread use of the Internet have
greatly affected the technological environment within which firms in developing
countries operate. Such changes have also affected the production and product or service
delivery processes. Customers have also become more demanding insisting on high
quality products at competitive prices. This has resulted in an increased focus on quality
and better customer service by those firms wishing to retain competitiveness (Whitley,
1999; Cooper, 1995). According to Al-Omiri and Drury (2007) organizations with high-
quality information systems can provide detailed data that are easy to access relating to
the cost driver information that is needed by more sophisticated costing systems.
22

2.4.3 Size and type of organizationSize and nature of business may also determine the range of possible change in
organisational systems. For example, since large organisations have adequate resources to
develop new management accounting techniques, their systems are expected to be
different from those of smaller companies (Innes and Mitchell, 1995; Hoque and James,
2000).Many researchers found that company size is positively related to accounting
sophistication and control systems (Choe, 1996; Guilding, 1999; Haldma and Laats,
2002; Libby and Waterhouse, 1996;). Furthermore, the larger the size of the company,
the lower the costs of processing information (Guilding, 1999 ).Increased organizational
size or number of employees typically brings decentralized structuring of activities and
more decision-making autonomy at the lower levels in the organization (Harrisson and
McKinnon, 2007). Hoque and James (2000) found that there is a positive relationship
between size of the organization and BSC usage. Thus, the bigger the company, the more
practical it is to use BSC to support their strategic decision-making.
2.4.4 Organizational strategyThe logic for linking management accounting and control system to strategy is based on
the following propositions developed by Anthony and Govindarajan (2007) .Different
organizations generally operate in different strategic contexts. Different strategies require
different task priorities, key success factors, skills, perspectives, and behaviors for
effective execution. Control systems are measurement systems that influence the
behavior of the people whose activities are being measured. Thus, a continuing concern
in the design of control systems should be whether the behavior induced by the system is
consistent with the strategy. From a contingency perspective, accounting theoreticians
have claimed that the MAS must fit the unit's strategic-type to achieve performance
23

(Chenhall and Langfield-Smith, 1998. Empirical research linking organizational strategy
to MAS in industries generally contends that strategy influences MAS (Langfield-Smith,
1997). Kober et al. (2007) analysed the role of strategy, arguing that management control
systems both shape and are shaped by the strategy.
2.4.5 Organisation structure.Organization structure is regarded as the formal specification of the different roles, job
tasks for organization members with established pattern of relationships between the
component parts of an organization, with the details of communication, control and
authority pattern (Robbins, 1990; Moores and Mula (1993). Organization structure is the
level of decentralized decision autonomy. It was viewed as one element of contextual
variables that impinge on the overall control system within an organization. According to
Robbins (1990), organization structure was a natural influence on management
accounting system design.
2.5 Factors limiting management accounting systems change.There are many other factors that limit management accounting change. These may
include lack of adequate accounting skills; new shareholders; fear of change; “no need
for change” attitude; and lack of adequate communication between management and
staff. There is a wide body of literature to support this ( Lee, 1987; Hopwood, 1990;
Innes and Mitchell, 1990; Waweru et al.,2004).
24

2.6 Empirical researchesChenhall and Langfield-Smith (1998), surveying the Australian manufacturing sector,
found that traditional management accounting techniques were found to be more widely
adopted than recently developed techniques and that there is greater attention being paid
to newer techniques in the future, especially activity-based techniques and benchmarking.
Their concluding comments suggest that future research should be directed at gaining a
better understanding of the factors that influence differences in the levels of adoption of
recently developed management accounting techniques between countries.
Joshi (2001) reports on a survey administered in 1998 among 60 Indian industrial firms.
Overall, the level of sophistication seems high: 65 percent of the respondents use multiple
allocation bases, and ABC adoption in the sample is 20 percent. Especially, the ABC
adoption seems high, given that reported adoption rates in Western countries range
between 10 and 20 percent (Brown et al., 2004, p. 330).
Haldma and Laats (2002) conducted contingency theory research in Estonia. Estonia
regained independence in 1991 and has since undergone fundamental political and
structural changes. These changes were found by the researchers to have influenced the
operations of the companies there. The authors found some evidence that changes in cost
and management accounting practices are associated with shifts in the business and
accounting environment as external contingencies, and with those of technology and
organizational aspects as internal contingencies. Of their sample, 7 percent use ABC.
Multiple allocation bases for costs are used by 70 percent of respondents. Haldma and
25

Laats (2002, p. 395) also observe that within their sample, the “level of sophistication is
of a cost accounting system tends to increase in line with company size”.
The survey reported by Garg et al. (2003) was conducted in 2003 and found traditional
management accounting techniques are still widely used and new cost management
techniques are not a priority. The survey also found that the most widely used techniques
were operational budgeting, quantitative techniques, traditional costing, and overhead
allocation. The techniques used widely were also ABM & standard costing, capital
budgeting, breakeven analysis, and transfer prices. Other techniques which were newer
management accounting developments such as the balanced scorecard, value chain
analysis, and supply chain costing were not adopted as often.
Clarke et al. (1999) studied the state of management accounting practices in Ireland. The
data were collected from a questionnaire survey mailed to 511 Irish manufacturing
companies. They found that ABC systems were not as widely used within Irish
companies as within companies in the USA, the UK, and Canada because “the practice of
management accounting in Ireland is marginalized.” In other words, Irish management
accountants work as record keepers rather than innovators and decision facilitators,
possibly due to supply and demand barriers. Also, the results indicate that ABC was not
well understood by Irish management accountants.
Xiao et al. (2007) studied the use of Management accounting practices (MAPs) in China
and attempted not only to establish if there had been an increase in the use of MAPs by
26
businesses in China but also to examine if there was a difference in use depending on the
businesses’ location in China, the industry type and the size of the business. They found
that in general there had been an increase in the use of MAPs but that the various degrees
of regional economic development in China had little impact on that use; however, based
on their observations, they concluded that larger firms and firms in the manufacturing
sector are more likely to have implemented management accounting methods.
Waweru et al. (2004) conducted a research on management accounting change in South
Africa. The research was done using a contingency theory framework within four retail
companies to understand the processes of their management accounting systems change
and to explore the rationales for such change processes. The findings indicate
considerable changes in management accounting systems within the four cases. Such
changes include increased use of contemporary management accounting practices notably
activity-based cost allocation systems and the balanced scorecard approach to
performance measures. The paper suggests that recent environmental changes in the
South African economy arising from government reform/deregulation policy and global
competition largely facilitated the management accounting change processes within the
participating organizations.
Hyvonen (2005), carried a study on large manufacturing firms in Finland, her attempts
were to identify the level of adoption of various MAP, the received benefits from the
adoption, and the intentions of Finnish manufacturing firms to emphasize the practices in
the future. Her findings suggest that financial measures like product profitability analysis
27

and budgeting for controlling costs is likely to be important for the future and also greater
emphasis will be placed on newer MAP like customer satisfaction surveys and employee
attitudes.
Mat et al. (2010) studied management accounting and organizational change in
Malaysian manufacturing firms. They found that majority of responding companies had
reacted positively to changes in the competitive business environment and advanced
manufacturing technology. Significant changes in management accounting practices were
also influenced by structure and strategy.
Studies done in Kenya have concentrated on the application of specific management
accounting practices. Minja (1995), tried to find out whether divisionalised companies do
measure performance for their divisions, the objective of performance measurement and
the performance measure indicators used. He concluded that control, profitability,
planning and strategy formulation, managerial performance, investment decisions and
managerial remuneration were identified as the main objectives of performance
measurement. The main measurement indicators were; accounting profit, return on
investment, residual income and sales revenue.
Osewe (1998) studied the factors guiding the choice of performance measures in practice
and association between organization characteristics and performance measurements. His
conclusion was that most firms preferred financial measures to non-financial measures.
28

Waweru (1999) carried out a survey on the application of management accounting
practices by publicly quoted companies in Kenya. The findings from his analysis led to
the following conclusions; budgeting was the mostly used practice, planning and control
were indentified as the major purposes of management accounting reports, simple
management accounting techniques were found to be preferred to complex techniques
and management accounting theory related well with practice.
Nzule (1999) carried out a survey to establish the adoption of activity based costing
systems by selected companies in Kenya. A structured questionnaire was used to collect
data from a sample of 35 companies. The findings were that 54 % of the companies were
found to be using ABC. The main reason for adoption of ABC was to improve cost
control and the main motivation was to reduce costs.
Arithi,(2001) studied the application of strategic management accounting by large
manufacturing companies in Nairobi .The sample frame adopted was that of companies
listed in the Kenya association of manufacturers(KAM) 1999 directory. The study
revealed that target costing and cost analysis are the mostly applied techniques of
strategic management accounting. The balanced scorecard and value chain analysis did
not appear to have taken root among large manufacturing firms.
29
2.7 Chapter SummaryFrom the literature we observe that there is little empirical research in management
accounting change research in developing countries. This study builds on, but the work is
distinguished from earlier studies in Kenyan context in that it looks at a broad set of
contemporary management accounting practices (costing, planning and control,
performance evaluation and cost management and strategic management accounting) in
the manufacturing sector. Prior research has focused either on the application of
management accounting practices generally or application of specific management
accounting practices. Furthermore there is no published empirical evidence about the
adoption rate and the factors influencing/ hindering the adoption of management
accounting changes grounded on theory as there has been in other countries.
30

CHAPTER THREE
3.0 METHODOLOGY.
3.1 Introduction.This chapter presents the research design that was employed in the study, the study
setting, population of the study and the sample and sampling procedures followed by data
collection, data analysis, validity and reliability.
3.2 Research design.This study employed a descriptive survey research design. A descriptive survey is a
design used to collect data from members of a population in order to determine the status
of that population with respect to one or more variables (Mugenda and Mugenda, 2003).
Descriptive survey designs are appropriate where an understanding of the characteristics
of a population in the way they use common practices is sought (Sekaran, 2007).
3.3 Study setting.The study focused on the large manufacturing companies located in Nairobi. This is
because most of the large manufacturing companies are concentrated in Nairobi; hence
they represented all the categories that were required for the study. It was found to be
convenient in data collection given the available time.
3.4 Population of the study.The population of the study comprised of all the large manufacturing companies in
Nairobi. Large manufacturing companies are those employing more than one hundred
employees and/or an annual turnover or production level in excess of kshs.500
million(Intemational Finance Corporation,2002) As at June 2007, there were 2085
31

manufacturing companies in Kenya(GOK).Of this number ,759 companies were located
in Nairobi.
3.5 SamplingA disproportionate stratified random sampling technique was used to select a sample size
of 50 companies. This was considered adequate for this study because 50 are well above
30 that have been recommended as the minimum sample size for surveys (Saunders et al.
2000). In similar studies in manufacturing companies in Kenya (Nzule, 1999; Odongo,
2008) used sample sizes of, 35 and 30 respectively.
The classification and sample selection is presented in table 3.1
Table 3.1 Sampling procedures.
Category Total number in
category
Proportion (%) Sample size
Agro processing. 226 29.8 12
Wood and wood products. 74 9.7 6
Capital goods & spare parts. 28 3.7 1
Iron and still making 43 5.7 3
Electrical and electronics. 24 3.2 1
Construction & equipment. 54 7.1 4
Pulp and paper 114 15 7
Chemical processing 134 17.6 11
Ceramics and glass making 62 8.2 5
Total 759 100 50
The number of employees was used to determine the firm’s size. Large manufacturing
firms are those employing more than 100 staff according to the Kenya Industrial
Research Development Institute (KIRDI, 1997).The KIRDI directory classifies the
population into a size class code and the number of employees.
32
3.6 Data collection.Primary data was used for this research. Data was collected through the help of a semi-
structured questionnaire. Interviews were conducted to gain more insight on open-ended
questions. The questionnaire was administered through the drop and pick later method
accompanied with a covering letter explaining the purpose of the study and assuring the
confidentiality of information provided.
The questionnaire was administered to executives in the financial departments
(management accountants) or their equivalents that had firm knowledge of the cost and
management accounting practices that have been adopted and used within their firms.
The survey was organized covering the large manufacturing firms based in Nairobi,
according to their number of employees selected from the KIDRI directory.
3.7 Data analysisThe data was checked for completeness, coded and presented using tables. Demographic
data of the firms used in the survey was presented in tables. Data was analyzed using
content analysis for open-ended questions, descriptive statistics for data based on scales,
regression- path analysis using Statistical Package for Social Sciences (SPSS) version
17.0 software for data relating to contextual variables influence on MAS change
adoption. The analysis was tied to each objective so as to reach reliable conclusions.
3.8 Validity and Reliability.Validity of the research instrument was established by presenting it to a panel of three
accountants who had along experience in management accounting to refine the content of
33

the research instrument. Construct validity was tested by how well the collected data
correlated to theory.
Reliability of the research instrument was established through a pilot study in one of the
large manufacturing firms that was not included in the study. The ambiguities,
weaknesses and inconsistencies that were noted were corrected before the actual data
collection.
34
CHAPTER FOUR
4.0 DATA ANALYSIS AND PRESENTATION.
4.1 Introduction.This chapter presents the profile of the companies surveyed, management accounting
systems, change in management accounting techniques, factors facilitating management
accounting change hindrances to management accounting systems change, group parent
company pressures influence on management accounting systems change. The summary
and interpretations of findings is presented last.
4.2 Profile of companies.A profile of the responding companies is presented in table 4.1 below. As can be seen
from table 4.1 the majority of respondents are companies with a business life of over 20
years (93.8%);followed by companies that have been in existence for between 11-20
years(6.3%) and non of the respondent companies has a business life of less than 10
years.
Out of the various industries engaged in this study, only 11 (34.4%) of them are local
companies while 20 (62.5%) of the respondents are foreign companies operating in
Kenya. Out of the 32 companies participating in this research, 34.4 % produce consumer
products, 62.5% for industrial supply and 3.1% for both consumer and industrial supplies.
Of the responding companies 18.8% have an annual turnover in millions of less than
shs.500 million while 71.9 % have an annual turnover of over shs.500 million.
The sample for this study embraces large manufacturing companies. Large manufacturing
companies are those having more than 100 employees (International Finance
Corporation, 2002). The majority of the respondents indicated that they had 200-499
35
(53.1%) employees; followed by over 500 employees (25%); and 100-199 employees
(21.9%).
In terms of industry category, it can be seen that majority of the respondents are from
chemical processing (31.3%); followed by agro processing (25%); pulp and paper
(12.5%); construction and equipment (9.4%); wood and wood products, iron and steel
making and ceramics and glass making (6.3%) each; capital goods and spare parts (3.1%)
with no response from the electrical and electronics industry.
36

Table 4.1: Descriptive statistics of responding companiesFrequency. Percentage.
Business life in years5-10 years 0 011-20 years 2 6.3Over 20 years 30 93.8Total 32 100Business scopeLocal 11 34.4International 20 62.5Non response 1 3.1Total 32 100Type of productConsumer 11 34.4Industrial product 20 62.5Others 1 3.1Total 32 100Turnover(millions)Less than 500 million 6 18.8Over 500 million 23 71.9Non response 3 9.4Total 32 100Total number of employees100-199 7 21.9200-499 17 53.1Over 500 8 25Total. 32 100Industry categoryAgro processing 8 25.0Wood and wood products 2 6.3Capital goods and spare parts 1 3.1Iron and steel making 2 6.3Electrical and electronics 0 0Construction and equipment 3 9.4Pulp and paper 4 12.5Chemical processing 10 31.3Ceramics and glass making 2 6.3Total 32 100Source: Survey data.
37

4.3 Management accounting systems.Respondents were asked to indicate whether they use the 23 systems listed adopted
directly from Libby and Waterhouse (1996) and whether such systems have been
changed for the last 10 years. The findings are presented in table 4.2 below. From the
table it can be seen that most of the respondent manufacturing companies in Kenya use
most of the management accounting systems listed in the table. The mostly used systems
entail; organizational performance measurement systems (65.6%); direct allocation of
manufacturing overhead (59.4%);measures of performance in terms of quality, and use of
more non-financial performance measures (53.1%); capital budgeting systems(50.0%);
strategic planning systems(46.9%); operational planning(43.8%); budgeting, individual or
team based performance measurement, direct allocation of other overhead and
information reported more frequently (40.6%). While management accounting systems
other than those listed in table 4.2 are indicted to be of minimal use by the surveyed
organizations.
However, as regards to whether the systems have been changed in any manner for the last
10 years, it can be seen that the frequency of change is smaller than the frequency of use
for most systems. Least changes are reported with respect to direct allocation of
manufacturing overhead (15.6%); reward system-bonuses (15.6%); and organizational
performance measurement systems (18.8%).
38

Table 4.2 Management Accounting SystemsManagement Accounting system Being Used Have changed Non
responseFreq Perce Frequ Perce Frequ Peruenc ntage ency ntage ency centy age
Budgeting 13 40.6 10 31.3 9 28.1Operation planning 14 43.8 11 34.4 7 21.9Capital budgeting 16 50.0 10 31.3 6 18.8Strategic planning 15 46.9 10 31.3 7 21.9Other planning systems 7 21.9 8 25.0 17 53.1Individual/ team-based performance 13 40.6 8 25.0 11 34.4measurementOrganizational performance measurement 21 65.6 6 18.8 5 15.6Measurement of performance in terms of quality
17 53.1 8 25.0 7 21.9
Measurement of performance in terms of customer satisfaction
12 37.5 9 28.1 11 34.4
Other performance measures 6 18.8 9 28.1 17 53.1Direct allocation of manufacturing overhead 19 59.4 5 15.6 8 25.0Direct allocation of marketing costs 12 37.5 8 25.0 12 37.5Direct allocation of other overhead 13 40.6 8 25.0 11 34.4Internal product transfers 9 28.1 6 18.8 17 53.1Other costing systems 9 28.1 6 18.8 17 53.1Reward systems - bonuses 16 50.0 5 15.6 11 34.4Reward systems - pay for performance plans
12 37.5 10 31.3 10 31.3
Other reward systems 14 43.8 6 18.8 12 37.5Information reported more frequently 13 40.6 7 21.9 12 37.5Use of more non-financial measures 17 53.1 9 28.1 6 18.8Information reported more broadly 6 18.8 10 31.3 16 50.0Other changes to reporting systems 5 15.6 12 37.5 15 46.9Other changes to systems that do not appear 7 21.9 8 25.0 17 53.1in this list
Source: Survey data
4.4 Change in management accounting techniques.Descriptive statistics for change in management accounting techniques are presented in
table 4.3. The results presented show a higher percentage use of traditional management
accounting techniques; the results are consistent with the literature of the management
39

accounting techniques that are applied in developing countries. Large manufacturing
companies in Kenya still focused more on the use of traditional management accounting
techniques. From table 4.3 the results show that the most popular traditional management
accounting techniques used are; sales (N/A= 0%); standard costs and variance analysis
(N/A=3.1%); residual income (N/A= 6.3%) and incremental budgeting (9.4%). This is
consistent with the findings of Chenhall and Langfield-Smith (1998).The most popular
advanced management accounting techniques are quality and innovation (N/A= 6.3%)
and labour efficiency (N/A=9.4%). While the advanced techniques that have little
adoption by Kenyan manufacturing companies are; beyond budgeting (N/A=75%);
economic value added (N/A=37.3%); value chain costing and attribute costing
(N/A=34.4%); target costing, lifecycle costing and balanced scorecard (N/A= 31.3%).
This is consistent with the findings of Arithi (2001) which revealed that the balanced
scorecard and value chain costing did not appear to have taken root among large
manufacturing firms in Kenya.
Table 4.3 Change in management accounting techniques
Chan
ge
in
MAT
No c
hang
e
new
tech
niqu
es
new
tech
niqu
es
Mod
ifica
tion
of ou
tput
Mod
ifica
tion
of
tech
nica
l
Aban
donm
ent m
ean
Q N/A
% % % % % % %Incremental budgeting 18.8 9.4 18.8 25.0 6.3 12.5 2.7 1.9 9.4Activity based budgeting 0 9.4 21.9 6.3 12.5 3.1 4.1 1.9 43.8Zero based budgeting 12.5 3.1 21.9 3.1 0 0 4.0 2.4 56.3Beyond budgeting 3.1 3.1 6.3 6.3 3.1 0 5.1 1.7 75.0Full/absorption 25.0 9.4 21.9 3.1 9.4 3.1 2.5 2.3 18.8Variable/marginal costing 18.8 6.3 21.9 18.8 9.4 0 2.6 2.0 15.6Activity based costing 12.5 6.3 18.8 12.5 12.5 0 3.3 2.2 28.1Residual income 37.5 12.5 15.6 9.4 6.3 0 1.5 1.8 6.3Sales 43.8 9.4 15.6 15.6 9.4 3.1 1.5 1.6 0
40

Return on investment 25.0 12.5 15.6 12.5 9.4 0 2.3 2.1 15.6
Economic value added 9.4 6.3 15.6 0 21.9 0 3.9 2.2 37.5
Balanced scorecard 12.5 9.4 12.5 6.3 12.5 3.1 3.5 2.3 31.3
Standard costs and
variance analysis
34.4 6.3 12.5 9.4 15.6 6.3 1.9 1.9 3.1
Customer satisfaction 37.5 3.1 15.6 3.1 15.6 0 2.0 2.2 12.5
Labour efficiency 31.3 9.4 15.6 12.5 9.4 3.1 2.1 2.0 9.4
Quality and innovation 28.1 18.8 15.6 3.1 12.5 3.1 1.9 1.9 6.3
On time delivery 31.3 15.6 15.6 3.1 12.5 3.1 2.1 2.2 12.5
Target costing 12.5 18.8 25.0 3.1 3.1 0 2.9 2.3 31.3
Lifecycle costing 18.8 9.4 12.5 9.4 6.3 0 3.1 2.4 31.3
Benchmarking 28.1 9.4 9.4 15.6 15.6 0 2.5 2.1 15.6
Just-in-time 15.6 12.5 12.5 18.8 0 3.0 2.3 28.1
Total quality management 25.0 12.5 15.6 6.3 15.6 0 2.3 2.1 12.5
Attribute costing 21.9 6.3 6.3 12.5 6.3 0 3.3 2.5 34.4
Competitive position
monitoring
25.0 9.4 15.6 9.4 15.6 3.1 2.7 2.2 18.8
Competitor cost
assessment
18.8 12.5 15.6 9.4 6.3 0 2.8 2.3 25.0
Competitor performance
appraisal
18.8 6.3 15.6 12.5 6.3 0 3.1 2.4 28.1
Customer profitability 25.0 9.4 18.8 9.4 6.3 0 2.6 2.3 21.9
Balanced scorecard 9.4 9.4 18.8 9.4 3.1 0 3.7 2.3 43.8
Lifetime customer
profitability analysis
9.4 9.4 18.8 9.4 12.5 0 3.5 2.2 34.4
Quality costing 12.5 18.8 6.3 12.5 12.5 0 3.2 2.3 28.1
Strategic pricing 18.8 6.3 12.5 15.6 6.3 0 3.2 2.4 31.3
Value chain costing 18.8 9.4 12.5 12.5 6.3 3.1 3.2 2.4 34.4
Average - - - - - - 2.9 2.1 -
Likert scale of 0-5: 0=No change; l=New techniques; 2=New techniques as replacements; 3=Modification of information output; 4=Modification of technical operations; 5=Abandonment; N/A= Not applicable;_________________________________________
Source: Survey data.
41

Table 4.4 represents frequencies for management accounting change dimensions in each
of the respondents’ company. The results show that a majority of the responding
companies have not made changes in the use of management accounting techniques
(31.23%). Excluding this group, the most commonly occurring change is introduction of
management accounting techniques as replacements (23.31%) and information output
modification (14.81%). This is consistent with Sulaiman and Mitchell (2005).
Introduction of new techniques (14.52%) was ranked fourth. Changes occurring in
modification of technical operation of the MAS and removal with no replacements
(abandonment) show the lowest percentages (13.93% and 2.2% respectively).
Table 4.4: Management accounting change dimensions
Dimensions of change Frequency Percentage (%) RankNo change 213 31.23 1Introduction of new techniques 99 14.52 4Introduction of new techniques as replacements 159 23.31 2Modification of information or output 101 14.81 3Modification of technical operation 95 13.93 5Abandonment 15 2.20 6
682 100.00
Source: Survey data
4.5 Factors facilitating management accounting change.
4.5.1 Competition.The descriptive statistics for all the indicators of competition variable as a factor
facilitating management accounting change is presented in table 4.5 below. The results
indicate that competition positively influence management accounting change and all the
indicators seem to be equally likely with an overall mean of (3.67). However,
42

competitor’s action and competitors’ markets/channels were found to have the greatest
influence with a standard deviation of (0.99 and 1.19 respectively).
Table 4.5 CompetitionCompetition Negligi
ble%
Lessnegligible
%Moderate
%
Intense
%
Extremel y intense
%
Mean S.d
Price competition 15.6 0 18.8 25.0 34.4 3.67 1.42New product development
9.4 12.5 21.9 37.5 15.6 3.39 1.20
Marketing/channels 6.3 6.3 21.9 28.1 28.1 3.72 1.19Competitor’s action 3.1 3.1 18.8 37.5 31.3 3.97 .99Competitor’smarkets
9.4 9.4 18.8 28.1 28.1 3.60 1.30
Average - - - - - 3.67 1.23Likert scale of 1-5: intense.
l=negligible; 2=less negligible; 3==moderate; 4=intense; 5=extremely
Source: Survey data
4.5.2 Manufacturing technology.Table 4.6 presents descriptive statistics for all variables in AMT. The results show that
most of the respondents indicated that flexible manufacturing technology and computer
aided manufacturing as the most important indicators with standard deviations of (1.22
and 1.36 respectively).
43

Table 4.6 Manufacturing technological advancements
Manufacturing Less Modera Extremely Mean S.dtechnologies Irrelevant irrelevant te Important important
% % % % %Flexible 6.3 9.4 9.4 34.4 37.5 3.90 1.22
manufacturing
systems
Computer aided
manufacturing
12.5 9.4 9.4 37.5 28.1 3.61 1.36
Just-In -Time 21.9 9.4 12.5 21.9 31.3 3.32 1.58
Computer -int.
manufacturing
28.1 9.4 18.8 21.9 15.6 2.87 1.50
Others 6.3 0 0 9.4 6.3 3.42 1.72
Average - - - - - 3.42 1.47
Likert scale of 1-5: 1=irrelevant; 2==Less irrelevant; 3==Moderate; 4=Important;5=extremely important.
Source: Survey data
4.5.3 Organization strategy.The literature has identified strategy as the most important factor in any organization for
survival. This is evident with the results presented in table 4.7. Majority of the
respondents reported an increased emphasis in their organizational strategy. The
indicators were rated as either important or extremely important by most respondents.
The results indicate that the customer focus strategies are emphasized more in the
surveyed organizations, (for example, provide high quality products=68.8%, provide on
time delivery =40.6% and make dependable delivery promises 34.4%). Except for,
provide low costs (9.4%) and provide unique products (6.3%) none of the strategic
variables was identified as irrelevant. Among these items provide high quality products,
provide on time delivery and make dependable delivery promises are seen as the most
44
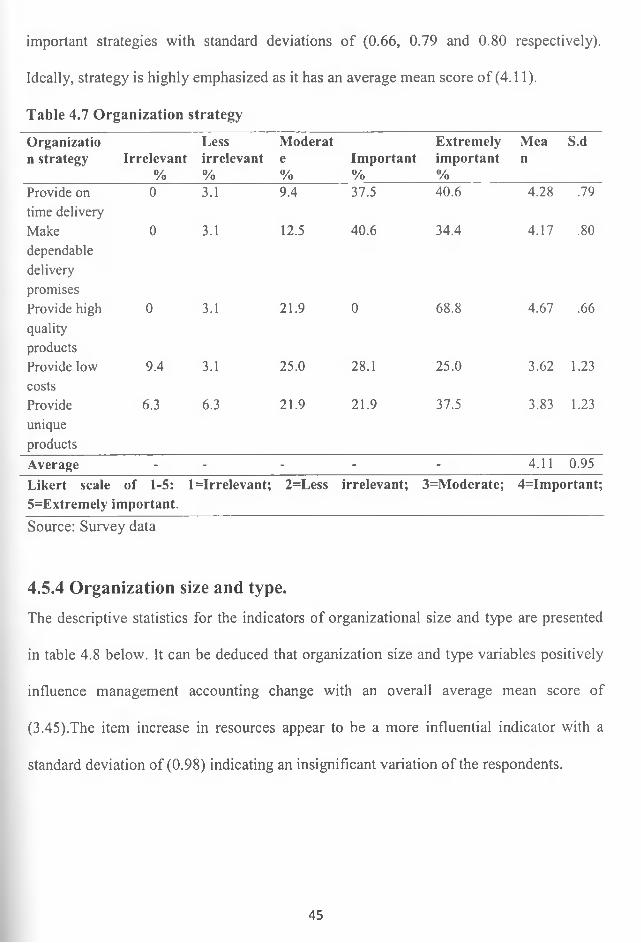
important strategies with standard deviations of (0.66, 0.79 and 0.80 respectively).
Ideally, strategy is highly emphasized as it has an average mean score of (4.11).
Table 4.7 Organization strategy
Organizatio n strategy Irrelevant
%
Lessirrelevant%
Moderate%
Important%
Extremelyimportant%
Mean
S.d
Provide on time delivery
0 3.1 9.4 37.5 40.6 4.28 .79
Makedependabledeliverypromises
0 3.1 12.5 40.6 34.4 4.17 .80
Provide highqualityproducts
0 3.1 21.9 0 68.8 4.67 .66
Provide low costs
9.4 3.1 25.0 28.1 25.0 3.62 1.23
Provideuniqueproducts
6.3 6.3 21.9 21.9 37.5 3.83 1.23
Average - - - - - 4.11 0.95Likert scale of 1-5: 1 5=Extremely important.
irrelevant; 2=Less irrelevant; 3=Moderate; 4=Important;
Source: Survey data
4.5.4 Organization size and type.The descriptive statistics for the indicators of organizational size and type are presented
in table 4.8 below. It can be deduced that organization size and type variables positively
influence management accounting change with an overall average mean score of
(3.45).The item increase in resources appear to be a more influential indicator with a
standard deviation of (0.98) indicating an insignificant variation of the respondents.
45

Table 4.8 Organization size and type
Organization size and type
Irrelevant%
Lessirrelevant%
Moderate%
Important%
Extremelyimportant%
Mean S.d
Increase in 18.8 12.5 31.3 18.8 12.5 2.93 1.31acc. staffExpansion 6.3 6.3 25.0 34.4 25.0 3.67 1.14Increase in 3.1 6.3 18.8 43.8 18.8 3.75 .98resourcesAverage. - - - - - 3.45 1.14
Likert scale of 1-5: 1=irrelevant; 2=Less irrelevant; 3=Moderate; 4=Important;5=Extremely important.
Source: Survey data
4.5.5 Organization structure.Table 4.9 provides details of the descriptive statistics for items in organization structure.
Improved communication was emphasized by the majority of responding organizations in
which (40.6%) of the respondents rated it as extremely important with a standard
deviation of (1.11). However, an interesting result is indicated by the respondents in the
decentralization item where, (25.0%) rated it as an irrelevant variable in influencing
management accounting change .while another (25.0%) rated the variable as extremely
important and (15.6%) rating it as moderate. This clearly indicates that some Kenyan
large manufacturing companies have tall structures and some have horizontal structures.
46

Table 4.9 Structural changes.
Structuralchanges Irrelevant
%
LessIrr.
%
Moderate
%
Import
%
Extremelyimportant
%
Mean S.d
Decentralization 25.0 9.4 15.6 21.9 25.0 3.13 1.56
Improved 6.3 0 12.5 31.3 40.6 4.10 1.11
communication
Average - - - - 3.62 1.33
Likert scale of 1-5: l=Irrelevant; 2=Less irrelevant; 3=Moderate; 4=Important;5=Extremely important.
Source: Survey data
4.5.6 Overall rating of the contextual factors facilitating management
accounting change.Table 4.10 presents the descriptive statistics of the overall rating of the factors facilitating
management accounting change. The average mean score of (3.80) shows that these
factors positively influence management accounting change. The results presented in
table 4.10 show competition and organization strategy as the most influential factors
relative to the others with a standard deviation of(0.78 and 0.80 respectively),indicating
an insignificant variation among the respondents. This is consistent with Waweru et el
(2004) who found competition as one of the important factors influencing management
accounting change. This is also consistent with Langfield-Smith (1997), who found that
strategy influences MAS and Kober et al (2007) argued that management control systems
both shape and are shaped by strategy. Robbins (1990) emphasized on structure.
47

Table 4.10 Overall rating of contextual variables.
Contextualvariables
LessIrrelevant irrelevant
% %
Moderate
%
Import
%
Extremelyimportant
%
Mean S.d
Competition 0 3.1 18.8 46.9 25.0 4.00 .78Manufacturin g technology
3.1 9.4 15.6 21.9 40.6 3.96 1.18
Organizationstrategy
0 0 28.1 34.4 28.1 4.00 .80
Organization size and type
3.1 12.5 28.1 25.0 21.9 3.55 1.12
Organizationstructure
9.4 9.4 25.0 18.8 28.1 3.52 1.32
Average - - - - - 3.81 1.04Likert scale of 1 to 5; extremely important
l=irrelevant; 2= ]less irrelevant; 3= moderate; 4 important; 5=
Source: Survey data
The descriptive statistics in table 4.10 is supplemented by a summary of the regression
analysis in table 4.11. To test the contingent fit of the contextual variables (independent
variables) and the management accounting change index (dependent variable) shown in
appendix 2. The results show that competition and structure have got a positive
relationship with management accounting change having coefficients’ of (4.262 and
2.864 respectively) explaining 15.3% of the change in management accounting systems.
48

Table 4.11: Factors facilitating management accounting change regression analysis
Coefficients (a)
Model UnstandardizedCoefficients
StandardizedCoefficients
95%Confidence
interval for BB Std.Error Beta T Sig. Lower
boundUpperbound
(Constant) 20.932 7.845 2.668 .014 4.704 37.160Competition 4.262 1.722 .498 2.475 .021 .700 7.824Manufacturingtechnology
-.024 1.240 -.004 -.019 .985 -2.588 2.541
Organizationstrategy
-1.814 2.261 -.219 -.802 .431 -6.492 2.864
Organization size and type
-1.740 2.100 -.293 -.828 .416 -6.085 2.605
Organizationstructure
2.864 1.676 .571 1.709 .101 -.602 6.330
Source: Survey cata
4.6 Hindrances to management accounting change.
Table 4.11 provides details of the descriptive statistics for variables that act as hindrances
to management accounting change. All the variables positively hinder management
accounting change. Of the variables lack of top management support and lack of adequate
computing resources were emphasized by the respondents rating them as extremely
important variables with (37.5% and 31.3% respectively). This results support the
findings of Al-Omiri and Drury (2007) that high quality information systems are useful in
providing detailed data needed for more sophisticated costing systems. The lack of
adequate computing resources limits management accounting change adoption.
49

Table 4.12 Factors hindering management accounting change.
Hindrances to MAS change
Irrelevant
%
Lessirr.
%
Moderate
%
Import.
%
Extremelyimportant
%
Mean
S.d
Lack of adequatecomputingresources
21.9 6.315.6
15.6 31.3 3.31 1.61
Lack of topmanagementsupport
21.9 6.30
25.0 37.5 3.55 1.66
Lack of autonomy
37.5 15.63.1
18.8 12.5 2.46 1.57
Fear attitude 31.3 9.412.5
25.0 9.4 2.68 1.49
Others 3.1 03.1
6.3 3.1 3.40 1.52
Average - - - - - 3.08 1.57Likert scale of 1 to extremely important
5; l=irrelevant; 2= less irrelevant; 3= moderate; 4 important; 5=
Source: Survey data.
4.7 Group parent company pressures influence on management
accounting change.From the institutional theory perspective it is argued that various actors operating in and
around the organizations can create the institutional pressures that lead individual
organizations to adopt specific structures and procedures. From this study it was evident
that such pressures exist .In this survey respondents of organizations that are subsidiaries
reported that they adopted certain practices as a requirement from the head office or
parent company. Subsidiaries were expected to present their management accounts in the
formats dictated by the parent company and also implement their management
information systems in a way consistent with the parent company. Despite this there were
no significant differences in the majority of the variables tested.
50

4.8 Summary and interpretation of findings.The findings from this study confirm that there has been a change in the business
environment in which manufacturing companies operate in Kenya over the past two
decades. Out of the various industries engaged in this study 62.5% are foreign companies
operating in Kenya while 34.4% are local companies. Majority of the responding
companies had a business life of over 20 years (93.8%) and an annual turnover of over
Shs 500 million.
On the aspect of the management accounting systems that are used by the surveyed
organizations the findings from this study indicated that of the 23 management
accounting systems adopted from Libby and Waterhouse (1996) at least 19 of the systems
are used by the responding organizations. Regarding whether the systems have been
changed in the last 10 years the findings show that there has been some change in some
of the systems, however, the percentage reported on change is smaller than that reported
on the usage of these systems.
It has also been found that both traditional and advanced management accounting
techniques appeared to be almost equally important. These findings show that
manufacturing companies in Kenya rely on both techniques in order to cope with
significant changes in their internal as well as external environmental factors.
Incremental budgeting for planning, absorption and marginal costing for costing, sales,
return on investment (ROI) and residual income for performance measurement were
found to be the most commonly applied traditional management accounting techniques.
Besides the kind of practices that are adopted by the surveyed organizations, this study
also analyzed the dimensions of change in management accounting practices. The results
51

show that most of the responding companies have not changed in the way in which they
apply management accounting techniques. 31.23 % of the respondents indicated no
change has occurred in their management accounting practices. The majority of the
respondents, who reported changes chose to replace their existing techniques (23.31%),
modify the information output(14.81%) or introduce new techniques(14.52%); the least
changes were reported in regard to modification of technical operations of the
management accounting system (13.93%) and removal without replacement
(abandonment) (2.2%) of the adopted techniques. These results support the findings of
Sulaiman and Mitchell (2005) who found that replacements of existing techniques and
information output modification had a relatively high frequency in their study on
manufacturing companies.
From the contingency theory perspective there are no universally best management
accounting practices that are applied by all organizations, but organizations adopt
different management accounting techniques depending on the contextual variables
surrounding their business environment in which they operate. In this study five
contextual variables were identified as facilitating the reported change in the surveyed
organizations. The findings from this study confirm that there has been a significant
increase in the competitive environment faced by Kenyan manufacturing companies over
the past two decades. The use of advanced manufacturing technology has also increased
significantly. Results also show an increased emphasis on strategy, organization size and
structure. In competition the indicators of competitor’s action and marketing channels
were reported as most important with standard deviations of (0.99 and 1.19 respectively).
52

From the findings flexible manufacturing technology and computer aided manufacturing
were emphasized by the respondents as the important indicators of manufacturing
technology. As regards strategy, the findings indicate that most of responding
organizations identified strategies that relate to customer focus as greatly emphasized,
such as, provide high quality products, provide on time delivery and make dependable
delivery promises.
On organizational size and type, the item increase in resources was rated as extremely
important in facilitating change. While in organization structure more emphasis was
given to improved communication in relation to decentralization. The findings show in
overall rating of the contextual variables, competition and organization strategy as the
most critical factors that facilitate management accounting change in the participating
organizations. Group pressures influence on management accounting practices was
reported by respondents whose companies were subsidiaries of parent companies located
outside Kenya. In particular subsidiaries were expected to present their management
accounts in the formats dictated by the parent company and also implement their
management information systems in a way consistent with the parent company.
Although management accounting systems has been found to be important to
organizations capacity to cope with the ever changing business environment it is not
without some hindrances. The factors that limit management accounting change were
also examined. From the findings lack of top management support (37.5%) and lack of
adequate computing resources (31.3%) were noted to be the most critical factors limiting
management accounting change.
53

CHAPTER FIVE
5.0 SUMMARY, CONCLUSIONS AND RECOMMENDATIONS.
5.1 Summary.This study is about management accounting change: an exploratory study of large
manufacturing companies in Kenya. The three objectives of this study were; to explore
management accounting change; to establish the management accounting systems
adopted by Kenyan large manufacturing companies and to identify the factors that
facilitate/hinder management accounting systems change in large manufacturing
companies in Kenya. The study is grounded on two theories namely; the contingency
theory and the institutional theory of management accounting that try to explain why
organizations tend to change their management accounting practices.
The paper utilized a descriptive survey research design. The study setting was on large
manufacturing companies’ located in Nairobi. A disproportionate stratified random
sampling was used to select a sample of 50 companies for the survey. However, the
response rate was 32 (64%) of the sampled companies participated in the survey, while 8
(16%) of the sampled companies returned blank questionnaires citing confidentiality of
the information requested and lack of time to fill the questionnaire as the main reasons.
While, 10 (20%) of the sampled companies declined to take part in the survey.
The paper used primary data that was collected using a semi-structured questionnaire and
interviews. The data obtained from the responding companies was analyzed using content
analysis, and descriptive statistics. A multiple regression path analysis was used to
analyze the extent to which management accounting systems change is influenced by the
Jdentified contextual variables.
54

5.2 Conclusions.For an organization to survive with competition in the ever changing world, it must
change and put in place sound management accounting practices. This is what the study
sought to find out in the Kenyan manufacturing companies. The findings provide insights
into the objectives the study aimed to achieve. In regard to management accounting
change aspect, the findings indicate that there has been some change in the way in which
MAPs are applied. Most of the respondents indicated change taking the dimension of
introduction of new techniques as replacements for existing parts of the management
accounting system (23.31%), modification of the information or output of the MAS
(14.81%), introduction of new techniques where no management accounting technique
previously existed (14.52%), modification of the technical operation of the management
accounting techniques (13.92%) and abandonment (2.2%). The change has been
experienced in both the local and foreign companies having branches in Kenya. The
study provides evidence to reject the general view that management accounting has not
changed or is resistant to change.
As regards the kind of management accounting systems adopted by Kenyan large
manufacturing companies, the research findings on this objective indicate that most of the
systems listed are used by the surveyed organizations. Also from the findings it became
evident that both traditional and advanced management accounting techniques are
adopted. As new /advanced management accounting techniques are adopted traditional
techniques are being maintained. This was evident from the aspect of management
accounting change relating to abandonment recording the lowest score of (2.2%).
55

The third objective was to identify the factors facilitating /hindering management
accounting change adoption. The findings from this study support the view that internal
and external environments surrounding an organization have an impact on its
management accounting systems. The findings illustrated MASs as important and have to
be changed in order to cope with the change in the operating business environment.
Further the findings provided more evidence to prior research relating to contingent
factors forcing organizations to change their management accounting practices (Hoque
and Hopper, 2004; Shields, 1997). The increase in global competition, structure and
organization strategy were the main contextual factors facilitating management
accounting change in the surveyed organizations.
Further, it was also suggested from the research findings that, lack of top management
support, lack of adequate computing resources and lack of autonomy from parent
company were highlighted as the most critical factors acting as hindrances to
management accounting change. Also, group pressures may dictate the kind of practices
adopted. This was evident from the study findings that any changes that were adopted by
companies which are subsidiaries had to conform to those of the parent company. Some
respondents indicated that whatever management accounting techniques that are in place
in their organizations have been approved by the parent company.
5.3 Policy recommendations.In enhancing the management accounting systems change adoption, the study suggests
that the relevant professional accounting bodies, especially the Institute of Certified
Public Accountants of Kenya (ICPAK), to establish a unit that implements and promotes
56

the practice of advanced management accounting techniques in Kenya. There is need for
the professional association to maintain their leadership role in identifying, supporting
and educating on the positive changes that is taking place in the management accounting
profession. This unit will specifically need to encourage and support the interaction
between accounting educators and practitioners in the country.
ICPAK accordingly is required to do proper planning and promotions needed to ensure
that seminars on management accounting can be promoted to all industries including the
government agencies and also to the public at large. The seminars must be held regularly
to ensure members and other participants are updated with various MATs especially the
advanced management accounting techniques. This unit of professional bodies must also
be responsible in creating the awareness on management accounting applications to other
accounting bodies. This is important in order to educate the others about the benefits, the
effectiveness and the importance of management accounting change applications.
The management accounting applications can also be promoted to all industries and the
public by encouraging research and writing on the advanced management accounting
topics. Besides, detail explanations are needed to inform the management of
manufacturing entities and the public about the difference between the management
accounting field and the financial accounting area. More articles and publications on
management accounting topics should be printed in journals, magazines and other media.
The effectiveness of success of management accounting change applications should be
wntten and printed to public media using a range of organizational role models to
57

convince business organizations and public of the fact that the new management
accounting practices would be relevant to their own types o f firms.
Further, the unit established should actively provide consultancy, technical supports and
enhance trainings to update management level of knowledge. At this workshops and
professional events specific organizations and companies especially manufacturing
concerns should be targeted to improve the rate adoption of advanced management
accounting techniques. Finally, it should be made mandatory for companies to
incorporate management accounts reported as disclosure items in the financial
statements.
5.4 Limitations of the study.There are a number of limitations to this research findings; first ,due to the relatively
small sample size any generalizations of the study results to non-manufacturing
organizations or beyond cannot be made without caution.
Second, the relatively low response rate is a major limitation in this research. For
example, the decline of quite a number of sampled companies to take part in the survey,
some returning blank questionnaires and response bias due to unwillingness of other
respondents to share the accurate information.
Third, most of the findings in the study are from quantitative data and do not capture an
m-depth understanding of the subject phenomena. Thus, a different approach such a
qualitative case study research may shed light on this issue.
58

5.5 Suggestions for further research.The same research be duplicated and focus on service organizations in Kenyan context to
gain more understanding on this sector as these entities have become increasingly
important within most economies.
As the sample used was small the same research adopting a larger sample size using case
study approach in developing countries may provide more information on the research
issues explored in this study.
A study to be conducted on the influence of contextual variables on management
accounting systems change and its impact on organizational performance in a developing
country context.
59

References
Ansari, S.L., Bell, J.F., Okano, H. (2007), "A review of literature of target costing and cost management", in Chapman, C.S., Hopwood, A.G., Shields, M.D. (Eds),Handbook o f Management Accounting Research, Elsevier, Oxford, Vol. Vol. 2 pp.507-30.
Al-Omiri M, Drury C. (2007), "A survey of factors influencing the choice of product costing systems in UK organizations", Management Accounting Research, Vol. 18 pp.399 - 424.
Abemethy, M.A., Bouwens, J. (2005), "Determinants of accounting innovation implementation", Abacus, Vol. 41 No.3, pp.217-40.
Anderson ,S.W., and Young,S.M(2001) Implementing Management Innovations. Kluwer Academic Publishers, Massachusetts.
Anthony, R.N., Govindarajan, V. (2007), Management Control Systems, McGraw-Hill, New York, NY,
Ashton, D., Hopper, T. and Scapens, R.W. (1991), Issues in Management Accounting, Prentice- Hall, Englewood Cliffs, NJ.Ayvaz, E., & Pehlivanli, D. (2011). The use of time driven activity based costing and analytic hierarchy process method in the balanced scorecard implementation. International Journal o f Business and Management, 6(3): 146-158.
Arithi (2001) Application of strategic management accounting by large large manufacturing companies in Nairobi. Unpublished MBA Project; University o f Nairobi.
Albright, T.L. and Roth, H.P. (1992), “The measurement of quality costs: analtemativeparadigm”, Accounting Horizons, Vol. 6, pp. 15-27.
Boer, G.B., Ettlie, J. (1999), "Target costing can boost your bottom line", Strategic Finance, Vol. 81 No.l, pp.49-53.
Boer, G. B. (2000). Management accounting education: Yesterday, today, and tomorrow. Issues in Accounting Education, 15 (2), 313-334.
Bromwich, M., & Bhimani, A. (1994).Management Accounting pathways to progress. London; CIMA
Bromwich, M., & Bhimani, A. (1989), Management Accounting: Evolution not Revolution, CIMA London.
Bromwich, M. (1990), “The case for strategic management accounting: the role of accounting information for strategy in competitive markets”, Accounting, Organizations and Society,Vol. 15, pp. 27-46.
60
Blocher, E.J., Chen, K.H. and Lin, T.W.( 2002) Cost Management: A Strategic Emphasis, 2nd edition Boston, Mass: McGraw-Hill Irwin.
Bums, J., Ezzamel, M., Scapens, R.S. (1999), "Management accounting change in the UK", Management Accounting, Vol. 77 No.3, pp.28-30.
Bogsnes B. (2009), "Implementing beyond budgeting - unlocking the performance potential", Wiley, New Jersey,.
Bums, T., Stalker, G.M. (1961), The Management o f Innovation, Tavistock, London,
Belohlav, J.A. (1993), “Quality, strategy and competitiveness”, Califonia Management Review,Vol. 35, pp. 55-67.
Cooper, R., Kaplan, R. (1992), "Activity-based systems: measuring the costs of resource usage", Accounting Horizon, Vol. September pp. 1-11.
Cooper, R. and Kaplan, R.S. (1988), “Measure costs right: make the right decisions”, HarvardBusiness Review, Vol. 66, pp. 96-103.
Cavalluzzo, K.S., Ittner, C.D. (2004), "Implementing performance measurement innovations: evidence from government", Accounting, Organizations and Society, Vol. 29 pp.243-67.
Chenhall, R., & Langfield-Smith, K. (1998). Adoption and benefits of management accounting practices: an Australian study. Management Accounting Research, 9, 1-19.
Chenhall, R.H. (2005), “Integrative strategic performance measurement systems, strategic alignment of manufacturing, learning and strategic outcomes: an exploratory study”, Accounting, Organizations and Society, Vol. 30, pp. 395-422.
Clarke, P., Hill, N., Stevens, K. (1999), "Activity-based costing in Ireland: barriers to, and opportunities for change", Critical Perspectives on Accounting, Vol. 10 pp.443-68.
Choe, J.-M. (1996), "The relationships among performance of accounting information systems, influence factors, and evolution level of information systems", Journal of Management Information Systems, Vol. 12 No.4, pp.215-39.
Cadez S., Guilding C.(2007)Benchmarking the Incidence of Management Accounting in Slovenia Journal of Accounting and Organisational change.V ol.3 No.2 pp. 126-146.
Drury, C. (2008), Management and Cost Accounting, 7th ed., Chapman & Hall, London
DiMaggio, P.J., Powell, W.W. (1983), "The iron cage revisited: institutional lsomorphism and collective rationality in organizational fields", American Sociological Review, Vol. 48 No.2, pp. 147-60.
61

Dess, G.G., Davis, P.S. (1984),"Porter's generic strategies as determinants of strategic group membership and performance", Academy o f Management Journal, Vol.26 pp.467- 88.Emsley, D., Nevicky, B., Harrison, G. (2006), "Effect of cognitive style and professional development on the initiation of radical and non-radical management accounting innovations", Accounting and Finance, Vol. 46 pp.243-64.
Fisher, J. (1995), "Contingency based research on management accounting control systems: categorisation by level of complexity", Journal o f Accounting Literature, Vol. 14 pp.24-53.
Foster, G., Gupta, M. and Sjoblom, L. (1996), “Customer profitability analysis: challenges and new directions”, Journal of Cost Management, Vol. 10, pp. 5-17.
Foster, G. and Gupta, M. (1994), “Marketing, cost management and management accounting”, Journal of Management Accounting Research, Vol. 6, pp. 43-77.
Gathumbi S.N (1997). Application of Inventory Models in Drug Inventory Management. The Case of the Nairobi City Council Health Services. Unpublished MBA Project; University o f NairobiGarg, A., Ghosh, D., Hudick, J., & Nowacki, C. (2003). Roles and practices in management accounting today. Strategic Finance, 85 (1), 30-65.
Government of Kenya (2006). Registered industries in Kenya, Nairobi, Ministry of Trade and Industry.
Glanuland M. (2001), “Towards Explaining Stability In and Around Management Accounting Systems”, Management Accounting Research, Vol. 12.pp. 141-166
Garrison, R., Noreen, E. (1997), Managerial Accounting, 8th ed., Irwin McGraw-Hill, New York, NY ,.
Gray, S.J., Salter, S.B., Radebaugh, L.H. (2001), Global Accounting and Control: A Managerial Emphasis, John Wiley & Sons, New York, N Y ,.
Guilding, C. (1999), "Competitor-focused accounting: an exploratory note", Accounting, Organizations and Society, Vol. 24 No.7, pp.583-95.
Guilding, C. and McManus, L. (2002), “The incidence, perceived merit and antecedents of customer accounting: an exploratory note”, Accounting, Organizations and Society, Vol. 27,pp. 45-59.
Guilding, C., Cravens, K.S. and Tayles, M. (2000), “An international comparison of strategic management accounting practices”, Management Accounting Research, Vol. 11, pp. 113-35.
62

Haldma, T., Laats, K. (2002), "Contingencies influencing the management accounting practices of Estonian manufacturing companies", Management Accounting Research, Vol. 13 pp.379-400.
Hopwood, A.G. (1990), "Accounting and organizations change", Accounting, Auditing & Accountability Journal, Vol. 3 No.l, pp.7-17.
Harrisson, G., McKinnon, J. (2007), "National culture and management control", in Hopper, T., Northcott, D., Scapens, R. (Eds)Jssuses in Management Accounting, Prentice-Hall, Upper Saddle River, NJ, pp.93-116.
Hyvonen, J. (2005). Adoption and benefits of management accounting systems: evidence from Finland and Australia. Advances in International Accounting, 18, 97-120.
Hawes, J.M., Crittendon, W.F. (1984), "A taxonomy of competitive retailing strategies", Strategic Management Journal, Vol. 5 No.2, pp.275-87.
Hope J., Fraser R. (2003), "Beyond budgeting - how managers can break free from the Annual Performance Trap", Havard Business School Press, Boston, M A,.
Hansen S.C, Otley D., Van der Stede W.A (2003), "Practice developments in budgeting: An overview and research perspective", Journal o f Management Accounting Research, Vol. 15 pp.95- 116.
Hoque, Z., James, W. (2000), "Linking size and market factors to balanced scorecards: impact on organisational performance", Journal o f Management Accounting Research, Vol. 12 pp. 1-17.
Hoque, Z. (2001), Strategic Management Accounting, Chandos Publishing, Oxford.
Hoque, Z. (2003), Strategic Management Accounting: Concepts, Processes and Issues, 2nd ed., Spiro Press, London,.
Ittner, C., Larcker, D. (1998), "Innovations in performance measurement: trends and research implications", Journal o f Management Accounting Research, Vol. 10 pp.205-38.
Ittner, C., Larcker, D., Rajan, M. (1997), "The choice of performance measures in annual bonus contracts", The Accounting Review, Vol. 72 No.2, pp.231-55.
IMF (1999), Code o f Practices on Fiscal Transparency: Declaration on Principles, International Monetary Fund, Washington, DC.
tones, J., Mitchell, F. (1990), "The process of change in management accounting: some field study evidence", Management Accounting Research, Vol. 1 No.l, pp.3-19.
63

Innes, J., Mitchell, F. (1995), "A survey of activity based costing in the UK's large companies", Management Accounting Research, Vol. 6 No.2, pp.137-53.
International Finance Corporation (2002), Institutional lending “A working paper"
Joshi, P L (2001). “The International Diffusion of New Management Accounting Practices: The Case of India,” Journal o f International Accounting, Auditing, and Taxation, 10(1), 85-109.
Johnson,H.T,Kaplan,R.S.(1987) Relevance lost: the rise and fall o f management accounting,harvard business school press.
Jones, L. (1988), “Competitor cost analysis at Caterpillar”, Strategic Finance,Vol.77 pp. 32-8.
Jacob, R. (1994), “Why some customers are more equal than others”, Fortune, Vol. 130, pp. 215-20.
Kaplan, R., Atkinson, A. (2007), Advanced Management Accounting, 3rd ed., Pearson Education, Harlow,.
Kaplan, R., Norton, D. (1996), The Balanced Scorecard: Translating Strategy into Action, Harvard Business School Press, Boston, M A,.
Koga, K. (1999), Determinants o f Effective Product Cost Management during Product Development: Opening the Black Box o f Target Costing, Harvard University, Cambridge, MA,.
Kober, R., Ng, J., Paul, B.J. (2007), "The interrelationship between management control mechanisms and strategy", Management Accounting Research, Vol. 18 No.4, pp.425-52.
Koga, K., Monden, Y. (2000), "Analysis of variation of target costing practices in the camera industry", in Monden, Y. (Eds)Japanese Cost Management, Imperial College Press, London, pp. 123-60.
Kaplan, R., Cooper, R. (1988), "Measure costs right: no longer", Journal o f Management Accounting Research, Vol. Fall pp.2-15.
Lee, J. (1987), Managerial Accounting Changes for the 1990s, Addison-Wesley, Los ^geles, CA,.
Libby, T., Waterhouse, J. (1996), "Predicting change in management accounting systems", Journal o f Management Accounting Research, Vol. 8 pp. 137-50.
Lapsley, I., Wright, E. (2004), "The diffusion of management accounting innovations inthe public sector: a research agenda", Management Accounting Research, Vol. 15 pp.355- 74
64

Lin, Z.J., Yu, Z. (2002), "Responsibility cost control system in China: a case of management accounting application", Management Accounting Research, Vol. 13 No.4, pp.447-67.
Langfield-Smith K.(1997), "Management control systems and strategy: A critical review", Accounting, Organizations and Society, pp.207 - 232.
Lee, J.Y. (2002), "An examination of international differences in adoption and theory development of activity-based costing", Advances in International Accounting, Vol. 15 pp.65-77.
Lawrence, P.R., Lorsch, J. (1967), Organisation and Environment, Harvard Business School, Division of Research, Boston, MA,.
Minja E. (1995); The survey of performance measurement in divisionalised companies in Kenya: Unpublished MBA Project; University o f Nairobi.
Mugenda O, Mugenda G (2003). Research Methods. Nairobi Press
Monden Y., Hamada K.,( 1991), Target Costing and Kaizen Costing in Japanese Automobile Companies, Journal o f Management Accounting Research, Fall, pp. 16-34.
Morgan M.J., 1993, Accounting for strategy, Management Accounting, May, pp.20-24.
Moon, P. and Bates, K. (1993), “Core analysis in strategic performance appraisal”, ManagementAccounting Research, Vol. 4, pp. 139-52.Moores, K. and Mula, J. (1993). Contextual and Strategic Impacts on the form of Management Accounting Systems': Discussion Papers, Australia: Bond University School of Business.
Mat T.Z.T.,Smith M. Djajadikerta H.(2010) Management Accounting and Organizational Change: An Exploratory Study in Malaysian Manufacturing Firms .Journal o f Advanced Management Accounting Research.No\.8.No 2.2010.
Nzule M.M.(1999), A Survey of the Adoption of Activity Based Costing in Kenya. Unpublished MBA Project; University o f Nairobi.
Narayan, F.B., Godden, T., Reid, B., Ortega, M.R.P. (2000), "Financial management and governance issues in selected development member countries: a study of Cambodia, China (People's Republic of), Mongolia, Pakistan, Papua New Guinea, Uzbekistan, and Vietnam", available at:www.adb.org/Documents/Books/Financial_Mgt/Selected_DMCs/prelims.pdf,.
Odongo H.N (2008) Employees attitude towards budgeting process among large manufacturing firms in Nairobi. . Unpublished MBA Project; University o f Nairobi

Otley, D. (1980), "The contingency theory of management accounting research: achievement and prognosis", Accounting, Organizations and Society, Vol. 5 No.4, pp.413-28.
Osewe E.O (1998), The Choice of Performance measures in Divisionalised companies in Kenya. A Survey study among listed companies. Unpublished MBA Project; University of Nairobi.
Oliver, C. (1997), "Sustainable competitive advantage: combining institutional and resource-based views", Strategic Management Journal., Vol. 18 No.9, pp.697-713.
Porter, M.E. (1985), Competitive Advantage, The Free Press, New York, NY.
Robbins, P. Stephen 1990. Organisational Theory: Structure Design. And Applications, N.J: P/Hall
Rangone, A. (1997), “Linking organizational effectiveness, key success factors and performance measures: an analytical framework”, Management Accounting Research, Vol. 8, pp.207-19.
Roslender, R. and Hart, S. (2003), “In search of strategic management accounting: theoretical and field study perspectives”, Management Accounting Research, Vol. 14, pp. 255-79.
Rickwood, C.P., Coates, J.B. and Stacey, R.J. (1990), “Stapylton: strategic management accounting to gain competitive advantage”, Management Accounting Research, Vol. 1, pp. 37-49.Shields M. D., Young S. N.,( 1991), Managing product life cycle costs: an organizational model, Journal o f Cost Management, 5 (3), pp.39-52.
Shapiro, B.P., Rangan, K.V., Moriarty, R.T. and Ross, E.B. (1987), “Manage customers for profits(not just sales)”, Harvard Business Review, Vol. 65, pp. 101-8.
Shank, J.K. and Govindarajan, V. (1992), “Strategic cost analysis of technological investments”, Sloan Management Review, Vol. 34, pp. 39-51
Shields, M.D. (1997), "Research in management accounting by North Americans in the
1990s", Journal o f Management Accounting Research, Vol. 9 pp.3-61.
Selto, F.H., Widener, S.K. (2004), "New directions in management accounting research:
•nsights from practice", Advances in Management Accounting, Vol. 12 pp. 1-35.
66

Saunders ,M., Lewis, P., and Thombill,A(2000)Research methods for Business students. FT
Parentice Hall.
Silk,S (1998) Automating the balanced scorecard,Management Accounting,May,38-44
Sulaiman,S.,and Mitchell, F.(2005) “Utilizing a Typology of Management Accounting
Change”,/! Management Accounting Researchy o\. 10,pp.409-437.
Simmonds,K(1986) The accounting assessment of competitive position,European journal
of marketing,organizations and society, 12(4) 357-74
Simmonds, K. (1981), “Strategic management accounting”, Management Accounting, Vol.
59, pp. 26-9.
Scapens, R.W. (1994), "Never mind the gap: towards an institutional perspective on
management accounting practice", Management Accounting Research, Vol. 5 pp.301-21.
Szendi, J.Z., Elmore, R.C. (1993), "Management accounting: are new techniques making
in-roads with practitioners?", Journal o f Accounting Education, Vol. 11 pp.61-76.
Sekaran, U. (2007) Research methods for business;A skill building approach,4th ed.New
Delhi
Tani,T.,Okano,H.,Shimizu,N.,Iwabuchi,Y,Fukuda,J.and Cooray,S.(1994) Target cost
management in Japanese compniesxurrent state of the art,Mnagement accounting
research, Vol.5 No. 1pp.67-82
Vaivio, J. (1999), "Exploring a ‘non-financial” management accounting change",
Management Accounting Research, Vol. 10 pp.409-37.
Van Triest, S., Elshahat, M.F. (2007), "The use of costing information in Egypt: a
research note", Journal o f Accounting & Organizational Change, Vol. 3 No.3, pp.329-43.
Wallace, R.S.O. (1990), "Accounting in developing countries", Research in Third World
Accounting, Vol. 1 pp.3-54.
67

Ward,K (1992) Accounting for marketing strategies,in Management Accounting
Handbook (ed.C.Drury),Butterworth-heinemann,Ch.7.
Waweru, N.M (1999). A Survey of the Application of Management Accounting Practices
by Publicly Quoted Companies in Kenya. Unpublished MBA Project .University o f
Nairobi.
Whitley, R. (1999), "Firms, institutions and management control: the comparative
analysis of coordination and control systems", Accounting, Organizations and Society,
Vol. 24 No.5/6, pp.507-24.
Wangari, M.J (2008), Budgeting Practices in Manufacturing Firms in Kenya. Unpublished MBA Project; University o f Nairobi.
Waweru, N.M., Hoque, Z., Uliana, E. (2004), "Management accounting change in South
Africa: case studies from retail services", Accounting, Auditing & Accountability Journal,
Vol. 17 No.5, pp.675-704.
Wilson R.M.S., 1991, Strategic management accounting, in Issues in Management
Accounting, D.J. Ashton, T.M. Hopper, and R.W. Scapens, editors. Prentice-
Hall,London.
Xiao, J., Chow, C.,Duh Rong-Raes,and Zhao,L.(2007) Management Accounting in
China. Financial Management. Dec.2006/Jan-2007:32-37.
68

Appendix I: Questionnaire on management accounting change:
Please answer the questions as requested .You are NOT required to provide your name. The information requested can be used in the study and NOT for any other use. Your responses shall be treated as confidential.SECTION A
This section seeks general information about your organization.
Please tick [ ] as appropriate regarding the requested information.
1. Business life in years
Over 20 years [ ] Less than 20 years [ ]
2. Business scope.
Local [ ] International [ ]
3. Type of product
Consumer [ ] Industrial product [ ]
Other please specify................................................
4. Turn over (shs millions)
Less than shs 500 million [ ] Over 500 million [ ]
5. Total number of employees.
100-199 [ ] 200-499 [ ]
Over 500 [ ]6. Industry category
Agro processing Wood and wood products [ ]
Capital goods and spare parts. [
Electrical and electronics
Pulp and paper [ ]Ceramics and glassmaking
Iron and still making.
Construction and equipment
Chemical processing
69
[ ]
[ ]
[ ]

SECTION B
7. Which of the following management accounting and control systems are in use in your organization? And have the systems been changed for last 10 years.
Management accounting systems
Being used Have changed
Planning systems1. Budgeting t ] t ]
2. Operation planning (production) t ] t ]3. Capital budgeting t i [ ]4. Strategic planning t ] [ ]5. Other planning systems [ ] t ]
Controlling systems6. Individual or team-based performance measurement t ] [ ]7. Organizational performance measurement t ] t ]8. Measurement of performance in terms of quality t ] [ ]9. Measurement of performance in terms of customer satisfaction [ ] [ ]10. Other performance measures t ] t ]
Costing Systems11. Direct allocation of manufacturing overhead [ ] t ]12. Direct allocation of marketing costs t ] [ ]13. Direct allocation of other overhead [ ] t ]14. Internal (department or divisional) product transfers [ ] t ]15. Other costing systems; [ ] t ]
Directing Systems16. Reward systems - bonuses t ] [ ]17. Reward systems - pay for performance plans t ] [ ]18. Other reward systems t ] t ]
Decision-making systems19. Information reported more frequently t ] [ ]20. Use of more non-fmancial measures t ] [ i21. Information reported more broadly [ ] t ]22. Other changes to reporting systems [ ] [ ]23. Other changes to systems that do not appear on this list t ] t ]
70

SECTION C
8. For each of the management accounting practices below indicate the technical level changes occurring in your company for the last 10 years in accordance to the given categories.
Change in management accounting systems.
Please choose the appropriate category as listed below.
0 No change1 Introduction of new techniques where no management accounting technique
previously existed .(e.g. the first time introduction of a management accounting technique)
2 Introduction of new techniques as replacements for existing parts of the management accounting system(e.g. the replacement of any traditional techniques with more advanced techniques or of a fixed budgeting system with flexible budgeting)
3 Modification of the information or output of the management accounting system(e.g. the preparation of monthly as opposed to yearly budget or the representation)
4 Modification of the technical operation of the management accounting system (e.g. the use of actual overhead rates other than predetermined rates in existing costing systems)
5 The removal of management accounting technique with no replacement(abandonment)
N/A Management accounting technique is not practiced in the organization.
Management accounting techniques please choose the type of change as
Specified in the above box by ticking
0 1 2 3 4 5 N/A
Planning and control systems
1. Incremental budgeting [ ] [ ] [ ] [ ] [ ] [ ] [ ]
2. Activity based budgeting [ ] [ ] [ ] [ ] [ ] [ ] [ ]
3. Zero based budgeting [ ] [ ] [ ] [ ] [ ] [ ] [ ]
4. Beyond budgeting [ ] [ ] [ ] [ ] [ ] [ ] [ ]
71

Costing systems
1. Full/ absorption t ] [ i [ ] t ] t i t ] t ]
2.Variable /marginal costing 11 t ] t i t ] [ ] t i t ]
3. Activity based costing t ] t ] t i t i t ] t ] t ]
Performance measurement systems
1. Residual income t ] 11 t ] [ ] t i t ] [ ]
2. Sales t ] 11 t ] t t ] t i t i
3. Return on investment 11 t ] t i t t ] t ] t ]
4. Economic value added t ] [ ] t ] t ] t ] t i t i
5. Balanced scorecard [ ] t ] t i t ] t ] t ] t ]
6. Standard costs and variance analysis[ ] [ ] t ] t ] [ t ] [ ]
7. Customer satisfaction t ] 11 t ] [ ] t ] t ] t ]
8. Labour efficiency t ] t ] [ i t i t ] t ] t ]
9. Quality and innovation t ] t ] [ ] t ] [ ] t t ]
10. On time delivery [ ] t ] t i [ i t i t ] t ]
Cost management& strategic management
Accounting systems.
1.Target costing 11 [ ] [ i t i t ] i ] [ ]
2. Lifecycle costing t ] t ] t ] t ] t ] t ] t ]
3. Benchmarking t ] t ] t i t ] t i [ ] t ]
4. Just-in-time t ] t ] t ] t ] t ] t ] [
5. Total quality management t ] t ] t ] [ ] [ ] t ] t ]
6. Attribute costing 11 t ] t i t ] t ] t i t ]
7. Competitive position monitoring [ ] [ ] t ] t ] t ] t ] t i
8. Competitor cost assessment t ] [ i t i [ ] [ ] t ] t
9. Competitor performance appraisal[ ] [ ] t ] t ] [ ] t ] [ i
72

10. Customer profitability 11 [ ] t ] t ] t ] t ] t ]
11. Balanced scorecard [ ] 11 [ ] t ] t ] [ ] t ]
12. Lifetime customer profitability analysis[ ] t ] t i [ ] t ] [ ] [ ]
13. Quality costing t ] t ] t ] t ] t i t ] t ]
14. Strategic pricing [ ] 11 t ] t ] t ] t ] t ]
15. Value chain costing. t ] t ] t ] [ ] t ] t ] [ ]
SECTION D
This section seeks information on factors facilitating management accounting change.
9. Please indicate the perceived intensity of competition faced by your organization in respect of the following variables.
Competition Negligible Extremely intense
i 2 3 4 5
Price competition t ] [ ] [ ] [ ] [ ]
New product development [ ] [ ] [ ] [ ] [ ]
Marketing/distribution channels [ ] [ ] [ ] [ ] [ ]
Competitor’s action t ] [ ] [ ] [ ] [ ]
Competitor’s markets/revenue share 11 [ ] [ ] [ ] [ ]
10. Rank in order of importance how the following advanced manufacturing technologies have affected management accounting change.
Manufacturing technology Irrelevant Extremely important
1 2 3 4 5
Flexible manufacturing systems [ ] t ] t ] [ ] t ]
Computer aided manufacturing [ ] t ] t ] t ] t ]
Just-in-time [ ] t ] t ] t ] t ]
Computer integrated manufacturing [ ] [ i t ] t ] t ]
Others (specify............ ) [ ] t ] [ i [ ] [ ]
73

11. Rank in order of importance how the following organization strategyvariables may have influenced management accounting change.
Organization strategy Irrelevant Extremely important
i 2 3 4 5
Provide on time delivery t ] [ ] [ ] [ ] [ ]
Make dependable delivery promises [ ] [ ] [ ] [ ] [ ]
Provide high quality products [ ] [ ] [ ] [ ] [ ]
Provide low costs t ] [ ] [ ] [ ] [ ]
Provide unique products. [ ] [ ] [ ] [ ] [ ]
12. Rank in order of importance how the following organization size and typevariables may have influenced management accounting change.
Irrelevant Extremely important
i 2 3 4 5
Increase in accounting staff t i [ ] [ ] [ ] [ ]
Expansion (e.g. new products) [ ] [ ] [ ] [ ] [ ]
Increase in resources t i [ ] [ ] [ ] [ ]
13. Rank in order of importance how the following structural changes may have influenced management accounting change.
Irrelevant Extremely important
i 2 3 4 5
Decentralization [ ] [ ] [ ] [ ] [ ]
Improved communication t ] [ ] [ ] [ ] [ ]
74

Irrelevant Extremely important
14. In overall rate the extent to which the following contextual variables haveinfluenced management accounting change.
i 2 3 4 5
Competition t ] [ ] [ ] [ ] [ ]
Manufacturing technology [ i [ ] [ ] [ ] [ ]
Organization strategy [ ] [ ] [ ] [ ] [ ]
Organization size and type [ ] [ ] [ ] [ ] [ ]
Organization structure [ ] [ ] [ ] [ ] [ ]
15. Rank in order of importance the influence of the following factors in relation to hindrance of management accounting change.
Irrelevant Extremely important
i 2 3 4 5
Lack of adequate computing resources t ] [ ] [ ] [ ] [ ]
Lack of top management support t ] [ ] [ ] [ ] [ ]
Lack of autonomy from parent company [ ] [ ] [ ] [ ] [ ]
Fear of change attitude t i t ] [ ] [ ] [ ]
Others t ] [ ] [ ] [ ] [ ]
16. Is your company a subsidiary of a parent company located outside Kenya? YES[ ] , NO [ ]
If YES explain briefly how the group parent company pressures influence management accounting systems change in your organization.
17. Please comment on any other information you consider relevant as regards management accounting change in your organization.
END.
75

Appendix II: Management accounting change frequenciesM
anag
emen
t ac
cou
nti
ng
tech
niq
ues
0 (N
o ch
ange
)
1 (I
ntr
odu
ctio
n
of
new
te
chn
iqu
e)
2(N
ewte
chn
iqu
es a
s re
pla
cem
ents
)
3(M
odif
icat
ion
of
outp
ut)
4(M
odif
icat
ion
of
oper
atio
ns)
5(A
ban
don
men
t)
Non
- re
spon
se
N/A
Cou
nt
£ Cou
nt
Cou
nt
Cou
nt
£ Cou
nt
£ Cou
nt
£ Cou
nt
£ Cou
nt
£
Increm enta 1 budgeting
6 18.8 3 9.4 6 18.8 8 25 2 6.3 4 12.5 0 0 3 9.4
A BB 0 0 3 9.4 7 21.9 2 6.3 4 12.5 1 3.1 1 3.1 14 43 .8ZBB 4 12.5 1 3.1 7 21.9 1 3.1 0 0 0 0 1 3.1 18 56.3
B eyondbudgeting
1 3.1 1 3.1 2 6.3 2 6.3 1 3.1 0 0 1 3.1 24 75 .0
F u ll/abso rption
8 25 .0 3 9.4 7 21.9 1 3.1 3 9.4 1 3.1 3 9.4 6 18.8
V ariab le/m arginalcosting
6 18.8 2 6.3 7 21.9 6 18.8 3 9.4 0 0 3 9.4 5 15.6
A B C 4 12.5 2 6.3 6 18.8 4 12.5 4 12.5 0 0 3 9.4 9 28.1R esidualincom e
12 37.5 4 12.5 5 15.6 3 9.4 2 6.3 0 0 4 12.5 2 6.3
Sales 14 43.8 3 9.4 5 15.6 5 15.6 3 9.4 1 3.1 1 3.1 0 0RO I 8 25 .0 4 12.5 5 15.6 4 12.5 3 9.4 0 0 3 9.4 5 15.6EV A 3 9.4 2 6.3 5 15.6 0 0 7 21.9 0 0 3 9.4 12 37.5BSC 4 12.5 3 9.4 4 12.5 2 6.3 4 12.5 1 3.1 4 12.5 10 31.3S tandard costs and variance analysis
11 34.4 2 6.3 4 12.5 3 9.4 5 15.6 2 6.3 4 12.5 1 3.1
C ustom ersa tisfac tion
12 37.5 1 3.1 5 15.6 1 3.1 5 15.6 0 0 4 12.5 4 12.5
L abourefficiency
10 31.3 3 9.4 5 15.6 4 12.5 3 9.4 1 3.1 3 9.4 3 9.4
Q uality and innovation
9 28.1 6 18.8 5 15.6 1 3.1 4 12.5 1 3.1 4 12.5 2 6.3
O n tim e
delivery
10 31.3 5 15.6 5 15.6 1 3.1 4 12.5 1 3.1 2 6.3 4 12.5
T argetcosting
4 12.5 6 18.8 8 25.0 1 3.1 1 3.1 0 0 2 6.3 10 31.3
L ifecyclecosting
6 18.8 3 9.4 4 12.5 3 9.4 2 6.3 0 0 4 12.5 lo 31.3
B enchm arking
9 28.1 3 9.4 3 9.4 5 15.6 5 15.6 0 0 2 6.3 5 15.6
76

Just-In tim e
5 15.6 4 12.5 4 12.5 6 18.8 0 0 0 0 4 12.5 9 28.1
T Q M 8 25.0 4 12.5 5 15.6 2 6.3 5 15.6 0 0 4 12.5 4 12.5A ttribu tecosting
7 21.9 2 6.3 2 6.3 4 12.5 2 6.3 0 0 4 12.5 11 34.4
C om petitiv e position m onito ring
8 25.0 3 9.4 5 15.6 3 9.4 5 15.6 1 3.1 1 3.1 6 18.8
C om petito rcostassessm ent
6 18.8 4 12.5 5 15.6 3 9.4 2 6.3 0 0 4 12.5 8 25 .0
C om petito r perform anc e appra isal
6 18.8 2 6.3 5 15.6 4 12.5 2 6.3 0 0 4 12.5 9 28.1
C ustom erpro fitab ilit
y
8 25 .0 3 9.4 6 18.8 3 9.4 2 6.3 0 0 3 9.4 7 21.9
B alancedscorecard
3 9.4 3 9.4 6 18.8 3 9.4 1 3.1 0 0 2 6.3 14 43.8
L ifetim e custom er pro fitab ilit y analysis
3 9.4 3 9.4 6 18.8 3 9.4 4 12.5 0 0 2 6.3 11 34.4
Q ualitycosting
4 12.5 6 18.8 2 6.3 4 12.5 4 12.5 0 0 3 9.4 9 28.1
Strategicpricing
6 18.8 2 6.3 4 12.5 5 15.6 2 6.3 0 0 3 9.4 10 31.3
V aluechaincosting
6 18.8 3 9.4 4 12.5 4 12.5 2 6.3 1 3.1 1 3.1 11 34.4
77
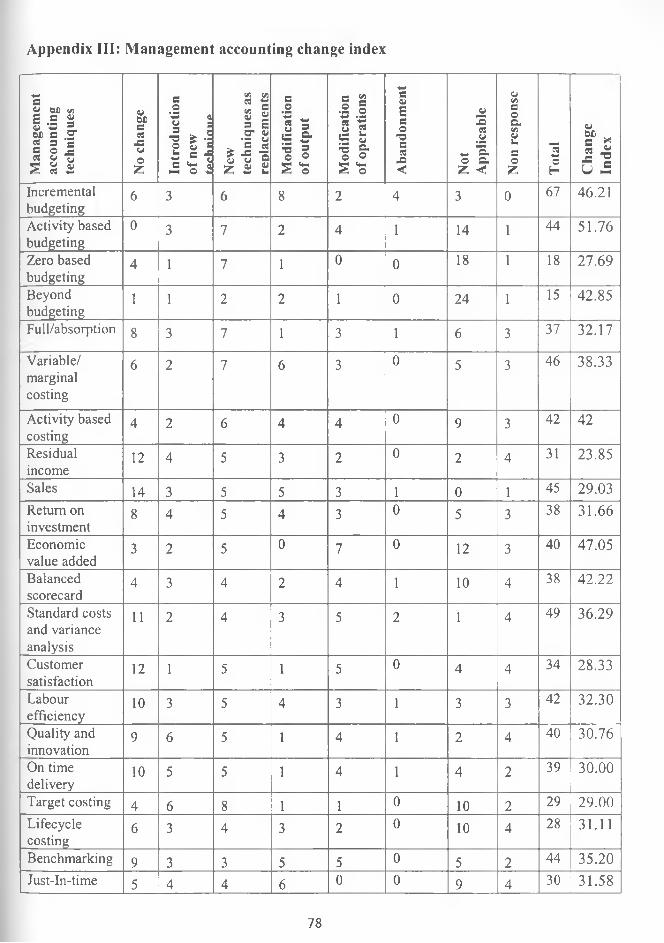
Appendix III: Management accounting change indexM
anag
emen
tac
coun
ting
tech
niqu
es
No c
hang
e
Intr
oduc
tion
of n
ewtp
phni
nnp_
___
New
tech
niqu
es a
s re
plac
emen
tsM
odifi
catio
n of
outp
ut
Mod
ifica
tion
of op
erat
ions
Aban
donm
ent
Not
Appl
icabl
e
Non
resp
onse
Tota
l
Cha
nge
Inde
x
Incrementalbudgeting
6 3 6 8 2 4 3 0 67 46.21
Activity based budgeting
0 3 7 2 4 1 14 1 44 51.76
Zero based budgeting
4 1 7 1 0 0 18 1 18 27.69
Beyondbudgeting
1 1 2 2 1 0 24 1 15 42.85
Full/absorption 8 3 7 1 3 1 6 3 37 32.17
Variable/marginalcosting
6 2 7 6 3 0 5 3 46 38.33
Activity based costing
4 2 6 4 4 0 9 3 42 42
Residualincome
12 4 5 3 2 0 2 4 31 23.85
Sales 14 3 5 5 3 1 0 1 45 29.03Return on investment
8 4 5 4 3 0 5 3 38 31.66
Economic value added
3 2 5 0 7 0 12 3 40 47.05
Balancedscorecard
4 3 4 2 4 1 10 4 38 42.22
Standard costs and variance analysis
11 2 4 3 5 2 1 4 49 36.29
Customersatisfaction
12 1 5 1 5 0 4 4 34 28.33
Labourefficiency
10 3 5 4 3 1 3 3 42 32.30
Quality and innovation
9 6 5 1 4 1 2 4 40 30.76
On time delivery
10 5 5 1 4 1 4 2 39 30.00
Target costing 4 6 8 1 1 0 10 2 29 29.00Lifecyclecosting
6 3 4 3 2 0 10 4 28 31.11
Benchmarking 9 3 3 5 5 0 5 2 44 35.20Just-in-time 5 4 4 6 0 0 9 4 30 31.58
78
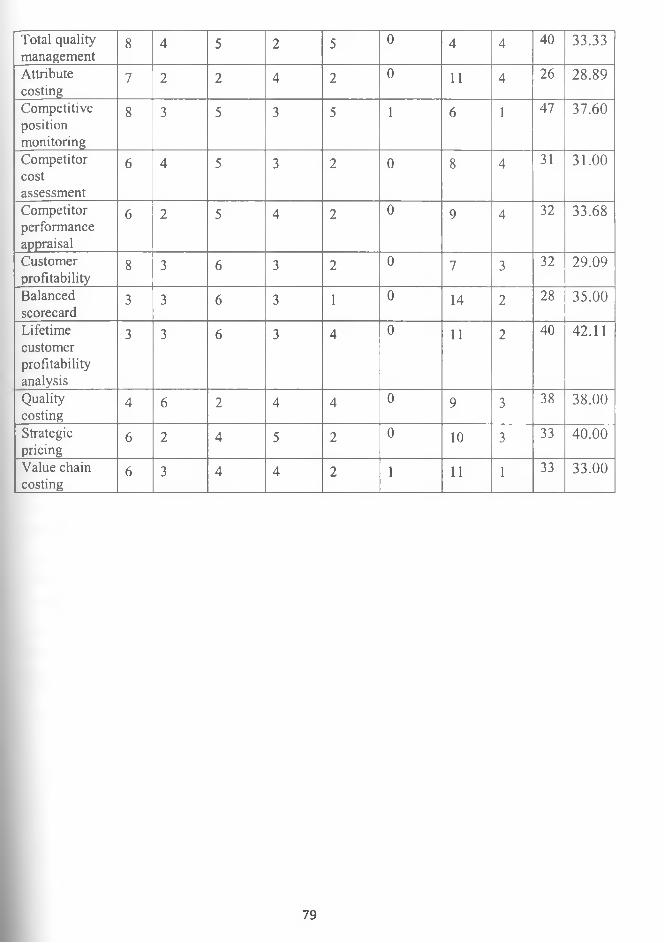
Total quality management
8 4 5 2 5 0 4 4 40 33.33
Attributecosting
7 2 2 4 2 ro- 11 4 26 28.89
Competitivepositionmonitoring
8 3 5 3 5 i 6 1 47 37.60
Competitorcostassessment
6 4 5 3 2 0 8 4 31 31.00
Competitorperformanceappraisal
6 2 5 4 2 0 9 4 32 33.68
Customerprofitability
8 3 6 3 2 0 7 3 32 29.09
Balancedscorecard
3 3 6 3 1 0 14 2 28 35.00
Lifetimecustomerprofitabilityanalysis
3 3 6 3 4 0 11 2 40 42.11
Qualitycosting
4 6 2 4 4 0 9 3 38 38.00
Strategicpricing
6 2 4 5 2 0 10 3 33 40.00
Value chain costing
6 3 4 4 2 1 11 1 33 33.00
79

Appendix IV: Factors facilitating management accounting change.
Appendix IV (i) CompetitionFrequency
Competition Negligible Less negligible Moderate Intense Extremelyintense
Nonresponse
Coun
t
Coun
t£
Coun
t
Coun
t
Coun
t
Coun
t
Pricecompetition
5 15.6 0 0 6 18.8 8 25.0 11 34.4 2 6.3
New product development
3 9.4 4 12.5 7 21.9 12 37.5 5 15.6 1 3.1
Marketing/ 2 6.3 2 6.3 7 21.9 9 28.1 9 28.1 3 9.4Competitor’saction
1 3.1 1 3.1 6 18.8 12 37.5 10 31.3 2 6.3
Competitor’smarkets
3 9.4 3 9.4 6 18.8 9 28.1 9 28.1 2 6.3
N Minimum Maximum Mean Std. Deviation
Price competition 30 1.00 5.00 3.6667 1.42232
New product development 31 1.00 5.00 3.3871 1.20215
Marketing/ distribution 29 1.00 5.00 3.7241 1.19213channelsCompetitor's action 30 1.00 5.00 3.9667 .99943
Competitor’s markets/ 30 1.00 5.00 3.6000 1.30252revenue shareValid N (list wise) 29
80

Appendix IV (ii) Manufacturing Technology
Frequency
Manufacturingtechnologies
Irrelevant
Lessirrelevant
Moderate Important Extremelyimportant
Nonresponse
Coun
t £
Coun
t £
Coun
t £
Coun
t £
Coun
t £
Coun
t £
Flexiblemanufacturingsystems
2 6.3 3 9.4 3 9.4 11 34.4 12 37.5 1 3.1
Computer aided manufacturing
4 12.5 3 9.4 3 9.4 12 37.5 9 28.1 1 3.1
Just-In -Time 7 21.9 3 9.4 4 12.5 7 21.9 10 31.3 1 3.1Computer -int manufacturing
9 28.1 3 9.4 6 18.8 7 21.9 5 15.6 2 6.3
Others 2 6.30
00
0 3 9.4 2 6.3 25 78
N Minimum Maximum Mean Std. Deviation
Flexible manufacturing 31 1.00 5.00 3.9032 1.22079systemsComputer aided 31 1.00 5.00 3.6129 1.35837manufacturingJust-In-Time 31 1.00 5.00 3.3226 1.57876Computer Integrated 30 1.00 5.00 2.8667 1.50249manufacturingOthers 7 1.00 5.00 3.4286 1.71825Valid N (listwise) 7
81

Appendix IV (iii) Organization Strategy
Frequency
Organizationstrategy
Irrelevant
Lessirrelevant
Moderate Important
Extremelyimportant
Nonresponse
Coun
t
Coun
t
Coun
t
N?0s Coun
t
£ Coun
t
Coun
t
N®oNProvide on time delivery
0 0 1 3.1 3 9.4 12 37.5 13 40.6 3 9.4
Make dependable delivery promises
0 0 1 3.1 4 12.5 13 40.6 11 34.4 3 9.4
Provide high quality products
0 0 1 3.1 7 21.9 0 0 22 68.8 2 6.3
Provide low costs 3 9.4 1 3.1 8 25.0 9 28.1 8 25.0 3 9.4Provide unique products
2 6.3 2 6.3 7 21.9 7 21.9 12 37.5 2 6.3
N Minimum Maximum Mean Std. Deviation
Provide on time delivery 29 2.00 5.00 4.2759 .79716Make dependable delivery 29 2.00 5.00 4.1724 .80485promisesProvide high quality 30 2.00 5.00 4.6667 .66089productsProvide low costs 29 1.00 5.00 3.6207 1.23675
Provide unique products 30 1.00 5.00 3.8333 1.23409Valid N (list wise) 27
82

Appendix IV (iv) Organization size and type
Frequency
Organization
size and type
Irrelevant Lessirrelevant
Moderate Important Extremelyimportant
Nonresponse
Coun
t
Coun
t
Coun
t
Coun
t
Coun
t
Coun
t
Increase in
accounting
staff
6 18.8 4 12.5 10 31.3 6 18.8 4 12.5 2 6.3
Expansion 2 6.3 2 6.3 8 25.0 11 34.4 8 25.0 1 3.1
Increase in
resources
1 3.1 2 6.3 6 18.8 14 43.8 6 18.8 3 9.4
N Minimum Maximum Mean Std. Deviation
Increase in accounting 30 1.00 5.00 2.9333 1.31131staffExpansion(e.g. new 31 1.00 5.00 3.6774 1.13687products)Increase in resources 29 1.00 5.00 3.7586 .98761
Valid N (list wise) 29
83

Appendix IV (v) Organization structure
FrequencyStructuralchanges
Irrelevant Lessirrelevant
Moderate Important Extremelyimportant
Nonresponse
Coun
tN®eN Co
unt
N®cx Coun
t
V®8s Coun
t
Coun
t
\®cx Coun
t
Decentralization 8 25.0 3 9.4 5 15.6 7 21.9 8 25.0 1 3.1Improvedcommunication
2 6.30
0 4 12.5 10 31.3 13 40.6 3 9.4
N Minimum Maximum Mean Std. Deviation
Decentralization 31 1.00 5.00 3.1290 1.56508Improved communication 29 1.00 5.00 4.1034 1.11307Valid N (list wise) 29
84

Frequency
Appendix IV (vi) Overall contextual variables
Overallcontextualvariables
Irrelevant Lessirrelevant
Moderate Important Extremelyimportant
Nonresponse
Coun
t
V©oN Coun
t
Coun
t
Coun
t
Coun
t
Coun
t
Competition 0 0 1 3.1 6 18.8 15 46.9 8 25.0 2 6.3Manufacturingtechnology
1 3.1 3 9.4 5 15.6 7 21.9 13 40.6 3 9.4
Organizationstrategy
0 0 0 0 9 28.1 11 34.4 9 28.1 3 9.4
Organization size and type
1 3.1 4 12.5 9 28.1 8 25.0 7 21.9 3 9.4
Organizationstructure
3 9.4 3 9.4 8 25.0 6 18.8 9 28.1 3 9.4
N Minimum Maximum Mean Std. Deviation
Competition 30 2.00 5.00 4.0000 .78784Manufacturing technology 29 1.00 5.00 3.9655 1.17967Organization strategy 29 3.00 5.00 4.0000 .80178Organization size and type 29 1.00 5.00 3.5517 1.12078Organization structure 29 1.00 5.00 3.5172 1.32613Valid N (list wise) 29
85

Appendix V: Regression analysis
Model Summary
Model R R SquareAdjusted R
SquareStd. Error of the
Estimate1 .552(a) .304 .153 6.12647a Predictors: (Constant), Organization structure, Competition, Manufacturing technology, Organization strategy, Organization size and type
ANOVA (b)
ModelSum of Squares df Mean Square F Sig.
1 Regression 377.462 5 75.492 2.011 .115(a)Residual 863.273 23 37.534Total 1240.735 28
Coefficients
Model UnstandardizedCoefficients
StandardizedCoefficients
95°Confic
intervalence for B
B Std.Error Beta t Sig. Lowerbound
Upperbound
(Constant) 20.932 7.845 2.668 .014 4.704 37.160Competition 4.262 1.722 .498 2.475 .021 .700 7.824Manufacturingtechnology -.024 1.240 -.004 -.019 .985 -2.588 2.541
Organizationstrategy -1.814 2.261 -.219 -.802 .431 -6.492 2.864
Organization size and type -1.740 2.100 -.293 -.828 .416 -6.085 2.605
Organizationstructure 2.864 1.676 .571 1.709 .101 -.602 6.330
86

Appendix VI: Hindrances to management accounting change
Frequency
Hindrances to
management accounting changes
Irrelevant Lessirrelevant
Moderate Important Extremelyimportant
Nonresponse
Coun
t
Coun
t
Coun
t
V ®oN Coun
t
Coun
t
Coun
t
Lack of adequatecomputingresources
7 21.9 2 6.3 5 15.6 5 15.6 10 31.3 3 9.4
Lack of topmanagementsupport
7 21.9 2 6.3 0 0 8 25.0 12 37.5 3 9.4
Lack of autonomy from parent company
12 37.5 5 15.6 1 3.1 6 18.8 4 12.5 4 12.5
Fear attitude 10 31.3 3 9.4 4 12.5 8 25.0 3 9.4 4 12.5Others 1 3.1 0 0 1 3.1 2 6.3 1 3.1 27 84.4
N Minimum Maximum Mean Std. Deviation
Lack of adequate 29 1.00 5.00 3.3103 1.60587computing resourcesLack of top management 29 1.00 5.00 3.5517 1.66017supportLack of autonomy from 28 1.00 5.00 2.4643 1.57485parent companyFear of change attitude 28 1.00 5.00 2.6786 1.49204
Others 5 1.00 5.00 3.4000 1.51658Valid N (list wise) 5
87

Appendix VII: List of the sampled manufacturing companies that participated in
the survey.
Associated paper manufacturers and General plastics.
stationary. GlaxoSmithKline limited
Athi river mining, marble and granite High chem. East Africa limitedlimited. Insteel limited.Banbros limited Ken pen industries limitedBeta health care Kenafric industries limited
Bidco limited Kenya grange vehicle industries limitedBritish American tobacco Kenya limited Kenya stationers limitedBrush manufacturers Labh Singh Hamam Singh limited.Car and general (Tyre and rubber
divisionMac’s pharmaceuticals
Morris and Company (2004) limited.Choda fabricators Pembe flour mills limitedCooper Kenya limited. Pfizer laboratories limitedCrown Berger Kenya limited. Premier flour millsEast Africa Portland Cement Company Sara lee (Kiwi) limited.East African packaging industries Timsaleslimited
Unga group limitedElliot’s bakery limited (Uzuri foods limited) Unilever Kenya limited
88


![[Information sheet] Climate change in natural capital accounting](https://img.dokumen.tips/doc/110x75/587c54c51a28abc62c8b6a4f/information-sheet-climate-change-in-natural-capital-accounting.jpg)


