Embed Size (px)
Citation preview

UNITED STATES SECURITIES AND EXCHANGE COMMISSION
Washington, D.C. 20549
Form 10-K
☒ ANNUAL REPORT PURSUANT TO SECTION 13 OR 15(d) OF THE SECURITIES EXCHANGE ACT OF 1934
For the fiscal year ended December 31, 2019
or
☐ TRANSITION REPORT PURSUANT TO SECTION 13 OR 15(d) OF THE SECURITIES EXCHANGE ACT OF 1934
Commission file number 1-9861
M&T BANK CORPORATION (Exact name of registrant as specified in its charter)
New York 16-0968385(State of incorporation) (I.R.S. Employer Identification No.)
One M&T Plaza, Buffalo, New York 14203(Address of principal executive offices) (Zip Code)
Registrant’s telephone number, including area code:
716-635-4000
Securities registered pursuant to Section 12(b) of the Act:
Title of Each Class Name of Each Exchange on Which RegisteredCommon Stock, $.50 par value New York Stock Exchange
Indicate by check mark if the registrant is a well-known seasoned issuer, as defined in Rule 405 of the Securities Act. Yes ☒ No ☐
Indicate by check mark if the registrant is not required to file reports pursuant to Section 13 or Section 15(d) of the Act. Yes ☐ No ☒
Indicate by check mark whether the registrant (1) has filed all reports required to be filed by Section 13 or 15(d) of the Securities Exchange Act of 1934 during the preceding 12 months, and (2) has been subject to such filing requirements for the past 90 days. Yes ☒ No ☐
Indicate by check mark whether the registrant has submitted electronically every Interactive Data File required to be submitted pursuant to Rule 405 of Regulation S-T (§ 232.405 of this chapter) during the preceding 12 months (or for such shorter period that the registrant was required to submit such files). Yes ☒ No ☐
Indicate by check mark whether the registrant is a large accelerated filer, an accelerated filer, a non-accelerated filer, a smaller reporting company, or an emerging growth company. See the definitions of “large accelerated filer,” “accelerated filer,” “smaller reporting company,” and “emerging growth company” in Rule 12b-2 of the Exchange Act.
Large accelerated filer ☒ Accelerated filer ☐Non-accelerated filer ☐ Smaller reporting company ☐Emerging growth company ☐
If an emerging growth company, indicate by check mark if the registrant has elected not to use the extended transition period for complying with any new or revised financial accounting standards provided pursuant to Section 13(a) of the Exchange Act. ☐
Indicate by check mark whether the registrant is a shell company (as defined in Rule 12b-2 of the Act). Yes ☐ No ☒
Aggregate market value of the Common Stock, $0.50 par value, held by non-affiliates of the registrant, computed by reference to the closing price as of the close of business on June 30, 2019: $22,178,197,910.
Number of shares of the Common Stock, $0.50 par value, outstanding as of the close of business on January 31, 2020: 130,436,633 shares.
Documents Incorporated By Reference:
(1) Portions of the Proxy Statement for the 2020 Annual Meeting of Shareholders of M&T Bank Corporation in Parts II and III.
2
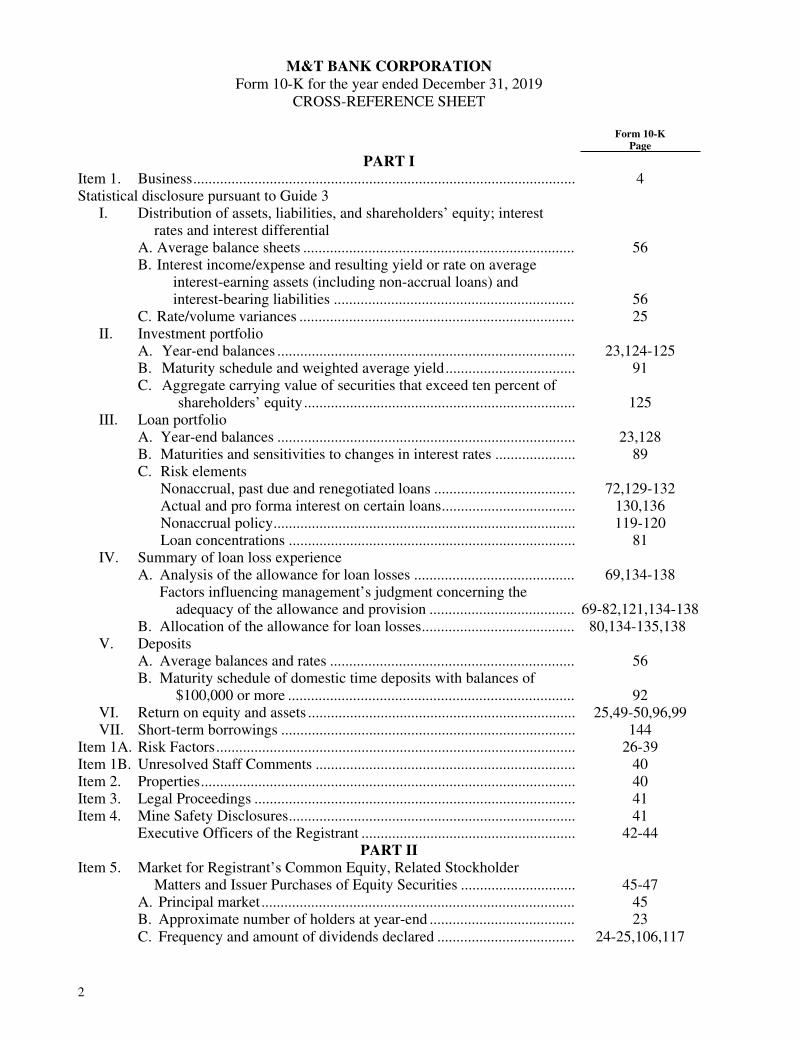
M&T BANK CORPORATIONForm 10-K for the year ended December 31, 2019
CROSS-REFERENCE SHEET
Form 10-KPage
PART IItem 1. Business.................................................................................................... 4Statistical disclosure pursuant to Guide 3 I. Distribution of assets, liabilities, and shareholders’ equity; interest
rates and interest differential A. Average balance sheets ....................................................................... 56
B. Interest income/expense and resulting yield or rate on average interest-earning assets (including non-accrual loans) and interest-bearing liabilities ............................................................... 56
C. Rate/volume variances ........................................................................ 25 II. Investment portfolio A. Year-end balances .............................................................................. 23,124-125 B. Maturity schedule and weighted average yield.................................. 91
C. Aggregate carrying value of securities that exceed ten percent of
shareholders’ equity....................................................................... 125 III. Loan portfolio A. Year-end balances .............................................................................. 23,128 B. Maturities and sensitivities to changes in interest rates ..................... 89 C. Risk elements Nonaccrual, past due and renegotiated loans ..................................... 72,129-132 Actual and pro forma interest on certain loans................................... 130,136 Nonaccrual policy............................................................................... 119-120 Loan concentrations ........................................................................... 81 IV. Summary of loan loss experience A. Analysis of the allowance for loan losses .......................................... 69,134-138
Factors influencing management’s judgment concerning the
adequacy of the allowance and provision ...................................... 69-82,121,134-138 B. Allocation of the allowance for loan losses........................................ 80,134-135,138 V. Deposits A. Average balances and rates ................................................................ 56
B. Maturity schedule of domestic time deposits with balances of
$100,000 or more ........................................................................... 92 VI. Return on equity and assets ...................................................................... 25,49-50,96,99 VII. Short-term borrowings ............................................................................. 144Item 1A. Risk Factors.............................................................................................. 26-39Item 1B. Unresolved Staff Comments .................................................................... 40Item 2. Properties.................................................................................................. 40Item 3. Legal Proceedings .................................................................................... 41Item 4. Mine Safety Disclosures........................................................................... 41 Executive Officers of the Registrant ........................................................ 42-44
PART IIItem 5. Market for Registrant’s Common Equity, Related Stockholder
Matters and Issuer Purchases of Equity Securities .............................. 45-47 A. Principal market.................................................................................. 45 B. Approximate number of holders at year-end ...................................... 23 C. Frequency and amount of dividends declared .................................... 24-25,106,117

3
Form 10-KPage
D. Restrictions on dividends.................................................................... 9 E. Securities authorized for issuance under equity
compensation plans ........................................................................ 45-47 F. Performance graph.............................................................................. 46 G. Repurchases of common stock ........................................................... 47Item 6. Selected Financial Data ............................................................................ 47 A. Selected consolidated year-end balances............................................ 23 B. Consolidated earnings, etc. ................................................................. 24Item 7. Management’s Discussion and Analysis of Financial Condition
and Results of Operations .................................................................... 47-107Item 7A. Quantitative and Qualitative Disclosures About Market Risk ................. 108Item 8. Financial Statements and Supplementary Data ........................................ 108 A. Report on Internal Control Over Financial Reporting ........................ 109 B. Report of Independent Registered Public Accounting Firm............... 110-112 C. Consolidated Balance Sheet — December 31, 2019 and 2018 .......... 113 D. Consolidated Statement of Income — Years ended December 31,
2019, 2018 and 2017 ...................................................................... 114 E. Consolidated Statement of Comprehensive Income — Years
ended December 31, 2019, 2018 and 2017 .................................... 115 F. Consolidated Statement of Cash Flows — Years ended
December 31, 2019, 2018 and 2017 ................................................... 116 G. Consolidated Statement of Changes in Shareholders’ Equity —
Years ended December 31, 2019, 2018 and 2017 .......................... 117 H. Notes to Financial Statements ............................................................ 118-194 I. Quarterly Trends ................................................................................. 106Item 9. Changes in and Disagreements with Accountants on Accounting
and Financial Disclosure ...................................................................... 195Item 9A. Controls and Procedures........................................................................... 195 A. Conclusions of principal executive officer and principal financial
officer regarding disclosure controls and procedures..................... 195 B. Management’s annual report on internal control over financial
reporting ............................................................................................. 195 C. Attestation report of the registered public accounting firm................ 195 D. Changes in internal control over financial reporting .......................... 195Item 9B. Other Information..................................................................................... 195
PART IIIItem 10. Directors, Executive Officers and Corporate Governance....................... 195Item 11. Executive Compensation.......................................................................... 196Item 12. Security Ownership of Certain Beneficial Owners and Management
and Related Stockholder Matters ......................................................... 196Item 13. Certain Relationships and Related Transactions, and Director
Independence ........................................................................................... 196Item 14. Principal Accountant Fees and Services .................................................. 196
PART IVItem 15. Exhibits and Financial Statement Schedules............................................ 196-199Item 16. Form 10-K Summary ............................................................................... 199SIGNATURES......................................................................................................... 200-201

4
PART I
Item 1. Business.
M&T Bank Corporation (“Registrant” or “M&T”) is a New York business corporation which is registered as a financial holding company under the Bank Holding Company Act of 1956, as amended (“BHCA”) and as a bank holding company (“BHC”) under Article III-A of the New York Banking Law (“Banking Law”). The principal executive offices of M&T are located at One M&T Plaza, Buffalo, New York 14203. M&T was incorporated in November 1969. M&T and its direct and indirect subsidiaries are collectively referred to herein as the “Company.” As of December 31, 2019 the Company had consolidated total assets of $119.9 billion, deposits of $94.8 billion and shareholders’ equity of $15.7 billion. The Company had 16,998 full-time and 775 part-time employees as of December 31, 2019.
At December 31, 2019, M&T had two wholly owned bank subsidiaries: Manufacturers and Traders Trust Company (“M&T Bank”) and Wilmington Trust, National Association (“Wilmington Trust, N.A.”). The banks collectively offer a wide range of retail and commercial banking, trust and wealth management, and investment services to their customers. At December 31, 2019, M&T Bank represented 99% of consolidated assets of the Company.
The Company from time to time considers acquiring banks, thrift institutions, branch offices of banks or thrift institutions, or other businesses within markets currently served by the Company or in other locations that would complement the Company’s business or its geographic reach. The Company has pursued acquisition opportunities in the past, continues to review different opportunities, including the possibility of major acquisitions, and intends to continue this practice.
SubsidiariesM&T Bank is a banking corporation that is incorporated under the laws of the State of New York. M&T Bank is a member of the Federal Reserve System and the Federal Home Loan Bank System, and its deposits are insured by the Federal Deposit Insurance Corporation (“FDIC”) up to applicable limits. M&T acquired all of the issued and outstanding shares of the capital stock of M&T Bank in December 1969. The stock of M&T Bank represents a major asset of M&T. M&T Bank operates under a charter granted by the State of New York in 1892, and the continuity of its banking business is traced to the organization of the Manufacturers and Traders Bank in 1856. The principal executive offices of M&T Bank are located at One M&T Plaza, Buffalo, New York 14203. As of December 31, 2019, M&T Bank had 731 domestic banking offices located in New York State, Maryland, New Jersey, Pennsylvania, Delaware, Connecticut, Virginia, West Virginia, and the District of Columbia, a full-service commercial banking office in Ontario, Canada, and an office in George Town, Cayman Islands. As of December 31, 2019, M&T Bank had consolidated total assets of $119.4 billion, deposits of $96.4 billion and shareholder’s equity of $15.1 billion. The deposit liabilities of M&T Bank are insured by the FDIC through its Deposit Insurance Fund (“DIF”). As a commercial bank, M&T Bank offers a broad range of financial services to a diverse base of consumers, businesses, professional clients, governmental entities and financial institutions located in its markets. Lending is largely focused on consumers residing in New York State, Maryland, New Jersey, Pennsylvania, Delaware, Connecticut, Virginia, West Virginia, and Washington, D.C., and on small and medium-size businesses based in those areas, although loans are originated through offices in other states and in Ontario, Canada. In addition, the Company conducts lending activities in various states through other subsidiaries. Trust and other fiduciary services are offered by M&T Bank and through its wholly owned subsidiary, Wilmington Trust Company. M&T Bank and certain of its subsidiaries also offer commercial mortgage loans secured by income producing properties or properties used by borrowers in a trade or business. Additional financial services are provided through other operating subsidiaries of the Company.

5
Wilmington Trust, N.A., a national banking association and a member of the Federal Reserve System and the FDIC, commenced operations on October 2, 1995. The deposit liabilities of Wilmington Trust, N.A. are insured by the FDIC through the DIF. The main office of Wilmington Trust, N.A. is located at 1100 North Market Street, Wilmington, Delaware 19890. Wilmington Trust, N.A. offers various trust and wealth management services. As of December 31, 2019, Wilmington Trust, N.A. had total assets of $4.7 billion, deposits of $3.9 billion and shareholder’s equity of $607 million.
Wilmington Trust Company, a wholly owned subsidiary of M&T Bank, was incorporated as a Delaware bank and trust company in March 1901 and amended its charter in July 2011 to become a nondepository trust company. Wilmington Trust Company provides a variety of Delaware based trust, fiduciary and custodial services to its clients. As of December 31, 2019, Wilmington Trust Company had total assets of $1.1 billion and shareholder’s equity of $632 million. Revenues of Wilmington Trust Company were $131 million in 2019. The headquarters of Wilmington Trust Company are located at 1100 North Market Street, Wilmington, Delaware 19890.
M&T Insurance Agency, Inc. (“M&T Insurance Agency”), a wholly owned insurance agency subsidiary of M&T Bank, was incorporated as a New York corporation in March 1955. M&T Insurance Agency provides insurance agency services principally to the commercial market. As of December 31, 2019, M&T Insurance Agency had assets of $42 million and shareholder’s equity of $23 million. M&T Insurance Agency recorded revenues of $37 million during 2019. The headquarters of M&T Insurance Agency are located at 285 Delaware Avenue, Buffalo, New York 14202.
M&T Real Estate Trust (“M&T Real Estate”) was a Maryland Real Estate Investment Trust that traced its origin to the incorporation of M&T Real Estate, Inc. in July 1995. M&T Real Estate engaged in commercial real estate lending and provided loan servicing to M&T Bank. M&T Real Estate was merged into M&T Bank effective September 1, 2019. Prior to its merger with M&T Bank, M&T Real Estate recorded $821 million of revenue in 2019.
M&T Realty Capital Corporation (“M&T Realty Capital”), a wholly owned subsidiary of M&T Bank, was incorporated as a Maryland corporation in October 1973. M&T Realty Capital engages in multifamily commercial real estate lending and provides loan servicing to purchasers of the loans it originates. As of December 31, 2019, M&T Realty Capital serviced or sub-serviced $21.0 billion of commercial mortgage loans for non-affiliates and had assets of $510 million and shareholder’s equity of $180 million. M&T Realty Capital recorded revenues of $174 million in 2019. The headquarters of M&T Realty Capital are located at One Light Street, Baltimore, Maryland 21202.
M&T Securities, Inc. (“M&T Securities”) is a wholly owned subsidiary of M&T Bank that was incorporated as a New York business corporation in November 1985. M&T Securities is registered as a broker/dealer under the Securities Exchange Act of 1934, as amended, and as an investment advisor under the Investment Advisors Act of 1940, as amended (the “Investment Advisors Act”). M&T Securities is licensed as a life insurance agent in each state where M&T Bank operates branch offices and in a number of other states. It provides securities brokerage, investment advisory and insurance services. As of December 31, 2019, M&T Securities had assets of $55 million and shareholder’s equity of $44 million. M&T Securities recorded $94 million of revenue during 2019. The headquarters of M&T Securities are located at 285 Delaware Avenue, Buffalo, New York 14202.
Wilmington Trust Investment Advisors, Inc. (“WT Investment Advisors”), a wholly owned subsidiary of M&T Bank, was incorporated as a Maryland corporation on June 30, 1995. WT Investment Advisors, a registered investment advisor under the Investment Advisors Act, serves as an investment advisor to the Wilmington Funds, a family of proprietary mutual funds, and institutional clients. As of December 31, 2019, WT Investment Advisors had assets of $54 million and shareholder’s equity of $45 million. WT Investment Advisors recorded revenues of $38 million

6
in 2019. The headquarters of WT Investment Advisors are located at 1100 North Market Street, Wilmington, Delaware 19890.
Wilmington Funds Management Corporation (“Wilmington Funds Management”) is a wholly owned subsidiary of M&T that was incorporated in September 1981 as a Delaware corporation. Wilmington Funds Management is registered as an investment advisor under the Investment Advisors Act and serves as an investment advisor to the Wilmington Funds. Wilmington Funds Management had assets and shareholder’s equity of $63 million and $62 million, respectively, as of December 31, 2019. Wilmington Funds Management recorded revenues of $25 million in 2019. The headquarters of Wilmington Funds Management are located at 1100 North Market Street, Wilmington, Delaware 19890.
Wilmington Trust Investment Management, LLC (“WTIM”) is a wholly owned subsidiary of M&T and was incorporated in December 2001 as a Georgia limited liability company. WTIM is a registered investment advisor under the Investment Advisors Act and provides investment management services to clients, including certain private funds. As of December 31, 2019, WTIM has assets and shareholder’s equity of $22 million. WTIM recorded revenues of $4 million in 2019. WTIM’s headquarters is located at Terminus 27th Floor, 3280 Peachtree Road N.E., Atlanta, Georgia 30305.
The Registrant and its banking subsidiaries have a number of other special-purpose or inactive subsidiaries. These other subsidiaries did not represent, individually and collectively, a significant portion of the Company’s consolidated assets, net income and shareholders’ equity at December 31, 2019.
Segment Information, Principal Products/Services and Foreign OperationsInformation about the Registrant’s business segments is included in note 22 of Notes to Financial Statements filed herewith in Part II, Item 8, “Financial Statements and Supplementary Data” and is further discussed in Part II, Item 7, “Management’s Discussion and Analysis of Financial Condition and Results of Operations.” The Registrant’s reportable segments have been determined based upon its internal profitability reporting system, which is organized by strategic business unit. Certain strategic business units have been combined for segment information reporting purposes where the nature of the products and services, the type of customer and the distribution of those products and services are similar. The reportable segments are Business Banking, Commercial Banking, Commercial Real Estate, Discretionary Portfolio, Residential Mortgage Banking and Retail Banking. The Company’s international activities are discussed in note 17 of Notes to Financial Statements filed herewith in Part II, Item 8, “Financial Statements and Supplementary Data.”
The only activity that, as a class, contributed 10% or more of the sum of consolidated interest income and other income in any of the last three years was interest on loans. The amount of income from such sources during those years is set forth on the Company’s Consolidated Statement of Income filed herewith in Part II, Item 8, “Financial Statements and Supplementary Data.”
Supervision and Regulation of the CompanyM&T and its subsidiaries are subject to the comprehensive regulatory framework applicable to bank and financial holding companies and their subsidiaries. Regulation of financial institutions such as M&T and its subsidiaries is intended primarily for the protection of depositors, the FDIC’s DIF and the banking and financial system as a whole, and generally is not intended for the protection of shareholders, investors or creditors other than insured depositors.
Proposals to change the applicable regulatory framework may be introduced in the United States Congress and state legislatures, as well as by regulatory agencies. Such initiatives may include proposals to expand or contract the powers of bank holding companies and depository institutions or proposals to substantially change the financial institution regulatory system. Such legislation could

7
change banking statutes and the operating environment of the Company in substantial and unpredictable ways. If enacted, such legislation could increase or decrease the cost of doing business, limit or expand permissible activities or affect the competitive balance among banks, savings associations, credit unions, and other financial institutions. A change in statutes, regulations or regulatory policies applicable to M&T or any of its subsidiaries could have a material effect on the business, financial condition or results of operations of the Company.
Described hereafter are material elements of the significant federal and state laws and regulations applicable to M&T and its subsidiaries. The descriptions are not intended to be complete and are qualified in their entirety by reference to the full text of the statutes and regulations described and do not include all pending or proposed changes in current laws or regulations.
OverviewM&T is registered with the Board of Governors of the Federal Reserve System (“Federal Reserve”) as a financial holding company and BHC under the BHCA. As such, M&T and its subsidiaries are subject to the supervision, examination, reporting, capital and other requirements of the BHCA and the regulations of the Federal Reserve. In addition, M&T’s banking subsidiaries are subject to regulation, supervision and examination by, as applicable, the New York State Department of Financial Services (“NYSDFS”), the Office of the Comptroller of the Currency (“OCC”), the FDIC and the Federal Reserve and their consumer financial products and services are regulated by the Consumer Financial Protection Bureau (“CFPB”). Further, financial services entities such as M&T’s investment advisor subsidiaries and M&T’s broker-dealer are subject to regulation by the Securities and Exchange Commission (“SEC”), the Financial Industry Regulatory Authority (“FINRA”), and the Securities Investor Protection Corporation (“SIPC”), among others. Other non-bank affiliates and activities, particularly insurance brokerage and agency activities, are subject to other federal and state laws and regulations as well as licensing and regulation by state insurance and bank regulatory agencies. Although the scope of regulation and form of supervision may vary from state to state, insurance laws generally grant broad discretion to regulatory authorities in adopting regulations and supervising regulated activities. This supervision generally includes the licensing of insurance brokers and agents and the regulation of the handling of customer funds held in a fiduciary capacity as well as regulations requiring, among other things, maintenance of capital, record keeping, and reporting.
M&T Bank is a New York chartered bank and a member of the Federal Reserve. As a result, it is subject to extensive regulation, examination and oversight by the NYSDFS and the Federal Reserve Bank of New York. New York laws and regulations govern many aspects of M&T Bank’s operations, including branching, dividends, subsidiary activities, fiduciary activities, lending, and deposit taking. M&T Bank is also subject to Federal Reserve regulations and guidance, including with respect to capital levels. Its deposits are insured by the FDIC to $250,000 per depositor, which also exercises regulatory oversight over certain aspects of M&T Bank’s operations. Certain subsidiaries of M&T Bank are subject to regulation by other federal and state regulators as well. For example, M&T Securities is regulated by the SEC, FINRA, SIPC, and state securities regulators, and WT Investment Advisors is also subject to SEC regulation.
Wilmington Trust, N.A. is a national bank with operations that include fiduciary and related activities with limited lending and deposit business. It is subject to extensive regulation, examination and oversight by the OCC which governs many aspects of its operations, including fiduciary activities, capital levels, office locations, dividends and subsidiary activities. Its deposits are insured by the FDIC to $250,000 per depositor, which also exercises regulatory oversight over certain aspects of the operations of Wilmington Trust, N.A.

8
Enhanced Prudential StandardsUnder Section 165 of the Dodd-Frank Wall Street Reform and Consumer Protection Act (“Dodd-Frank Act”), as amended by the Economic Growth, Regulatory Relief, and Consumer Protection Act of 2018 (“EGRRCPA”), U.S. bank holding companies with total consolidated assets of $100 billion or more, including M&T, are currently subject to enhanced prudential standards. The enhanced prudential standards include risk-based capital and leverage requirements, liquidity standards, risk management and risk committee requirements, stress test requirements and a debt-to-equity limit for companies that the Financial Stability Oversight Council has determined would pose a grave threat to systemic financial stability were they to fail such limits.
In October 2019, the Federal Reserve and the other Federal bank regulators adopted rules that tailor the application of the enhanced prudential standards to bank holding companies and of capital and liquidity requirements to bank holding companies and depository institutions (the “Tailoring Rules”). The Tailoring Rules assign each U.S. BHC with $100 billion or more in total consolidated assets, as well as its bank subsidiaries, to one of four categories based on its size and five other risk-based indicators: (1) cross-jurisdictional activity, (2) weighted short-term wholesale funding, (3) nonbank assets, (4) off-balance sheet exposure, and (5) status as a U.S. global systemically important BHC (“G-SIB”). Under the Tailoring Rules, M&T (and, pursuant to the Tailoring Rules, its depository institution subsidiaries) is subject to Category IV standards, which apply to banking organizations with at least $100 billion in total consolidated assets that do not meet any of the thresholds specified for Categories I through III.
Under the Tailoring Rules, Category IV firms, among other things, (1) are not subject to any Liquidity Coverage Ratio (“LCR”) (or, in certain cases, subject to reduced requirements), (2) remain eligible to opt-out of the requirement to recognize most elements of Accumulated Other Comprehensive Income (“AOCI”) in regulatory capital, (3) are no longer subject to company-run stress testing requirements, (4) are subject to supervisory stress testing on a biennial basis rather than an annual basis, (5) are subject to requirements to develop and maintain a capital plan on an annual basis and (6) are subject to certain liquidity risk management and risk committee requirements. Category IV firms continue not to be subject to (1) advanced approaches capital requirements, (2) the supplementary leverage ratio and (3) the countercyclical capital buffer. Other elements of the Tailoring Rules are discussed in further detail throughout this section.
M&T will continue to evaluate the impact of any changes in law and any new regulations promulgated, including changes in regulatory costs and fees, modifications to consumer products or disclosures required by the CFPB and the requirements of the enhanced supervision provisions, among others.
Permissible Activities under the BHC Act In general, the BHCA limits the business of a BHC to banking, managing or controlling banks, and other activities that the Federal Reserve has determined to be so closely related to banking as to be a proper incident thereto. In addition, bank holding companies are expected to serve as a managerial and financial source of strength to their subsidiary depository institutions, including committing resources to support such subsidiaries. This support may be required at times when M&T may not be inclined or able to provide it. In addition, any capital loans by a BHC to a subsidiary bank are subordinate in right of payment to deposits and to certain other indebtedness of such subsidiary bank. In the event of a BHC’s bankruptcy, any commitment by the BHC to a federal bank regulatory agency to maintain the capital of a subsidiary bank will be assumed by the bankruptcy trustee and entitled to a priority of payment.
Bank holding companies that qualify and elect to be financial holding companies may engage in any activity, or acquire and retain the shares of a company engaged in any activity, that is either (i) financial in nature or incidental to such financial activity (as determined by the Federal Reserve,
9
by regulation or order, in consultation with the Secretary of the Treasury) or (ii) complementary to a financial activity and does not pose a substantial risk to the safety and soundness of depository institutions or the financial system generally (as solely determined by the Federal Reserve). Activities that are financial in nature include securities underwriting and dealing, insurance underwriting and merchant banking.
M&T elected to become a financial holding company on March 1, 2011. To maintain financial holding company status, a financial holding company and all of its depository institution subsidiaries must be “well capitalized” and “well managed.” The failure to meet such requirements could result in material restrictions on the activities of M&T and may also adversely affect the Company’s ability to enter into certain transactions or obtain necessary approvals in connection therewith, as well as loss of financial holding company status. Additionally, if all of the Company’s depository institution subsidiaries have not received at least a “satisfactory” rating on its most recent examination under the the Community Reinvestment Act of 1977 (the “CRA”), it would not be able to commence any new financial activities or acquire a company that engages in such activities, although it would still be allowed to engage in activities closely related to banking and make investments in the ordinary course of conducting banking activities. See the section captioned “Community Reinvestment Act” included elsewhere in this discussion.
DistributionsM&T is a legal entity separate and distinct from its banking and other subsidiaries. Historically, the majority of M&T’s revenue has been from dividends paid to M&T by its subsidiary banks. M&T Bank and Wilmington Trust, N.A. are subject to laws and regulations imposing restrictions on the amount of dividends they may declare and pay. Future dividend payments to M&T by its subsidiary banks will be dependent on a number of factors, including the earnings and financial condition of each such bank, and are subject to the limitations referred to in note 23 of Notes to Financial Statements filed herewith in Part II, Item 8, “Financial Statements and Supplementary Data,” and to other statutory powers of bank regulatory agencies.
An insured depository institution is prohibited from making any capital distribution to its owner, including any dividend, if, after making such distribution, the depository institution fails to meet the required minimum level for any relevant capital measure, including the risk-based capital adequacy and leverage standards discussed herein.
Dividend payments by M&T to its shareholders and common stock repurchases by M&T are subject to the oversight of the Federal Reserve. As described below in this section under “Stress Testing and Capital Plan Review,” dividends and common stock repurchases (net of any new stock issuances as per a capital plan) generally may only be paid or made under a capital plan as to which the Federal Reserve has not objected.
Capital RequirementsM&T and its subsidiary banks are required to comply with applicable capital adequacy standards established by the federal banking agencies (the “Capital Rules”), which are based on the Basel Committee’s December 2010 final capital framework for strengthening international capital standards, referred to as “Basel III”.
Among other matters, the Capital Rules impose a capital measure called Common Equity Tier 1 Capital (“CET1”) to which most deductions/adjustments to regulatory capital measures must be made. In addition, the Capital Rules specify that Tier 1 capital consists of CET1 and “Additional Tier 1 capital” instruments meeting certain specified requirements. Pursuant to the Capital Rules, the

10
minimum capital ratios are as follows:• 4.5% CET1 to risk-weighted assets;• 6.0% Tier 1 capital (that is, CET1 plus Additional Tier 1 capital) to risk-weighted assets;• 8.0% Total capital (that is, Tier 1 capital plus Tier 2 capital) to risk-weighted assets; and• 4.0% Tier 1 capital to average consolidated assets as reported on consolidated financial
statements (known as the “leverage ratio”).
In calculating regulatory capital ratios M&T must assign risk weights to the Company’s assets and off-balance sheet items. M&T has an ongoing process to review data elements associated with certain assets that from time to time may affect how specific assets are classified and could lead to increases or decreases of the regulatory risk weights assigned to such assets.
The Capital Rules also impose a “capital conservation buffer” (“CCB”) of 2.5%, composed entirely of CET1, on top of the three minimum risk-weighted asset ratios listed above. The capital conservation buffer is designed to absorb losses during periods of economic stress. Thus, the effective minimum ratios applicable to M&T are (i) CET1 to risk-weighted assets of at least 7%, (ii) Tier 1 capital to risk-weighted assets of at least 8.5% and (iii) total capital to risk-weighted assets of at least 10.5%. Banking institutions that fail to meet the effective minimum ratios once the CCB is taken into account will be subject to constraints on capital distributions, including dividends and share repurchases, and certain discretionary executive compensation. The severity of the constraints depends on the amount of the shortfall and the institution’s “eligible retained income” (that is, four quarter trailing net income, net of distributions and tax effects not reflected in net income). On April 10, 2018, the Federal Reserve issued a proposal designed to create a single, integrated capital requirement by combining the quantitative assessment of firms’ capital plans with the CCB requirement. Details of this proposal are discussed under “Stress Testing and Capital Plan Review” herein. Although the proposal, if adopted, would change the way in which the minimum ratios are calculated, firms would continue to be subject to progressively more stringent constraints on capital actions as they approach the minimum ratios.
CET1 consists of common stock instruments that meet the eligibility criteria in the Capital Rules, including common stock and related surplus, net of treasury stock, retained earnings, certain minority interests and, for certain firms, AOCI. As permitted under the Capital Rules, M&T made a one-time permanent election to neutralize certain AOCI components, with the result that those components are not recognized in M&T’s CET1. The Capital Rules also preclude certain hybrid securities, such as trust preferred securities, from inclusion in bank holding companies’ Tier 1 capital. Thus, trust preferred securities no longer included in M&T’s Tier 1 capital may nonetheless be included as a component of Tier 2 capital on a permanent basis and irrespective of whether such securities otherwise meet the revised definition of Tier 2 capital set forth in the Capital Rules. M&T’s regulatory capital ratios are presented in note 23 of Notes to Financial Statements filed herewith in Part II, Item 8, “Financial Statements and Supplementary Data.”
The Capital Rules provide for a number of deductions from and adjustments to CET1. These include, for example, the requirement that mortgage servicing rights, certain deferred tax assets, and significant investments in non-consolidated financial entities be deducted from CET1. The deductions and other adjustments to CET1 capital generally became fully phased-in on January 1, 2018, except that in November 2017, the federal banking regulators revised the Capital Rules to extend the then-current transitional treatment of these deductions for non-advanced approaches banking organizations (the “Transition Rule”) until revisions to the deductions became effective.
In July 2019, the federal banking regulators adopted rules intended to simplify the deductions for these items for banking organizations, such as M&T, that are not subject to the “advanced approaches” under the Capital Rules (the “Capital Simplification Rules”). The Capital

11
Simplifications Rules and the rescission of the Transition Rule were adopted by the Company as of January 1, 2020.
In December 2017, the Basel Committee published standards that it described as the finalization of the Basel III post-crisis regulatory reforms (the standards are commonly referred to as “Basel IV”). Among other things, these standards revise the Basel Committee’s standardized approach for credit risk (including by recalibrating risk weights and introducing new capital requirements for certain “unconditionally cancellable commitments,” such as unused credit card lines of credit) and provides a new standardized approach for operational risk capital. Under the Basel framework, these standards will generally be effective on January 1, 2022, with an aggregate output floor phasing in through January 1, 2027. Under the current U.S. capital rules, operational risk capital requirements and a capital floor apply only to advanced approaches institutions, and not to the Company. The impact of Basel IV will depend on the manner in which it is implemented by the federal banking regulators.
Stress Testing and Capital Plan ReviewAs part of the enhanced prudential requirements applicable to systemically important financial institutions, the Federal Reserve conducts periodic analyses of bank holding companies with at least $100 billion in total consolidated assets to determine whether the companies have sufficient capital on a consolidated basis necessary to absorb losses in baseline and severely adverse economic and financial scenarios generated by the Federal Reserve. For Category IV firms, such as M&T, these supervisory stress tests occur on a biennial basis, including 2020. The Federal Reserve may also use additional components in the severely adverse scenario or additional or more complex scenarios designed to capture salient risks to specific business groups. A summary of results of the Federal Reserve’s analysis under the severely adverse stress scenario is publicly disclosed. Under the Tailoring Rules, Category IV firms, including M&T, are no longer subject to company-run stress testing requirements. However, they remain subject to the quantitative review of their capital plans under CCAR, to required capital plan submissions, and to the associated reporting requirements.
In addition, bank holding companies with total consolidated assets of $100 billion or more, such as M&T, must submit annual capital plans for approval as part of the Federal Reserve’s CCAR process. Covered bank holding companies may execute capital actions, such as paying dividends and repurchasing stock, only in accordance with a capital plan that has been reviewed and approved by the Federal Reserve (or any approved amendments to such plan). The comprehensive capital plans include a view of capital adequacy under various scenarios — including a BHC-defined baseline scenario, a baseline scenario provided by the Federal Reserve, at least one BHC-defined stress scenario, and severely adverse scenarios provided by the Federal Reserve. The CCAR process is intended to help ensure that these bank holding companies have robust, forward-looking capital planning processes that account for each company’s unique risks and that permit continued operations during times of economic and financial stress. Each of the bank holding companies participating in the CCAR process is also required to collect and report certain related data to the Federal Reserve on a quarterly basis to allow the Federal Reserve to monitor progress against the approved capital plans. Each capital plan must include a view of capital adequacy under the stress test scenarios described above. In connection with the adoption of the Tailoring Rules, the Federal Reserve stated that it expects to revise its guidance relating to capital planning to align with the categories of standards set forth in the Tailoring Rules, and the impact of the future proposal on M&T and its capital planning process will depend on the final form of the Federal Reserve’s revised guidance.
The Federal Reserve may object to a capital plan if the plan does not show that the covered BHC will maintain sufficient regulatory capital ratios on a pro forma basis under expected and stressful conditions throughout the nine-quarter planning horizon covered by the capital plan. The

12
rules also provide that a covered BHC may not make a capital distribution unless after giving effect to the distribution it will meet all minimum regulatory capital ratios. The Federal Reserve also incorporates an assessment of the qualitative aspects of the firm’s capital planning process into regular, ongoing supervisory activities and through targeted, horizontal assessments of particular aspects of capital planning. M&T’s annual CCAR capital plan is currently due in April each year. The Federal Reserve publishes the results of its supervisory stress tests and quantitative CCAR review of capital plans by June 30 of each year.
In addition to other limitations, M&T’s ability to make any capital distributions is contingent on the Federal Reserve’s non-objection to M&T’s capital plan. The Federal Reserve generally limits a BHC’s ability to make quarterly capital distributions – that is, dividends and share repurchases – if the amount of the BHC’s actual cumulative quarterly capital issuances of instruments that qualify as regulatory capital are less than the BHC had indicated in its submitted capital plan as to which it received a non-objection from the Federal Reserve.
As noted above, on April 10, 2018, the Federal Reserve issued a proposal designed to create a single, integrated capital requirement by combining the quantitative assessment of CCAR with the CCB requirement. If adopted, the proposal would replace the current static 2.5% CCB with a stress capital buffer (“SCB”) requirement. The SCB, subject to a minimum of 2.5%, would reflect stressed losses in the supervisory severely adverse scenario of the Federal Reserve’s supervisory stress tests and would also include four quarters of planned common stock dividends. The proposal would also introduce a stress leverage buffer (“SLB”) requirement, similar to the SCB, which would apply to the Tier 1 leverage ratio. In addition, the proposal would eliminate the quantitative objection provisions of CCAR but would require a BHC to reduce its planned capital distributions if those distributions would not be consistent with the applicable capital buffer constraints based on the BHC’s own baseline scenario projections. The Federal Reserve has stated that it intends to propose revisions to the stress buffer requirements that would be applicable to a Category IV BHC to align with the two-year supervisory stress testing cycle for Category IV bank holding companies.
LiquidityThe Federal Reserve and other banking regulators have adopted rules implementing a U.S. version of the Basel Committee’s LCR requirement, which is intended to ensure that banks hold sufficient amounts of so-called “high quality liquid assets” (“HQLA”) to cover the anticipated net cash outflows during a hypothetical acute 30-day stress scenario. Under the Tailoring Rules, Category IV firms with less than $50 billion in weighted short-term wholesale funding, including M&T, are no longer subject to any LCR requirement.
The Basel III framework also included a second standard, referred to as the Net Stable Funding Ratio (“NSFR”), which is designed to promote more medium- and long-term funding of the assets and activities of banks over a one-year time horizon. In May 2016, the Federal Reserve and other federal banking regulators issued a proposed rule that would implement the NSFR for large U.S. banking organizations. Although the NSFR has not been finalized, it is expected that the framework for applying any finalized NSFR will be consistent with the approach for the LCR requirement under the Tailoring Rules.
Under the Tailoring Rules, Category IV firms, including M&T, remain subject to liquidity risk management requirements, but these requirements are now tailored such that these firms are required to: (i) calculate collateral positions monthly, as opposed to weekly; (ii) establish a more limited set of liquidity risk limits; and (iii) monitor fewer elements of intraday liquidity risk exposures. These firms are now also subject to liquidity stress testing quarterly, rather than monthly, and are required to report liquidity data on the FR 2052a on a monthly basis. M&T remains subject to the liquidity buffer requirements.
13
Cross Guaranty ProvisionThe cross guaranty provisions in the Federal Deposit Insurance Act (“FDIA”) were enacted by Congress in the Financial Institutions, Reform, Recovery and Enforcement Act of 1989 (“FIRREA”) and require each insured depository institution owned by the same BHC to be financially responsible for the failure or resolution costs of any affiliated insured institution. Generally, the amount of the cross guaranty liability is equal to the estimated loss to the DIF for the resolution of the affiliated institution(s) in default. The FDIC’s claim under the cross guaranty provision is superior to claims of shareholders of the insured depository institution or its BHC and to most claims arising out of obligations or liabilities owed to affiliates of the institution, but is subordinate to claims of depositors, secured creditors and holders of subordinated debt (other than affiliates) of the commonly controlled insured depository institution. The FDIC may decline to enforce the cross guaranty provision if it determines that a waiver is in the best interest of the DIF.
Volcker RuleOn December 10, 2013, the federal banking regulators and the SEC adopted the so-called Volcker Rule to implement the provisions of the Dodd-Frank Act limiting proprietary trading and investing in and sponsoring certain hedge funds and private equity funds (defined as “covered funds” in the Volcker Rule). The Company does not engage in any significant amount of proprietary trading as defined in the Volcker Rule and implemented the required procedures for those areas in which trading does occur. The covered funds limits are imposed through a conformance period that ended in July 2017. The Company has sought, and received, from the Federal Reserve, a five-year extension (to July 21, 2022) to either divest or terminate its investment in one venture capital fund. In October 2019, the Federal Reserve, OCC, FDIC, CFTC and SEC finalized rules to tailor the application of the Volcker Rule based on the size and scope of a banking entity’s trading activities and to clarify and amend certain definitions, requirements and exemptions. These regulators have also stated their intention to engage in further rulemaking with respect to the implementing of regulations relating to covered funds, including potential changes to the definition of “covered funds” and the prohibitions on certain covered transactions.
Safety and Soundness StandardsGuidelines adopted by the federal bank regulatory agencies pursuant to the FDIA establish general standards relating to internal controls, information systems, internal audit systems, loan documentation, credit underwriting, interest rate exposure, asset growth, compensation, fees and benefits. In general, these guidelines require, among other things, appropriate systems and practices to identify and manage the risk and exposures specified in the guidelines. Additionally, the agencies adopted regulations that authorize, but do not require, an agency to order an institution that has been given notice by an agency that it is not satisfying any of such safety and soundness standards to submit a compliance plan. If, after being so notified, an institution fails to submit an acceptable compliance plan or fails in any material respect to implement an acceptable compliance plan, the agency must issue an order directing action to correct the deficiency and may issue an order directing other actions of the types to which an undercapitalized institution is subject. If an institution fails to comply with such an order, the agency may seek to enforce such order in judicial proceedings and to impose civil money penalties.
Limits on Undercapitalized Depository InstitutionsThe FDIA establishes a system of regulatory remedies to resolve the problems of undercapitalized institutions, referred to as the prompt corrective action. The federal banking regulators have established five capital categories (“well-capitalized,” “adequately capitalized,” “undercapitalized,” “significantly undercapitalized” and “critically undercapitalized”) and must take certain mandatory
14
supervisory actions, and are authorized to take other discretionary actions, with respect to institutions which are undercapitalized, significantly undercapitalized or critically undercapitalized. The severity of these mandatory and discretionary supervisory actions depends upon the capital category in which the institution is placed. The FDIC has specified by regulation the relevant capital levels for each category. The FDIA’s prompt corrective action provisions only apply to depository institutions and not to bank holding companies. The Federal Reserve’s regulations applicable to bank holding companies separately define “well capitalized.” A financial holding company that is not well-capitalized and well-managed (or whose bank subsidiaries are not well capitalized and well managed) under applicable prompt corrective action standards may be restricted in certain of its activities and ultimately may lose financial holding company status. Under existing rules, an institution that is not an advanced approaches institution is deemed to be “well capitalized” if it has (i) a CET1 ratio of at least 6.5%, (ii) a Tier 1 capital ratio of at least 8%, (iii) a Total capital ratio of at least 10%, and (iv) a Tier 1 leverage ratio of at least 5%.
An institution that is categorized as undercapitalized, significantly undercapitalized or critically undercapitalized is required to submit an acceptable capital restoration plan to its appropriate federal banking regulator. Under the FDIA, in order for the capital restoration plan to be accepted by the appropriate federal banking agency, a BHC must guarantee that a subsidiary depository institution will comply with its capital restoration plan, subject to certain limitations. The BHC must also provide appropriate assurances of performance. An undercapitalized institution is also generally prohibited from increasing its average total assets, accepting brokered deposits or offering interest rates on any deposits significantly higher than prevailing market rates, making acquisitions, establishing any branches or engaging in any new line of business, except in accordance with an accepted capital restoration plan or with the approval of the FDIC. Institutions that are significantly undercapitalized or undercapitalized and either fail to submit an acceptable capital restoration plan or fail to implement an approved capital restoration plan may be subject to a number of requirements and restrictions, including orders to sell sufficient voting stock to become adequately capitalized, requirements to reduce total assets and cessation of receipt of deposits from correspondent banks. Critically undercapitalized depository institutions failing to submit or implement an acceptable capital restoration plan are subject to appointment of a receiver or conservator.
Transactions with AffiliatesThere are various legal restrictions on the extent to which M&T and its non-bank subsidiaries may borrow or otherwise obtain funding from M&T Bank and Wilmington Trust, N.A. In general, Sections 23A and 23B of the Federal Reserve Act and Federal Reserve Regulation W require that any “covered transaction” by M&T Bank and Wilmington Trust, N.A. (or any of their respective subsidiaries) with an affiliate must in certain cases be secured by designated amounts of specified collateral and must be limited as follows: (a) in the case of any single such affiliate, the aggregate amount of covered transactions of the insured depository institution and its subsidiaries may not exceed 10% of the capital stock and surplus of such insured depository institution, and (b) in the case of all affiliates, the aggregate amount of covered transactions of an insured depository institution and its subsidiaries may not exceed 20% of the capital stock and surplus of such insured depository institution. “Covered transactions” are defined by statute to include, among other things, a loan or extension of credit, as well as a purchase of securities issued by an affiliate, a purchase of assets (unless otherwise exempted by the Federal Reserve) from the affiliate, certain derivative transactions that create a credit exposure to an affiliate, the acceptance of securities issued by the affiliate as collateral for a loan, and the issuance of a guarantee, acceptance or letter of credit on behalf of an affiliate. All covered transactions, including certain additional transactions (such as transactions with a third party in which an affiliate has a financial interest), must be conducted on market terms.

15
FDIC Insurance AssessmentsDeposit Insurance Assessments. M&T Bank and Wilmington Trust, N.A. deposits are insured by the DIF of the FDIC up to the limits set forth under applicable law. The FDIC imposes a risk-based premium assessment system that determines assessment rates for financial institutions. Deposit insurance assessments are based on average total assets minus average tangible equity. For larger institutions, such as M&T Bank, the FDIC uses a performance score and a loss-severity score that are used to calculate an initial assessment rate. In calculating these scores, the FDIC uses a bank’s capital level and supervisory ratings and certain financial measures to assess an institution’s ability to withstand asset-related stress and funding-related stress. The FDIC has the ability to make discretionary adjustments to the total score based upon significant risk factors that are not adequately captured in the calculations. Under the current system, premiums are assessed quarterly.
Under the FDIA, insurance of deposits may be terminated by the FDIC upon a finding that the institution has engaged in unsafe and unsound practices, is in an unsafe or unsound condition to continue operations, or has violated any applicable law, regulation, rule, order or condition imposed by the FDIC.
AcquisitionsThe BHCA requires every BHC to obtain the prior approval of the Federal Reserve before: (1) it may acquire direct or indirect ownership or control of any voting shares of any bank or savings institution, if after such acquisition, the BHC will directly or indirectly own or control 5% or more of the voting shares of the institution; (2) it or any of its subsidiaries, other than a bank, may acquire all or substantially all of the assets of any bank or savings institution; or (3) it may merge or consolidate with any other BHC. Financial holding companies are required to obtain prior approval from the Federal Reserve before acquiring certain nonbank financial companies with assets exceeding $10 billion.
The BHCA further provides that the Federal Reserve may not approve any transaction that would result in a monopoly or would be in furtherance of any combination or conspiracy to monopolize or attempt to monopolize the business of banking in any section of the United States, or the effect of which may be substantially to lessen competition or to tend to create a monopoly in any section of the country, or that in any other manner would be in restraint of trade, unless the anticompetitive effects of the proposed transaction are clearly outweighed by the public interest in meeting the convenience and needs of the community to be served. The Federal Reserve is also required to consider the financial and managerial resources and future prospects of the bank holding companies and banks concerned and the convenience and needs of the community to be served. Consideration of financial resources generally focuses on capital adequacy and consideration of convenience and needs issues includes the parties’ performance under the CRA and compliance with consumer protection laws. The Federal Reserve must take into account the institutions’ effectiveness in combating money laundering. In addition, pursuant to the Dodd-Frank Act, the BHCA was amended to require the Federal Reserve, when evaluating a proposed transaction, to consider the extent to which the transaction would result in greater or more concentrated risks to the stability of the United States banking or financial system.
Executive and Incentive CompensationGuidelines adopted by several federal banking agencies prohibit excessive compensation as an unsafe and unsound practice and describe compensation as “excessive” when the amounts paid are unreasonable or disproportionate to the services performed by an executive officer, employee, director or principal stockholder. The Federal Reserve issued comprehensive guidance on incentive compensation policies (the “Incentive Compensation Guidance”) intended to ensure that the incentive compensation policies of banking organizations do not undermine the safety and soundness

16
of such organizations by encouraging excessive risk-taking. The Incentive Compensation Guidance, which covers all employees that have the ability to materially affect the risk profile of an organization, either individually or as part of a group, is based upon the key principles that a banking organization’s incentive compensation arrangements should (i) provide incentives that do not encourage risk-taking beyond the organization’s ability to effectively identify and manage risks, (ii) be compatible with effective internal controls and risk management, and (iii) be supported by strong corporate governance, including active and effective oversight by the organization’s board of directors. These three principles are incorporated into the proposed joint compensation regulations under the Dodd-Frank Act noted below. Any deficiencies in compensation practices that are identified may be incorporated into the organization’s supervisory ratings, which can affect its ability to make acquisitions or perform other actions. The Incentive Compensation Guidance provides that enforcement actions may be taken against a banking organization if its incentive compensation arrangements or related risk-management control or governance processes pose a risk to the organization’s safety and soundness and the organization is not taking prompt and effective measures to correct the deficiencies.
The Dodd-Frank Act requires the federal bank regulatory agencies and the SEC to establish joint regulations or guidelines prohibiting incentive-based payment arrangements at specified regulated entities having at least $1 billion in total assets, such as M&T and M&T Bank. In June 2016, the agencies proposed rules to implement this requirement but these proposed rules have not been finalized.
In October 2016, the NYSDFS issued guidance emphasizing that its regulated banking institutions, including M&T Bank, must ensure that any incentive compensation arrangements tied to employee performance indicators are subject to effective risk management, oversight and control.
The scope and content of the banking regulators’ policies on incentive compensation are continuing to develop and are likely to continue evolving in the future. It cannot be determined at this time whether compliance with such policies will adversely affect the ability of M&T and its subsidiaries to hire, retain and motivate their key employees.
Resolution PlanningPursuant to the Dodd-Frank Act, as amended by EGRRCPA, certain bank holding companies are required to report periodically to the Federal Reserve and the FDIC a resolution plan for their rapid and orderly resolution in the event of material financial distress or failure. However, in connection with the release of the Tailoring Rules, the Federal Reserve and FDIC finalized rules in October 2019 which, among other things, adjust the review cycles and applicability of the agencies’ resolution planning requirements. Under these new rules, Category IV firms such as M&T are no longer required to submit resolution plans.
The FDIC has separately implemented a resolution planning rule that currently requires insured depository institutions with $50 billion or more in total assets, such as M&T Bank, to submit to the FDIC periodic plans for resolution in the event of the institution’s failure. In April 2019, the FDIC released an advance notice of proposed rulemaking about potential changes to its resolution planning requirements for insured depository institutions, such as M&T Bank, and the next round of insured depository institution resolution plan submissions will not be required until the rulemaking process is complete.

17
Insolvency of an Insured Depository Institution or a Bank Holding CompanyIf the FDIC is appointed as conservator or receiver for an insured depository institution such as M&T Bank or Wilmington Trust, N.A., upon its insolvency or in certain other events, the FDIC has the power:
• to transfer any of the depository institution’s assets and liabilities to a new obligor, including a newly formed “bridge” bank without the approval of the depository institution’s creditors;
• to enforce the terms of the depository institution’s contracts pursuant to their terms without regard to any provisions triggered by the appointment of the FDIC in that capacity; or
• to repudiate or disaffirm any contract or lease to which the depository institution is a party, the performance of which is determined by the FDIC to be burdensome and the disaffirmance or repudiation of which is determined by the FDIC to promote the orderly administration of the depository institution.
In addition, under federal law, the claims of holders of domestic deposit liabilities and certain claims for administrative expenses against an insured depository institution would be afforded a priority over other general unsecured claims against such an institution, including claims of debt holders of the institution, in the “liquidation or other resolution” of such an institution by any receiver. As a result, whether or not the FDIC ever sought to repudiate any debt obligations of M&T Bank or Wilmington Trust, N.A., the debt holders would be treated differently from, and could receive, if anything, substantially less than, the depositors of the bank. The Dodd-Frank Act created a new resolution regime (known as “orderly liquidation authority”) for systemically important financial companies, including bank holding companies and their affiliates. Under the orderly liquidation authority, the FDIC may be appointed as receiver for the systemically important institution, and its failed subsidiaries, for purposes of liquidating the entity if, among other conditions, it is determined at the time of the institution’s failure that it is in default or in danger of default and the failure poses a risk to the stability of the U.S. financial system.
If the FDIC is appointed as receiver under the orderly liquidation authority, then the powers of the receiver, and the rights and obligations of creditors and other parties who have dealt with the institution, would be determined under the Dodd-Frank Act provisions, and not under the insolvency law that would otherwise apply. The powers of the receiver under the orderly liquidation authority were based on the powers of the FDIC as receiver for depository institutions under the FDIA. However, the provisions governing the rights of creditors under the orderly liquidation authority were modified in certain respects to reduce disparities with the treatment of creditors’ claims under the U.S. Bankruptcy Code as compared to the treatment of those claims under the new authority. Nonetheless, substantial differences in the rights of creditors exist as between these two regimes, including the right of the FDIC to disregard the strict priority of creditor claims in some circumstances, the use of an administrative claims procedure to determine creditors’ claims (as opposed to the judicial procedure utilized in bankruptcy proceedings), and the right of the FDIC to transfer claims to a “bridge” entity.
An orderly liquidation fund will fund such liquidation proceedings through borrowings from the Treasury Department and risk-based assessments made, first, on entities that received more in the resolution than they would have received in liquidation to the extent of such excess, and second, if necessary, on bank holding companies with total consolidated assets of $50 billion or more, such as M&T. If an orderly liquidation is triggered, M&T could face assessments for the orderly liquidation fund.
The FDIC has developed a strategy under the orderly liquidation authority referred to as the “single point of entry” strategy, under which the FDIC would resolve a failed financial holding

18
company by transferring its assets (including shares of its operating subsidiaries) and, potentially, very limited liabilities to a “bridge” holding company; utilize the resources of the failed financial holding company to recapitalize the operating subsidiaries; and satisfy the claims of unsecured creditors of the failed financial holding company and other claimants in the receivership by delivering securities of one or more new financial companies that would emerge from the bridge holding company. Under this strategy, management of the failed financial holding company would be replaced and shareholders and creditors of the failed financial holding company would bear the losses resulting from the failure.
Depositor PreferenceUnder federal law, depositors and certain claims for administrative expenses and employee compensation against an insured depository institution would be afforded a priority over other general unsecured claims against such an institution in the “liquidation or other resolution” of such an institution by any receiver. If an insured depository institution fails, insured and uninsured depositors, along with the FDIC, will have priority in payment ahead of unsecured, non-deposit creditors, including depositors whose deposits are payable only outside of the United States and the parent BHC, with respect to any extensions of credit they have made to such insured depository institution.
Financial Privacy and Cyber SecurityThe federal banking regulators have adopted rules that limit the ability of banks and other financial institutions to disclose non-public information about consumers to non-affiliated third parties. These limitations require disclosure of privacy policies to consumers and, in some circumstances, allow consumers to prevent disclosure of certain personal information to a non-affiliated third party. These regulations affect how consumer information is transmitted through diversified financial companies and conveyed to outside vendors. In addition, consumers may also prevent disclosure of certain information among affiliated companies that is assembled or used to determine eligibility for a product or service, such as that shown on consumer credit reports and asset and income information from applications. Consumers also have the option to direct banks and other financial institutions not to share information about transactions and experiences with affiliated companies for the purpose of marketing products or services. Federal law makes it a criminal offense, except in limited circumstances, to obtain or attempt to obtain customer information of a financial nature by fraudulent or deceptive means.
In October 2016, the federal banking regulators jointly issued an advance notice of proposed rulemaking on enhanced cyber risk management standards that are intended to increase the operational resilience of large and interconnected entities under their supervision. If established, the enhanced cyber risk management standards would be designed to help reduce the potential impact of a cyber-attack or other cyber-related failure on the financial system. The advance notice of proposed rulemaking addresses five categories of cyber standards: (1) cyber risk governance; (2) cyber risk management; (3) internal dependency management; (4) external dependency management; and (5) incident response, cyber resilience, and situational awareness.
In March 2017, the NYSDFS implemented regulations requiring financial institutions regulated by the NYSDFS, including M&T Bank, to, among other things, (i) establish and maintain a cyber security program designed to ensure the confidentiality, integrity and availability of their information systems; (ii) implement and maintain a written cyber security policy setting forth policies and procedures for the protection of their information systems and nonpublic information; and (iii) designate a Chief Information Security Officer.
Many state regulators have been increasingly active in implementing privacy and cybersecurity standards and regulations, including implementing or modifying their data breach notification and

19
data privacy requirements. For example, the California Consumer Privacy Act became effective on January 1, 2020.
Consumer Protection Laws and the Consumer Financial Protection Bureau SupervisionIn connection with their respective lending and leasing activities, M&T Bank, Wilmington Trust, N.A. and certain of their subsidiaries, are each subject to a number of federal and state laws designed to protect borrowers and promote lending to various sectors of the economy. Such laws include: the Equal Credit Opportunity Act, the Fair Credit Reporting Act, the Fair and Accurate Credit Transactions Act, the Truth in Lending Act, the Home Mortgage Disclosure Act, the Electronic Fund Transfer Act, the Real Estate Settlement Procedures Act, the Servicemembers Civil Relief Act, and various state law counterparts. Furthermore, the CFPB has issued integrated disclosure requirements under the Truth in Lending Act and the Real Estate Settlement Procedures Act that relate to the provision of disclosures to borrowers. There are also consumer protection laws governing deposit taking activities (e.g. Truth in Savings Act), as well securities and insurance laws governing certain aspects of the Company’s consolidated operations.
The Dodd-Frank Act established the CFPB with broad powers to supervise and enforce most federal consumer protection laws. The CFPB has broad rule-making authority for a wide range of consumer protection laws that apply to all banks and savings institutions, including the authority to prohibit “unfair, deceptive or abusive” acts and practices. The CFPB has examination and enforcement authority over all banks and savings institutions with more than $10 billion in assets, including M&T Bank.
One of the important rules in governing deposits is the Electronic Fund Transfer Act which, among other things, prohibits financial institutions from charging consumers fees for paying overdrafts on automated teller machines (“ATM”) and one-time debit card transactions, unless a consumer consents, or opts in, to the overdraft service for those type of transactions. If a consumer does not opt in, any ATM transaction or one-time debit card transaction sent for approval that exceeds the customer’s available balance will be declined. Overdrafts on other types of transactions (e.g. checks, recurring debit card transactions and ACH transactions) are not covered by this rule. Before opting in, the consumer must be provided a notice that explains the financial institution’s overdraft services, including the fees associated with the service, and the consumer’s choices. Financial institutions must provide consumers who do not opt in with the same account terms, conditions and features (including pricing) that they provide to consumers who do opt in.
The CFPB has issued final rules that change the reporting requirements for lenders under the Home Mortgage Disclosure Act. The rules expand the range of transactions subject to the requirements to include most securitized residential mortgage loans and credit lines. The rules also increased the overall amount of data required to be collected and submitted, including additional data points about loans and borrowers.
In addition, the Dodd-Frank Act permits states to adopt consumer protection laws and standards that are more stringent than those adopted at the federal level and, in certain circumstances, permits state attorneys general to enforce compliance with both the state and federal laws and regulations.
Community Reinvestment ActThe CRA is intended to encourage depository institutions to help meet the credit needs of the communities in which they operate, including low- and moderate-income neighborhoods, consistent with safe and sound operations. CRA examinations are conducted by the federal agencies that are responsible for supervising depository institutions: the Federal Reserve, the FDIC and the OCC. A financial institution’s performance in helping to meet the credit needs of its community is evaluated in the context of information about the institution (capacity, constraints and business strategies), its community (demographic and economic data, lending, investment, and service opportunities), and its

20
competitors and peers. Upon completion of a CRA examination, an overall CRA Rating is assigned using a four-tiered rating system. These ratings are: “Outstanding,” “Satisfactory,” “Needs to Improve” and “Substantial Noncompliance.” The CRA evaluation is used in evaluating applications for future approval of bank activities including mergers, acquisitions, charters, branch openings and deposit facilities. M&T Bank has a current rating of “Outstanding.” M&T Bank is also subject to New York State CRA examination and is assessed using a 1 to 4 scoring system. M&T Bank currently has an “Outstanding” rating from the NYSDFS. Wilmington Trust, N.A. has been designated a special purpose trust company since March 3, 2016, and is therefore exempt from the requirements of the CRA. In April 2018, the U.S. Department of Treasury issued a memorandum to the federal banking regulators with recommended changes to the CRA’s implementing regulations to reduce their complexity and associated burden on banks. In December 2019, the OCC and FDIC issued a notice of proposed rulemaking intended to (i) clarify which activities qualify for CRA credit; (ii) update where activities count for CRA credit; (iii) create a more transparent and objective method for measuring CRA performance; and (iv) provide for more transparent, consistent, and timely CRA-related data collection, recordkeeping, and reporting. However, the Federal Reserve has not joined the proposed rulemaking. The Company will continue to evaluate the impact of any changes to the regulations implementing the CRA.
Bank Secrecy and Anti-Money LaunderingFederal laws and regulations impose obligations on U.S. financial institutions, including banks and broker/dealer subsidiaries, to implement and maintain appropriate policies, procedures and controls which are reasonably designed to prevent, detect and report instances of money laundering and the financing of terrorism and to verify the identity of their customers. In addition, these provisions require the federal financial institution regulatory agencies to consider the effectiveness of a financial institution’s anti-money laundering activities when reviewing bank mergers and BHC acquisitions. Failure of a financial institution to maintain and implement adequate programs to combat money laundering and terrorist financing could have serious legal and reputational consequences for the institution.
Financial Crimes Enforcement Network, which drafts regulations implementing the USA PATRIOT Act and other anti-money laundering and bank secrecy act legislation, has adopted rules that require financial institutions to obtain beneficial ownership information with respect to legal entities with which such institutions conduct business, subject to certain exclusions and exemptions. Bank regulators are focusing their examinations on anti-money laundering compliance, and M&T continues to monitor and augment, where necessary, its anti-money laundering compliance programs.
Office of Foreign Assets Control RegulationThe United States has imposed economic sanctions that affect transactions with designated foreign countries, nationals and others. These are typically known as the “OFAC” rules based on their administration by the U.S. Treasury Department Office of Foreign Assets Control (“OFAC”). The OFAC-administered sanctions targeting countries take many different forms. Generally, however, they contain one or more of the following elements: (i) restrictions on trade with or investment in a sanctioned country, including prohibitions against direct or indirect imports from and exports to a sanctioned country and prohibitions on “U.S. persons” engaging in financial transactions relating to making investments in, or providing investment-related advice or assistance to, a sanctioned country; and (ii) a blocking of assets in which the government or specially designated nationals of the sanctioned country have an interest, by prohibiting transfers of property subject to U.S. jurisdiction (including property in the possession or control of U.S. persons). Blocked assets (e.g. property and bank deposits) cannot be paid out, withdrawn, set off or transferred in any manner without a license

21
from OFAC. Failure to comply with these sanctions could have serious legal and reputational consequences.
Federal Reserve PoliciesThe earnings of the Company are significantly affected by the monetary and fiscal policies of governmental authorities, including the Federal Reserve. Among the instruments of monetary policy used by the Federal Reserve are open-market operations in U.S. Government securities and federal funds, changes in the discount rate on member bank borrowings and changes in reserve requirements against member bank deposits. These instruments of monetary policy are used in varying combinations to influence the overall level of bank loans, investments and deposits, and the interest rates charged on loans and paid for deposits. The Federal Reserve frequently uses these instruments of monetary policy, especially its open-market operations and the discount rate, to influence the level of interest rates and to affect the strength of the economy, the level of inflation or the price of the dollar in foreign exchange markets. The monetary policies of the Federal Reserve have had a significant effect on the operating results of banking institutions in the past and are expected to continue to do so in the future. It is not possible to predict the nature of future changes in monetary and fiscal policies or the effect which they may have on the Company’s business and earnings.
Corporate GovernanceM&T’s Corporate Governance Standards and the following corporate governance documents are also available on M&T’s website at the Investor Relations link: Disclosure and Regulation FD Policy; Executive Committee Charter; Nomination, Compensation and Governance Committee Charter; Audit Committee Charter; Risk Committee Charter; Financial Reporting and Disclosure Controls and Procedures Policy; Code of Ethics for CEO and Senior Financial Officers; Code of Business Conduct and Ethics; Employee Complaint Procedures for Accounting and Auditing Matters; and Excessive or Luxury Expenditures Policy. Copies of such governance documents are also available, free of charge, to any person who requests them. Such requests may be directed to M&T Bank Corporation, Shareholder Relations Department, One M&T Plaza, 8th Floor, Buffalo, NY 14203-2399 (Telephone: (716) 842-5138).
CompetitionThe Company competes in offering commercial and personal financial and wealth services with other banking institutions and thrifts and with firms in a number of other industries, such as credit unions, personal loan companies, sales finance companies, leasing companies, securities brokerage firms, mutual fund companies, hedge funds, wealth and investment advisory firms, insurance companies and other financial services-related entities. Furthermore, diversified financial services companies are able to offer a combination of these services to their customers on a nationwide basis. The Company’s operations are significantly impacted by state and federal regulations applicable to the banking industry. Moreover, provisions of the Gramm-Leach-Bliley Act of 1999, the Interstate Banking Act and state banking laws have allowed for increased competition among diversified financial services providers and e-commerce and other Internet-based companies.
Other InformationThrough a link on the Investor Relations section of M&T’s website at www.mtb.com, copies of M&T’s Annual Reports on Form 10-K, Quarterly Reports on Form 10-Q and Current Reports on Form 8-K, and amendments to those reports filed or furnished pursuant to Section 13(a) or 15(d) of the Exchange Act, are made available, free of charge, as soon as reasonably practicable after electronically filing such material with, or furnishing it to, the SEC. Copies of such reports and other information are also available at no charge to any person who requests them or at www.sec.gov. Such

22
requests may be directed to M&T Bank Corporation, Shareholder Relations Department, One M&T Plaza, 8th Floor, Buffalo, NY 14203-2399 (Telephone: (716) 842-5138).
Statistical Disclosure Pursuant to Guide 3See cross-reference sheet for disclosures incorporated elsewhere in this Annual Report on Form 10-K. Additional information is included in the following tables.

23
Table 1
SELECTED CONSOLIDATED YEAR-END BALANCES
2019 2018 2017 2016 2015 (In thousands)
Interest-bearing deposits at banks ........ $ 7,190,154 $ 8,105,197 $ 5,078,903 $ 5,000,638 $ 7,594,350 Federal funds sold ................................ 3,500 — — — — Trading account.................................... 470,129 185,584 132,909 323,867 273,783 Investment securities
U.S. Treasury and federal agencies........................................ 8,746,749 11,746,240 13,851,832 15,090,578 14,540,237 Obligations of states and political subdivisions ................................. 4,915 9,153 27,151 64,499 124,459 Other ............................................... 745,587 937,420 785,542 1,095,391 991,743
Total investment securities........ 9,497,251 12,692,813 14,664,525 16,250,468 15,656,439 Loans and leases
Commercial, financial, leasing, etc................................................. 23,987,897 23,136,913 21,900,258 22,770,629 20,576,737 Real estate — construction ............. 9,010,297 8,823,635 8,125,925 8,066,756 5,716,994 Real estate — mortgage.................. 42,816,450 42,816,858 44,965,038 48,134,198 49,841,156 Consumer ........................................ 15,373,881 13,956,086 13,251,665 12,130,094 11,584,347
Total loans and leases................ 91,188,525 88,733,492 88,242,886 91,101,677 87,719,234 Unearned discount .......................... (265,656) (267,015) (253,903) (248,261) (229,735)
Loans and leases, net of unearned discount................... 90,922,869 88,466,477 87,988,983 90,853,416 87,489,499
Allowance for credit losses............. (1,051,071) (1,019,444) (1,017,198) (988,997) (955,992)Loans and leases, net ................. 89,871,798 87,447,033 86,971,785 89,864,419 86,533,507
Goodwill............................................... 4,593,112 4,593,112 4,593,112 4,593,112 4,593,112 Core deposit and other intangible assets.................................................. 29,034 47,067 71,589 97,655 140,268 Real estate and other assets owned ...... 85,646 78,375 111,910 139,206 195,085 Total assets ........................................... 119,872,757 120,097,403 118,593,487 123,449,206 122,787,884 Noninterest-bearing deposits................ 32,396,407 32,256,668 33,975,180 32,813,896 29,110,635 Savings and interest-checking deposits.............................................. 54,932,162 50,963,744 51,698,008 52,346,207 49,566,644 Time deposits ....................................... 5,757,456 6,124,254 6,580,962 10,131,846 13,110,392 Deposits at Cayman Islands office ....... 1,684,044 811,906 177,996 201,927 170,170
Total deposits ............................ 94,770,069 90,156,572 92,432,146 95,493,876 91,957,841 Short-term borrowings ......................... 62,363 4,398,378 175,099 163,442 2,132,182 Long-term borrowings.......................... 6,986,186 8,444,914 8,141,430 9,493,835 10,653,858 Total liabilities...................................... 104,156,108 104,637,212 102,342,668 106,962,584 106,614,595 Shareholders’ equity............................. 15,716,649 15,460,191 16,250,819 16,486,622 16,173,289
Table 2
SHAREHOLDERS, EMPLOYEES AND OFFICES
Number at Year-End 2019 2018 2017 2016 2015
Shareholders..................................................................... 17,333 18,099 18,864 19,802 20,693 Employees........................................................................ 17,773 17,267 16,794 16,973 17,476 Offices.............................................................................. 771 794 833 855 863

24
Table 3
CONSOLIDATED EARNINGS
2019 2018 2017 2016 2015 (In thousands)
Interest income Loans and leases, including fees......................................... $4,442,182 $4,164,561 $3,742,867 $3,485,050 $ 2,778,151 Investment securities
Fully taxable ................................................................. 288,532 323,912 361,157 361,494 372,162 Exempt from federal taxes............................................ 321 665 1,431 2,606 4,263
Deposits at banks ................................................................ 141,397 108,182 61,326 45,516 15,252 Other ................................................................................... 7,161 1,391 1,014 1,205 1,016
Total interest income .................................................... 4,879,593 4,598,711 4,167,795 3,895,871 3,170,844 Interest expense Savings and interest-checking deposits .............................. 368,003 215,411 133,177 87,704 46,140 Time deposits...................................................................... 95,426 51,423 61,505 102,841 27,059 Deposits at Cayman Islands office...................................... 21,917 5,633 1,186 797 615 Short-term borrowings........................................................ 24,741 5,386 1,511 3,625 1,677 Long-term borrowings ........................................................ 239,242 248,556 189,372 231,017 252,766
Total interest expense ................................................... 749,329 526,409 386,751 425,984 328,257 Net interest income ........................................................... 4,130,264 4,072,302 3,781,044 3,469,887 2,842,587 Provision for credit losses................................................... 176,000 132,000 168,000 190,000 170,000 Net interest income after provision for credit losses .......... 3,954,264 3,940,302 3,613,044 3,279,887 2,672,587 Other income Mortgage banking revenues................................................ 457,770 360,442 363,827 373,697 375,738 Service charges on deposit accounts................................... 432,978 429,337 427,372 419,102 420,608 Trust income ....................................................................... 572,608 537,585 501,381 472,184 470,640 Brokerage services income ................................................. 48,922 51,069 61,445 63,423 64,770 Trading account and foreign exchange gains ..................... 62,044 32,547 35,301 41,126 30,577 Gain (loss) on bank investment securities .......................... 18,037 (6,301) 21,279 30,314 (130)Other revenues from operations.......................................... 469,320 451,321 440,538 426,150 462,834
Total other income........................................................ 2,061,679 1,856,000 1,851,143 1,825,996 1,825,037 Other expense Salaries and employee benefits........................................... 1,900,797 1,752,264 1,648,794 1,618,074 1,532,392 Equipment and net occupancy ............................................ 324,079 298,828 295,084 295,141 272,539 Outside data processing and software................................. 229,731 199,025 184,670 172,389 164,133 FDIC assessments ............................................................... 41,535 68,256 101,871 105,045 52,113 Advertising and marketing.................................................. 93,472 85,710 69,203 87,137 59,227 Printing, postage and supplies ............................................ 39,893 35,658 35,960 39,546 38,491 Amortization of core deposit and other intangible assets ... 19,490 24,522 31,366 42,613 26,424 Other costs of operations .................................................... 819,685 823,529 773,377 687,540 677,613
Total other expense....................................................... 3,468,682 3,288,062 3,140,325 3,047,485 2,822,932 Income before income taxes ............................................... 2,547,261 2,508,240 2,323,862 2,058,398 1,674,692 Income taxes ....................................................................... 618,112 590,160 915,556 743,284 595,025 Net income ......................................................................... $1,929,149 $1,918,080 $1,408,306 $1,315,114 $ 1,079,667
Dividends declared Common ....................................................................... $ 552,216 $ 510,458 $ 457,200 $ 441,765 $ 374,912 Preferred ....................................................................... 72,482 72,521 72,734 81,270 81,270

25
Table 4
COMMON SHAREHOLDER DATA
2019 2018 2017 2016 2015
Per share Net income
Basic .......................................................................... $ 13.76 $ 12.75 $ 8.72 $ 7.80 $ 7.22 Diluted ....................................................................... 13.75 12.74 8.70 7.78 7.18
Cash dividends declared.................................................. 4.10 3.55 3.00 2.80 2.80 Common shareholders’ equity at year-end...................... 110.78 102.69 100.03 97.64 93.60 Tangible common shareholders’ equity at year-end........................................................................ 75.44 69.28 69.08 67.85 64.28 Dividend payout ratio...................................................... 29.70% 27.66% 34.24% 35.81% 37.56%
Table 5
CHANGES IN INTEREST INCOME AND EXPENSE(a)
2019 Compared with 2018 2018 Compared with 2017
Resulting from
Changes in: Resulting from
Changes in:
Total
Change Volume Rate Total
Change Volume Rate (Increase (decrease) in thousands)
Interest income Loans and leases, including fees ....................... $278,610 101,577 177,033 $410,537 (61,159) 471,696 Deposits at banks .............................................. 33,215 24,193 9,022 46,856 398 46,458 Federal funds sold and agreements to resell securities......................................................... 5,484 5,487 (3) 17 16 1 Trading account................................................. 363 259 104 277 (246) 523 Investment securities
U.S. Treasury and federal agencies ............. (38,192) (51,898) 13,706 (36,903) (41,271) 4,368 Obligations of states and political subdivisions .............................................. (449) (433) (16) (1,204) (1,187) (17)Other ............................................................ 2,818 855 1,963 (1,337) (1,021) (316)Total interest income ................................... $281,849 $418,243
Interest expense Interest-bearing deposits
Savings and interest-checking deposits ....... $152,593 10,760 141,833 $ 82,234 (3,240) 85,474 Time deposits............................................... 44,003 2,525 41,478 (10,082) (17,490) 7,408 Deposits at Cayman Islands office .............. 16,284 15,529 755 4,447 2,133 2,314
Short-term borrowings ...................................... 19,355 16,135 3,220 3,875 1,314 2,561 Long-term borrowings ...................................... (9,314) (34,168) 24,854 59,184 12,996 46,188
Total interest expense .................................. $222,921 $139,658
(a) Interest income data are on a taxable-equivalent basis. The apportionment of changes resulting from the combined effect of both volume and rate was based on the separately determined volume and rate changes.
26
Item 1A. Risk Factors.
M&T and its subsidiaries could be adversely impacted by a number of risks and uncertainties that are difficult to predict. As a financial institution certain risk elements are inherent in the ordinary course of the Company’s business activities and adverse experience with those risks could have a material impact on the Company’s business, financial condition and results of operations, as well as on the values of the Company’s financial instruments and M&T’s common stock. The Company has developed a risk management process to identify, understand, mitigate and balance its exposure to significant risks. The following risk factors set forth some of the risks that could materially and adversely impact the Company, although there may be additional risks that are not presently material or known that may adversely affect the Company.
Market Risk
Weakness in the economy has adversely affected the Company in the past and may adversely affect the Company in the future.
Poor business and economic conditions in general or specifically in markets served by the Company could have adverse effects on the Company’s business including:
• A decrease in the demand for loans and other products and services offered by the Company.
• A decrease in net interest income derived from the Company’s lending and deposit gathering activities.
• A decrease in the value of the Company’s investment securities, loans held for sale or other assets secured by residential or commercial real estate.
• Other-than-temporary impairment of investment securities in the Company’s investment securities portfolio or other investments.
• A decrease in fees from the Company’s brokerage and trust businesses associated with declines or lack of growth in stock market prices.
• Potential higher FDIC assessments due to the DIF falling below minimum required levels.• An impairment of certain intangible assets, such as goodwill.• An increase in the number of customers and counterparties who become delinquent, file
for protection under bankruptcy laws or default on their loans or other obligations to the Company. An increase in the number of delinquencies, bankruptcies or defaults could result in higher levels of nonperforming assets, net charge-offs, provision for credit losses and valuation adjustments on loans held for sale.
The Company’s business and financial performance is impacted significantly by market interest rates and movements in those rates. The monetary, tax and other policies of governmental agencies, including the Federal Reserve, have a significant impact on interest rates and overall financial market performance over which the Company has no control and which the Company may not be able to anticipate adequately.
As a result of the high percentage of the Company’s assets and liabilities that are in the form of interest-bearing or interest-related instruments, changes in interest rates, in the shape of the yield curve or in spreads between different market interest rates, can have a material effect on the Company’s business and profitability and the value of the Company’s assets and liabilities. For example, changes in interest rates or interest rate spreads may:
• Affect the difference between the interest that the Company earns on assets and the

27
interest that the Company pays on liabilities, which impacts the Company’s overall net interest income and profitability.
• Adversely affect the ability of borrowers to meet obligations under variable or adjustable rate loans and other debt instruments, which, in turn, affects the Company’s loss rates on those assets.
• Decrease the demand for interest rate-based products and services, including loans and deposits.
• Affect the Company’s ability to hedge various forms of market and interest rate risk and may decrease the profitability or protection or increase the risk or cost associated with such hedges.
• Affect mortgage prepayment speeds and could result in the impairment of capitalized mortgage servicing assets, reduce the value of loans held for sale and increase the volatility of mortgage banking revenues, potentially adversely affecting the Company’s results of operations.
The monetary, tax and other policies of the government and its agencies, including the Federal Reserve, have a significant impact on interest rates and overall financial market performance. These governmental policies can thus affect the activities and results of operations of banking organizations such as the Company. An important function of the Federal Reserve is to regulate the national supply of bank credit and certain interest rates. The actions of the Federal Reserve influence the rates of interest that the Company charges on loans and that the Company pays on borrowings and interest-bearing deposits and can also affect the value of the Company’s on-balance sheet and off-balance sheet financial instruments. Also, due to the impact on rates for short-term funding, the Federal Reserve’s policies influence, to a significant extent, the Company’s cost of such funding.
In addition, the Company is routinely subject to examinations from various governmental taxing authorities. Such examinations may result in challenges to the tax return treatment applied by the Company to specific transactions. Management believes that the assumptions and judgment used to record tax-related assets or liabilities have been appropriate. Should tax laws change or the tax authorities determine that management’s assumptions were inappropriate, the result and adjustments required could have a material effect on the Company’s results of operations. M&T cannot predict the nature or timing of future changes in monetary, tax and other policies or the effect that they may have on the Company’s business activities, financial condition and results of operations.
The forecasted discontinuation of LIBOR and the emergence of one or more alternative benchmark indices to replace LIBOR could adversely impact the Company’s business and results of operations.
The Company’s floating-rate funding, certain hedging transactions and certain of the Company’s products, such as floating-rate loans and mortgages, determine the applicable interest rate or payment amount by reference to a benchmark rate, such as the London Interbank Offered Rate (“LIBOR”), or to an index, currency, basket or other financial metric. LIBOR and certain other benchmark rates are the subject of recent national, international, and other regulatory guidance and proposals for reform. In July 2017, the Chief Executive of the Financial Conduct Authority (“FCA”) announced that the FCA intends to stop persuading or compelling its panel banks to submit rates for the calculation of LIBOR after 2021. Consequently, at this time, it is not possible to predict whether and to what extent panel banks will continue to provide submissions for the calculation of LIBOR, such that the continuation of LIBOR on the current basis cannot and will not be guaranteed after 2021. Similarly, it is not possible to predict whether and for how long LIBOR will continue to be viewed as an acceptable market benchmark, what new or existing benchmark rate or rates may become accepted

28
alternatives to LIBOR, or what the effect of any such changes in industry views or alternatives may be on the markets for LIBOR-linked financial instruments.
Regulators and various financial industry groups have sponsored or formed committees (e.g., the Federal Reserve-sponsored Alternative Reference Rates Committee) to, among other things, facilitate the identification of an alternative benchmark index to replace LIBOR, and publish consultations on recommended practices for transitioning away from LIBOR, including (i) the utilization of recommended fallback language for LIBOR-linked financial instruments, and (ii) development of alternative pricing methodologies for recommended alternative benchmarks such as the Secured Overnight Financing Rate (“SOFR”). SOFR is a measure of the cost of borrowing cash overnight, collateralized by U.S. Treasury securities, and is based on directly observable U.S. Treasury-based repurchase transactions. At this time, it is still not possible to predict whether these recommendations and proposals will be broadly accepted in the market, whether they will continue to evolve, and what the effect of their implementation may be on the markets for floating-rate financial instruments.
The discontinuation of LIBOR or changes in market perceptions of the acceptability of LIBOR as a benchmark could result in changes to the Company’s risk exposures (for example, if the anticipated discontinuation of LIBOR adversely affects the availability or cost of floating-rate funding and, therefore, the Company’s exposure to fluctuations in interest rates) or otherwise result in losses on a product or having to pay more or receive less on securities that the Company has issued or owns. A substantial portion of the Company’s on- and off-balance sheet financial instruments (many of which have terms that extend beyond 2021) are indexed to LIBOR, including interest rate swap agreements and other contracts used for hedging and trading account purposes, loans to commercial customers and consumers (including mortgage loans and other loans), and long-term borrowings. In addition, such uncertainty could result in pricing volatility and increased capital requirements, loss of market share in certain products, adverse tax or accounting impacts, and compliance, legal and operational costs and risks.
The Company established an enterprise-wide LIBOR transition program in 2019. An impact assessment has been completed to identify on- and off-balance sheet exposures, systems, processes, models, customers, and employees affected by the discontinuation of LIBOR. The Company continues to develop and execute plans to transition products associated with LIBOR to alternative reference rates.
The Company’s business and performance is vulnerable to the impact of volatility in debt and equity markets.
As most of the Company’s assets and liabilities are financial in nature, the Company’s performance is sensitive to the performance of the financial markets. Turmoil and volatility in U.S. and global financial markets can be a major contributory factor to overall weak economic conditions, leading to some of the risks discussed herein, including the impaired ability of borrowers and other counterparties to meet obligations to the Company. Financial market volatility may:
• Affect the value or liquidity of the Company’s on-balance sheet and off-balance sheet financial instruments.
• Affect the value of capitalized servicing assets.• Affect M&T’s ability to access capital markets to raise funds. Inability to access capital
markets if needed, at cost effective rates, could adversely affect the Company’s liquidity and results of operations.
29
• Affect the value of the assets that the Company manages or otherwise administers or services for others. Although the Company is not directly impacted by changes in the value of such assets, decreases in the value of those assets would affect related fee income and could result in decreased demand for the Company’s services.
• Impact the nature, profitability or risk profile of the financial transactions in which the Company engages.
Volatility in the markets for real estate and other assets commonly securing financial products has been and may continue to be a significant contributor to overall volatility in financial markets. In addition, unfavorable or uncertain economic and market conditions can be caused by the imposition of tariffs or other limitations on international trade and travel, which can result in market volatility, negatively impact client activity, and adversely affect the Company’s financial condition and results of operations.
The Company’s regional concentrations expose it to adverse economic conditions in its primary retail banking office footprint.
The Company’s core banking business is largely concentrated within the Company’s retail banking office network footprint, located principally in New York, Maryland, New Jersey, Pennsylvania, Delaware, Connecticut, Virginia, West Virginia and the District of Columbia. Therefore, the Company is, or in the future may be, particularly vulnerable to adverse changes in economic conditions in the Northeast and Mid-Atlantic regions.
Risks Relating to Compliance and the Regulatory Environment
The Company is subject to extensive government regulation and supervision and this regulatory environment can be and has been significantly impacted by financial regulatory reform initiatives.
The Company is subject to extensive federal and state regulation and supervision. Banking regulations are primarily intended to protect depositors’ funds, federal deposit insurance funds and the financial system as a whole, not stockholders. These regulations and supervisory guidance affect the Company’s lending practices, capital structure, amounts of capital, investment practices, dividend policy, growth and expansionary activity, among other things. Failure to comply with laws, regulations, policies or supervisory guidance could result in civil or criminal penalties, including monetary penalties, the loss of FDIC insurance, the revocation of a banking charter, other sanctions by regulatory agencies, and/or reputation damage, which could have a material adverse effect on the Company’s business, financial condition and results of operations. In this regard, government authorities, including the bank regulatory agencies, can pursue aggressive enforcement actions with respect to compliance and other legal matters involving financial activities, which heightens the risks associated with actual and perceived compliance failures and may also adversely affect the Company’s ability to enter into certain transactions or engage in certain activities, or obtain necessary regulatory approvals in connection therewith. In general, the amounts paid by financial institutions in settlement of proceedings or investigations have increased substantially and are likely to remain elevated. In some cases, governmental authorities have required criminal pleas or other extraordinary terms as part of such settlements, which could have significant collateral consequences for a financial institution, including loss of customers, restrictions on the ability to access the capital markets, and the inability to operate certain businesses or offer certain products for a period of time. In addition, enforcement matters could impact the Company’s supervisory and CRA ratings, which may in turn restrict or limit the Company’s activities.

30
Any new regulatory requirements or changes to existing requirements could require changes to the Company’s businesses, result in increased compliance costs and affect the profitability of such businesses. Additionally, such activity could affect the behaviors of third parties with which the Company deals in the ordinary course of business, such as rating agencies, insurance companies and investors. Heightened regulatory practices, requirements or expectations could affect the Company in substantial and unpredictable ways, and, in turn, could have a material adverse effect on the Company’s business, financial condition and results of operations.
There have been significant revisions to the laws and regulations applicable to the Company that have been enacted or proposed in recent months. These and other rules to implement the changes have yet to be finalized, and the final timing, scope and impact of these changes to the regulatory framework applicable to financial institutions remain uncertain. For more information on the regulations to which the Company is subject and recent initiatives to reform financial institution regulation, see Part I, Item 1 — Business in this report.
M&T may be subject to more stringent capital and liquidity requirements.
Bank holding companies, including M&T, are subject to capital and liquidity standards imposed as a result of the Dodd-Frank Act (as amended by EGRRCPA) and the U.S. Basel III-based capital rules. For additional information, see “Capital Requirements” under Part I, Item 1 — Business.
From time to time, regulators may implement changes to these regulatory capital adequacy and liquidity requirements. If the Company fails to meet these minimum capital adequacy and liquidity guidelines and other regulatory requirements, its business activities, including lending, and its ability to expand, either organically or through acquisitions, could be limited. It could also result in M&T being required to take steps to increase its regulatory capital that may be dilutive to shareholders or limit its ability to pay dividends or otherwise return capital to shareholders, or sell or refrain from acquiring assets. In addition, the liquidity-related provisions of the Federal Reserve’s liquidity-related enhanced prudential supervision requirements may reduce the Company’s ability to invest in other longer-term assets even if deemed more desirable from a balance sheet management perspective.
EGRRCPA, the Tailoring Rules and other recent rulemaking have in some cases reduced the capital or liquidity requirements applicable to M&T (e.g., the Company is no longer subject to any LCR requirement, and the same is expected to be true for any finalized NSFR). However, Basel IV significantly revises the Basel capital framework, and the impact on the Company will depend on the manner in which the revisions are implemented in the U.S. with respect to firms such as M&T.
M&T’s ability to return capital to shareholders and to pay dividends on common stock may be adversely affected by market and other factors outside of its control and will depend, in part, on a review of its capital plan by the Federal Reserve.
Any decision by M&T to return capital to shareholders, whether through a common stock dividend or through a common stock share repurchase program, requires the approval of M&T’s Board of Directors and depends in large part on receiving regulatory approval, including through the Federal Reserve’s CCAR process and the supervisory stress tests required under the Dodd-Frank Act whereby M&T’s financial position is tested under assumed severely adverse economic conditions. Prior to the public disclosure of a BHC’s CCAR results, the Federal Reserve will provide the BHC with the results of its supervisory stress test and will offer a one-time opportunity for the BHC to reduce planned capital distributions through the submission of a revised capital plan. The Federal Reserve may object to any capital plan in which a BHC’s regulatory capital ratios inclusive of adjustments to planned capital distributions, if any, would not meet the minimum requirements

31
throughout a nine-quarter period under severely adverse stress conditions. If the Federal Reserve objects to M&T’s capital plan, it could impose restrictions on M&T’s ability to return capital to shareholders, including through paying dividends, entering into acquisitions or repurchasing its common stock, which in turn could negatively impact market and investor perceptions of M&T. M&T cannot be certain that the Federal Reserve will not object to future capital plans.
In addition, Federal Reserve capital planning and stress testing rules generally limit a BHC’s ability to make quarterly capital distributions – dividends and common stock share repurchases – if the amount of actual cumulative quarterly capital issuances of instruments that qualify as regulatory capital are less than the BHC had indicated in its submitted capital plan as to which it received a non-objection from the Federal Reserve. As such, M&T’s ability to declare and pay dividends on its common stock, as well as the amount of such dividends, will depend, in part, on its ability to issue stock in accordance with its capital plan or to otherwise remain in compliance with its capital plan, which may be adversely affected by market and other factors outside of M&T’s control.
If an orderly liquidation of a systemically important BHC or non-bank financial company were triggered, M&T could face assessments for the Orderly Liquidation Fund (“OLF”).
The Dodd-Frank Act created a mechanism, the OLF, for liquidation of systemically important bank holding companies and non-bank financial companies. The OLF is administered by the FDIC and is based on the FDIC’s bank resolution model. The Secretary of the U.S. Treasury may trigger a liquidation under this authority after consultation with the President of the U.S. and after receiving a recommendation from the boards of the FDIC and the Federal Reserve upon a two-thirds vote. Liquidation proceedings will be funded by the OLF, which will borrow from the U.S. Treasury and impose risk-based assessments on covered financial companies. Risk-based assessments would be first made on entities that received more in the resolution than they would have received in the liquidation to the extent of such excess, and second, if necessary, on, among others, bank holding companies with total consolidated assets of $50 billion or more, such as M&T. Any such assessments may adversely affect the Company’s business, financial condition or results of operations.
Credit Risk
Deteriorating credit quality could adversely impact the Company.
As a lender, the Company is exposed to the risk that customers will be unable to repay their loans in accordance with the terms of the agreements, and that any collateral securing the loans may be insufficient to assure full repayment. Credit losses are inherent in the business of making loans.
Factors that influence the Company’s credit loss experience include overall economic conditions affecting businesses and consumers, generally, but also residential and commercial real estate valuations, in particular, given the size of the Company’s real estate loan portfolios. Factors that can influence the Company’s credit loss experience include: (i) the impact of residential real estate values on loans to residential real estate builders and developers and other loans secured by residential real estate; (ii) the concentrations of commercial real estate loans in the Company’s loan portfolio; (iii) the amount of commercial and industrial loans to businesses in areas of New York State outside of the New York City area and in central Pennsylvania that have historically experienced less economic growth and vitality than many other regions of the country; (iv) the repayment performance associated with first and second lien loans secured by residential real estate; and (v) the size of the Company’s portfolio of loans to individual consumers, which historically have experienced higher net charge-offs as a percentage of loans outstanding than loans to other types of borrowers.

32
Commercial real estate valuations can be highly subjective as they are based upon many assumptions. Such valuations can be significantly affected over relatively short periods of time by changes in business climate, economic conditions, interest rates and, in many cases, the results of operations of businesses and other occupants of the real property. Similarly, residential real estate valuations can be impacted by housing trends, the availability of financing at reasonable interest rates, governmental policy regarding housing and housing finance, and general economic conditions affecting consumers.
The Company maintains an allowance for credit losses which represents, in management’s judgment, the amount of losses inherent in the loan and lease portfolio. The allowance is determined by management’s evaluation of the loan and lease portfolio based on such factors as the differing economic risks associated with each loan category, the current financial condition of specific borrowers, the economic environment in which borrowers operate, the level of delinquent loans, the value of any collateral and, where applicable, the existence of any guarantees or indemnifications. Management believes that the allowance for credit losses as of December 31, 2019 appropriately reflects incurred credit losses inherent in the loan and lease portfolio. However, there is no assurance that the allowance is sufficient to cover such credit losses.
The Company may be adversely affected by the soundness of other financial institutions.
Financial services institutions are interrelated as a result of trading, clearing, counterparty, or other relationships. The Company has exposure to many different industries and counterparties, and routinely executes transactions with counterparties in the financial services industry, including commercial banks, brokers and dealers, investment banks, and other institutional clients. Many of these transactions expose the Company to credit risk in the event of a default by a counterparty or client. In addition, the Company’s credit risk may be exacerbated when the collateral held by the Company cannot be realized or is liquidated at prices not sufficient to recover the full amount of the credit or derivative exposure due to the Company. Any resulting losses could have a material adverse effect on the Company’s financial condition and results of operations.
Liquidity Risk
The Company must maintain adequate sources of funding and liquidity.
The Company must maintain adequate funding sources in the normal course of business to support its operations and fund outstanding liabilities, as well as meet regulatory expectations. The Company primarily relies on deposits to be a low cost and stable source of funding for the loans it makes and the operations of its business. Core customer deposits, which include noninterest-bearing deposits, interest-bearing transaction accounts, savings deposits and time deposits of $250,000 or less, have historically provided the Company with a sizeable source of relatively stable and low-cost funds. In addition to customer deposits, sources of liquidity include borrowings from third party banks, securities dealers, various Federal Home Loan Banks and the Federal Reserve Bank of New York.
The Company’s liquidity and ability to fund and operate the business could be materially adversely affected by a variety of conditions and factors, including financial and credit market disruptions and volatility or a lack of market or customer confidence in financial markets in general, which may result in a loss of customer deposits or outflows of cash or collateral and/or ability to access capital markets on favorable terms. Negative news about the Company or the financial services industry generally may reduce market or customer confidence in the Company, which could in turn materially adversely affect the Company’s liquidity and funding. Such reputational damage may result in the loss of customer deposits, the inability to sell or securitize loans or other assets, and downgrades in one or more of the Company’s credit ratings, and may also negatively affect the
33
Company’s ability to access the capital markets. A downgrade in the Company’s credit ratings, which could result from general industry-wide or regulatory factors not solely related to the Company, could adversely affect the Company’s ability to borrow funds, including by raising the cost of borrowings substantially, and could cause creditors and business counterparties to raise collateral requirements or take other actions that could adversely affect M&T’s ability to raise capital. Many of the above conditions and factors may be caused by events over which M&T has little or no control. There can be no assurance that significant disruption and volatility in the financial markets will not occur in the future.
If the Company is unable to continue to fund assets through customer bank deposits or access funding sources on favorable terms or if the Company suffers an increase in borrowing costs or otherwise fails to manage liquidity effectively, the Company’s liquidity, operating margins, financial condition and results of operations may be materially adversely affected.
M&T relies on dividends from its subsidiaries for its liquidity.
M&T is a separate and distinct legal entity from its subsidiaries. M&T typically receives substantially all of its revenue from subsidiary dividends. These dividends are M&T’s principal source of funds to pay dividends on common and preferred stock, pay interest and principal on its debt, and fund purchases of its common stock. Various federal and/or state laws and regulations, as well as regulatory expectations, limit the amount of dividends that M&T’s banking subsidiaries and certain non-bank subsidiaries may pay. Regulatory scrutiny of capital levels at bank holding companies and insured depository institution subsidiaries has increased in recent years and has resulted in increased regulatory focus on all aspects of capital planning, including dividends and other distributions to shareholders of banks, such as parent bank holding companies. See Item 1 — Business, Distributions” for a discussion of regulatory and other restrictions on dividend declarations. Also, M&T’s right to participate in a distribution of assets upon a subsidiary’s liquidation or reorganization is subject to the prior claims of that subsidiary’s creditors. Limitations on M&T’s ability to receive dividends from its subsidiaries could have a material adverse effect on its liquidity and ability to pay dividends on its stock or interest and principal on its debt, and ability to fund purchases of its common stock.
Strategic Risk
The financial services industry is highly competitive and creates competitive pressures that could adversely affect the Company’s revenue and profitability.
The financial services industry in which the Company operates is highly competitive. The Company competes not only with commercial and other banks and thrifts, but also with insurance companies, mutual funds, hedge funds, securities brokerage firms and other companies offering financial services in the U.S., globally and over the Internet. Some of the Company’s non-bank competitors are not subject to the same extensive regulations the Company is, and may have greater flexibility in competing for business. In particular, the activity and prominence of so-called marketplace lenders and other technological financial services companies has grown significantly in recent years and is expected to continue growing. The Company competes on the basis of several factors, including capital, access to capital, revenue generation, products, services, transaction execution, innovation, reputation and price. Over time, certain sectors of the financial services industry have become more concentrated, as institutions involved in a broad range of financial services have been acquired by or merged into other firms. These developments could result in the Company’s competitors gaining greater capital and other resources, such as a broader range of products and services and geographic

34
diversity. The Company may experience pricing pressures as a result of these factors and as some of its competitors seek to increase market share by reducing prices or paying higher rates of interest on deposits.
Finally, technological change is influencing how individuals and firms conduct their financial affairs and is changing the delivery channels for financial services. Financial technology providers, who invest substantial resources in developing and designing new technology (in particular digital and mobile technology), are beginning to offer more traditional banking products (either directly or through bank partnerships) and may in the future be able to provide additional services by obtaining a bank-like charter, such as the OCC’s fintech charter. As a result, the Company may have to contend with a broader range of competitors including many that are not located within the geographic footprint of its banking office network. Further, along with other participants in the financial services industry, the Company frequently attempts to introduce new technology-driven products and services that are aimed at allowing the Company to better serve customers and to reduce costs. The Company may not be able to effectively implement new technology-driven products and services that allow it to remain competitive or be successful in marketing these products and services to its customers.
Difficulties in combining the operations of acquired entities with the Company’s own operations may prevent M&T from achieving the expected benefits from its acquisitions.
M&T has expanded its business through past acquisitions and may do so in the future. Inherent uncertainties exist when integrating the operations of an acquired entity. Acquiring other entities involves potential risks that could have a material adverse impact on the Company’s business, financial condition and results of operations, including:
• Inability to fully achieve the Company’s strategic objectives and planned operating efficiencies in an acquisition.
• Issues arising during transition and integration.• Disruption of the Company’s business and diversion of management’s time and attention.• Exposure to unknown or contingent liabilities of acquired institutions.• Loss of key employees and customers of acquired institutions.• Dilution in the ownership percentage of holders of M&T common stock.• Payment of a premium over book and market values that may dilute the Company’s
tangible book value and earnings per common share in the short and long-term.• Inability to realize the expected benefits of the acquisition due to lower financial results
pertaining to the acquired entity (for example, the Company could experience higher credit losses, incur higher operating expenses or realize less revenue than originally anticipated related to an acquired entity).
• Changes in banking or tax laws or regulations that could impair or eliminate the expected benefits of merger and acquisition activities.

35
Operational Risk
The Company is subject to operational risk which could adversely affect the Company’s business and reputation and create material legal and financial exposure.
Like all businesses, the Company is subject to operational risk, which represents the risk of loss resulting from human error, inadequate or failed internal processes and systems, and external events. Operational risk also encompasses reputational risk and compliance and legal risk, which is the risk of loss from violations of, or noncompliance with, laws, rules, regulations, prescribed practices or ethical standards, as well as the risk of noncompliance with contractual and other obligations. The Company is also exposed to operational risk through outsourcing arrangements, and the effect that changes in circumstances or capabilities of its outsourcing vendors can have on the Company’s ability to continue to perform operational functions necessary to its business. Although the Company seeks to mitigate operational risk through a system of internal controls that are reviewed and updated, no system of controls, however well designed and maintained, is infallible. Control weaknesses or failures or other operational risks could result in charges, increased operational costs, harm to the Company’s reputation or foregone business opportunities.
M&T could suffer if it fails to attract and retain skilled personnel.
M&T’s success depends, in large part, on its ability to attract and retain key individuals and to have a diverse workforce. Competition for qualified and diverse candidates in the activities in which the Company engages and markets that the Company serves is significant, and the Company may not be able to hire candidates and retain them. Growth in the Company’s business, including through acquisitions, may increase its need for additional qualified personnel. The Company is increasingly competing for personnel with financial technology providers and other less regulated entities who may not have the same limitations on compensation as the Company does. If the Company is not able to hire or retain highly skilled and qualified individuals, it may be unable to execute its business strategies and may suffer adverse consequences to its business, financial condition and results of operations.
The Company’s compensation practices are subject to review and oversight by the Federal Reserve, the OCC, the FDIC and other regulators. The federal banking agencies have issued joint guidance on executive compensation designed to help ensure that a banking organization’s incentive compensation policies do not encourage imprudent risk taking and are consistent with the safety and soundness of the organization. In addition, the Dodd-Frank Act required those agencies, along with the SEC, to adopt rules to require reporting of incentive compensation and to prohibit certain compensation arrangements. If as a result of complying with such rules the Company is unable to attract and retain qualified employees, or do so at rates necessary to maintain its competitive position, or if the compensation costs required to attract and retain employees become more significant, the Company’s performance, including its competitive position, could be materially adversely affected.
The Company’s information systems may experience interruptions or breaches in security.
The Company relies heavily on communications and information systems, including those of third-party service providers, to conduct its business. Any failure, interruption or breach in security of these systems could result in disruptions to its accounting, deposit, loan and other systems, and adversely affect the Company’s customer relationships. While the Company has policies and procedures designed to prevent or limit the effect of these possible events, there can be no assurance that any such failure, interruption or security breach will not occur or, if any does occur, that it can be sufficiently or timely remediated.

36
Information security risks for large financial institutions such as M&T have increased significantly in recent years in part because of the proliferation of new technologies, such as Internet and mobile banking to conduct financial transactions, and the increased sophistication and activities of organized crime, hackers, terrorists, nation-states, activists and other external parties. There have been increasing efforts on the part of third parties, including through cyber attacks, to breach data security at financial institutions or with respect to financial transactions. There have been several instances involving financial services and consumer-based companies reporting unauthorized access to and disclosure of client or customer information or the destruction or theft of corporate data, including by executive impersonation and third party vendors. There have also been several highly publicized cases where hackers have requested “ransom” payments in exchange for not disclosing customer information.
As cyber threats continue to evolve, the Company may be required to expend significant additional resources to continue to modify or enhance its layers of defense or to investigate and remediate any information security vulnerabilities. The techniques used by cyber criminals change frequently, may not be recognized until launched and can be initiated by a variety of actors, including terrorist organizations and hostile foreign governments. These techniques may include attempts to fraudulently induce employees, customers or others to disclose sensitive information in order to gain access to data or systems. These risks may increase as the use of mobile payment and other Internet-based applications expands.
Further, third parties with which the Company does business, as well as vendors and other third parties with which the Company’s customers do business, can also be sources of information security risk to the Company, particularly where activities of customers are beyond the Company’s security and control systems, such as through the use of the Internet, personal computers, tablets, smart phones and other mobile services. Security breaches affecting the Company’s customers, or systems breakdowns or failures, security breaches or employee misconduct affecting such other third parties, may require the Company to take steps to protect the integrity of its own systems or to safeguard confidential information of the Company or its customers, thereby increasing the Company’s operational costs and adversely affecting its business.
The occurrence of any failure, interruption or security breach of the Company’s systems or those of third-party service providers (or, in turn, providers to such third-party providers), particularly if widespread or resulting in financial losses to customers, could damage the Company’s reputation, result in a loss of customer business, subject the Company to additional regulatory scrutiny and potential sanctions, or expose it to civil litigation and financial liability.
The Company is also subject to laws and regulations relating to the privacy of the information of clients, employees or others, and any failure to comply with these laws and regulations could expose the Company to liability and/or reputational damage. As new privacy-related laws and regulations, such as the cybersecurity regulation of the NYSDFS, are implemented, the time and resources needed for the Company to comply with such laws and regulations, as well as its potential liability for non-compliance and reporting obligations in the case of data breaches, may significantly increase. In addition, the Company is increasingly subject to laws and regulations relating to privacy, surveillance, encryption and data use in the jurisdictions in which it operates. Compliance with these laws and regulations may require changes to policies, procedures and technology for information security and segregation of data, which could, among other things, make the Company more vulnerable to operational failures, and to monetary penalties for breach of such laws and regulations.
M&T relies on other companies to provide key components of the Company’s business infrastructure.
Third parties provide key components of the Company’s business infrastructure such as banking services, processing, and Internet connections and network access. Any disruption in such services provided by these third parties or any failure of these third parties to handle current or higher
37
volumes of use could adversely affect the Company’s ability to deliver products and services to clients and otherwise to conduct business. Technological or financial difficulties of a third party service provider could adversely affect the Company’s business to the extent those difficulties result in the interruption or discontinuation of services provided by that party. The Company may not be insured against all types of losses as a result of third party failures and insurance coverage may be inadequate to cover all losses resulting from system failures or other disruptions. Failures in the Company’s business infrastructure could interrupt the operations or increase the costs of doing business.
Additionally, the Company is exposed to the risk that a service disruption at a common service provider to our third-party service providers could impede their ability to provide services to the Company. Notwithstanding any attempts to diversify its reliance on third parties, the Company may not be able to effectively mitigate operational risks relating to its vendors’ use of common service providers.
The Company is or may become involved from time to time in suits, legal proceedings, information-gathering requests, investigations and proceedings by governmental and self-regulatory agencies that may lead to adverse consequences.
Many aspects of the Company’s business and operations involve substantial risk of legal liability. M&T and/or its subsidiaries have been named or threatened to be named as defendants in various lawsuits arising from its or its subsidiaries’ business activities (and in some cases from the activities of companies M&T has acquired). In addition, from time to time, M&T is, or may become, the subject of governmental and self-regulatory agency information-gathering requests, reviews, investigations and proceedings and other forms of regulatory inquiry, including by bank and other regulatory agencies, the SEC and law enforcement authorities. The SEC has announced a policy of seeking admissions of liability in certain settled cases, which could adversely impact the defense of private litigation. M&T is also at risk when it has agreed to indemnify others for losses related to legal proceedings, including for litigation and governmental investigations and inquiries, such as in connection with the purchase or sale of a business or assets. The results of such proceedings could lead to significant civil or criminal penalties, including monetary penalties, damages, adverse judgments, settlements, fines, injunctions, restrictions on the way in which the Company conducts its business, or reputational harm.
Although the Company establishes accruals for legal proceedings when information related to the loss contingencies represented by those matters indicates both that a loss is probable and that the amount of loss can be reasonably estimated, the Company does not have accruals for all legal proceedings where it faces a risk of loss. In addition, due to the inherent subjectivity of the assessments and unpredictability of the outcome of legal proceedings, amounts accrued may not represent the ultimate loss to the Company from the legal proceedings in question. Thus, the Company’s ultimate losses may be higher, and possibly significantly so, than the amounts accrued for legal loss contingencies, which could adversely affect the Company’s financial condition and results of operations.
Business Risk
Changes in accounting standards could impact the Company’s financial condition and results of operations.
The accounting standard setters, including the Financial Accounting Standards Board (“FASB”), the SEC and other regulatory bodies, periodically change the financial accounting and reporting
38
standards that govern the preparation of the Company’s consolidated financial statements. These changes can be difficult to predict and can materially impact how the Company records and reports its financial condition and results of operations. For example, Accounting Standards Update 2016-13, Measurement of Credit Losses on Financial Instruments, became effective January 1, 2020, and substantially changes the accounting for credit losses on loans and other financial assets. The adoption of the standard has resulted in an increase in the allowance for credit losses of approximately $132 million. In some cases, the Company could be required to apply a new or revised standard retroactively, which would result in the restating of the Company’s prior period financial statements. Information about recently adopted and not as yet adopted accounting standards is included in note 26 of Notes to Financial Statements included in Part II, Item 8 — Financial Statements and Supplemental Data of this Form 10-K.
The Company’s reported financial condition and results of operations depend on management’s selection of accounting methods and require management to make estimates about matters that are uncertain.
Accounting policies and processes are fundamental to the Company’s reported financial condition and results of operations. Some of these policies require use of estimates and assumptions that may affect the reported amounts of assets or liabilities and financial results. Several of M&T’s accounting policies are critical because they require management to make difficult, subjective and complex judgments about matters that are inherently uncertain and because it is likely that materially different amounts would be reported under different conditions or using different assumptions. Pursuant to generally accepted accounting principles, management is required to make certain assumptions and estimates in preparing the Company’s financial statements. If assumptions or estimates underlying the Company’s financial statements are incorrect, the Company may experience material losses.
Management has identified certain accounting policies as being critical because they require management’s judgment to ascertain the valuations of assets, liabilities, commitments and contingencies. A variety of factors could affect the ultimate value that is obtained either when earning income, recognizing an expense, recovering an asset, valuing an asset or liability, or recognizing or reducing a liability. M&T has established detailed policies and control procedures that are intended to ensure these critical accounting estimates and judgments are well controlled and applied consistently. In addition, the policies and procedures are intended to ensure that the process for changing methodologies occurs in an appropriate manner. Because of the uncertainty surrounding judgments and the estimates pertaining to these matters, M&T could be required to adjust accounting policies or restate prior period financial statements if those judgments and estimates prove to be incorrect. For additional information, see Part II, Item 7 — Management’s Discussion and Analysis of Financial Condition and Results of Operations, “Critical Accounting Estimates” and Note 1, “Significant Accounting Policies,” of Notes to Financial Statements in Part II, Item 8.
The Company’s models used for business planning purposes could perform poorly or provide inadequate information.
The Company uses quantitative models to assist in measuring risks and estimating or predicting certain financial values. The models used may not accurately account for all variables and may fail to predict outcomes accurately and/or may overstate or understate certain effects. Poorly designed, implemented, or managed models present the risk that the Company’s business decisions that consider information based on such models will be adversely affected due to inadequate or inaccurate information, which may damage the Company’s reputation and adversely affect its reported financial condition and results of operations. As a result, the Company may not adequately prepare for future

39
events and may suffer losses due to these failures. Also, information the Company provides to the public or to its regulators based on poorly designed, implemented, or managed models could be inaccurate or misleading. Decisions that regulators make, including those related to capital distributions to stockholders, could be affected adversely due to the perception that the quality of the models used to generate the relevant information is insufficient.
The Company is exposed to reputational risk.
A negative public opinion of the Company and its business can result from any number of activities, including the Company’s lending practices, corporate governance and regulatory compliance, acquisitions and actions taken by regulators or by community organizations in response to these activities. Significant harm to the Company’s reputation could also arise as a result of regulatory or governmental actions, litigation, employee misconduct or the activities of customers, other participants in the financial services industry or the Company’s contractual counterparties, such as service providers and vendors. In particular, a cyber security event impacting the Company’s or its customers’ data could have a negative impact on the Company’s reputation and customer confidence in the Company and its cyber security. Damage to the Company’s reputation could also adversely affect its credit ratings and access to the capital markets.
Additionally, whereas negative public opinion once was primarily driven by adverse news coverage in traditional media, the increased use of social media platforms facilitates the rapid dissemination of information or misinformation, which magnifies the potential harm to the Company’s reputation.
Severe weather, natural disasters, acts of war or terrorism and other external events could significantly impact the Company’s business.
Severe weather, natural disasters, acts of war or terrorism and other adverse external events could have a significant impact on the Company’s ability to conduct business. Such events could affect the stability of the Company’s deposit base, impair the ability of borrowers to repay outstanding loans, impair the value of collateral securing loans, cause significant property damage, result in loss of revenue and/or cause the Company to incur additional expenses. Although the Company has established disaster recovery plans and procedures, and monitors for significant environmental effects on its properties or its investments, the occurrence of any such event could have a material adverse effect on the Company.
Discussions of the specific risks outlined above and other risks facing the Company are included within this Annual Report on Form 10-K in Part I, Item 1 “Business,” and Part II, Item 7 “Management’s Discussion and Analysis of Financial Condition and Results of Operations.” Furthermore, in Part II, Item 7 under the heading “Forward-Looking Statements” is included a description of certain risks, uncertainties and assumptions identified by management that are difficult to predict and that could materially affect the Company’s financial condition and results of operations, as well as the value of the Company’s financial instruments in general, and M&T common stock, in particular.
In addition, the market price of M&T common stock may fluctuate significantly in response to a number of other factors, including changes in securities analysts’ estimates of financial performance, volatility of stock market prices and volumes, rumors or erroneous information, changes in market valuations of similar companies and changes in accounting policies or procedures as may be required by the FASB or other regulatory agencies.

40
Item 1B. Unresolved Staff Comments.
None.
Item 2. Properties.
Both M&T and M&T Bank maintain their executive offices at One M&T Plaza in Buffalo, New York. This twenty-one story headquarters building, containing approximately 300,000 rentable square feet of space, is owned in fee by M&T Bank and was completed in 1967. M&T, M&T Bank and their subsidiaries occupy approximately 98% of the building and the remainder is leased to non-affiliated tenants. At December 31, 2019, the cost of this property (including improvements subsequent to the initial construction), net of accumulated depreciation, was $11.0 million.
M&T Bank owns and occupies an additional facility in Buffalo, New York (known as M&T Center) with approximately 395,000 rentable square feet of space. At December 31, 2019, the cost of this building (including improvements subsequent to acquisition), net of accumulated depreciation, was $14.0 million.
M&T Bank also owns and occupies three separate facilities in the Buffalo area which support certain back-office and operations functions of the Company. The total square footage of these facilities approximates 290,000 square feet and their combined cost (including improvements subsequent to acquisition), net of accumulated depreciation, was $27.3 million at December 31, 2019.
M&T Bank owns a facility in Syracuse, New York with approximately 160,000 rentable square feet of space. Approximately 39% of that facility is occupied by M&T Bank. At December 31, 2019, the cost of that building (including improvements subsequent to acquisition), net of accumulated depreciation, was less than $1 million. In January 2020, M&T Bank agreed to sell this facility with an expected closing date in the second quarter of 2020.
M&T Bank owns facilities in Wilmington, Delaware, with approximately 340,000 (known as Wilmington Center) and 295,000 (known as Wilmington Plaza) rentable square feet of space, respectively. M&T Bank occupies approximately 88% of Wilmington Center and 8% of Wilmington Plaza. At December 31, 2019, the cost of these buildings (including improvements subsequent to acquisition), net of accumulated depreciation, was $39.7 million and $12.3 million, respectively.
M&T Bank also owns facilities in Harrisburg, Pennsylvania and Millsboro, Delaware with approximately 220,000 and 325,000 rentable square feet of space, respectively. M&T Bank occupies approximately 29% and 95% of those facilities, respectively. At December 31, 2019, the cost of those buildings (including improvements subsequent to acquisition), net of accumulated depreciation, was $9.0 million and $11.8 million, respectively.
No other properties owned by M&T Bank have more than 100,000 square feet of space. The cost and accumulated depreciation and amortization of the Company’s premises and equipment is detailed in note 5 of Notes to Financial Statements filed herewith in Part II, Item 8, “Financial Statements and Supplementary Data.”
Of the 733 domestic banking offices of M&T’s subsidiary banks at December 31, 2019, 289 are owned in fee and 444 are leased.
41
Item 3. Legal Proceedings.
M&T and its subsidiaries are subject in the normal course of business to various pending and threatened legal proceedings and other matters in which claims for monetary damages are asserted. On an on-going basis management, after consultation with legal counsel, assesses the Company’s liabilities and contingencies in connection with such proceedings. For those matters where it is probable that the Company will incur losses and the amounts of the losses can be reasonably estimated, the Company records an expense and corresponding liability in its consolidated financial statements. To the extent the pending or threatened litigation could result in exposure in excess of that liability, the amount of such excess is not currently estimable. Although not considered probable, the range of reasonably possible losses for such matters in the aggregate, beyond the existing recorded liability, was between $0 and $50 million. Although the Company does not believe that the outcome of pending litigations will be material to the Company’s consolidated financial position, it cannot rule out the possibility that such outcomes will be material to the consolidated results of operations for a particular reporting period in the future.
ESOP Matters: Wilmington Trust, N.A. provides retirement services, including serving in certain trustee roles relating to Employee Stock Ownership Plans (“ESOPs”). Beginning in 2010, the U.S. Department of Labor (“DOL”) announced that it would increase its focus on ESOP transactions, particularly with regard to valuation issues relating to ESOP transactions. Beginning in late 2013, Wilmington Trust, N.A. began receiving requests for information and subpoenas relating to certain ESOP transactions for which it acted as trustee. In June 2016, Wilmington Trust, N.A. received a DOL subpoena seeking information on its global ESOP trustee business. In addition to these investigations, the DOL has commenced three lawsuits against Wilmington Trust, N.A. relating to its role as trustee of three ESOP transactions. In July 2019, Wilmington Trust, N.A. reached a settlement in principle with the DOL to resolve certain pending DOL ESOP matters. Although a formal settlement agreement has yet to be finalized and executed, the Company does not expect that the agreed-upon settlement will have a material incremental impact on the Company’s consolidated financial position or results of operations. Wilmington Trust, N.A. is also currently a defendant in five pending private party lawsuits relating to its role as trustee for five ESOP transactions. Under applicable transaction documents, Wilmington Trust, N.A. may be entitled to indemnification by the ESOP plan sponsors. These matters could result in damages, settlements, penalties, restitution, reputational damage or additional costs and expenses.
Due to their complex nature, it is difficult to estimate when litigation and investigatory matters such as these may be resolved. As set forth in the introductory paragraph to this Item 3 — Legal Proceedings, losses from current litigation and regulatory matters which the Company is subject to that are not currently considered probable are within a range of reasonably possible losses for such matters in the aggregate, beyond the existing recorded liability, and are included in the range of reasonably possible losses set forth above.
Item 4. Mine Safety Disclosures.
Not applicable.

42
Executive Officers of the RegistrantInformation concerning M&T’s executive officers is presented below as of February 19, 2020. The year the officer was first appointed to the indicated position with M&T or its subsidiaries is shown parenthetically. In the case of each entity noted below, officers’ terms run until the first meeting of the board of directors after such entity’s annual meeting, which in the case of M&T takes place immediately following the Annual Meeting of Shareholders, and until their successors are elected and qualified.
René F. Jones, age 55, is chief executive officer, chairman of the board and a director of M&T and M&T Bank (2017). Previously, he was an executive vice president (2006) of M&T and a vice chairman (2014) of M&T Bank with responsibility for the Company’s Wealth and Institutional Services Division, Treasury Division, and Mortgage and Consumer Lending Divisions. Mr. Jones is chairman of the board and a director (2014) of Wilmington Trust Investment Advisors, and is a director (2007) of M&T Insurance Agency. Mr. Jones is chairman of the board and a director (2014) of Wilmington Trust Company. Previously, Mr. Jones served as chief financial officer (2005) of M&T, M&T Bank and Wilmington Trust, N.A. and had held a number of management positions within M&T Bank’s Finance Division since 1992.
Richard S. Gold, age 59, is president, chief operating officer and a director of M&T and M&T Bank (2017). Mr. Gold oversees the Consumer Banking, Business Banking, Legal, Human Resources and Enterprise Transformation Divisions. Previously, he was an executive vice president (2006) and chief risk officer (2014) of M&T and was a vice chairman and chief risk officer (2014) of M&T Bank. Mr. Gold had been responsible for overseeing the Company’s governance and strategy for risk management, as well as relationships with key regulators and supervisory agencies. He served as a senior vice president of M&T Bank from 2000 to 2006 and has held a number of management positions since he began his career with M&T Bank in 1989. Mr. Gold is chairman, president and chief executive officer (2018) and a director (2017) of Wilmington Trust, N.A.
Kevin J. Pearson, age 58, is a vice chairman (2020) and a director (2018) of M&T and is a vice chairman (2014) and a director (2018) of M&T Bank. He is a member of the Directors Advisory Council (2006) of the New York City/Long Island Division of M&T Bank. Mr. Pearson has oversight of the Commercial Banking, Credit, Technology and Banking Operations, and Wealth and Institutional Services Divisions. Previously, Mr. Pearson served as an executive vice president of M&T and M&T Bank, and has held a number of management positions since he began his career with M&T Bank in 1989. He is chairman of the board and a director (2018) of Wilmington Trust Company, an executive vice president and a director of Wilmington Trust, N.A. (2014), and a director (2018) of Wilmington Trust Investment Advisors.
Robert J. Bojdak, age 64, is an executive vice president and chief credit officer (2004) of M&T and M&T Bank, and is responsible for the Company’s Credit Division, including the Credit Risk Management Division. From April 2002 to April 2004, Mr. Bojdak served as senior vice president and credit deputy for M&T Bank. He is an executive vice president and a director (2004) of Wilmington Trust, N.A.
Janet M. Coletti, age 56, is an executive vice president (2015) of M&T and M&T Bank, overseeing the Company’s Human Resources Division. Ms. Coletti previously served as senior vice president of M&T Bank, most recently responsible for the Business Banking Division, and has held a number of management positions within M&T Bank since 1985.

43
John L. D’Angelo, age 57, is an executive vice president and chief risk officer (2017) of M&T and M&T Bank. Mr. D’Angelo is responsible for overseeing the Company’s governance and strategy for risk management, as well as relationships with key regulators and supervisory agencies. Mr. D’Angelo is an executive vice president and chief risk officer (2018) of Wilmington Trust, N.A. and an executive vice president and a director (2017) of Wilmington Trust Company. He served as a senior vice president and general auditor of M&T Bank from 2005 to 2017 and has held a number of positions since he began his career with M&T Bank in 1987.
William J. Farrell II, age 62, is an executive vice president (2011) of M&T and M&T Bank, and is responsible for managing administrative and business development functions of the Company’s Wealth and Institutional Services Division, which includes Institutional Client Services and M&T Insurance Agency. Mr. Farrell joined M&T through the Wilmington Trust Corporation acquisition. He joined Wilmington Trust Corporation in 1976, and held a number of senior management positions, most recently as executive vice president and head of the Corporate Client Services business. Mr. Farrell is president, chief executive officer and a director (2012) of Wilmington Trust Company, an executive vice president and a director (2013) of Wilmington Trust, N.A. and a director (2016) of Wilmington Trust Investment Advisors.
Christopher E. Kay, age 54, is an executive vice president (2018) of M&T and M&T Bank, and is responsible for all aspects of Consumer Banking, including the Mortgage, Consumer Lending and Retail businesses, and Business Banking and Marketing. Prior to joining M&T in 2018, Mr. Kay served as chief innovation officer at Humana from 2014 to 2018 and as managing director of Citi Ventures from 2007 to 2013.
Darren J. King, age 50, is an executive vice president (2010) and chief financial officer (2016) of M&T and executive vice president (2009) and chief financial officer (2016) of M&T Bank. Mr. King has responsibility for the overall financial management of the Company and oversees the Finance and Treasury Divisions. Prior to his current role, Mr. King was the Retail Banking executive with responsibility for overseeing Business Banking, Consumer Deposits, Consumer Lending and M&T Bank’s Marketing and Communications team. Mr. King previously served as senior vice president of M&T Bank and has held a number of management positions within M&T Bank since 2000. Mr. King is an executive vice president (2009) and chief financial officer (2016) of Wilmington Trust, N.A. and a director of M&T Insurance Agency (2018).
Gino A. Martocci, age 54, is an executive vice president (2014) of M&T and M&T Bank, and is responsible for managing M&T Bank’s commercial banking lines of business. Mr. Martocci is responsible for directing strategic growth and business line development activities across the Company’s footprint for commercial customers. Previously, Mr. Martocci co-managed the Bank’s commercial banking lines of business. He is also responsible for M&T Realty Capital. Mr. Martocci was a senior vice president of M&T Bank from 2002 to 2013, serving in a number of management positions. He is chairman of the board (2018) and a director (2009) of M&T Realty Capital, and a member of the New York City Mortgage Investment Committee. Mr. Martocci is also a member of the Directors Advisory Council of the New York City/Long Island (2013) and the New Jersey (2015) Divisions of M&T Bank.
44
Doris P. Meister, age 64, is an executive vice president (2016) of M&T and M&T Bank, and is responsible for overseeing the Company’s wealth management business, including Wilmington Trust Wealth Management, M&T Securities and Wilmington Trust Investment Advisors. Ms. Meister is an executive vice president and a director (2016) of Wilmington Trust, N.A., an executive vice president and director of Wilmington Trust Company (2016) and chairman of the board, chief executive officer and a director (2017) of Wilmington Trust Investment Advisors. Prior to joining M&T in 2016, Ms. Meister served as President of U.S. Markets for BNY Mellon Wealth Management from 2009 to 2016 and prior to that was a Managing Director of the New York office of Bernstein Global Wealth Management.
Michael J. Todaro, age 58, is an executive vice president (2015) of M&T and M&T Bank, and is responsible for Enterprise Transformation, a division of the Company dedicated to improving business processes, removing impediments to progress and evaluating/integrating external opportunities. Previously, Mr. Todaro was responsible for the Mortgage, Consumer Lending and Customer Asset Management Divisions. Mr. Todaro previously served as senior vice president of M&T Bank and has held a number of management positions within M&T Bank’s Mortgage Division since 1995. He is an executive vice president (2015) of Wilmington Trust, N.A.
Michele D. Trolli, age 58, is an executive vice president (2005) and chief technology and operations officer (2018) of M&T and M&T Bank. Previously, she was chief information officer (2005) of M&T and M&T Bank. Ms. Trolli leads a wide range of the Company’s Technology and Banking Operations, which includes banking services, corporate services, digital and telephone banking, the enterprise data office, enterprise and cyber security, and enterprise technology.
D. Scott N. Warman, age 54, is an executive vice president (2009) and treasurer (2008) of M&T and M&T Bank. He is responsible for managing the Company’s Treasury Division, including asset/liability management, funding, investment and derivative portfolio management, capital markets foreign exchange trading and sales. Mr. Warman previously served as senior vice president of M&T Bank and has held a number of management positions within M&T Bank since 1995. He is an executive vice president and treasurer of Wilmington Trust, N.A. (2008) and is an executive vice president and treasurer of Wilmington Trust Company (2012).

45
PART II
Item 5. Market for Registrant’s Common Equity, Related Stockholder Matters and Issuer Purchases of Equity Securities.
M&T’s common stock is traded under the symbol MTB on the New York Stock Exchange. See cross-reference sheet for disclosures incorporated elsewhere in this Annual Report on Form 10-K for market prices of M&T’s common stock, approximate number of common shareholders at year-end, frequency and amounts of dividends on common stock and restrictions on the payment of dividends.
During the fourth quarter of 2019, M&T did not issue any shares of its common stock that were not registered under the Securities Act of 1933.
Equity Compensation Plan InformationThe following table provides information as of December 31, 2019 with respect to shares of common stock that may be issued under M&T’s existing equity compensation plans. M&T’s existing equity compensation plans include the M&T Bank Corporation 2019 Equity Incentive Compensation Plan, which has been previously approved by shareholders, and the M&T Bank Corporation 2008 Directors’ Stock Plan and the M&T Bank Corporation Deferred Bonus Plan, each of which did not require shareholder approval.
The table does not include information with respect to shares of common stock subject to outstanding options and rights assumed by M&T in connection with mergers and acquisitions of the companies that originally granted those options and rights. Footnote (1) to the table sets forth the total number of shares of common stock issuable upon the exercise of such assumed options and rights as of December 31, 2019, and their weighted-average exercise price.
Plan Category
Number ofSecurities
to be Issued UponExercise of
OutstandingOptions or Rights
Weighted-AverageExercise Price of
OutstandingOptions or Rights
Number of SecuritiesRemaining Availablefor Future Issuance
Under EquityCompensation Plans(Excluding Securities
Reflected in Column A) (A) (B) (C)
Equity compensation plans approved by security holders..................................... 280,740 $ 174.37 3,742,478 Equity compensation plans not approved by security holders..................................... 19,426 88.70 14,470
Total ................................................... 300,166 $ 168.83 3,756,948
(1) As of December 31, 2019, a total of 29,755 shares of M&T common stock were issuable upon exercise of outstanding options or rights assumed by M&T in connection with merger and acquisition transactions. The weighted-average exercise price of those outstanding options or rights is $112.79 per common share.
Equity compensation plans adopted without the approval of shareholders are described below:
2008 Directors’ Stock Plan. M&T maintains a plan for non-employee members of the Board of Directors of M&T and the members of its Directors Advisory Council, and the non-employee members of the Board of Directors of M&T Bank, which allows such directors and advisory directors to receive all or a portion of their directorial compensation in shares of M&T common stock.

46
Deferred Bonus Plan. M&T maintains a deferred bonus plan which was frozen effective January 1, 2010 and did not allow any additional deferrals after that date. Prior to January 1, 2010, the plan allowed eligible officers of M&T and its subsidiaries to elect to defer all or a portion of their annual incentive compensation awards and allocate such awards to several investment options, including M&T common stock. At the time of the deferral election, participants also elected the timing of distributions from the plan. Such distributions are payable in cash, with the exception of balances allocated to M&T common stock which are distributable in the form of shares of common stock.
Performance GraphThe following graph contains a comparison of the cumulative shareholder return on M&T common stock against the cumulative total returns of the KBW Nasdaq Bank Index, compiled by Keefe, Bruyette & Woods, Inc., and the S&P 500 Index, compiled by Standard & Poor’s Corporation, for the five-year period beginning on December 31, 2014 and ending on December 31, 2019. The KBW Nasdaq Bank Index is a modified market capitalization weighted index consisting of 24 banking stocks representing leading large U.S. national money centers, regional banks and thrift institutions.
Comparison of Five-Year Cumulative Return*
2014 2015 2016 2017 2018 2019$0
$50
$100
$150
$200
$250
M&T Bank Corporation KBW Nasdaq Bank Index S&P 500 Index
Shareholder Value at Year End*
2014 2015 2016 2017 2018 2019
M&T Bank Corporation............................ 100 99 130 145 124 151 KBW Nasdaq Bank Index......................... 100 101 129 153 126 172 S&P 500 Index .......................................... 100 101 114 138 132 174
* Assumes a $100 investment on December 31, 2014 and reinvestment of all dividends.
In accordance with and to the extent permitted by applicable law or regulation, the information set forth above under the heading “Performance Graph” shall not be incorporated by reference into any future filing under the Securities Act of 1933, as amended (the “Securities Act”), or the Exchange Act and shall not be deemed to be “soliciting material” or to be “filed” with the SEC under the Securities Act or the Exchange Act.
47
Issuer Purchases of Equity SecuritiesOn July 17, 2019 M&T’s Board of Directors authorized a new stock repurchase program to repurchase up to $1.635 billion of common shares, including the remaining shares not purchased related to M&T’s 2018 revised capital plan. In total, M&T repurchased 8,257,000 common shares for $1.35 billion during 2019.
During the fourth quarter of 2019, M&T purchased shares of its common stock as follows:
Issuer Purchases of Equity Securities
Period
(a)TotalNumberof Shares(or Units)
Purchased (1)
(b)AveragePrice Paidper Share(or Unit)
(c)TotalNumber of
Shares(or Units)Purchasedas Part ofPublicly
AnnouncedPlans or
Programs
(d)MaximumNumber (or
ApproximateDollar Value)
of Shares(or Units)
that may yetbe Purchased
Under thePlans or
Programs (2)
October 1 - October 31, 2019 ...................................... 300,009 $ 155.48 300,000 $1,288,394,396 November 1 - November 30, 2019 .............................. 604,000 164.16 604,000 1,189,240,478 December 1 - December 31, 2019............................... 820,081 166.36 820,000 1,052,827,270 Total............................................................................. 1,724,090 $ 163.70 1,724,000
(1) The total number of shares purchased during the periods indicated includes shares purchased as part of publicly announced programs and shares deemed to have been received from employees who exercised stock options by attesting to previously acquired common shares in satisfaction of the exercise price or shares received from employees upon the vesting of restricted stock awards in satisfaction of applicable tax withholding obligations, as is permitted under M&T’s stock-based compensation plans.
(2) On July 17, 2019 M&T’s Board of Directors authorized a new stock repurchase program to repurchase up to $1.635 billion of common shares, including the remaining shares not purchased related to M&T’s 2018 revised capital plan.
Item 6. Selected Financial Data.
See cross-reference sheet for disclosures incorporated elsewhere in this Annual Report on Form 10-K.
Item 7. Management’s Discussion and Analysis of Financial Condition and Results of Operations.
Corporate ProfileM&T Bank Corporation (“M&T”) is a bank holding company headquartered in Buffalo, New York with consolidated assets of $119.9 billion at December 31, 2019. The consolidated financial information presented herein reflects M&T and all of its subsidiaries, which are referred to collectively as “the Company.” M&T’s wholly owned bank subsidiaries are Manufacturers and Traders Trust Company (“M&T Bank”) and Wilmington Trust, National Association (“Wilmington Trust, N.A.”).
M&T Bank, with total assets of $119.4 billion at December 31, 2019, is a New York-chartered commercial bank with 731 domestic banking offices in New York State, Maryland, New Jersey, Pennsylvania, Delaware, Connecticut, Virginia, West Virginia and the District of Columbia, a full-service commercial banking office in Ontario, Canada, and an office in the Cayman Islands. M&T Bank and its subsidiaries offer a broad range of financial services to a diverse base of consumers, businesses, professional clients, governmental entities and financial institutions located in their

48
markets. Lending is largely focused on consumers residing in the states noted above and on small and medium-size businesses based in those areas, although loans are originated through offices in other states and in Ontario, Canada. Certain lending activities are also conducted in other states through various subsidiaries. Trust and other fiduciary services are offered by M&T Bank and through its wholly owned subsidiary, Wilmington Trust Company. Other subsidiaries of M&T Bank include: M&T Realty Capital Corporation, a multifamily commercial mortgage lender; M&T Securities, Inc., which provides brokerage, investment advisory and insurance services; Wilmington Trust Investment Advisors, Inc., which serves as an investment advisor to the Wilmington Funds, a family of proprietary mutual funds, and other funds and institutional clients; and M&T Insurance Agency, Inc., an insurance agency.
Wilmington Trust, N.A. is a national bank with total assets of $4.7 billion at December 31, 2019. Wilmington Trust, N.A. and its subsidiaries offer various trust and wealth management services.
Critical Accounting EstimatesThe Company’s significant accounting policies conform with generally accepted accounting principles (“GAAP”) and are described in note 1 of Notes to Financial Statements. In applying those accounting policies, management of the Company is required to exercise judgment in determining many of the methodologies, assumptions and estimates to be utilized. Certain of the critical accounting estimates are more dependent on such judgment and in some cases may contribute to volatility in the Company’s reported financial performance should the assumptions and estimates used change over time due to changes in circumstances. Some of the more significant areas in which management of the Company applies critical assumptions and estimates include the following:
• Accounting for credit losses — The allowance for credit losses represents the amount that in management’s judgment appropriately reflects credit losses inherent in the loan and lease portfolio as of the balance sheet date. A provision for credit losses is recorded to adjust the level of the allowance as deemed necessary by management. In estimating losses inherent in the loan and lease portfolio, assumptions and judgment are applied to measure amounts and timing of expected future cash flows, collateral values and other factors used to determine the borrowers’ abilities to repay obligations. Historical loss trends are also considered, as are economic conditions, industry trends, portfolio trends and borrower-specific financial data. In accounting for loans acquired at a discount that is, in part, attributable to credit quality and which were initially recorded at fair value with no carry-over of an acquired entity’s previously established allowance for credit losses, the cash flows expected at acquisition in excess of estimated fair value have been recognized as interest income over the remaining lives of the loans. Subsequent decreases in the expected cash flows required the Company to evaluate the need for additions to the Company’s allowance for credit losses. Subsequent improvements in expected cash flows resulted first in the recovery of any applicable allowance for credit losses and then in the recognition of additional interest income over the remaining lives of the loans. Changes in the circumstances considered when determining management’s estimates and assumptions could have resulted in changes in those estimates and assumptions, which could have resulted in adjustment of the allowance or, in the case of loans acquired at a discount, increases in interest income. Effective January 1, 2020, the Company adopted amending accounting guidance that impacts how the allowance for credit losses is determined. A discussion of facts and circumstances considered by management in determining the allowance for credit losses, as well as the new accounting guidance, is included herein under the heading “Provision for Credit Losses” and in note 4 of Notes to Financial Statements.

49
• Valuation methodologies — Management of the Company applies various valuation methodologies to assets and liabilities which often involve a significant degree of judgment, particularly when liquid markets do not exist for the particular items being valued. Quoted market prices are referred to when estimating fair values for certain assets, such as trading assets, most investment securities, and residential real estate loans held for sale and related commitments. However, for those items for which an observable liquid market does not exist, management utilizes significant estimates and assumptions to value such items. Examples of these items include loans, deposits, borrowings, goodwill, core deposit and other intangible assets, other assets and liabilities obtained or assumed in business combinations, capitalized servicing assets, pension and other postretirement benefit obligations, estimated residual values of property associated with leases, and certain derivative and other financial instruments. These valuations require the use of various assumptions, including, among others, discount rates, rates of return on assets, repayment rates, cash flows, default rates, costs of servicing and liquidation values. The use of different assumptions could produce significantly different results, which could have material positive or negative effects on the Company’s results of operations, financial condition or disclosures of fair value information. In addition to valuation, the Company must assess whether there are any declines in value below the carrying value of assets that should be considered other than temporary or otherwise require an adjustment in carrying value and recognition of a loss in the consolidated statement of income. Examples include investment securities, other investments, capitalized servicing assets, goodwill and core deposit and other intangible assets, among others. Specific assumptions and estimates utilized by management are discussed in detail herein in management’s discussion and analysis of financial condition and results of operations and in notes 1, 2, 3, 6, 7, 12, 18, 19 and 20 of Notes to Financial Statements.
• Commitments, contingencies and off-balance sheet arrangements — Information regarding the Company’s commitments and contingencies, including guarantees and contingent liabilities arising from litigation, and their potential effects on the Company’s results of operations is included in note 21 of Notes to Financial Statements. In addition, the Company is routinely subject to examinations from various governmental taxing authorities. Such examinations may result in challenges to the tax return treatment applied by the Company to specific transactions. Management believes that the assumptions and judgment used to record tax-related assets or liabilities have been appropriate. Should tax laws change or the tax authorities determine that management’s assumptions were inappropriate, the result and adjustments required could have a material effect on the Company’s results of operations. Information regarding the Company’s income taxes is presented in note 13 of Notes to Financial Statements. The recognition or de-recognition in the Company’s consolidated financial statements of assets and liabilities held by so-called variable interest entities is subject to the interpretation and application of complex accounting pronouncements or interpretations that require management to estimate and assess the relative significance of the Company’s financial interests in those entities and the degree to which the Company can influence the most important activities of the entities. Information relating to the Company’s involvement in such entities and the accounting treatment afforded each such involvement is included in note 19 of Notes to Financial Statements.
OverviewNet income for the Company in 2019 was $1.93 billion or $13.75 of diluted earnings per common share, up 1% and 8%, respectively, from $1.92 billion or $12.74 of diluted earnings per common share in 2018. Basic earnings per common share also increased 8% to $13.76 in 2019 from $12.75 in
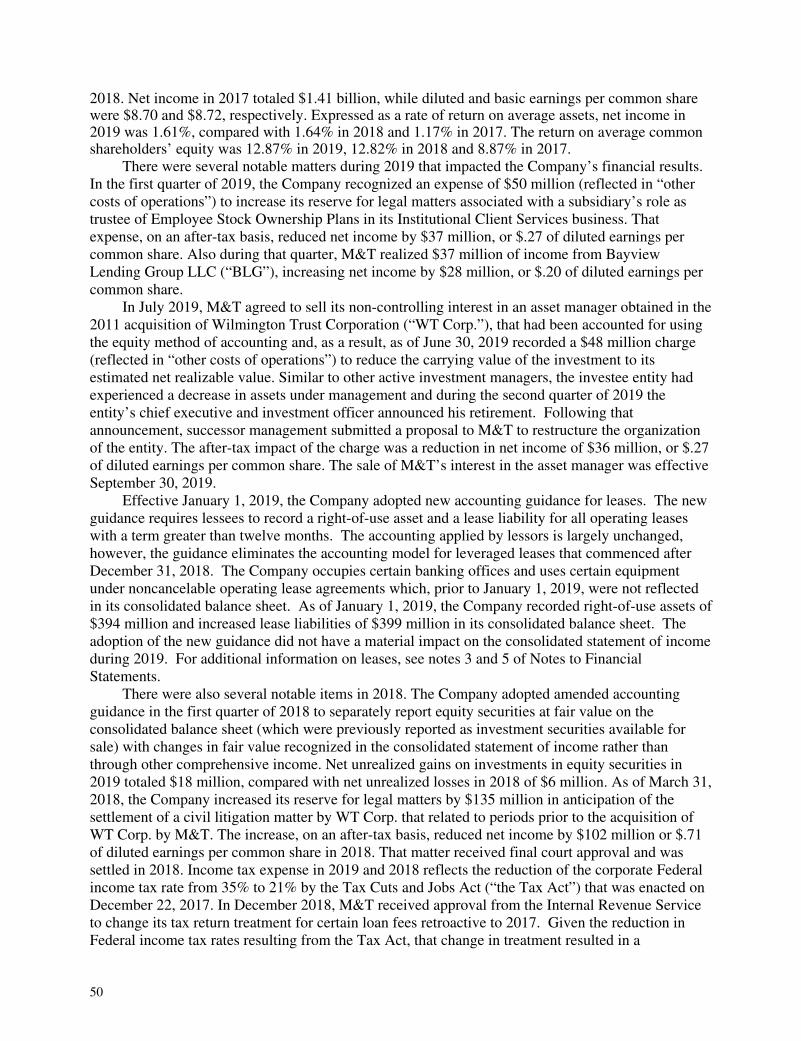
50
2018. Net income in 2017 totaled $1.41 billion, while diluted and basic earnings per common share were $8.70 and $8.72, respectively. Expressed as a rate of return on average assets, net income in 2019 was 1.61%, compared with 1.64% in 2018 and 1.17% in 2017. The return on average common shareholders’ equity was 12.87% in 2019, 12.82% in 2018 and 8.87% in 2017.
There were several notable matters during 2019 that impacted the Company’s financial results. In the first quarter of 2019, the Company recognized an expense of $50 million (reflected in “other costs of operations”) to increase its reserve for legal matters associated with a subsidiary’s role as trustee of Employee Stock Ownership Plans in its Institutional Client Services business. That expense, on an after-tax basis, reduced net income by $37 million, or $.27 of diluted earnings per common share. Also during that quarter, M&T realized $37 million of income from Bayview Lending Group LLC (“BLG”), increasing net income by $28 million, or $.20 of diluted earnings per common share.
In July 2019, M&T agreed to sell its non-controlling interest in an asset manager obtained in the 2011 acquisition of Wilmington Trust Corporation (“WT Corp.”), that had been accounted for using the equity method of accounting and, as a result, as of June 30, 2019 recorded a $48 million charge (reflected in “other costs of operations”) to reduce the carrying value of the investment to its estimated net realizable value. Similar to other active investment managers, the investee entity had experienced a decrease in assets under management and during the second quarter of 2019 the entity’s chief executive and investment officer announced his retirement. Following that announcement, successor management submitted a proposal to M&T to restructure the organization of the entity. The after-tax impact of the charge was a reduction in net income of $36 million, or $.27 of diluted earnings per common share. The sale of M&T’s interest in the asset manager was effective September 30, 2019.
Effective January 1, 2019, the Company adopted new accounting guidance for leases. The new guidance requires lessees to record a right-of-use asset and a lease liability for all operating leases with a term greater than twelve months. The accounting applied by lessors is largely unchanged, however, the guidance eliminates the accounting model for leveraged leases that commenced after December 31, 2018. The Company occupies certain banking offices and uses certain equipment under noncancelable operating lease agreements which, prior to January 1, 2019, were not reflected in its consolidated balance sheet. As of January 1, 2019, the Company recorded right-of-use assets of $394 million and increased lease liabilities of $399 million in its consolidated balance sheet. The adoption of the new guidance did not have a material impact on the consolidated statement of income during 2019. For additional information on leases, see notes 3 and 5 of Notes to Financial Statements.
There were also several notable items in 2018. The Company adopted amended accounting guidance in the first quarter of 2018 to separately report equity securities at fair value on the consolidated balance sheet (which were previously reported as investment securities available for sale) with changes in fair value recognized in the consolidated statement of income rather than through other comprehensive income. Net unrealized gains on investments in equity securities in 2019 totaled $18 million, compared with net unrealized losses in 2018 of $6 million. As of March 31, 2018, the Company increased its reserve for legal matters by $135 million in anticipation of the settlement of a civil litigation matter by WT Corp. that related to periods prior to the acquisition of WT Corp. by M&T. The increase, on an after-tax basis, reduced net income by $102 million or $.71 of diluted earnings per common share in 2018. That matter received final court approval and was settled in 2018. Income tax expense in 2019 and 2018 reflects the reduction of the corporate Federal income tax rate from 35% to 21% by the Tax Cuts and Jobs Act (“the Tax Act”) that was enacted on December 22, 2017. In December 2018, M&T received approval from the Internal Revenue Service to change its tax return treatment for certain loan fees retroactive to 2017. Given the reduction in Federal income tax rates resulting from the Tax Act, that change in treatment resulted in a

51
$15 million reduction of income tax expense in 2018’s fourth quarter. Following receipt of the approval, the Company increased its contribution to The M&T Charitable Foundation in 2018’s fourth quarter to $20 million that, after applicable tax effect, reduced net income by $15 million.
During 2017, M&T adopted new accounting guidance for share-based transactions. That guidance requires that all excess tax benefits and tax deficiencies associated with share-based compensation be recognized in income tax expense in the income statement. Previously, tax effects resulting from changes in M&T’s share price subsequent to the grant date were recorded through shareholders’ equity at the time of vesting or exercise. The adoption of the amended accounting guidance resulted in a $22 million reduction of income tax expense in 2017, or $.15 of diluted earnings per common share. Similarly, income tax expense in 2019 and 2018 was reduced by $2 million, or $.02 of diluted earnings per common share, and $9 million, or $.06 of diluted earnings per common share, respectively.
On October 9, 2017, WT Corp. reached an agreement with the U.S. Attorney’s Office for the District of Delaware related to alleged conduct that took place between 2009 and 2010 prior to the acquisition of WT Corp. by M&T. The result was a payment of $44 million that was not deductible for income tax purposes. WT Corp. did not admit any liability. As of September 30, 2017, the Company increased the reserve for legal matters by $50 million. That increase, coupled with the non-deductible nature of the $44 million payment, reduced net income in 2017 by $48 million, or $.31 of diluted earnings per common share. As noted, the Tax Act enacted in December 2017 reduced the Federal income tax rate and made other changes to U.S. corporate income tax laws. GAAP requires that the impact of the provisions of the Tax Act be accounted for in the period of enactment. Accordingly, the incremental income tax expense recorded by the Company in the fourth quarter of 2017 related to the Tax Act was $85 million, representing $.56 of diluted earnings per common share. The additional expense was largely attributable to the reduction in carrying value of net deferred tax assets reflecting lower future tax benefits resulting from the lower corporate tax rate.
During the fourth quarter of 2017, the Company realized after-tax gains from sales of investment securities of $14 million ($21 million pre-tax) that added $.09 to diluted earnings per common share. The Company increased its contribution to The M&T Charitable Foundation by $44 million in the final 2017 quarter, bringing total charitable contributions for all of 2017 to $50 million, thereby reducing net income by $30 million, or $.20 of diluted earnings per common share.
Taxable-equivalent net interest income was $4.15 billion in 2019, 1% higher than $4.09 billion in 2018. That improvement resulted from an increase in average earning assets to $108.2 billion in 2019 from $106.8 billion in 2018 and a slight expansion of the net interest margin, or taxable-equivalent net interest income expressed as an annualized percentage of average earning assets, to 3.84% in 2019 from 3.83% in 2018. Taxable-equivalent net interest income rose 7% in 2018 from $3.82 billion in 2017. That improvement resulted predominantly from a 36 basis point (hundredths of one percent) widening of the net interest margin in 2018 from 3.47% in 2017. Partially offsetting the impact of the expanded net interest margin was a 3% decline in average earning assets in 2018 from $110.0 billion in 2017.
The provision for credit losses increased 33% to $176 million in 2019 from $132 million in 2018. The provision in 2017 was $168 million. Net charge-offs in 2019, 2018 and 2017 were $144 million, $130 million and $140 million, respectively.
Other income aggregated $2.06 billion and $1.86 billion in 2019 and 2018, respectively, compared with $1.85 billion in 2017. As compared with 2018, growth in 2019 was experienced in most major sources of noninterest income, led by higher residential and commercial mortgage banking revenues and trust income. Comparing 2018 to 2017, higher trust income and income from BLG in 2018 were partially offset by the impact of gains on investment securities during 2017.
Other expense increased 5% to $3.47 billion in 2019 from $3.29 billion in 2018. Other expense in 2017 totaled $3.14 billion. Included in those amounts are expenses considered by M&T to be

52
“nonoperating” in nature, consisting of amortization of core deposit and other intangible assets of $19 million, $25 million and $31 million in 2019, 2018 and 2017, respectively. Exclusive of those nonoperating expenses, noninterest operating expenses totaled $3.45 billion in 2019, compared with $3.26 billion in 2018 and $3.11 billion in 2017. The higher level of such expenses in 2019 as compared with 2018 resulted from increased costs for salaries and employee benefits, equipment and net occupancy, outside data processing and software, and professional services, and the $48 million charge associated with the sale of an equity investment in an asset manager. Those factors were partially offset by lower costs associated with legal-related matters and contributions to The M&T Charitable Foundation, and a decline in FDIC assessments. The increase in noninterest operating expenses in 2018 as compared with 2017 was largely due to higher costs for salaries and employee benefits, professional services, and increases to the reserve for legal matters, partially offset by lower FDIC assessments and contributions to The M&T Charitable Foundation.
The efficiency ratio measures the relationship of noninterest operating expenses to revenues. The Company’s efficiency ratio, or noninterest operating expenses (as previously defined) divided by the sum of taxable-equivalent net interest income and noninterest income (exclusive of gains and losses from bank investment securities), was 55.7% in 2019, compared with 54.8% and 55.1% in 2018 and 2017, respectively. The calculations of the efficiency ratio are presented in table 2.
The Company’s effective tax rate was 24.3%, 23.5% and 39.4% in 2019, 2018 and 2017, respectively. The lower rates in 2019 and 2018 reflect the reduction of the corporate Federal income tax rate from 35% to 21% as of January 1, 2018.
On June 27, 2019, M&T announced its 2019 Capital Plan, which covers the four-quarter period that began on July 1, 2019. The 2019 Capital Plan, which was reviewed and approved by M&T’s Board of Directors, reflects capital distributions within the amount that M&T can make over the specified period based on the prior approval of the Board of Governors of the Federal Reserve System. M&T’s 2019 Capital Plan reflects net capital distributions of approximately $1.9 billion, which include common and preferred stock dividends as well as repurchases of M&T’s common stock. M&T’s Board of Directors may consider an increase in the common stock dividend, at its discretion, during the four-quarter period. All dividends are subject to declaration by M&T’s Board of Directors. In July 2019, M&T’s Board of Directors authorized a new stock repurchase plan to repurchase up to $1.635 billion of shares of M&T’s common stock subject to all applicable regulatory limitations. In accordance with that repurchase plan, M&T repurchased 3,657,000 shares of its common stock at a total cost of $582 million in the second half of 2019. In the aggregate, M&T repurchased 8,257,000 shares of its common stock at a total cost of $1.35 billion during 2019. The dollar amount and number of common shares repurchased were $2.2 billion and 12,295,817, respectively, in 2018 and $1.2 billion and 7,369,105, respectively, in 2017. During 2019’s fourth quarter, M&T increased the quarterly common stock cash dividend by $.10 to $1.10 per share.
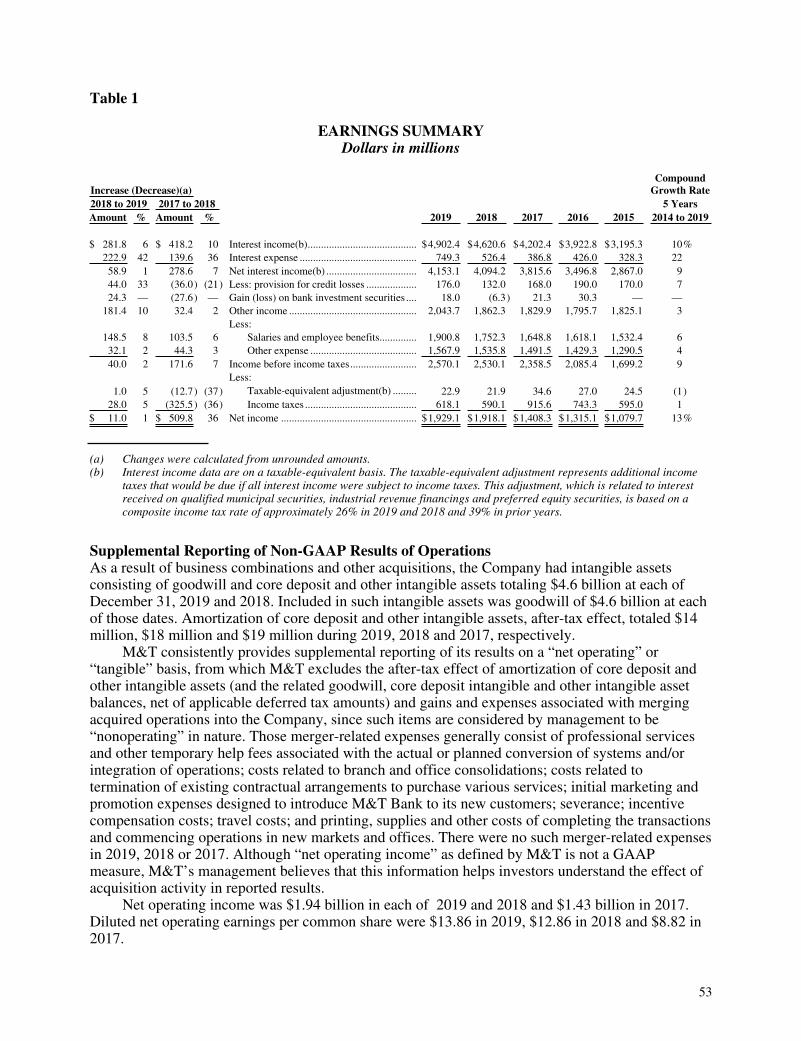
53
Table 1
EARNINGS SUMMARYDollars in millions
Increase (Decrease)(a) Compound
Growth Rate 2018 to 2019 2017 to 2018 5 Years Amount % Amount % 2019 2018 2017 2016 2015 2014 to 2019 $ 281.8 6 $ 418.2 10 Interest income(b)......................................... $4,902.4 $4,620.6 $4,202.4 $3,922.8 $3,195.3 10% 222.9 42 139.6 36 Interest expense ............................................ 749.3 526.4 386.8 426.0 328.3 22 58.9 1 278.6 7 Net interest income(b) .................................. 4,153.1 4,094.2 3,815.6 3,496.8 2,867.0 9 44.0 33 (36.0) (21) Less: provision for credit losses ................... 176.0 132.0 168.0 190.0 170.0 7 24.3 — (27.6) — Gain (loss) on bank investment securities .... 18.0 (6.3) 21.3 30.3 — — 181.4 10 32.4 2 Other income ................................................ 2,043.7 1,862.3 1,829.9 1,795.7 1,825.1 3 Less: 148.5 8 103.5 6 Salaries and employee benefits.............. 1,900.8 1,752.3 1,648.8 1,618.1 1,532.4 6 32.1 2 44.3 3 Other expense ........................................ 1,567.9 1,535.8 1,491.5 1,429.3 1,290.5 4 40.0 2 171.6 7 Income before income taxes......................... 2,570.1 2,530.1 2,358.5 2,085.4 1,699.2 9 Less: 1.0 5 (12.7) (37) Taxable-equivalent adjustment(b) ......... 22.9 21.9 34.6 27.0 24.5 (1) 28.0 5 (325.5) (36) Income taxes .......................................... 618.1 590.1 915.6 743.3 595.0 1 $ 11.0 1 $ 509.8 36 Net income ................................................... $1,929.1 $1,918.1 $1,408.3 $1,315.1 $1,079.7 13%
(a) Changes were calculated from unrounded amounts.(b) Interest income data are on a taxable-equivalent basis. The taxable-equivalent adjustment represents additional income
taxes that would be due if all interest income were subject to income taxes. This adjustment, which is related to interest received on qualified municipal securities, industrial revenue financings and preferred equity securities, is based on a composite income tax rate of approximately 26% in 2019 and 2018 and 39% in prior years.
Supplemental Reporting of Non-GAAP Results of OperationsAs a result of business combinations and other acquisitions, the Company had intangible assets consisting of goodwill and core deposit and other intangible assets totaling $4.6 billion at each of December 31, 2019 and 2018. Included in such intangible assets was goodwill of $4.6 billion at each of those dates. Amortization of core deposit and other intangible assets, after-tax effect, totaled $14 million, $18 million and $19 million during 2019, 2018 and 2017, respectively.
M&T consistently provides supplemental reporting of its results on a “net operating” or “tangible” basis, from which M&T excludes the after-tax effect of amortization of core deposit and other intangible assets (and the related goodwill, core deposit intangible and other intangible asset balances, net of applicable deferred tax amounts) and gains and expenses associated with merging acquired operations into the Company, since such items are considered by management to be “nonoperating” in nature. Those merger-related expenses generally consist of professional services and other temporary help fees associated with the actual or planned conversion of systems and/or integration of operations; costs related to branch and office consolidations; costs related to termination of existing contractual arrangements to purchase various services; initial marketing and promotion expenses designed to introduce M&T Bank to its new customers; severance; incentive compensation costs; travel costs; and printing, supplies and other costs of completing the transactions and commencing operations in new markets and offices. There were no such merger-related expenses in 2019, 2018 or 2017. Although “net operating income” as defined by M&T is not a GAAP measure, M&T’s management believes that this information helps investors understand the effect of acquisition activity in reported results.
Net operating income was $1.94 billion in each of 2019 and 2018 and $1.43 billion in 2017. Diluted net operating earnings per common share were $13.86 in 2019, $12.86 in 2018 and $8.82 in 2017.
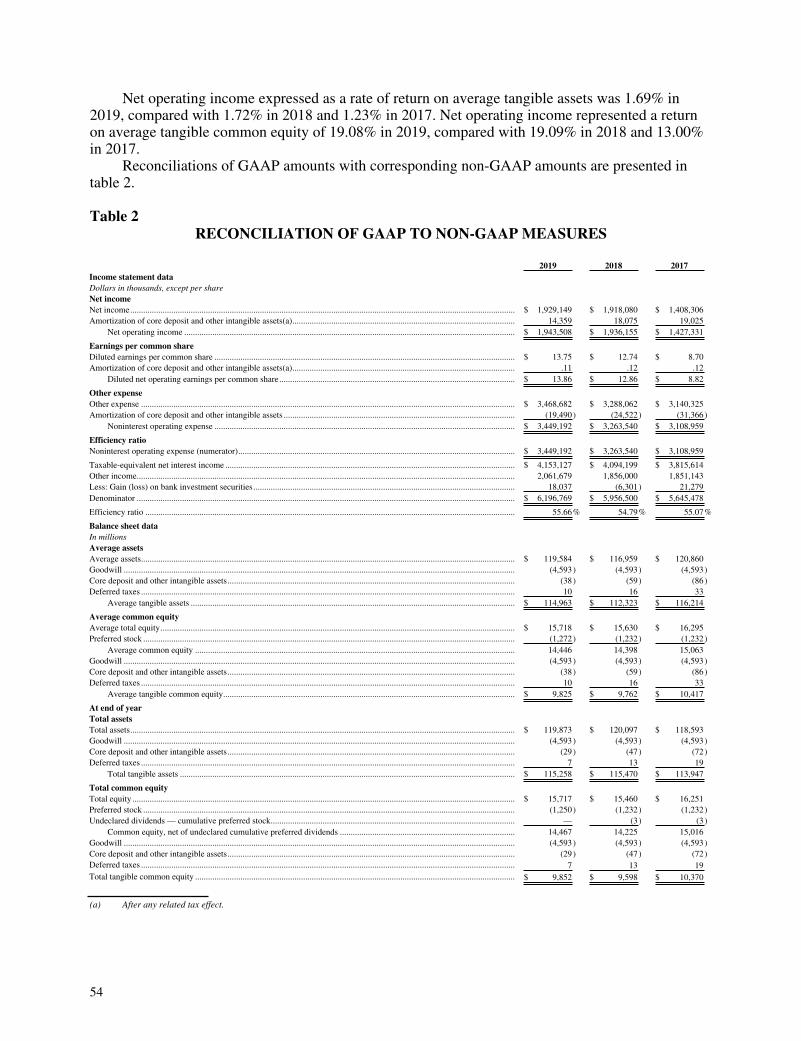
54
Net operating income expressed as a rate of return on average tangible assets was 1.69% in 2019, compared with 1.72% in 2018 and 1.23% in 2017. Net operating income represented a return on average tangible common equity of 19.08% in 2019, compared with 19.09% in 2018 and 13.00% in 2017.
Reconciliations of GAAP amounts with corresponding non-GAAP amounts are presented in table 2.
Table 2RECONCILIATION OF GAAP TO NON-GAAP MEASURES
2019 2018 2017 Income statement data Dollars in thousands, except per share Net income Net income.................................................................................................................................................................................. $ 1,929,149 $ 1,918,080 $ 1,408,306 Amortization of core deposit and other intangible assets(a)....................................................................................................... 14,359 18,075 19,025
Net operating income ......................................................................................................................................................... $ 1,943,508 $ 1,936,155 $ 1,427,331
Earnings per common share Diluted earnings per common share ........................................................................................................................................... $ 13.75 $ 12.74 $ 8.70 Amortization of core deposit and other intangible assets(a)....................................................................................................... .11 .12 .12
Diluted net operating earnings per common share ............................................................................................................. $ 13.86 $ 12.86 $ 8.82
Other expense Other expense ............................................................................................................................................................................. $ 3,468,682 $ 3,288,062 $ 3,140,325 Amortization of core deposit and other intangible assets ........................................................................................................... (19,490) (24,522) (31,366)
Noninterest operating expense ........................................................................................................................................... $ 3,449,192 $ 3,263,540 $ 3,108,959
Efficiency ratio Noninterest operating expense (numerator)................................................................................................................................ $ 3,449,192 $ 3,263,540 $ 3,108,959
Taxable-equivalent net interest income ...................................................................................................................................... $ 4,153,127 $ 4,094,199 $ 3,815,614 Other income............................................................................................................................................................................... 2,061,679 1,856,000 1,851,143 Less: Gain (loss) on bank investment securities ......................................................................................................................... 18,037 (6,301) 21,279 Denominator ............................................................................................................................................................................... $ 6,196,769 $ 5,956,500 $ 5,645,478
Efficiency ratio ........................................................................................................................................................................... 55.66% 54.79% 55.07%
Balance sheet data In millions Average assets Average assets............................................................................................................................................................................. $ 119,584 $ 116,959 $ 120,860 Goodwill ..................................................................................................................................................................................... (4,593) (4,593) (4,593)Core deposit and other intangible assets..................................................................................................................................... (38) (59) (86)Deferred taxes ............................................................................................................................................................................. 10 16 33
Average tangible assets ...................................................................................................................................................... $ 114,963 $ 112,323 $ 116,214
Average common equity Average total equity.................................................................................................................................................................... $ 15,718 $ 15,630 $ 16,295 Preferred stock ............................................................................................................................................................................ (1,272) (1,232) (1,232)
Average common equity .................................................................................................................................................... 14,446 14,398 15,063 Goodwill ..................................................................................................................................................................................... (4,593) (4,593) (4,593)Core deposit and other intangible assets..................................................................................................................................... (38) (59) (86)Deferred taxes ............................................................................................................................................................................. 10 16 33
Average tangible common equity....................................................................................................................................... $ 9,825 $ 9,762 $ 10,417
At end of year Total assets Total assets.................................................................................................................................................................................. $ 119,873 $ 120,097 $ 118,593 Goodwill ..................................................................................................................................................................................... (4,593) (4,593) (4,593)Core deposit and other intangible assets..................................................................................................................................... (29) (47) (72)Deferred taxes ............................................................................................................................................................................. 7 13 19
Total tangible assets ........................................................................................................................................................... $ 115,258 $ 115,470 $ 113,947
Total common equity Total equity ................................................................................................................................................................................. $ 15,717 $ 15,460 $ 16,251 Preferred stock ............................................................................................................................................................................ (1,250) (1,232) (1,232)Undeclared dividends — cumulative preferred stock................................................................................................................. — (3 ) (3 )
Common equity, net of undeclared cumulative preferred dividends ................................................................................. 14,467 14,225 15,016 Goodwill ..................................................................................................................................................................................... (4,593) (4,593) (4,593)Core deposit and other intangible assets..................................................................................................................................... (29) (47) (72)Deferred taxes ............................................................................................................................................................................. 7 13 19 Total tangible common equity .................................................................................................................................................... $ 9,852 $ 9,598 $ 10,370
(a) After any related tax effect.

55
Net Interest Income/Lending and Funding ActivitiesNet interest income expressed on a taxable-equivalent basis aggregated $4.15 billion in 2019, up 1% from $4.09 billion in 2018. That growth resulted from a $1.5 billion, or 1%, increase in average earning assets to $108.2 billion in 2019 from $106.8 billion in 2018 that reflected increases in average loan and lease balances of $2.1 billion and in interest-bearing deposits at banks of $1.2 billion, partially offset by a decline in average balances of investment securities of $2.1 billion.Also contributing to the improvement was a widening of the net interest margin to 3.84% in 2019 from 3.83% in 2018.
Average loans and leases rose 2% to $89.5 billion in 2019 from $87.4 billion in 2018. Average balances of commercial loans and leases increased $1.5 billion or 7% to $23.3 billion in 2019 from $21.8 billion in 2018. Average commercial real estate loan balances were up $1.2 billion or 4% to $34.9 billion in 2019 from $33.7 billion in 2018. Consumer loans averaged $14.6 billion in 2019, up $1.1 billion or 8% from $13.6 billion in 2018, due to growth in recreational finance loans and automobile loans that was partially offset by declines in outstanding balances of home equity loans and lines of credit. Recreational finance loans predominantly consisted of loans to consumers that are secured by recreational vehicles and boats. Average residential real estate loans declined $1.7 billion or 9% to $16.7 billion in 2019 from $18.3 billion in 2018, predominantly due to ongoing repayments of loans obtained in the 2015 acquisition of Hudson City Bancorp, Inc. (“Hudson City”).
Taxable-equivalent net interest income in 2018 increased 7% from $3.82 billion in 2017. That growth resulted from a widening of the net interest margin to 3.83% in 2018 from 3.47% in 2017. The improvement in the net interest margin was predominantly the result of higher yields on loans due to the higher interest rate environment in 2018. The Federal Reserve raised its target Federal funds rate in .25% increments three times during 2017 and four times during 2018. Partially offsetting the favorable impact of higher interest rates was a $3.2 billion, or 3%, decline in average earning assets to $106.8 billion in 2018 from $110.0 billion in 2017 that reflected decreases in average balances of investment securities of $1.8 billion and average loan and lease balances of $1.4 billion.
Average loans and leases declined to $87.4 billion in 2018 from $88.8 billion in 2017. Average balances of commercial loans and leases decreased $149 million or 1% to $21.8 billion in 2018 from $22.0 billion in 2017. Average balances of commercial real estate loans increased $485 million or 1% to $33.7 billion in 2018 from $33.2 billion in 2017. Consumer loans averaged $13.6 billion in 2018, up $930 million or 7% from $12.6 billion in 2017, due to growth in recreational finance loans and automobile loans that was partially offset by declines in outstanding balances of home equity loans and lines of credit. Average residential real estate loans declined $2.7 billion or 13% to $18.3 billion in 2018 from $21.0 billion in 2017, predominantly due to ongoing repayments of loans obtained in the acquisition of Hudson City.
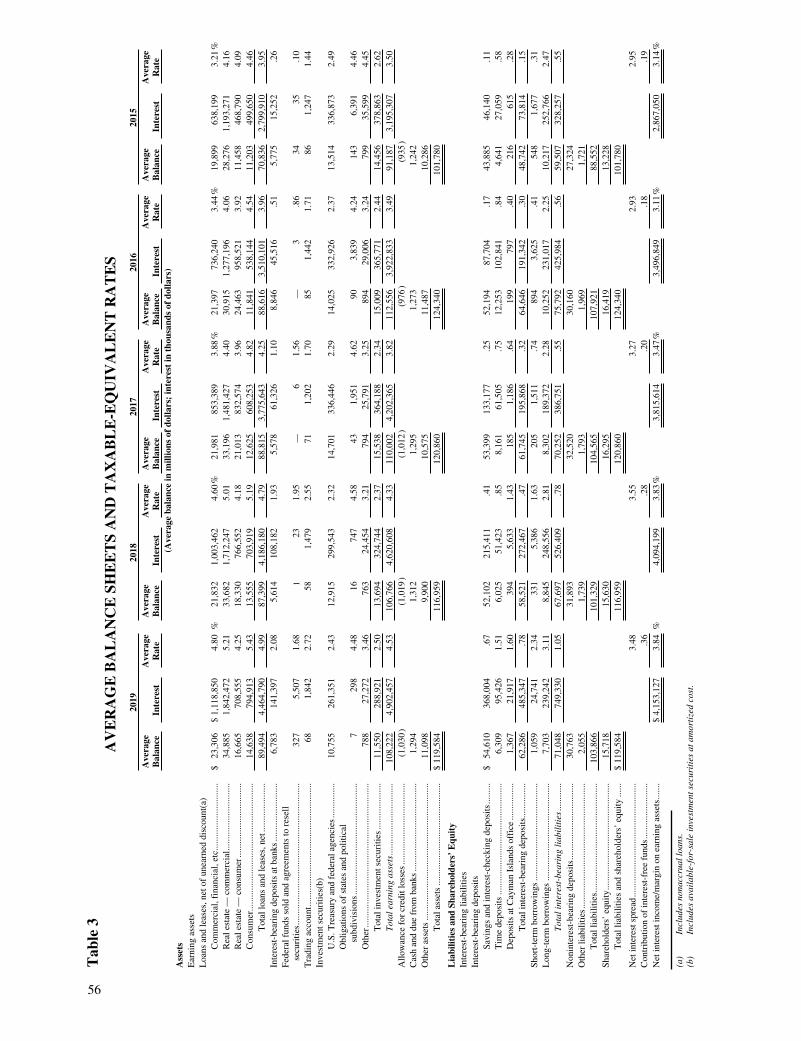
Tab
le 3
AV
ER
AG
E B
AL
AN
CE
SH
EE
TS
AN
D T
AX
AB
LE
-EQ
UIV
AL
EN
T R
AT
ES
2019
20
18
20
17
20
16
20
15
A
vera
geB
alan
ce
In
tere
st
Ave
rage
Rat
e
Ave
rage
Bal
ance
In
tere
st
Ave
rage
Rat
e
Ave
rage
Bal
ance
In
tere
st
Ave
rage
Rat
e
Ave
rage
Bal
ance
In
tere
st
Ave
rage
Rat
e
Ave
rage
Bal
ance
In
tere
st
Ave
rage
Rat
e
(Ave
rage
bal
ance
in m
illio
ns o
f do
llars
; in
tere
st in
tho
usan
ds o
f do
llars
)
Ass
ets
Ear
ning
ass
ets
Loa
ns a
nd le
ases
, net
of
unea
rned
dis
coun
t(a)
Com
mer
cial
, fin
anci
al, e
tc...
......
......
......
......
.. $
23,3
06
$1,
118,
850
4.80
%
21,8
32
1,
003,
462
4.60
%
21,9
81
85
3,38
9
3.
88%
21
,397
736,
240
3.44
%
19,8
99
63
8,19
9
3.
21%
Rea
l est
ate
— c
omm
erci
al...
......
......
......
......
..
34,8
85
1,
842,
472
5.21
33,6
82
1,
712,
247
5.01
33,1
96
1,
481,
427
4.40
30,9
15
1,
277,
196
4.06
28,2
76
1,
193,
271
4.16
R
eal e
stat
e —
con
sum
er...
......
......
......
......
.....
16
,665
708,
555
4.25
18,3
30
76
6,55
2
4.
18
21
,013
832,
574
3.96
24,4
63
95
8,52
1
3.
92
11
,458
468,
790
4.09
C
onsu
mer
......
......
......
......
......
......
......
......
......
.
14,6
38
79
4,91
3
5.
43
13
,555
703,
919
5.19
12,6
25
60
8,25
3
4.
82
11
,841
538,
144
4.54
11,2
03
49
9,65
0
4.
46
Tot
al lo
ans
and
leas
es, n
et...
......
......
......
89
,494
4,46
4,79
0
4.
99
87
,399
4,18
6,18
0
4.
79
88
,815
3,77
5,64
3
4.
25
88
,616
3,51
0,10
1
3.
96
70
,836
2,79
9,91
0
3.
95
Inte
rest
-bea
ring
dep
osits
at b
anks
......
......
......
......
.
6,78
3
14
1,39
7
2.
08
5,
614
108,
182
1.93
5,57
8
61
,326
1.10
8,84
6
45
,516
.51
5,77
5
15
,252
.26
Fe
dera
l fun
ds s
old
and
agre
emen
ts to
res
ell
se
curi
ties.
......
......
......
......
......
......
......
......
......
......
32
7
5,
507
1.68
1
23
1.95
—
6
1.56
—
3
.86
34
35
.10
T
radi
ng a
ccou
nt...
......
......
......
......
......
......
......
......
..
68
1,
842
2.72
58
1,
479
2.55
71
1,
202
1.70
85
1,
442
1.71
86
1,
247
1.44
In
vest
men
t sec
uriti
es(b
)
U
.S. T
reas
ury
and
fede
ral a
genc
ies.
......
......
..
10,7
55
26
1,35
1
2.
43
12
,915
299,
543
2.32
14,7
01
33
6,44
6
2.
29
14
,025
332,
926
2.37
13,5
14
33
6,87
3
2.
49
Obl
igat
ions
of
stat
es a
nd p
oliti
cal
su
bdiv
isio
ns...
......
......
......
......
......
......
......
...
7
29
8
4.
48
16
747
4.58
43
1,
951
4.62
90
3,
839
4.24
143
6,39
1
4.
46
Oth
er...
......
......
......
......
......
......
......
......
......
.....
78
8
27
,272
3.46
763
24,4
54
3.
21
79
4
25
,791
3.25
894
29,0
06
3.
24
79
9
35
,599
4.45
T
otal
inve
stm
ent s
ecur
ities
......
......
......
..
11,5
50
28
8,92
1
2.
50
13
,694
324,
744
2.37
15,5
38
36
4,18
8
2.
34
15
,009
365,
771
2.44
14,4
56
37
8,86
3
2.
62
Tot
al e
arni
ng a
sset
s....
......
......
......
......
...
108,
222
4,90
2,45
7
4.
53
10
6,76
6
4,
620,
608
4.33
110,
002
4,20
2,36
5
3.
82
11
2,55
6
3,
922,
833
3.49
91,1
87
3,
195,
307
3.50
A
llow
ance
for
cre
dit l
osse
s....
......
......
......
......
......
.
(1,0
30)
(1
,019
)
(1,0
12)
(9
76)
(9
35)
Cas
h an
d du
e fr
om b
anks
......
......
......
......
......
......
..
1,29
4
1,
312
1,29
5
1,
273
1,24
2
Oth
er a
sset
s...
......
......
......
......
......
......
......
......
......
..
11,0
98
9,
900
10,5
75
11
,487
10,2
86
Tot
al a
sset
s...
......
......
......
......
......
......
.....
$11
9,58
4
11
6,95
9
12
0,86
0
12
4,34
0
10
1,78
0
Lia
bilit
ies
and
Shar
ehol
ders
’ E
quit
y
In
tere
st-b
eari
ng li
abili
ties
Inte
rest
-bea
ring
dep
osits
Savi
ngs
and
inte
rest
-che
ckin
g de
posi
ts...
......
$54
,610
368,
004
.67
52,1
02
21
5,41
1
.4
1
53
,399
133,
177
.25
52,1
94
87
,704
.17
43,8
85
46
,140
.11
T
ime
depo
sits
......
......
......
......
......
......
......
......
6,
309
95,4
26
1.
51
6,
025
51,4
23
.8
5
8,
161
61,5
05
.7
5
12
,253
102,
841
.84
4,64
1
27
,059
.58
D
epos
its a
t Cay
man
Isl
ands
off
ice
......
......
....
1,
367
21,9
17
1.
60
39
4
5,
633
1.43
185
1,18
6
.6
4
19
9
79
7
.4
0
21
6
61
5
.2
8
Tot
al in
tere
st-b
eari
ng d
epos
its...
......
......
62
,286
485,
347
.78
58,5
21
27
2,46
7
.4
7
61
,745
195,
868
.32
64,6
46
19
1,34
2
.3
0
48
,742
73,8
14
.1
5
Shor
t-te
rm b
orro
win
gs...
......
......
......
......
......
......
...
1,05
9
24
,741
2.34
331
5,38
6
1.
63
20
5
1,
511
.74
894
3,62
5
.4
1
54
8
1,
677
.31
L
ong-
term
bor
row
ings
......
......
......
......
......
......
......
7,
703
239,
242
3.11
8,84
5
24
8,55
6
2.
81
8,
302
189,
372
2.28
10,2
52
23
1,01
7
2.
25
10
,217
252,
766
2.47
T
otal
inte
rest
-bea
ring
liab
ilit
ies.
......
.....
71
,048
749,
330
1.05
67,6
97
52
6,40
9
.7
8
70
,252
386,
751
.55
75,7
92
42
5,98
4
.5
6
59
,507
328,
257
.55
N
onin
tere
st-b
eari
ng d
epos
its...
......
......
......
......
......
30
,763
31,8
93
32
,520
30,1
60
27
,324
O
ther
liab
ilitie
s....
......
......
......
......
......
......
......
......
..
2,05
5
1,
739
1,79
3
1,
969
1,72
1
Tot
al li
abili
ties.
......
......
......
......
......
......
......
....
10
3,86
6
10
1,32
9
10
4,56
5
10
7,92
1
88
,552
Sh
areh
olde
rs’
equi
ty...
......
......
......
......
......
......
......
.
15,7
18
15
,630
16,2
95
16
,419
13,2
28
Tot
al li
abili
ties
and
shar
ehol
ders
’ eq
uity
......
$11
9,58
4
11
6,95
9
12
0,86
0
12
4,34
0
10
1,78
0
Net
inte
rest
spr
ead
......
......
......
......
......
......
......
......
.
3.48
3.55
3.27
2.93
2.95
C
ontr
ibut
ion
of in
tere
st-f
ree
fund
s....
......
......
......
..
.36
.28
.20
.18
.19
N
et in
tere
st in
com
e/m
argi
n on
ear
ning
ass
ets.
......
$4,
153,
127
3.84
%
4,09
4,19
9
3.
83%
3,
815,
614
3.47
%
3,49
6,84
9
3.
11%
2,
867,
050
3.14
%
(a)
Incl
udes
non
accr
ual l
oans
.(b
)In
clud
es a
vail
able
-for
-sal
e in
vest
men
t sec
urit
ies
at a
mor
tize
d co
st.
56

57
Table 4 summarizes average loans and leases outstanding in 2019 and percentage changes in the major components of the portfolio over the past two years.
Table 4
AVERAGE LOANS AND LEASES(Net of unearned discount)
Percent Increase (Decrease) from
2019 2018 to
2019 2017 to
2018
(In millions) Commercial, financial, etc. ....................................................................... $ 23,306 7 % (1) %Real estate — commercial ........................................................................ 34,885 4 1 Real estate — consumer ........................................................................... 16,665 (9) (13) Consumer
Recreational finance............................................................................ 4,838 31 30 Home equity lines and loans ............................................................... 4,659 (8) (7) Automobile.......................................................................................... 3,768 5 10 Other.................................................................................................... 1,373 12 14
Total consumer .............................................................................. 14,638 8 7 Total ......................................................................................... $ 89,494 2 % (2) %
Commercial loans and leases, excluding loans secured by real estate, totaled $23.8 billion at December 31, 2019, representing 26% of total loans and leases. Table 5 presents information on commercial loans and leases as of December 31, 2019 relating to geographic area, size, borrower industry and whether the loans are secured by collateral or unsecured. Of the $23.8 billion of commercial loans and leases outstanding at the end of 2019, approximately $21.5 billion, or 90%, were secured, while 36%, 22% and 25% were granted to businesses in New York State, Pennsylvania and in the Mid-Atlantic area (which includes Delaware, Maryland, New Jersey, Virginia, West Virginia and the District of Columbia), respectively. The Company provides financing for leases to commercial customers, primarily for equipment. Commercial leases included in total commercial loans and leases at December 31, 2019 aggregated $1.3 billion, of which 51% were secured by collateral located in New York State, 13% were secured by collateral in Pennsylvania and another 18% were secured by collateral in the Mid-Atlantic area.

58
Table 5
COMMERCIAL LOANS AND LEASES, NET OF UNEARNED DISCOUNT(Excludes Loans Secured by Real Estate)
December 31, 2019
Mid- Percent of New York Pennsylvania Atlantic(a) Other Total Total (Dollars in millions)
Motor vehicle and recreational finance dealers ................................
$1,788 $ 1,190 $ 687 $1,424 $ 5,089 21%
Services.............................................. 1,365 694 1,298 412 3,769 16 Manufacturing ................................... 1,248 722 585 440 2,995 12 Wholesale .......................................... 771 722 572 231 2,296 10 Financial and insurance ..................... 711 242 387 476 1,816 7 Health services................................... 650 206 659 106 1,621 7 Real estate investors .......................... 705 167 432 203 1,507 6 Transportation, communications, utilities ............................................
405 281 479 285 1,450 6
Retail.................................................. 351 318 412 322 1,403 6 Construction ...................................... 382 311 375 88 1,156 5 Public administration......................... 124 57 20 1 202 1 Agriculture, forestry, fishing, etc. ..... 19 57 34 14 124 1 Other .................................................. 79 225 59 47 410 2 Total................................................... $8,598 $ 5,192 $5,999 $4,049 $23,838 100%
Percent of total................................... 36% 22% 25% 17% 100%
Percent of dollars outstanding Secured .............................................. 82% 86% 85% 88% 85% Unsecured .......................................... 10 11 11 6 10 Leases ................................................ 8 3 4 6 5 Total................................................... 100% 100% 100% 100% 100%
Percent of dollars outstanding by size of loan
Less than $1 million .......................... 23% 17% 25% 11% 21% $1 million to $5 million..................... 23 22 21 19 22 $5 million to $10 million................... 15 19 14 18 16 $10 million to $20 million................. 16 23 15 20 18 $20 million to $30 million................. 9 10 8 11 9 $30 million to $50 million................. 5 6 8 9 6 Greater than $50 million.................... 9 3 9 12 8 Total................................................... 100% 100% 100% 100% 100%
(a) Includes Delaware, Maryland, New Jersey, Virginia, West Virginia and the District of Columbia.
International loans included in commercial loans and leases totaled $121 million and $109 million at December 31, 2019 and 2018, respectively. Included in such loans were $93 million and $78 million, respectively, of loans at M&T Bank’s commercial banking office in Ontario, Canada. The remaining international loans are predominantly to domestic companies with foreign operations.

59
Loans secured by real estate, including outstanding balances of home equity loans and lines of credit which the Company classifies as consumer loans, represented approximately 63% of the loan and lease portfolio during 2019, compared with 65% and 67% in 2018 and 2017, respectively. At December 31, 2019, the Company held approximately $35.5 billion of commercial real estate loans (including $28 million originated for sale), $16.2 billion of consumer real estate loans secured by one-to-four family residential properties (including $414 million of loans originated for sale) and $4.5 billion of outstanding balances of home equity loans and lines of credit, compared with $34.4 billion, $17.2 billion and $4.9 billion, respectively, at December 31, 2018. The decrease in residential real estate loans reflects the continued pay down of loans obtained in the Hudson City acquisition. Included in commercial real estate loans at December 31, 2019 and 2018 were construction loans of $8.9 billion and $8.8 billion, respectively, including amounts due from builders and developers of residential real estate aggregating $1.5 billion and $1.7 billion at December 31, 2019 and 2018, respectively. Commercial real estate loans included loans held for sale totaling $28 million and $347 million at December 31, 2019 and 2018, respectively. International loans included in commercial real estate loans totaled $54 million at December 31, 2019 and $49 million at December 31, 2018.
Commercial real estate loans originated by the Company include both fixed and variable rate instruments with monthly payments and a balloon payment of the remaining unpaid principal at maturity. Maturity dates generally range from five to ten years and, for borrowers in good standing, the terms of such loans may be extended by the customer following maturity at the then-current market rate of interest. Adjustable-rate commercial real estate loans represented approximately 77% of the commercial real estate loan portfolio at the 2019 year-end. Table 6 presents commercial real estate loans by geographic area, type of collateral and size of the loans outstanding at December 31, 2019. New York City area commercial real estate loans totaled $8.8 billion at December 31, 2019. The $7.8 billion of investor-owned commercial real estate loans in the New York City area were largely secured by multifamily residential properties, retail space and office space. The Company’s experience has been that office, retail and service-related properties tend to demonstrate more volatile fluctuations in value through economic cycles and changing economic conditions than do multifamily residential properties. Approximately 66% of the aggregate dollar amount of New York City area loans were for loans with outstanding balances of $30 million or less, while loans of more than $50 million made up approximately 19% of the total.

60
Table 6
COMMERCIAL REAL ESTATE LOANS, NET OF UNEARNED DISCOUNT
December 31, 2019
New York State New York Penn- Mid- Percent of City Other sylvania Atlantic(a) Other Total Total (Dollars in millions)
Investor-owned Permanent finance by property type
Office ............................................... $ 1,312 $ 1,004 $ 492 $ 1,089 $ 571 $ 4,468 13% Retail/Service ................................... 1,468 602 349 1,046 901 4,366 12 Apartments/Multifamily................... 1,609 1,006 531 426 654 4,226 12 Hotel................................................. 618 373 276 736 626 2,629 7 Health facilities ................................ 408 436 397 636 565 2,442 7 Industrial/Warehouse ....................... 235 238 299 433 324 1,529 4 Other................................................. 120 28 14 54 3 219 1
Total permanent ......................... 5,770 3,687 2,358 4,420 3,644 19,879 56% Construction/Development
Commercial Construction.................................. 1,518 722 622 1,771 1,677 6,310 18% Land/Land development ............... 268 34 24 196 121 643 2
Residential builder and developer
Construction.................................. 252 8 40 259 510 1,069 3 Land/Land development ............... 32 17 41 130 259 479 1 Total construction/ development............................ 2,070 781 727 2,356 2,567 8,501 24%
Total investor-owned .............................. 7,840 4,468 3,085 6,776 6,211 28,380 80% Owner-occupied by industry(b)
Other services................................... 218 429 186 580 54 1,467 4% Motor vehicle and recreational finance dealers................................ 169 199 322 213 261 1,164 3 Retail ................................................ 150 152 307 412 136 1,157 3 Health services ................................. 125 382 168 200 28 903 3 Wholesale......................................... 106 80 113 354 128 781 2 Manufacturing.................................. 95 201 113 140 42 591 2 Real estate investors......................... 11 42 59 92 5 209 1 Other................................................. 130 186 242 322 10 890 2
Total owner-occupied ................ 1,004 1,671 1,510 2,313 664 7,162 20% Total commercial real estate ................... $ 8,844 $ 6,139 $ 4,595 $ 9,089 $ 6,875 $ 35,542 100%
Percent of total ........................................ 25% 17% 13% 26% 19% 100%
Percent of dollars outstanding by size of loan Less than $1 million................................ 4% 14% 12% 11% 8% 9% $1 million to $5 million .......................... 15 25 22 19 12 18 $5 million to $10 million ........................ 14 19 19 17 14 16 $10 million to $30 million ...................... 33 32 29 29 40 33 $30 million to $50 million ...................... 15 7 11 14 15 13 $50 million to $100 million .................... 16 1 7 10 11 10 Greater than $100 million ....................... 3 2 — — — 1 Total ........................................................ 100% 100% 100% 100% 100% 100%
(a) Includes Delaware, Maryland, New Jersey, Virginia, West Virginia and the District of Columbia.(b) Includes $383 million of construction loans.
61
Commercial real estate loans secured by properties located in other parts of New York State, Pennsylvania and the Mid-Atlantic area tend to have a greater diversity of collateral types and include a significant amount of lending to customers who use the mortgaged property in their trade or business (owner-occupied). Approximately 90% of the aggregate dollar amount of commercial real estate loans in New York State secured by properties located outside of the New York City area were for loans with outstanding balances of $30 million or less. Of the outstanding balances of commercial real estate loans in Pennsylvania and the Mid-Atlantic area, approximately 82% and 76%, respectively, were for loans with outstanding balances of $30 million or less.
Commercial real estate loans secured by properties located outside of Pennsylvania, the Mid-Atlantic area and New York State comprised 19% of total commercial real estate loans as of December 31, 2019.
Commercial real estate construction and development loans made to investors presented in table 6 totaled $8.5 billion at December 31, 2019, or 9% of total loans and leases. Approximately 98% of those construction loans had adjustable interest rates. Included in such loans at the 2019 year-end were $1.5 billion of loans to builders and developers of residential real estate properties. The remainder of the commercial real estate construction loan portfolio was comprised of loans made for various purposes, including the construction of office buildings, multifamily residential housing, retail space and other commercial development.
M&T Realty Capital Corporation, a commercial real estate lending subsidiary of M&T Bank, participates in the Delegated Underwriting and Servicing (“DUS”) program of Fannie Mae, pursuant to which commercial real estate loans are originated in accordance with terms and conditions specified by Fannie Mae and sold. Under this program, loans are sold with partial credit recourse to M&T Realty Capital Corporation. The amount of recourse is generally limited to one-third of any credit loss incurred by the purchaser on an individual loan, although in some cases the recourse amount is less than one-third of the outstanding principal balance. The Company’s maximum credit risk for recourse associated with sold commercial real estate loans was approximately $3.9 billion and $3.4 billion at December 31, 2019 and 2018, respectively. There have been no material losses incurred as a result of those recourse arrangements. At December 31, 2019 and 2018, commercial real estate loans serviced by the Company for other investors were $21.0 billion and $18.2 billion, respectively. Reflected in commercial real estate loans serviced for others were loans sub-serviced for others that had outstanding balances of $3.4 billion and $2.7 billion at December 31, 2019 and 2018, respectively.
Real estate loans secured by one-to-four family residential properties were $16.2 billion at December 31, 2019, including approximately 36% secured by properties located in New York State, 7% secured by properties located in Pennsylvania, 24% secured by properties in New Jersey and 14% secured by properties located in other Mid-Atlantic areas. The Company’s portfolio of alternative (“Alt-A”) residential real estate loans (referred to as “limited documentation loans”) held for investment totaled $2.1 billion at December 31, 2019, down from $2.5 billion at December 31, 2018. That portfolio consisted predominantly of limited documentation loans acquired with the Hudson City transaction. Alt-A loans represent loans that at origination typically included some form of limited borrower documentation requirements as compared with more traditional residential real estate loans. Hudson City loans that were eligible for limited documentation processing were available in amounts up to 65% of the lower of the appraised value or purchase price of the property. Hudson City discontinued its limited documentation loan program in January 2014. Loans to individuals to finance the construction of one-to-four family residential properties totaled $94 million at December 31, 2019 and $41 million at December 31, 2018, or approximately .1% of total loans and leases at each of those dates. Information about the credit performance of the Company’s residential real estate loans is included herein under the heading “Provision For Credit Losses.”

62
Consumer loans comprised approximately 17% and 16% of total loans and leases at December 31, 2019 and 2018, respectively. Outstanding balances of recreational finance loans represented the largest component of the consumer loan portfolio at December 31, 2019 and totaled $5.5 billion or approximately 6% of total loans, up from $4.1 billion or 5% at December 31, 2018. That growth was due largely to originations through new dealer relationships. Home equity loans and lines of credit outstanding at December 31, 2019 and December 31, 2018 were $4.5 billion and $4.9 billion, respectively. Approximately 40% of home equity loans and lines of credit outstanding at December 31, 2019 were secured by properties in New York State, 24% in Maryland, 21% in Pennsylvania and 4% in New Jersey. Outstanding automobile loan balances rose to $3.9 billion at December 31, 2019 from $3.7 billion at December 31, 2018. That increase reflects continued consumer demand for motor vehicles.
Table 7 presents the composition of the Company’s loan and lease portfolio at the end of 2019, including outstanding balances to businesses and consumers in New York State, Pennsylvania, the Mid-Atlantic area and other states.
Table 7
LOANS AND LEASES, NET OF UNEARNED DISCOUNT
December 31, 2019
Percent of Dollars Outstanding Mid-Atlantic New Penn- New Outstandings York sylvania Maryland Jersey Other(a) Other (In millions)
Real estate Residential ................................ $ 16,156 36% 7% 7% 24% 7% 19% Commercial............................... 35,542 42 13 9 7 10 19
Total real estate .................... 51,698 40% 11% 9% 12% 9% 19% Commercial, financial, etc............. 22,564 35% 22% 12% 7% 7% 17% Consumer
Recreational finance ................. 5,536 13% 6% 4% 4% 5% 68% Home equity lines and loans..... 4,482 40 21 24 4 9 2 Automobile ............................... 3,887 25 17 11 7 15 25 Other secured or guaranteed ..... 392 21 11 13 2 23 30 Other unsecured ........................ 1,090 39 20 25 3 10 3
Total consumer..................... 15,387 26% 14% 13% 5% 10% 32% Total loans ....................... 89,649 36% 15% 10% 10% 8% 21%
Commercial leases......................... 1,274 51% 13% 10% 6% 2% 18% Total loans and leases...... $ 90,923 37% 15% 10% 9% 8% 21%
(a) Includes Delaware, Virginia, West Virginia and the District of Columbia.
The investment securities portfolio averaged $11.6 billion in 2019, down from $13.7 billion and $15.5 billion in 2018 and 2017, respectively. The decline in average balances of investment securities in 2019 and 2018 was predominantly due to maturities and pay downs of mortgage-backed securities and maturities of U.S. Treasury notes. During 2019 and 2018, the Company purchased $500 million and $450 million, respectively, of U.S. Treasury notes. During 2017, the Company
63
purchased $1.4 billion of mortgage-backed securities, predominantly Ginnie Mae and Freddie Mac securities, and $219 million of U.S. Treasury notes. The Company sold $512 million of available-for-sale Fannie Mae and Freddie Mac mortgage-backed securities during 2017 largely due to the limitations on the amount of those types of securities that were permitted to be included in the highest tier of “high quality liquid assets” for the Liquidity Coverage Ratio (“LCR”) calculation. The Company also sold a portion of its holdings of Fannie Mae and Freddie Mac preferred stock during December 2017 for a gain of $18 million. The preferred stock sold had a cost basis (after previous write-downs) of $3 million. Sales of investment securities were not significant in 2019 or 2018. The Company routinely has increases and decreases in its holdings of capital stock of the Federal Home Loan Bank (“FHLB”) of New York and the Federal Reserve Bank of New York. Those holdings are accounted for at cost and are adjusted based on the amounts of outstanding borrowings and available lines of credit with those entities.
The investment securities portfolio is largely comprised of residential mortgage-backed securities and shorter-term U.S. Treasury and federal agency notes. When purchasing investment securities, the Company considers its liquidity position and its overall interest-rate risk profile as well as the adequacy of expected returns relative to risks assumed, including prepayments. The Company may occasionally sell investment securities as a result of changes in interest rates and spreads, actual or anticipated prepayments, credit risk associated with a particular security, or as a result of restructuring its investment securities portfolio in connection with a business combination. The amounts of investment securities held by the Company are influenced by such factors as demand for loans, which generally yield more than investment securities, ongoing repayments, the levels of deposits, and management of liquidity and balance sheet size and resulting capital ratios.
Effective January 1, 2018, fair value changes in equity securities with readily determinable fair values are recognized in the consolidated statement of income. Net unrealized gains on such equity securities were $18 million in 2019, compared with net unrealized losses of $6 million in 2018. Those gains and losses were predominantly related to the Company’s holdings of Fannie Mae and Freddie Mac preferred stock.
The Company regularly reviews its investment securities for declines in value below amortized cost that might be characterized as “other than temporary.” There were no other-than-temporary impairment charges recognized in the investment securities portfolio in 2019, 2018 or 2017. Based on management’s assessment of future cash flows associated with individual investment securities as of December 31, 2019, the Company concluded that declines in value below amortized cost associated with the investment securities portfolio were temporary in nature. A further discussion of fair values of investment securities is included herein under the heading “Capital.” Additional information about the investment securities portfolio is included in notes 2 and 20 of Notes to Financial Statements.
Other earning assets include interest-bearing deposits at the Federal Reserve Bank of New York and other banks, trading account assets, federal funds sold and agreements to resell securities. Those other earning assets in the aggregate averaged $7.2 billion in 2019, $5.7 billion in 2018 and $5.6 billion in 2017. Interest-bearing deposits at banks averaged $6.8 billion in 2019, compared with $5.6 billion in each of 2018 and 2017. The amounts of interest-bearing deposits at banks at the respective dates were predominantly comprised of deposits held at the Federal Reserve Bank of New York. The levels of those deposits often fluctuate due to changes in trust-related deposits of commercial entities, purchases or maturities of investment securities, or borrowings to manage the Company’s liquidity.
The most significant source of funding for the Company is core deposits. The Company considers noninterest-bearing deposits, interest-bearing transaction accounts, savings deposits and time deposits of $250,000 or less as core deposits. The Company’s branch network is its principal source of core deposits, which generally carry lower interest rates than wholesale funds of comparable maturities. Average core deposits were $87.9 billion in 2019, compared with $87.3 billion in 2018 and $92.1 billion in 2017. Average balances of savings and interest-checking core

64
deposits rose $1.7 billion or 3% in 2019 to $51.9 billion from $50.1 billion in 2018. That increase was predominantly due to higher residential mortgage escrow deposits, resulting from additions to the Company’s servicing and sub-servicing portfolios in 2019, and higher commercial and trust deposits. Average noninterest-bearing deposits declined $1.1 billion or 4% to $30.8 billion in 2019 from $31.9 billion in 2018. Contributing to that decline were lower deposits associated with commercial and trust customers, partially offset by higher mortgage escrow deposits. The lower commercial deposits were largely due to a shift of such deposits from noninterest-bearing to interest-bearing products. Average core deposits in 2018 declined $4.7 billion or 5% as compared with 2017. Average savings and interest-checking core deposit balances decreased $2.1 billion or 4% in 2018 from 2017, largely due to lower money-market savings deposit balances associated with commercial and consumer customers. Average balances of core time deposits in 2018 decreased $2.0 billion or 27% from 2017 predominantly related to maturities of relatively high-rate time deposits, in part, obtained in the Hudson City acquisition. Reflecting lower commercial and trust customer deposits, average noninterest-bearing deposits in 2018 declined $627 million or 2% from 2017. Funding provided by core deposits represented 81% of average earning assets in 2019, compared with 82% in 2018 and 84% in 2017. Table 8 summarizes average core deposits in 2019 and percentage changes in the components of such deposits over the past two years. Core deposits totaled $89.5 billion and $85.5 billion at December 31, 2019 and 2018, respectively.
Table 8
AVERAGE CORE DEPOSITS
Percent Increase (Decrease) from
2019 2018 to
2019 2017 to
2018
(In millions)
Savings and interest-checking deposits.................................................... $ 51,881 3 % (4) %Time deposits ........................................................................................... 5,238 (2) (27) Noninterest-bearing deposits.................................................................... 30,763 (4) (2) Total ......................................................................................................... $ 87,882 1 % (5) %
The Company also receives funding from other deposit sources, including branch-related time deposits over $250,000, deposits associated with the Company’s Cayman Islands office, and brokered deposits. Time deposits over $250,000, excluding brokered deposits, averaged $956 million in 2019, $675 million in 2018 and $775 million in 2017. The increase in such deposits from 2018 to 2019 was predominantly the result of the generally higher interest rate environment and customers’ desire to earn a higher return on their deposits. The decline in such deposits in 2018 from 2017 was predominantly the result of maturities of higher-rate time deposits. Cayman Islands office deposits averaged $1.4 billion in 2019, $394 million in 2018 and $185 million in 2017. The increase in such deposits in 2019 from the prior years resulted from customers’ desire to sweep their deposit balances into higher earning products. The Company had brokered savings and interest-bearing transaction accounts that averaged $2.7 billion in 2019, $2.0 billion in 2018 and $1.2 billion in 2017. Additional amounts of Cayman Islands office deposits or brokered deposits may be added in the future depending on market conditions, including demand by customers and other investors for those deposits, and the cost of funds available from alternative sources at the time.

65
Table 9 summarizes average total deposits for 2019, 2018 and 2017.
Table 9
AVERAGE DEPOSITS
Retail Trust Commercialand Other Total
(In millions) 2019 Savings and interest-checking deposits.................................... $ 26,814 $ 6,453 $ 21,343 $ 54,610 Time deposits ........................................................................... 5,739 46 524 6,309 Noninterest-bearing deposits.................................................... 5,352 4,219 21,192 30,763 Deposits at Cayman Islands office ........................................... — — 1,367 1,367 Total ......................................................................................... $ 37,905 $ 10,718 $ 44,426 $ 93,049
2018 Savings and interest-checking deposits.................................... $ 28,381 $ 5,445 $ 18,276 $ 52,102 Time deposits ........................................................................... 5,656 34 335 6,025 Noninterest-bearing deposits.................................................... 5,064 4,363 22,466 31,893 Deposits at Cayman Islands office ........................................... — — 394 394 Total ......................................................................................... $ 39,101 $ 9,842 $ 41,471 $ 90,414
2017 Savings and interest-checking deposits.................................... $ 29,506 $ 4,793 $ 19,100 $ 53,399 Time deposits ........................................................................... 7,737 11 413 8,161 Noninterest-bearing deposits.................................................... 4,803 4,520 23,197 32,520 Deposits at Cayman Islands office ........................................... — — 185 185 Total ......................................................................................... $ 42,046 $ 9,324 $ 42,895 $ 94,265
The Company also uses borrowings from banks, securities dealers, various FHLBs, the Federal Reserve Bank of New York and others as sources of funding. Short-term borrowings represent arrangements that at the time they were entered into had a contractual maturity of one year or less. Average short-term borrowings were $1.1 billion in 2019, $331 million in 2018 and $205 million in 2017. In December 2018, the Company borrowed $4.2 billion from the FHLB of New York for LCR and other liquidity purposes, $3.0 billion of which matured on the first business day of 2019 and $1.2 billion matured on February 1, 2019. The Federal Reserve and other Federal bank regulators finalized the Tailoring Rules in October 2019, as described in Part I, Item 1 of this Annual Report on Form 10-K under the heading “Enhanced Prudential Standards.” As a result, M&T is classified as a Category IV firm and, as such, is no longer subject to LCR requirements as of December 31, 2019. However, M&T will continue to remain subject to the internal liquidity stress test requirements under the Federal Reserve Board’s regulations, which include 30-day and 1-year planning horizons. Included in short-term borrowings were unsecured federal funds borrowings, which generally mature on the next business day, that averaged $207 million, $206 million and $132 million in 2019, 2018 and 2017, respectively. Overnight federal funds borrowings totaled $137 million at December 31, 2018. There were no overnight federal funds borrowings outstanding at December 31, 2019.
Long-term borrowings averaged $7.7 billion in 2019, $8.8 billion in 2018 and $8.3 billion in 2017. Average balances of outstanding senior notes were $5.3 billion in 2019, compared with $5.9 billion and $4.8 billion in 2018 and 2017, respectively. Unsecured senior notes totaled $4.9 billion and $5.5 billion at December 31, 2019 and 2018, respectively. During January 2018, M&T Bank
66
issued $650 million of 2.625% fixed rate and $350 million of variable rate senior notes that pay interest quarterly and are indexed to the three-month LIBOR. Those fixed and variable rate notes mature in 2021. On December 31, 2018, M&T Bank redeemed $750 million of fixed rate senior notes that were due to mature on January 31, 2019. In addition, in July 2018 M&T issued $750 million of senior notes that mature in July 2023, of which $500 million have a 3.55% fixed interest rate and $250 million have a variable rate paid quarterly at rates that are indexed to the three-month LIBOR. On January 7, 2020, M&T Bank redeemed $750 million of fixed rate senior notes that were due to mature on February 6, 2020. Also included in average long-term borrowings were amounts borrowed from the Federal Home Loan Banks of New York and Pittsburgh of $241 million in 2019, compared with $577 million and $820 million in 2018 and 2017, respectively, and subordinated capital notes of $1.4 billion and $1.5 billion in 2019 and 2018, respectively, compared with $1.7 billion in 2017. During 2017, M&T Bank issued $500 million of fixed rate subordinated capital notes that mature in 2027. Junior subordinated debentures associated with trust preferred securities that were included in average long-term borrowings were $524 million in 2019, $521 million in 2018 and $518 million in 2017. Also included in long-term borrowings were agreements to repurchase securities, which averaged $245 million in 2019, $415 million in 2018 and $490 million during 2017. The repurchase agreement held at December 31, 2019 totaled $102 million and matures in 2020, however, the contractual maturities of the underlying securities extend beyond such repurchase date. Additional information regarding long-term borrowings, including information regarding contractual maturities of such borrowings, is provided in note 8 of Notes to Financial Statements.
The Company has utilized interest rate swap agreements to modify the repricing characteristics of certain components of its loans and long-term debt. As of December 31, 2019, interest rate swap agreements were used as fair value hedges of approximately $3.8 billion of outstanding fixed rate long-term borrowings. Additionally, interest rate swap agreements with a notional amount of $13.4 billion were used as cash flow hedges of interest payments associated with variable rate commercial real estate loans. Further information on interest rate swap agreements is provided herein and in note 18 of Notes to Financial Statements.
Changes in the composition of the Company’s earning assets and interest-bearing liabilities, as discussed herein, as well as changes in interest rates and spreads, can impact net interest income. Net interest spread, or the difference between the taxable-equivalent yield on earning assets and the rate paid on interest-bearing liabilities, was 3.48% in 2019, compared with 3.55% in 2018 and 3.27% in 2017. The yield on the Company’s earning assets increased 20 basis points to 4.53% in 2019 from 4.33% in 2018 and the rate paid on interest-bearing liabilities increased 27 basis points to 1.05% in 2019 from .78% in 2018. During 2017, the yield on earning assets was 3.82% and the rate paid on interest-bearing liabilities was .55%. The higher rates earned on assets and paid on liabilities in each comparison predominantly reflect the effect of increases in short-term interest rates initiated by the Federal Reserve during 2017 and 2018, partially offset in 2019 by decreases in such rates initiated during 2019. The increase in rates paid in 2019 on interest-bearing liabilities also reflects higher rates paid on mortgage escrow deposits associated with growth in the Company’s residential mortgage servicing activities. The rates paid on those deposits are often indexed to the federal funds rate or LIBOR, and are higher than the rates paid on most other savings and interest-checking deposit accounts.
Net interest-free funds consist largely of noninterest-bearing demand deposits and shareholders’ equity, partially offset by bank owned life insurance and non-earning assets, including goodwill and core deposit and other intangible assets. Net interest-free funds averaged $37.2 billion in 2019, compared with $39.1 billion in 2018 and $39.7 billion in 2017. The decreases in average net interest-free funds in 2019 as compared with 2018 and 2017 reflect declines in balances of noninterest-bearing deposits. Those deposits averaged $30.8 billion in 2019, $31.9 billion in 2018 and $32.5 billion in 2017. The declines in such balances since 2017 were largely due to lower levels of deposits

67
of commercial and trust customers. Shareholders’ equity averaged $15.7 billion, $15.6 billion and $16.3 billion in 2019, 2018 and 2017, respectively. Those balances reflect the impact of common share repurchases as discussed herein under the heading “Capital.” Goodwill and core deposit and other intangible assets averaged $4.6 billion in 2019 and $4.7 billion in each of 2018 and 2017. The cash surrender value of bank owned life insurance averaged $1.8 billion in each of 2019, 2018 and 2017. Increases in the cash surrender value of bank owned life insurance are not included in interest income, but rather are recorded in “other revenues from operations.” The contribution of net interest-free funds to net interest margin was .36% in 2019, .28% in 2018 and .20% in 2017. The increases in that contribution since 2017 reflect the higher rates on interest-bearing liabilities used to value net interest-free funds.
Reflecting the changes to the net interest spread and the contribution of net interest-free funds as described herein, the Company’s net interest margin was 3.84% in 2019, 3.83% in 2018 and 3.47% in 2017. Future changes in market interest rates or spreads, as well as changes in the composition of the Company’s portfolios of earning assets and interest-bearing liabilities that result in reductions in spreads, could adversely impact the Company’s net interest income and net interest margin.
Management assesses the potential impact of future changes in interest rates and spreads by projecting net interest income under several interest rate scenarios. In managing interest rate risk, the Company has utilized interest rate swap agreements to modify the repricing characteristics of certain portions of its earnings assets and interest-bearing liabilities. Periodic settlement amounts arising from these agreements are reflected in either the yields on earning assets or the rates paid on interest-bearing liabilities. The notional amount of interest rate swap agreements entered into for interest rate risk management purposes was $17.2 billion (excluding $40.4 billion of forward-starting swap agreements) at December 31, 2019, $7.3 billion (excluding $12.6 billion of forward-starting swap agreements) at December 31, 2018 and $7.4 billion (excluding $2.0 billion of forward-starting swap agreements) at December 31, 2017. Under the terms of those interest rate swap agreements, the Company received payments based on the outstanding notional amount at fixed rates and made payments at variable rates. At December 31, 2019, interest rate swap agreements with notional amounts of $13.35 billion were serving as cash flow hedges of interest payments associated with variable rate commercial real estate loans, compared with $2.85 billion at each of December 31, 2018 and 2017. At December 31, 2019, 2018 and 2017, interest swap agreements with notional amounts of $3.80 billion, $4.45 billion and $4.55 billion, respectively, were serving as fair value hedges of fixed rate long-term borrowings. The Company has entered into the forward-starting interest rate swap agreements predominantly to extend the term of its interest rate swap agreements serving as cash flow hedges, and provide a hedge against changing interest rates on certain of its variable rate loans.

68
In a fair value hedge, the fair value of the derivative (the interest rate swap agreement) and changes in the fair value of the hedged item are recorded in the Company’s consolidated balance sheet with the corresponding gain or loss recognized in current earnings. The difference between changes in the fair value of the interest rate swap agreements and the hedged items represents hedge ineffectiveness and coincident with the Company’s adoption of amended hedge accounting guidance on January 1, 2018 is recorded as an adjustment to the interest income or interest expense of the respective hedged item. Prior to 2018, hedge ineffectiveness was recorded in “other revenues from operations” in the Company’s consolidated statement of income. In a cash flow hedge, the effective portion of the derivative’s gain or loss is initially reported as a component of other comprehensive income and subsequently reclassified into earnings when the forecasted transaction affects earnings. The ineffective portion of the derivative’s gain or loss on cash flow hedges is accounted for similar to that associated with fair value hedges. The amounts of hedge ineffectiveness recognized in 2019, 2018 and 2017 were not material to the Company’s consolidated results of operations. Information regarding the fair value of interest rate swap agreements and hedge ineffectiveness is presented in note 18 of Notes to Financial Statements. Information regarding the effective portion of cash flow hedges is presented in note 15 of Notes to Financial Statements. The changes in the fair values of the interest rate swap agreements and the hedged items primarily result from the effects of changing interest rates and spreads. The average notional amounts of interest rate swap agreements entered into for interest rate risk management purposes, the related effect on net interest income and margin, and the weighted-average interest rates paid or received on those swap agreements are presented in table 10.
Table 10
INTEREST RATE SWAP AGREEMENTS
Year Ended December 31 . 2019 2018 2017 Amount Rate(a) Amount Rate(a) Amount Rate(a)
(Dollars in thousands)
Increase (decrease) in: Interest income .................................... $ 13,011 .01 %$ (13,339) (.01)%$ 3,916 — %Interest expense ................................... 15,136 .02 11,418 .02 (20,966) (.03) Net interest income/margin ................. $ (2,125) — %$ (24,757) (.03)%$ 24,882 .02 %
Average notional amount (c)..................... $16,248,356 $7,795,479 $4,766,575
Rate received (b) ....................................... 2.40 % 2.09 % 2.30 %Rate paid (b).............................................. 2.42 % 2.41 % 1.79 %
(a) Computed as a percentage of average earning assets or interest-bearing liabilities.(b) Weighted-average rate paid or received on interest rate swap agreements in effect during year.(c) Excludes forward-starting interest rate swap agreements not in effect during the year.
In addition to interest rate swap agreements, the Company has entered into interest rate floor agreements that are accounted for in the trading account rather than as hedging instruments but, nevertheless, provide the Company with protection against the possibility of future declines in interest rates on its earning assets. Outstanding notional amounts of such agreements totaled $15.6 billion at each of December 31, 2019 and December 31, 2018 and $6.3 billion at December 31, 2017. The agreements outstanding at the 2019 year-end matured in January and February 2020. The fair value of the interest rate floor agreements was $362 thousand at December 31, 2019, $1.9 million at December 31, 2018 and $3.7 million at December 31, 2017 and was included in trading account

69
assets in the consolidated balance sheet. Changes in the fair value of those agreements were recorded as “trading account and foreign exchange gains” in the consolidated statement of income.
Provision for Credit LossesThe Company maintains an allowance for credit losses that in management’s judgment appropriately reflects losses inherent in the loan and lease portfolio. A provision for credit losses is recorded to adjust the level of the allowance as deemed necessary by management. The provision for credit losses was $176 million in 2019, compared with $132 million in 2018 and $168 million in 2017. Net charge-offs of loans were $144 million in 2019, $130 million in 2018 and $140 million in 2017. Net charge-offs as a percentage of average loans and leases outstanding were .16% in each of 2019 and 2017, compared with .15% in 2018. A summary of the Company’s loan charge-offs, provision and allowance for credit losses is presented in table 11 and in note 4 of Notes to Financial Statements.
Table 11
LOAN CHARGE-OFFS, PROVISION AND ALLOWANCE FOR CREDIT LOSSES
2019 2018 2017 2016 2015 (Dollars in thousands)
Allowance for credit losses beginning balance ..................................................... $1,019,444 $1,017,198 $ 988,997 $955,992 $919,562 Charge-offs during year
Commercial, financial, leasing, etc. ......................................... 58,244 60,414 64,941 59,244 60,983 Real estate — construction .................... 10,280 262 267 137 3,221 Real estate — mortgage......................... 15,095 27,369 28,463 30,801 26,382 Consumer............................................... 154,089 143,196 130,927 141,073 107,787
Total charge-offs .............................. 237,708 231,241 224,598 231,255 198,373 Recoveries during year
Commercial, financial, leasing, etc. ......................................... 24,581 27,903 21,196 30,167 30,284 Real estate — construction .................... 1,355 19,379 8,894 4,062 6,308 Real estate — mortgage......................... 10,785 8,322 12,671 11,124 7,626 Consumer............................................... 56,614 45,883 42,038 28,907 20,585
Total recoveries ................................ 93,335 101,487 84,799 74,260 64,803 Net charge-offs ........................................... 144,373 129,754 139,799 156,995 133,570 Provision for credit losses........................... 176,000 132,000 168,000 190,000 170,000 Allowance for credit losses ending balance ..................................................... $1,051,071 $1,019,444 $1,017,198 $988,997 $955,992
Net charge-offs as a percent of: Provision for credit losses ..................... 82.03% 98.30% 83.21% 82.63% 78.57%Average loans and leases, net of unearned discount ............................... .16% .15% .16% .18% .19%
Allowance for credit losses as a percent of loans and leases, net of unearned discount, at year-end ................ 1.16% 1.15% 1.16% 1.09% 1.09%
Loans acquired in connection with acquisition transactions subsequent to 2008 were recorded at fair value with no carry-over of any previously recorded allowance for credit losses. Determining the fair value of the acquired loans required estimating cash flows expected to be collected on the loans

70
and discounting those cash flows at then-current interest rates. For acquired loans where fair value was less than outstanding principal as of the acquisition date and the resulting discount was due, at least in part, to credit deterioration, the excess of expected cash flows over the carrying value of the loans was recognized as interest income over the lives of loans. The difference between contractually required payments and the cash flows expected to be collected was referred to as the nonaccretable balance and was not recorded on the consolidated balance sheet. The nonaccretable balance reflected estimated future credit losses and other contractually required payments that the Company did not expect to collect. The Company regularly evaluated the reasonableness of its cash flow projections associated with such loans, including its estimates of lifetime principal losses. Any decreases to the expected cash flows required the Company to evaluate the need for an additional allowance for credit losses. Any significant increases in expected cash flows resulted in additional interest income to be recognized over the then-remaining lives of the loans. The carrying amount of loans acquired at a discount subsequent to 2008 and accounted for based on expected cash flows was $536 million and $727 million at December 31, 2019 and 2018, respectively. The nonaccretable balance related to remaining principal losses associated with loans acquired at a discount as of December 31, 2019 and 2018 is presented in table 12.
During each of the last three years, based largely on improving economic conditions and borrower repayment performance, the Company’s estimates of cash flows expected to be generated by loans acquired at a discount and accounted for based on expected cash flows improved, resulting in increases in the accretable yield. In 2019, estimated cash flows expected to be generated by acquired loans increased by $48 million, or approximately 5%, compared with increases of $55 million in 2018 and $66 million in 2017. Those improvements reflected higher estimated principal, interest and other recoveries, largely associated with commercial and residential real estate loans.
Table 12
NONACCRETABLE BALANCE — PRINCIPAL
Remaining balance
December 31,
2019 December 31,
2018
(In thousands)
Commercial, financial, leasing, etc............................................................................. $ 292 3,106 Commercial real estate ............................................................................................... 1,620 7,545 Residential real estate ................................................................................................. 15,830 25,817 Consumer.................................................................................................................... 733 6,099
Total ...................................................................................................................... $ 18,475 42,567
For acquired loans where the fair value exceeded the outstanding principal balance, the resulting premium is recognized as a reduction of interest income over the lives of the loans. Immediately following the acquisition date and thereafter, an allowance for credit losses is recorded for incurred losses inherent in the portfolio, consistent with the accounting for originated loans and leases. The carrying amount of loans acquired in 2015 at a premium was $7.4 billion and $9.3 billion at December 31, 2019 and December 31, 2018, respectively. GAAP does not allow the credit loss component of the net premium associated with those loans to be bifurcated and accounted for as a nonaccreting balance as is the case with purchased impaired loans and other loans acquired at a discount. Rather, subsequent to the acquisition date, incurred losses associated with those loans are evaluated using methods consistent with those applied to originated loans and such losses are considered by management in evaluating the Company’s allowance for credit losses.

71
Nonaccrual loans aggregated $963 million at December 31, 2019, compared with $894 million and $883 million at December 31, 2018 and 2017, respectively. As a percentage of total loans and leases outstanding, nonaccrual loans represented 1.06% at December 31, 2019, compared with 1.01% and 1.00% at December 31, 2018 and 2017, respectively. The higher level of nonaccrual loans at December 31, 2019 as compared with December 31, 2018 reflects the addition of a commercial loan to a wholesale distributor during the 2019’s third quarter that had an outstanding balance at the 2019 year-end of $89 million.
Accruing loans past due 90 days or more (excluding loans acquired at a discount) were $519 million or .57% of total loans and leases at December 31, 2019, compared with $223 million or .25% at December 31, 2018 and $244 million or .28% at December 31, 2017. Those amounts included loans guaranteed by government-related entities of $480 million, $192 million and $235 million at December 31, 2019, 2018 and 2017, respectively. Guaranteed loans included one-to-four family residential mortgage loans serviced by the Company that were repurchased to reduce associated servicing costs, including a requirement to advance principal and interest payments that had not been received from individual mortgagors. Despite the loans being purchased by the Company, the insurance or guarantee by the applicable government-related entity remains in force. The outstanding principal balances of the repurchased loans that are guaranteed by government-related entities totaled $452 million at December 31, 2019, $165 million at December 31, 2018 and $207 million at December 31, 2017. The increase in such loans at December 31, 2019 as compared with the prior year-ends resulted from loans associated with servicing the Company added in 2019. The remaining accruing loans past due 90 days or more not guaranteed by government-related entities were loans considered to be with creditworthy borrowers that were in the process of collection or renewal. A summary of nonperforming assets and certain past due, renegotiated and impaired loan data and credit quality ratios is presented in table 13.
72
Table 13
NONPERFORMING ASSET AND PAST DUE, RENEGOTIATED AND IMPAIRED LOAN DATA 2019 2018 2017 2016 2015
December 31 (Dollars in thousands)
Nonaccrual loans .......................................................... $ 963,112 893,608 882,598 920,015 799,409 Real estate and other foreclosed assets ........................ 85,646 78,375 111,910 139,206 195,085 Total nonperforming assets .......................................... $1,048,758 971,983 994,508 1,059,221 994,494
Accruing loans past due 90 days or more(a) ................ $ 518,728 222,527 244,405 300,659 317,441
Government guaranteed loans included in totals above:
Nonaccrual loans..................................................... $ 50,891 34,667 35,677 40,610 47,052 Accruing loans past due 90 days or more ............... 479,829 192,443 235,489 282,659 276,285
Renegotiated loans ....................................................... $ 234,424 245,367 221,513 190,374 182,865
Acquired accruing loans past due 90 days or more(b) ...................................................................... $ 39,632 39,750 47,418 61,144 68,473
Purchased impaired loans(c): Outstanding customer balance ................................ $ 415,413 529,520 688,091 927,446 1,204,004 Carrying amount ..................................................... 227,545 303,305 410,015 578,032 768,329
Nonaccrual loans to total loans and leases, net of unearned discount...................................................... 1.06% 1.01% 1.00% 1.01% .91%Nonperforming assets to total net loans and leases and real estate and other foreclosed assets....................... 1.15% 1.10% 1.13% 1.16% 1.13%Accruing loans past due 90 days or more(a) to total loans and leases, net of unearned discount................ .57% .25% .28% .33% .36%
(a) Excludes loans acquired at a discount. Predominantly residential real estate loans.(b) Loans acquired at a discount that were recorded at fair value at acquisition date. This category does not
include purchased impaired loans that are presented separately.(c) Accruing loans acquired at a discount that were impaired at acquisition date and recorded at fair value.
Purchased impaired loans are loans obtained in acquisition transactions subsequent to 2008 that as of the acquisition date were specifically identified as displaying signs of credit deterioration and for which the Company did not expect to collect all contractually required principal and interest payments. Those loans were impaired at the date of acquisition, were recorded at estimated fair value and were generally delinquent in payments, but, in accordance with GAAP, the Company continued to accrue interest income on such loans based on the estimated expected cash flows associated with the loans. The carrying amount of such loans aggregated $228 million at December 31, 2019, or .3% of total loans. Purchased impaired loans totaled $303 million at December 31, 2018.
The Company modified the terms of select loans in an effort to assist borrowers. If the borrower was experiencing financial difficulty and a concession was granted, the Company considered such modifications as troubled debt restructurings. Loan modifications included such actions as the extension of loan maturity dates and the lowering of interest rates and monthly payments. The objective of the modifications was to increase loan repayments by customers and thereby reduce net charge-offs. In accordance with GAAP, the modified loans are included in impaired loans for purposes of determining the level of the allowance for credit losses. Information about modifications of loans that are considered troubled debt restructurings is included in note 3 of Notes to Financial Statements.
73
Residential real estate loans modified under specified loss mitigation programs prescribed by government guarantors have not been included in renegotiated loans because the loan guarantee remains in full force and, accordingly, the Company has not granted a concession with respect to the ultimate collection of the original loan balance. Such loans totaled $203 million and $179 million million at December 31, 2019 and December 31, 2018, respectively.
Charge-offs of commercial loans and leases, net of recoveries, aggregated $34 million in 2019, $33 million in 2018 and $44 million in 2017. Commercial loans and leases in nonaccrual status were $347 million at December 31, 2019, $234 million at December 31, 2018 and $241 million at December 31, 2017. The higher balance in 2019 reflects the third quarter addition of a loan to a wholesale distributer with an outstanding balance of $89 million at December 31, 2019.
Net charge-offs of commercial real estate loans totaled $9 million during 2019, compared with net recoveries of previously charged-off commercial real estate loans of $9 million during 2018 and $5 million in 2017. Reflected in the 2018 amount was a $13 million recovery associated with a hotel property. Commercial real estate loans classified as nonaccrual were $195 million at December 31, 2019, $231 million at December 31, 2018 and $202 million at December 31, 2017. Nonaccrual commercial real estate loans included construction-related loans of $37 million, $27 million and $17 million at the end of 2019, 2018 and 2017, respectively.
Net charge-offs of residential real estate loans totaled $5 million in 2019, $9 million in 2018 and $12 million in 2017. Residential real estate loans in nonaccrual status at December 31, 2019 were $319 million, compared with $318 million and $332 million at December 31, 2018 and 2017, respectively. Nonaccrual limited documentation first mortgage loans aggregated $83 million at December 31, 2019, compared with $85 million and $96 million at December 31, 2018 and 2017, respectively. Limited documentation first mortgage loans represent loans secured by residential real estate that at origination typically included some form of limited borrower documentation requirements as compared with more traditional loans. The Company no longer originates limited documentation loans. Residential real estate loans past due 90 days or more and accruing interest (excluding loans acquired at a discount) totaled $487 million at December 31, 2019, $190 million at December 31, 2018 and $233 million at December 31, 2017. A substantial portion of such amounts related to guaranteed loans repurchased from government-related entities, including the previously noted repurchases of loans associated with servicing that the Company added in 2019. Information about the location of nonaccrual and charged-off residential real estate loans as of and for the year ended December 31, 2019 is presented in table 14.

74
Table 14
SELECTED RESIDENTIAL REAL ESTATE-RELATED LOAN DATA
Year Ended December 31, 2019 December 31, 2019
Nonaccrual Net Charge-offs
(Recoveries) Percent of Percent of Average Outstanding Outstanding Outstanding Balances Balances Balances Balances Balances (Dollars in thousands)
Residential mortgages: New York................................................................................ $ 4,861,799 $ 73,798 1.52% $ 1,029 .02% Pennsylvania ........................................................................... 1,125,759 14,328 1.27 81 .01 Maryland ................................................................................. 1,135,666 12,513 1.10 (447) (.04) New Jersey .............................................................................. 3,090,440 60,763 1.97 3,018 .09 Other Mid-Atlantic (a) ............................................................ 1,017,351 8,681 .85 (1,186) (.12) Other........................................................................................ 2,757,668 63,827 2.31 2,079 .08 Total ........................................................................................ $ 13,988,683 $ 233,910 1.67% $ 4,574 .03%
Residential construction loans: New York................................................................................ $ 30,793 $ 147 .48% $ — —% Pennsylvania ........................................................................... 7,626 569 7.46 57 .78 Maryland ................................................................................. 11,983 149 1.24 — — New Jersey .............................................................................. 13,546 — — — — Other Mid-Atlantic (a) ............................................................ 21,476 830 3.86 — — Other........................................................................................ 8,318 58 .70 37 .61 Total ........................................................................................ $ 93,742 $ 1,753 1.87% $ 94 .14%
Limited documentation first mortgages: New York................................................................................ $ 929,686 $ 32,787 3.53% $ (188) (.02%) Pennsylvania ........................................................................... 43,218 2,595 6.00 (38) (.08) Maryland ................................................................................. 24,118 2,607 10.81 10 (.04) New Jersey .............................................................................. 771,459 24,967 3.24 766 .09 Other Mid-Atlantic (a) ............................................................ 10,313 980 9.50 (383) (1.92) Other........................................................................................ 294,875 19,491 6.61 (328) (.10) Total ........................................................................................ $ 2,073,669 $ 83,427 4.02% $ (161) (.01%)
First lien home equity loans and lines of credit: New York................................................................................ $ 1,118,292 $ 14,249 1.27% $ 1,280 .11% Pennsylvania ........................................................................... 677,735 8,500 1.25 827 .12 Maryland ................................................................................. 561,336 6,572 1.17 727 .13 New Jersey .............................................................................. 68,550 899 1.31 11 .02 Other Mid-Atlantic (a) ............................................................ 185,943 2,396 1.29 165 .09 Other........................................................................................ 32,842 1,320 4.02 69 .22 Total ........................................................................................ $ 2,644,698 $ 33,936 1.28% $ 3,079 .11%
Junior lien home equity loans and lines of credit: New York................................................................................ $ 673,431 $ 14,354 2.13% $ 500 .07% Pennsylvania ........................................................................... 251,359 2,997 1.19 306 .12 Maryland ................................................................................. 529,723 7,191 1.36 (290) (.05) New Jersey .............................................................................. 96,355 1,310 1.36 1,670 1.69 Other Mid-Atlantic (a) ............................................................ 239,706 2,079 .87 6 — Other........................................................................................ 40,864 993 2.43 127 .31 Total ........................................................................................ $ 1,831,438 $ 28,924 1.58% $ 2,319 .12%
Limited documentation junior lien: New York................................................................................ $ 573 $ 35 6.11% $ (4) (.69%) Pennsylvania ........................................................................... 218 — — — — Maryland ................................................................................. 1,077 50 4.64 83 6.91 New Jersey .............................................................................. 123 — — 146 48.66 Other Mid-Atlantic (a) ............................................................ 537 33 6.15 — — Other........................................................................................ 2,953 237 8.03 (70) (2.20) Total ........................................................................................ $ 5,481 $ 355 6.48% $ 155 2.54%
(a) Includes Delaware, Virginia, West Virginia and the District of Columbia.

75
Net charge-offs of consumer loans aggregated $97 million in each of 2019 and 2018, compared with $89 million in 2017. Included in net charge-offs of consumer loans were: automobile loans of $24 million in 2019, $33 million in 2018 and $34 million in 2017; recreational finance loans of $26 million, $17 million and $16 million during 2019, 2018 and 2017, respectively; and home equity loans and lines of credit secured by one-to-four family residential properties of $6 million in 2019, $7 million in 2018 and $11 million in 2017. Nonaccrual consumer loans were $102 million at December 31, 2019, compared with $110 million and $108 million at December 31, 2018 and 2017, respectively. Included in nonaccrual consumer loans at the 2019, 2018 and 2017 year-ends were: automobile loans of $21 million, $23 million and $24 million, respectively; recreational finance loans of $14 million, $11 million and $6 million, respectively; and outstanding balances of home equity loans and lines of credit of $63 million, $71 million and $75 million, respectively. Information about the location of nonaccrual and charged-off home equity loans and lines of credit as of and for the year ended December 31, 2019 is presented in table 14. Information about past due and nonaccrual loans as of December 31, 2019 and 2018 is also included in note 3 of Notes to Financial Statements.
Real estate and other foreclosed assets totaled $86 million at December 31, 2019, compared with $78 million at December 31, 2018 and $112 million at December 31, 2017. Net gains or losses associated with real estate and other foreclosed assets were not material in 2019, 2018 or 2017. At December 31, 2019, the Company’s holding of residential real estate-related properties comprised approximately 89% of foreclosed assets.
Management determined the allowance for credit losses pursuant to the incurred loss accounting provisions of GAAP by performing ongoing evaluations of the loan and lease portfolio, including such factors as the differing economic risks associated with each loan category, the financial condition of specific borrowers, the economic environment in which borrowers operate, the level of delinquent loans, the value of any collateral and, where applicable, the existence of any guarantees or indemnifications. Management evaluated the impact of changes in interest rates and overall economic conditions on the ability of borrowers to meet repayment obligations when quantifying the Company’s exposure to credit losses and the allowance for such losses as of each reporting date. Factors also considered by management when performing its assessment, in addition to general economic conditions and the other factors described above, included, but were not limited to: (i) the impact of real estate values on the Company’s portfolio of loans secured by commercial and residential real estate; (ii) the concentrations of commercial real estate loans in the Company’s loan portfolio; (iii) the amount of commercial and industrial loans to businesses in areas of New York State outside of the New York City metropolitan area and in central Pennsylvania that have historically experienced less economic growth and vitality than the vast majority of other regions of the country; (iv) the expected repayment performance associated with the Company’s first and second lien loans secured by residential real estate; and (v) the size of the Company’s portfolio of loans to individual consumers, which historically have experienced higher net charge-offs as a percentage of loans outstanding than other loan types. The level of the allowance is adjusted based on the results of management’s analysis.
Management cautiously and conservatively evaluated the allowance for credit losses as of December 31, 2019 in light of: (i) residential real estate values and the level of delinquencies of loans secured by residential real estate; (ii) economic conditions in the markets served by the Company; (iii) slower growth in private sector employment in upstate New York and central Pennsylvania than in other regions served by the Company and nationally; (iv) the significant subjectivity involved in commercial real estate valuations; and (v) the amount and type of loan growth experienced by the Company. While there has been general improvement in economic conditions in recent years, concerns exist about the ongoing sustainability of such improvements; the volatile nature of global commodity and export markets, including the impact international economic conditions could have on the U.S. economy; Federal Reserve positioning of monetary policy; and continued stagnant population growth in the upstate New York and central Pennsylvania regions (approximately 52% of the Company’s loans and leases are to customers in New York State and Pennsylvania).

76
As described in note 4 of Notes to Financial Statements, the Company utilizes a loan grading system to differentiate risk amongst its commercial loans and commercial real estate loans. Loans with a lower expectation of default are assigned one of ten possible “pass” loan grades and are generally ascribed lower loss factors when determining the allowance for credit losses. Loans with an elevated level of credit risk are classified as “criticized” and are ascribed a higher loss factor when determining the allowance for credit losses. Criticized loans may be classified as “nonaccrual” if the Company no longer expects to collect all amounts according to the contractual terms of the loan agreement or the loan is delinquent 90 days or more. Criticized commercial loans and commercial real estate loans totaled $2.5 billion at December 31, 2019, compared with $2.7 billion at December 31, 2018. The decline reflects loans that were paid off during 2019 and the removal of loans to customers experiencing improved financial condition.
Loan officers in different geographic locations with the support of the Company’s credit department personnel continuously review and reassign loan grades based on their detailed knowledge of individual borrowers and their judgment of the impact on such borrowers resulting from changing conditions in their respective regions. At least annually, updated financial information is obtained from commercial borrowers associated with pass grade loans and additional analysis is performed. On a quarterly basis, the Company’s centralized credit department reviews all criticized commercial loans and commercial real estate loans greater than $1 million to determine the appropriateness of the assigned loan grade, including whether the loan should be reported as accruing or nonaccruing. For criticized nonaccrual loans, additional meetings are held with loan officers and their managers, workout specialists and senior management to discuss each of the relationships. In analyzing criticized loans, borrower-specific information is reviewed, including operating results, future cash flows, recent developments and the borrower’s outlook, and other pertinent data. The timing and extent of potential losses, considering collateral valuation and other factors, and the Company’s potential courses of action are contemplated. To the extent that these loans are collateral-dependent, they are evaluated based on the fair value of the loan’s collateral as estimated at or near the financial statement date. As the quality of a loan deteriorates to the point of classifying the loan as “criticized,” the process of obtaining updated collateral valuation information is usually initiated, unless it is not considered warranted given factors such as the relative size of the loan, the characteristics of the collateral or the age of the last valuation. In those cases where current appraisals may not yet be available, prior appraisals are utilized with adjustments, as deemed necessary, for estimates of subsequent declines in value as determined by line of business and/or loan workout personnel in the respective geographic regions. Those adjustments are reviewed and assessed for reasonableness by the Company’s credit department. Accordingly, for real estate collateral securing larger commercial loans and commercial real estate loans, estimated collateral values are based on current appraisals and estimates of value. For non-real estate loans, collateral is assigned a discounted estimated liquidation value and, depending on the nature of the collateral, is verified through field exams or other procedures. In assessing collateral, real estate and non-real estate values are reduced by an estimate of selling costs.
With regard to residential real estate loans, the Company’s loss identification and estimation techniques make reference to loan performance and house price data in specific areas of the country where collateral securing the Company’s residential real estate loans is located. For residential real estate-related loans, including home equity loans and lines of credit, the excess of the loan balance over the net realizable value of the property collateralizing the loan is charged-off when the loan becomes 150 days delinquent. That charge-off is based on recent indications of value from external parties that are generally obtained shortly after a loan becomes nonaccrual. Loans to consumers that file for bankruptcy are generally charged off to estimated net collateral value shortly after the Company is notified of such filings. At December 31, 2019, approximately 59% of the Company’s home equity portfolio consisted of first lien loans and lines of credit. Of the remaining junior lien

77
loans in the portfolio, approximately 60% (or approximately 24% of the aggregate home equity portfolio) consisted of junior lien loans that were behind a first lien mortgage loan that was not owned or serviced by the Company. To the extent known by the Company, if a senior lien loan would be on nonaccrual status because of payment delinquency, even if such senior lien loan was not owned by the Company, the junior lien loan or line that is owned by the Company is placed on nonaccrual status. The balance of junior lien loans and lines that were in nonaccrual status solely as a result of first lien loan performance was $6 million and $10 million at December 31, 2019 and 2018, respectively. In monitoring the credit quality of its home equity portfolio for purposes of determining the allowance for credit losses, the Company reviews delinquency and nonaccrual information and considers recent charge-off experience. When evaluating individual home equity loans and lines of credit for charge off and for purposes of estimating incurred losses in determining the allowance for credit losses, the Company gives consideration to the required repayment of any first lien positions related to collateral property. Home equity line of credit terms vary but such lines are generally originated with an open draw period of ten years followed by an amortization period of up to twenty years. At December 31, 2019, approximately 83% of all outstanding balances of home equity lines of credit related to lines that were still in the draw period, the weighted-average remaining draw periods were approximately five years, and approximately 22% were making contractually allowed payments that do not include any repayment of principal.
Factors that influence the Company’s credit loss experience include overall economic conditions affecting businesses and consumers, generally, but also residential and commercial real estate valuations, in particular, given the size of the Company’s real estate loan portfolios. Commercial real estate valuations can be highly subjective, as they are based upon many assumptions. Such valuations can be significantly affected over relatively short periods of time by changes in business climate, economic conditions, interest rates and, in many cases, the results of operations of businesses and other occupants of the real property. Similarly, residential real estate valuations can be impacted by housing trends, the availability of financing at reasonable interest rates, and general economic conditions affecting consumers.
In determining the allowance for credit losses, the Company estimates losses attributable to specific troubled credits identified through both normal and targeted credit review processes and also estimates losses inherent in other loans and leases. In quantifying incurred losses, the Company considers the factors and uses the techniques described herein and in note 4 of Notes to Financial Statements. For purposes of determining the level of the allowance for credit losses, the Company segments its loan and lease portfolio by loan type. The amount of specific loss components in the Company’s loan and lease portfolios is determined through a loan-by-loan analysis of commercial loans and commercial real estate loans in nonaccrual status. Measurement of the specific loss components is typically based on expected future cash flows, collateral values or other factors that may impact the borrower’s ability to pay. Losses associated with residential real estate loans and consumer loans are generally determined by reference to recent charge-off history and are evaluated (and adjusted if deemed appropriate) through consideration of other factors including near-term forecasted loss estimates developed by the Company’s credit department. These forecasts give consideration to overall borrower repayment performance and current geographic region changes in collateral values using third party published historical price indices or automated valuation methodologies. With regard to collateral values, the realizability of such values by the Company contemplates repayment of any first lien position prior to recovering amounts on a junior lien position. Approximately 41% of the Company’s home equity portfolio consists of junior lien loans and lines of credit. Except for consumer loans and residential real estate loans that are considered smaller balance homogeneous loans and are evaluated collectively and loans obtained at a discount in acquisition transactions, the Company considers a loan to be impaired when, based on current information and events, it is probable that the Company will be unable to collect all amounts according to the contractual terms of the loan agreement or the loan is

78
delinquent 90 days or more and has been placed in nonaccrual status. Those impaired loans are evaluated for specific loss components. Modified loans, including smaller balance homogenous loans, that are considered to be troubled debt restructurings are evaluated for impairment giving consideration to the impact of the modified loan terms on the present value of the loan’s expected cash flows. Loans less than 90 days delinquent are deemed to have a minimal delay in payment and are generally not considered to be impaired. For loans acquired at a discount, the impact of estimated future credit losses represents the predominant difference between contractually required payments and the cash flows expected to be collected. Subsequent decreases to those expected cash flows require the Company to evaluate the need for an additional allowance for credit losses and could lead to charge-offs of acquired loan balances. Additional information regarding the Company’s process for determining the allowance for credit losses is included in note 4 of Notes to Financial Statements.
The inherent base level loss components of the Company’s allowance for credit losses are generally determined by applying loss factors to specific loan balances based on loan type and management’s classification of commercial loans and commercial real estate loans under the Company’s loan grading system. As previously described, loan officers are responsible for continually assigning grades to these loans based on standards outlined in the Company’s Credit Policy. Internal loan grades are also extensively monitored by the Company’s credit department to ensure consistency and strict adherence to the prescribed standards. Loan balances utilized in the inherent base level loss component computations exclude loans and leases for which specific allocations are maintained. Loan grades are assigned loss factors that reflect the Company’s loss estimate for each group of loans and leases. Factors considered in assigning loan grades and loss factors include borrower-specific information related to expected future cash flows and operating results, collateral values, financial condition, payment status, and other information; levels of and trends in portfolio charge-offs and recoveries; levels of and trends in portfolio delinquencies and impaired loans; changes in the risk profile of specific portfolios; trends in volume and terms of loans; effects of changes in credit concentrations; and observed trends and practices in the banking industry. In determining the allowance for credit losses, management also gives consideration to such factors as customer, industry and geographic concentrations, as well as national and local economic conditions, including: (i) the comparatively poorer economic conditions and unfavorable business climate in many market regions served by the Company, including upstate New York and central Pennsylvania, that result in such regions generally experiencing significantly lesser economic growth and vitality as compared with much of the rest of the country; (ii) portfolio concentrations regarding loan type, collateral type and geographic location, in particular the large concentrations of commercial real estate loans secured by properties in the New York City area and other areas of New York State; and (iii) risk associated with the Company’s portfolio of consumer loans which generally have higher rates of loss than other types of collateralized loans.
The inherent base level loss components related to residential real estate loans and consumer loans are generally determined by applying loss factors to portfolio balances after consideration of payment performance and recent loss experience and trends, which are mainly driven by current collateral values in the market place as well as the amount of loan defaults. Loss rates for loans secured by residential real estate, including home equity loans and lines of credit, are determined by reference to recent charge-off history and are evaluated (and adjusted if deemed appropriate) through consideration of other factors as previously described.
In evaluating collateral, the Company relies on internally and externally prepared valuations. Residential real estate valuations are usually based on sales of comparable properties in the respective location. Commercial real estate valuations also refer to sales of comparable properties but oftentimes are based on calculations that utilize many assumptions and, as a result, can be highly subjective. Specifically, commercial real estate values can be significantly affected over relatively short periods of time by changes in business climate, economic conditions and interest rates, and, in

79
many cases, the results of operations of businesses and other occupants of the real property. Additionally, management is aware that there is oftentimes a delay in the recognition of credit quality changes in loans and, as a result, in changes to assigned loan grades due to time delays in the manifestation and reporting of underlying events that impact credit quality. Accordingly, loss estimates derived from the inherent base level loss component computation are adjusted for current national and local economic conditions and trends. The Federal Reserve stated in December 2019 that the U.S. labor market remains strong and that economic activity has been rising at a moderate rate. Job gains have been solid, on average, in recent months, and the unemployment rate has remained low. Although household spending has been rising at a strong pace, business fixed investment and exports remain weak. Economic indicators in the most significant market regions served by the Company also showed improvement in 2019. For example, in 2019, average private sector employment in areas served by the Company was 1.1% above year-ago levels, but still trailed the 1.8% U.S. average growth rate. Private sector employment increased 1.0% in upstate New York, 0.8% in areas of Pennsylvania served by the Company, 1.2% in New Jersey, 0.6% in Maryland, 1.2% in Greater Washington D.C. and 0.9% in Delaware. In New York City, private sector employment increased by 2.0% in 2019.
The specific loss components and the inherent base level loss components together comprise the total base level or “allocated” allowance for credit losses. Such allocated portion of the allowance represents management’s assessment of losses existing in specific larger balance loans that are reviewed in detail by management and pools of other loans that are not individually analyzed. In addition, the Company has always provided an inherent unallocated portion of the allowance that is intended to recognize probable losses that are not otherwise identifiable. The inherent unallocated allowance includes management’s subjective determination of amounts necessary for such things as the possible use of imprecise estimates in determining the allocated portion of the allowance and other risks associated with the Company’s loan portfolio which may not be specifically allocable.
A comparative allocation of the allowance for credit losses for each of the past five year-ends is presented in table 15. Amounts were allocated to specific loan categories based on information available to management at the time of each year-end assessment and using the methodology described herein. Variations in the allocation of the allowance by loan category as a percentage of those loans reflect changes in management’s estimate of specific loss components and inherent base level loss components, including the impact of delinquencies and nonaccrual loans. The unallocated portion of the allowance for credit losses was equal to .09% of gross loans outstanding at each of December 31, 2019 and December 31, 2018. Considering the inherent imprecision in the many estimates used in the determination of the allocated portion of the allowance, management deliberately remained cautious and conservative in establishing the overall allowance for credit losses. Given the Company’s high concentration of real estate loans and considering the other factors already discussed herein, management considers the allocated and unallocated portions of the allowance for credit losses to be prudent and reasonable. Furthermore, the Company’s allowance is general in nature and is available to absorb losses from any loan or lease category. Additional information about the allowance for credit losses is included in note 4 of Notes to Financial Statements.

80
Table 15
ALLOCATION OF THE ALLOWANCE FOR CREDIT LOSSES TO LOAN CATEGORIES
December 31 2019 2018 2017 2016 2015 (In thousands)
Commercial, financial, leasing, etc. ................................ $ 366,094 $ 330,055 $ 328,599 $330,833 $300,404 Real estate..................................... 378,234 410,780 439,490 423,846 399,069 Consumer...................................... 229,118 200,564 170,809 156,288 178,320 Unallocated................................... 77,625 78,045 78,300 78,030 78,199
Total......................................... $1,051,071 $1,019,444 $1,017,198 $988,997 $955,992 As a Percentage of Gross Loansand Leases Outstanding Commercial, financial, leasing, etc. ................................ 1.53% 1.43% 1.50% 1.45% 1.46%Real estate..................................... .73 .80 .83 .75 .72 Consumer...................................... 1.49 1.44 1.29 1.29 1.54
Management believes that the allowance for credit losses at December 31, 2019 appropriately reflected credit losses inherent in the portfolio as of that date. The allowance for credit losses totaled $1.05 billion at December 31, 2019 and $1.02 billion at each of December 31, 2018 and December 31, 2017. As a percentage of loans outstanding, the allowance was 1.16% at each of December 31, 2019 and 2017 and 1.15% at December 31, 2018. The level of the allowance reflects management’s evaluation of the loan and lease portfolio using the methodology and considering the factors as described herein. The ratio of the allowance for credit losses to nonaccrual loans at the end of 2019, 2018 and 2017 was 109%, 114% and 115%, respectively. Given the Company’s general position as a secured lender and its practice of charging-off loan balances when collection is deemed doubtful, that ratio and changes in that ratio are generally not an indicative measure of the adequacy of the Company’s allowance for credit losses, nor does management rely upon that ratio in assessing the adequacy of the Company’s allowance for credit losses. The level of the allowance reflects management’s evaluation of the loan and lease portfolio as of each respective date.
In establishing the allowance for credit losses, management follows the methodology described herein, including taking a conservative view of borrowers’ abilities to repay loans. The establishment of the allowance is subjective and requires management to make many judgments about borrower, industry, regional and national economic health and performance. In order to present examples of the possible impact on the allowance from certain changes in credit quality factors, the Company assumed the following scenarios for possible deterioration of credit quality:
• For consumer loans and leases considered smaller balance homogenous loans and evaluated collectively, a 40 basis point increase in loss factors;
• For residential real estate loans and home equity loans and lines of credit, also considered small balance homogenous loans and evaluated collectively, a 15% increase in estimated inherent losses; and
• For commercial loans and commercial real estate loans, a migration of loans to lower-ranked risk grades resulting in a 30% increase in the balance of classified credits in each risk grade.
For possible improvement in credit quality factors, the scenarios assumed were:• For consumer loans and leases, a 20 basis point decrease in loss factors;

81
• For residential real estate loans and home equity loans and lines of credit, a 10% decrease in estimated inherent losses; and
• For commercial loans and commercial real estate loans, a migration of loans to higher-ranked risk grades resulting in a 5% decrease in the balance of classified credits in each risk grade.
The scenario analyses resulted in an additional $104 million that could be identifiable under the assumptions for credit deterioration, whereas under the assumptions for credit improvement a $41 million reduction could occur. These examples are only a few of numerous reasonably possible scenarios that could be utilized in assessing the sensitivity of the allowance for credit losses based on changes in assumptions and other factors.
The Company had no concentrations of credit extended to any specific industry that exceeded 10% of total loans at December 31, 2019, however residential real estate loans comprised approximately 18% of the loan portfolio. Outstanding loans to foreign borrowers aggregated $186 million at December 31, 2019, or .2% of total loans and leases.
Effective January 1, 2020 the Company adopted amended accounting guidance for the measurement of credit losses on financial instruments. That guidance requires an allowance for credit losses to be deducted from the amortized cost basis of financial assets to present the net carrying value that is expected to be collected over the contractual term of the assets considering relevant information about past events, current conditions, and reasonable and supportable forecasts that affect the collectibility of the reported amount. The amended guidance also requires recording an allowance for credit losses for purchased financial assets with a more-than-insignificant amount of credit deterioration since origination. The initial allowance for these assets will be added to the purchase price at acquisition rather than being reported as an expense. Subsequent changes in the allowance will be recorded through the income statement as an expense adjustment. The new guidance replaces the previous incurred loss model for determining the allowance for credit losses. The adoption of the amended guidance resulted in a $132 million increase in the allowance for credit losses at January 1, 2020. Increases in the allowance for residential real estate loans and consumer loans, reflecting the longer-dated maturities of such portfolios, were offset somewhat by net decreases in the allowance for commercial loans resulting from lower loss estimates on demand loan products due to the assumption that the Company could require full repayment of such loans in the near-term. Table 16 depicts the changes in the allowance for credit losses by loan category resulting from the adoption of the amended guidance.
Table 16
IMPACT OF ADOPTION OF AMENDED ACCOUNTING GUIDANCE ON ALLOWANCE FOR CREDIT LOSSES
Balance
December 31, 2019 Impact of AdoptionIncrease (Decrease)
BalanceJanuary 1, 2020
(In thousands)
Commercial, financial, leasing, etc............. $ 366,094 $ (61,474) $ 304,620 Commercial real estate ............................... 322,201 23,656 345,857 Residential real estate ................................. 56,033 53,896 109,929 Consumer .................................................... 229,118 194,004 423,122 Unallocated ................................................. 77,625 (77,625) —
Total ....................................................... $ 1,051,071 $ 132,457 $ 1,183,528

82
The amended guidance requires estimated credit losses on loans acquired at a discount to be reflected in the allowance for credit losses. Previously, such losses were netted in the carrying value of the loans unless there was an increased loss expectation subsequent to their acquisition. The gross-up of the estimated losses on loans acquired at a discount that was previously not recognized in the allowance for credit losses was $18 million on January 1, 2020. Prior to January 1, 2020, the Company generally recognized interest income on loans acquired at a discount regardless of the borrowers’ repayment status. Effective with the adoption of the new accounting guidance, the Company’s nonaccrual loan policy now applies to loans acquired at a discount. Loans acquired at a discount at December 31, 2019 included $171 million of loans that, effective with the adoption of the new guidance, are classified as nonaccrual loans.
Other IncomeOther income aggregated $2.06 billion in 2019, compared with $1.86 billion and $1.85 billion in 2018 and 2017, respectively. As compared with 2018, the 11% rise in other income in 2019 was largely attributable to higher mortgage banking revenues, trust income, trading account and foreign exchange gains and valuation gains on investment securities. The increase in other income from 2017 to 2018 was largely attributable to higher levels of trust income and income from BLG that were tempered by lower brokerage services income and income from bank owned life insurance. In addition, valuation losses on equity securities were incurred during 2018, compared with gains on the sale of investment securities in 2017.
Mortgage banking revenues aggregated $458 million in 2019, $360 million in 2018 and $364 million in 2017. Mortgage banking revenues are comprised of both residential and commercial mortgage banking activities. The Company’s involvement in commercial mortgage banking activities includes the origination, sales and servicing of loans under the multifamily loan programs of Fannie Mae, Freddie Mac and the U.S. Department of Housing and Urban Development.
Residential mortgage banking revenues, consisting of realized gains from sales of residential real estate loans and loan servicing rights, unrealized gains and losses on residential real estate loans held for sale and related commitments, residential real estate loan servicing fees, and other residential real estate loan-related fees and income, were $317 million in 2019, up significantly from $239 million in 2018 and $245 million in 2017. The higher residential mortgage banking revenues in 2019 as compared with 2018 resulted from increased servicing income and higher gains associated with loans held for sale, reflecting higher origination volumes.
New commitments to originate residential real estate loans to be sold rose 20% to approximately $2.7 billion in 2019 from $2.2 billion in 2018. Such commitments totaled $3.0 billion in 2017. Realized gains from sales of residential real estate loans and loan servicing rights and recognized net unrealized gains or losses attributable to residential real estate loans held for sale, commitments to originate loans for sale and commitments to sell loans aggregated to gains of $72 million in 2019, $44 million in 2018 and $60 million in 2017.
Loans held for sale that were secured by residential real estate totaled $414 million and $205 million at December 31, 2019 and 2018, respectively. Commitments to sell residential real estate loans and commitments to originate residential real estate loans for sale at pre-determined rates totaled $713 million and $423 million, respectively, at December 31, 2019, $364 million and $245 million, respectively, at December 31, 2018 and $595 million and $347 million, respectively, at December 31, 2017. Net recognized unrealized gains on residential real estate loans held for sale, commitments to sell loans and commitments to originate loans for sale were $12 million at December 31, 2019, $7 million at December 31, 2018 and $10 million at December 31, 2017. Changes in such net unrealized gains are recorded in mortgage banking revenues and resulted in a net increase in
83
revenue of $5 million in 2019, compared with net decreases in revenue of $3 million in 2018 and $5 million in 2017.
Revenues from servicing residential real estate loans for others rose to $245 million in 2019 from $195 million in 2018 and $185 million in 2017. Residential real estate loans serviced for others aggregated $95.1 billion at December 31, 2019, $79.1 billion a year earlier and $79.2 billion at December 31, 2017. On January 31, 2019, the Company purchased servicing rights for residential real estate loans that had outstanding principal balances at that date of approximately $13.3 billion. The purchase price of such servicing rights was approximately $144 million. Reflected in residential real estate loans serviced for others were loans sub-serviced for others of $62.8 billion, $56.8 billion and $56.6 billion at December 31, 2019, 2018 and 2017, respectively. Revenues earned for sub-servicing such loans totaled $125 million in 2019, compared with $114 million in 2018 and $103 million in 2017. The Company added approximately $17.6 billion to its residential real estate loan sub-servicing portfolio during 2019. In 2018 and 2017, the Company added $9.0 billion and $35.6 billion, respectively of residential real estate loans sub-serviced for others. The contractual servicing rights associated with loans sub-serviced by the Company were predominantly held by affiliates of BLG. Information about the Company’s relationship with BLG and its affiliates is included in note 24 of Notes to Financial Statements.
Capitalized residential mortgage servicing assets totaled $237 million at December 31, 2019 (net of a $7 million valuation allowance), compared with $121 million and $115 million at December 31, 2018 and 2017, respectively. A provision for impairment of capitalized residential mortgage servicing rights of $7 million was recorded in 2019, resulting from changes in the estimated fair value of capitalized mortgage servicing rights that reflected the impact of lower interest rates on the expected rate of residential mortgage loan prepayments. Additional information about the Company’s capitalized residential mortgage servicing assets, including information about the calculation of estimated fair value, is presented in note 6 of Notes to Financial Statements.
Commercial mortgage banking revenues totaled $141 million in 2019, compared with $121 million in 2018 and $119 million in 2017. Included in such amounts were revenues from loan origination and sales activities of $81 million in 2019, $64 million in 2018 and $66 million in 2017. The higher revenues in 2019 as compared with 2018 were due to higher origination volumes and wider margins on loans originated for sale. The lower revenues in 2018 as compared with 2017 were due to narrower margins on loans originated for sale. Commercial real estate loans originated for sale to other investors totaled approximately $4.0 billion in 2019, compared with $2.4 billion in 2018 and $2.5 billion in 2017. Loan servicing revenues totaled $60 million in 2019, $57 million in 2018 and $53 million in 2017. Capitalized commercial mortgage servicing assets were $131 million at December 31, 2019, $115 million at December 31, 2018 and $114 million at December 31, 2017. Commercial real estate loans serviced for other investors totaled $21.0 billion at December 31, 2019, $18.2 billion at December 31, 2018 and $16.2 billion at December 31, 2017, and included $3.9 billion at December 31, 2019, $3.4 billion at December 31, 2018 and $3.3 billion at December 31, 2017, of loan balances for which investors had recourse to the Company if such balances are ultimately uncollectible. Included in commercial real estate loans serviced for others were loans sub-serviced for others of $3.4 billion at December 31, 2019 and $2.7 billion at December 31, 2018. Commitments to sell commercial real estate loans and commitments to originate commercial real estate loans for sale aggregated $193 million and $164 million, respectively, at December 31, 2019, $577 million and $229 million, respectively, at December 31, 2018 and $217 million and $195 million, respectively, at December 31, 2017. Commercial real estate loans held for sale were $28 million, $347 million and $22 million at December 31, 2019, 2018 and 2017, respectively. The higher balances at December 31, 2018 reflect loans originated later in that year that had not been delivered to investors by year end.

84
Service charges on deposit accounts totaled $433 million in 2019, compared with $429 million in 2018 and $427 million in 2017. The increases in 2019 as compared with 2018 and in 2018 as compared with 2017 reflect higher consumer service charges.
Trust income includes fees related to two significant businesses. The Institutional Client Services (“ICS”) business provides a variety of trustee, agency, investment management and administrative services for corporations and institutions, investment bankers, corporate tax, finance and legal executives, and other institutional clients who: (i) use capital markets financing structures; (ii) use independent trustees to hold retirement plan and other assets; and (iii) need investment and cash management services. The Wealth Advisory Services (“WAS”) business helps high net worth clients grow their wealth, protect it, and transfer it to their heirs. A comprehensive array of wealth management services are offered, including asset management, fiduciary services and family office services. Trust income was $573 million in 2019, compared with $538 million in 2018 and $501 million in 2017. Revenues associated with the ICS business were $311 million in 2019, $275 million in 2018 and $254 million in 2017. The increases in ICS revenue in 2019 and 2018 reflect higher sales activities and increased retirement services income resulting from growth in collective fund balances. Revenues attributable to WAS totaled $233 million, $237 million and $222 million in 2019, 2018 and 2017, respectively. The decline in such revenues in 2019 from 2018 reflects, in part, lower recurring fees due to product mix, competitive factors and lower sales. The increased revenues in 2018 as compared with the preceding year reflected stronger sales activities and improved equity market performance. Trust assets under management were $113.0 billion and $84.9 billion at December 31, 2019 and 2018, respectively. Trust assets under management include the Company’s proprietary mutual funds’ assets of $12.5 billion at December 31, 2019 and $10.8 billion at December 31, 2018. Additional trust income from investment management activities was $29 million, $26 million and $25 million in 2019, 2018 and 2017, respectively, and includes fees earned from retail customer investment accounts and from an affiliated investment manager. The Company’s trust income associated with the affiliated asset manager that was sold in September 2019 was not material during 2019, 2018 or 2017.
Brokerage services income, which includes revenues from the sale of mutual funds and annuities and securities brokerage fees, totaled $49 million in 2019, compared with $51 million in 2018 and $61 million in 2017. The decline in brokerage services income in each of the last two years resulted largely from lower income from sales of annuities. Trading account and foreign exchange activity resulted in gains of $62 million in 2019, $33 million in 2018 and $35 million in 2017. Increased activity related to interest rate swap agreements executed on behalf of commercial customers was the largest factor resulting in the higher gains in 2019 as compared with the prior two years. The Company enters into interest rate and foreign exchange contracts with customers who need such services and concomitantly enters into offsetting trading positions with third parties to minimize the risks involved with these types of transactions. Information about the notional amount of interest rate, foreign exchange and other contracts entered into by the Company for trading account purposes is included in note 18 of Notes to Financial Statements and herein under the heading “Liquidity, Market Risk, and Interest Rate Sensitivity.”
The Company recognized net gains on investment securities of $18 million in 2019 and $21 million in 2017, compared with net losses of $6 million in 2018. The gains and losses recognized in 2019 and 2018 represented unrealized gains and losses on investments in Fannie Mae and Freddie Mac preferred stock. The Company realized net gains from sales of investment securities of $21 million in 2017. Of those net gains, $18 million were associated with the sale of a portion of the Company’s Fannie Mae and Freddie Mac preferred stock holdings. The preferred stock sold had an amortized cost basis (after previous other-than-temporary impairment write-downs) of approximately $3 million.
85
Other revenues from operations totaled $469 million in 2019, compared with $451 million in 2018 and $441 million in 2017. The increase in other revenues from operations in 2019 as compared with 2018 largely reflects higher income from BLG. The increase from 2017 to 2018 reflects income of $24 million from BLG, partially offset by lower income earned from bank owned life insurance.
Included in other revenues from operations were the following significant components. Letter of credit and other credit-related fees totaled $124 million, $125 million and $123 million in 2019, 2018 and 2017, respectively. Revenues from merchant discount and credit card fees were $117 million in each of 2019 and 2018 and $120 million in 2017. As discussed in note 10 of Notes to Financial Statements, effective January 1, 2018 the Company began reporting credit card interchange revenue net of rewards granted to consumers who use the Company’s credit cards. Those rewards totaled $25 million in 2019 and $14 million in 2018. Tax-exempt income earned from bank owned life insurance, which includes increases in the cash surrender value of life insurance policies and benefits received, aggregated $50 million in 2019, compared with $48 million in 2018 and $58 million in 2017. The decrease from 2017 to 2018 was due to lower death benefit proceeds. Insurance-related sales commissions and other revenues totaled $47 million in each of 2019 and 2018, compared with $43 million in 2017. Automated teller machine usage fees aggregated $13 million in 2019, $14 million in 2018 and $15 million in 2017.
M&T’s investment in BLG resulted in income of $37 million in 2019, $24 million in 2018 and less than $1 million in 2017. During the second quarter of 2017, the operating losses of BLG resulted in M&T reducing the carrying value of its investment in BLG to zero. Subsequently, M&T received cash distributions from BLG that resulted in the recognition of income by M&T. M&T expects cash distributions from BLG in the future, but the timing and amount of those distributions cannot be estimated. BLG is entitled to receive distributions from affiliates that provide asset management and other services that are available for distribution to BLG’s owners, including M&T. Information about the Company’s relationship with BLG and its affiliates is included in note 24 of Notes to Financial Statements.
Other ExpenseOther expense aggregated $3.47 billion in 2019, compared to $3.29 billion in 2018 and $3.14 billion in 2017. Included in those amounts are expenses considered to be “nonoperating” in nature consisting of amortization of core deposit and other intangible assets of $19 million, $25 million and $31 million in 2019, 2018 and 2017, respectively. Exclusive of those nonoperating expenses, noninterest operating expenses aggregated $3.45 billion in 2019, $3.26 billion in 2018 and $3.11 billion in 2017. The rise in noninterest operating expenses in 2019 as compared with 2018 was largely attributable to increased costs for salaries and employee benefits, outside data processing and software, equipment and net occupancy, and a $48 million charge in 2019 associated with the sale of an equity investment in an asset manager. Partially offsetting those factors were lower costs associated with increases to the reserve for Wilmington Trust-related legal matters ($56 million in 2019 and $135 million in 2018) and lower contributions to The M&T Charitable Foundation of $29 million and a decline in FDIC assessments of $27 million. The most significant factors contributing to the increase in such expenses from 2017 to 2018 were higher additions to the reserve for legal matters of $71 million and increased salaries and employee benefits and professional services expenses. Those factors were partially offset by lower FDIC assessments of $33 million and charitable contributions of $21 million.
Salaries and employee benefits expense aggregated $1.90 billion in 2019, compared with $1.75 billion and $1.65 billion in 2018 and 2017, respectively. The higher levels of expenses in 2019 as compared with 2018 and in 2018 as compared with 2017 reflect increased staffing levels, the impact of merit and other increases for employees and higher incentive and stock-based compensation. Stock-based compensation totaled $76 million in 2019, compared with $66 million in 2018 and $61

86
million in 2017. The number of full-time equivalent employees were 17,503 and 16,938 at December 31, 2019 and 2018, respectively, compared with 16,456 at December 31, 2017.
The Company provides pension and other postretirement benefits for its employees, including pension, retirement savings and post-retirement benefit plans. Expenses related to such benefits totaled $76 million in 2019, $85 million in 2018 and $92 million in 2017. The amounts recorded in salaries and employee benefits expense and other costs of operations, respectively, from the preceding sentence were as follows: $98 million and ($22) million in 2019; $92 million and ($7) million in 2018; and $90 million and $2 million in 2017. The Company sponsors both defined benefit and defined contribution pension plans. Pension benefit expense for those plans was $31 million in 2019, $45 million in 2018 and $51 million in 2017. Information about the Company’s pension plans, including significant assumptions utilized in completing actuarial calculations for the plans, is included in note 12 of Notes to Financial Statements.
The Company’s retirement savings plan (“RSP”) is a defined contribution plan in which eligible employees of the Company may defer up to 50% of qualified compensation via contributions to the plan. RSP expense reflecting the Company’s employer matching contribution totaled $48 million in 2019, $43 million in 2018 and $38 million in 2017.
Excluding the nonoperating expense items already noted, nonpersonnel operating expenses were $1.55 billion in 2019, $1.51 billion in 2018 and $1.46 billion in 2017. The rise in such expenses in 2019 as compared with 2018 was predominantly the result of higher expenses for outside data processing and software, equipment and net occupancy, professional services, and the $48 million charge in 2019 associated with the sale of an equity investment in an asset manager. Those factors were partially offset by lower costs associated with legal-related matters and contributions to The M&T Charitable Foundation, and a decline in FDIC assessments. The increased operating expenses in 2018 as compared with 2017 were predominantly the result of higher legal-related and professional services costs, partially offset by lower FDIC assessments and contributions to The M&T Charitable Foundation. The declines in FDIC assessments since 2017 were due largely to the elimination of the large bank surcharge, effective October 1, 2018. The Deposit Insurance Fund Reserve Ratio exceeded the statutorily required minimum reserve ratio of 1.35% on September 30, 2018, resulting in the elimination of the surcharge. As noted previously, during 2019 the Company increased its reserve for legal matters, predominantly related to a subsidiary’s role as trustee of Employee Stock Ownership Plans in its Institutional Client Services business. In addition, during 2018 and 2017 WT Corp. reached agreements related to alleged conduct of that subsidiary prior to its acquisition by M&T that led to the Company adding $135 million and $50 million to its reserve for legal matters during 2018 and 2017, respectively. The Company made contributions to The M&T Charitable Foundation of $29 million and $50 million in 2018 and 2017, respectively. There were no similar contributions in 2019.
Income TaxesThe provision for income taxes was $618 million in 2019, $590 million in 2018 and $916 million in 2017. The effective tax rates were 24.3% in 2019, 23.5% in 2018 and 39.4% in 2017. The decrease in the effective rate in 2019 and 2018 from 2017 primarily reflects the impact of the enactment of the Tax Act that was signed into law on December 22, 2017, reducing the corporate Federal income tax rate from 35% to 21% effective January 1, 2018 and making other changes to U.S. corporate income tax laws. In December 2018, M&T received approval from the Internal Revenue Service to change its tax return treatment for certain loan fees retroactive to 2017, resulting in a $15 million reduction of income tax expense in the final quarter of 2018. In addition, accounting guidance requires that excess tax benefits and tax deficiencies associated with share-based compensation be recognized as a discrete component of income tax expense in the income statement. As a result, the Company
87
recognized a reduction of income tax expense of $2 million, $9 million and $22 million during 2019, 2018 and 2017, respectively. Furthermore, GAAP requires that the impact of the provisions of the Tax Act be accounted for in the period of enactment. Accordingly, the estimated incremental income tax expense recorded by the Company in the fourth quarter of 2017 related to the Tax Act was $85 million. That additional expense was largely attributable to the reduction in carrying value of net deferred tax assets reflecting lower future tax benefits resulting from the lower corporate tax rate. Lastly, the 2017 settlement between WT Corp. and the U.S. Attorney’s Office for the District of Delaware resulted in a $44 million payment by WT Corp. that was not deductible for income tax purposes, contributing to a higher effective tax rate in 2017. If not for the impact of the Tax Act, the accounting for excess tax benefits from share-based compensation, and the non-deductible nature of the payment referred to above, the Company’s effective tax rate in 2017 would have been 36.0%.
The effective tax rate is affected by the level of income earned that is exempt from tax relative to the overall level of pre-tax income, the level of income allocated to the various state and local jurisdictions where the Company operates, because tax rates differ among such jurisdictions, and the impact of any large discrete or infrequently occurring items. The Company’s effective tax rate in future periods will also be affected by any change in income tax laws or regulations and interpretations of income tax regulations that differ from the Company’s interpretations by any of various tax authorities that may examine tax returns filed by M&T or any of its subsidiaries. Information about amounts accrued for uncertain tax positions and a reconciliation of income tax expense to the amount computed by applying the statutory federal income tax rate to pre-tax income is provided in note 13 of Notes to Financial Statements.
International ActivitiesAssets and revenues associated with international activities represent less than 1% of the Company’s consolidated assets and revenues. International assets included $186 million and $172 million of loans to foreign borrowers at December 31, 2019 and 2018, respectively. Deposits in the Company’s office in the Cayman Islands aggregated $1.7 billion at December 31, 2019 and $812 million at December 31, 2018. The Company uses such deposits to facilitate customer demand, which increased in 2019 largely due to customers’ desire to sweep their deposit balances into higher earning products. Loans at M&T Bank’s commercial banking office in Ontario, Canada included in international assets as of December 31, 2019 and 2018 totaled $143 million and $122 million, respectively. Deposits at that office were $23 million at December 31, 2019 and $22 million at December 31, 2018. The Company also offers trust-related services in Europe. Revenues from providing such services during 2019, 2018 and 2017 were approximately $32 million, $29 million and $24 million, respectively.
Liquidity, Market Risk, and Interest Rate SensitivityAs a financial intermediary, the Company is exposed to various risks, including liquidity and market risk. Liquidity refers to the Company’s ability to ensure that sufficient cash flow and liquid assets are available to satisfy current and future obligations, including demands for loans and deposit withdrawals, funding operating costs, and other corporate purposes. Liquidity risk arises whenever the maturities of financial instruments included in assets and liabilities differ.
Core deposits represent the most significant source of funding for the Company and are generated from a large base of consumer, corporate and institutional customers. That customer base has, over the past several years, become more geographically diverse as a result of expansion of the Company’s businesses. Nevertheless, the Company faces competition in offering products and services from a large array of financial market participants, including banks, thrifts, mutual funds,
88
securities dealers and others. Core deposits financed 83% of the Company’s earning assets at December 31, 2019, compared with 78% at December 31, 2018 and 84% at December 31, 2017.
The Company supplements funding provided through core deposits with various short-term and long-term wholesale borrowings, including overnight federal funds purchased, short-term advances from the FHLB of New York, brokered deposits, Cayman Islands office deposits and longer-term borrowings. At December 31, 2019, M&T Bank had short-term and long-term credit facilities with the FHLBs aggregating $18.2 billion. Outstanding borrowings under FHLB credit facilities totaled $2 million and $4.8 billion at December 31, 2019 and 2018, respectively. Such borrowings were secured by loans and investment securities. As previously noted, in December 2018 the Company borrowed $4.2 billion from the FHLB of New York for LCR and other liquidity purposes. M&T Bank had an available line of credit with the Federal Reserve Bank of New York that totaled approximately $14.4 billion at December 31, 2019. The amount of that line is dependent upon the balances of loans and securities pledged as collateral. There were no borrowings outstanding under such line of credit at December 31, 2019 or December 31, 2018. Senior notes issued and outstanding totaled $4.9 billion at December 31, 2019 and $5.5 billion at December 31, 2018. The decline at December 31, 2019 as compared with the 2018 year-end reflects maturities of borrowings during 2019. During 2018, M&T Bank issued $1.0 billion of senior notes that mature in 2021 and M&T issued $750 million of senior notes that mature in 2023. On December 31, 2018 M&T Bank redeemed $750 million of senior notes that were due to mature in January 2019. In addition, M&T Bank redeemed $750 million of senior notes on January 7, 2020 that were due to mature in February 2020.
The Company has, from time to time, issued subordinated capital notes and junior subordinated debentures associated with trust preferred securities to provide liquidity and enhance regulatory capital ratios. Pursuant to the Dodd-Frank Act, the Company’s junior subordinated debentures associated with trust preferred securities have been phased-out of the definition of Tier 1 capital but, similar to other subordinated capital notes, are considered Tier 2 capital and are includable in total regulatory capital. Information about the Company’s borrowings is included in note 8 of Notes to Financial Statements.
Short-term federal funds borrowings totaled $137 million at December 31, 2018, while there were no such borrowings at December 31, 2019. In general, those borrowings were unsecured and matured on the next business day. In addition to satisfying customer demand, Cayman Islands office deposits may be used by the Company as an alternative to short-term borrowings. Cayman Islands office deposits totaled $1.7 billion and $812 million at December 31, 2019 and 2018, respectively. The Company has also benefited from the placement of brokered deposits. The Company has brokered savings and interest-bearing checking deposit accounts that aggregated $2.8 billion and $3.0 billion at December 31, 2019 and 2018, respectively. Brokered time deposits were not a significant source of funding as of those dates.
The Company’s ability to obtain funding from these other sources could be negatively impacted should the Company experience a substantial deterioration in its financial condition or its debt ratings, or should the availability of short-term funding become restricted due to a disruption in the financial markets. The Company attempts to quantify such credit-event risk by modeling scenarios that estimate the liquidity impact resulting from a short-term ratings downgrade over various grading levels. Such impact is estimated by attempting to measure the effect on available unsecured lines of credit, available capacity from secured borrowing sources and securitizable assets. Information about the credit ratings of M&T and M&T Bank is presented in table 17. Additional information regarding the terms and maturities of all of the Company’s short-term and long-term borrowings is provided in note 8 of Notes to Financial Statements. In addition to deposits and borrowings, other sources of liquidity include maturities of investment securities and other earning assets, repayments of loans and investment securities, and cash generated from operations, such as fees collected for services.
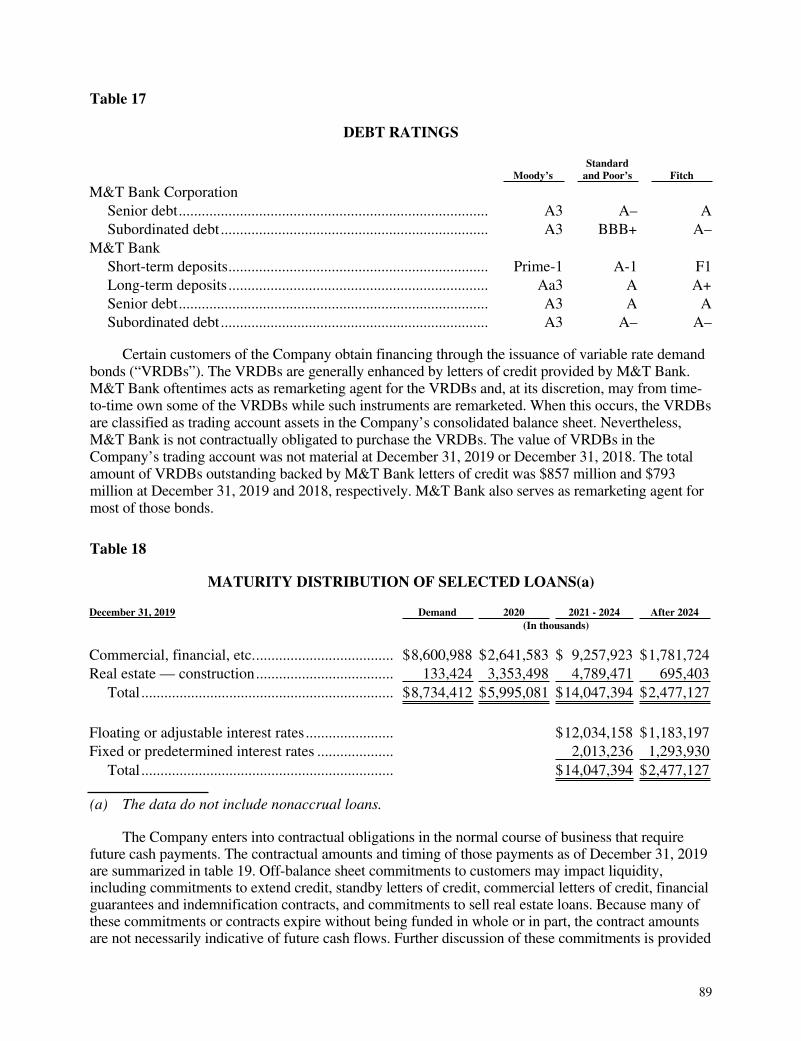
89
Table 17
DEBT RATINGS
Moody’s Standard
and Poor’s Fitch
M&T Bank Corporation Senior debt................................................................................. A3 A– ASubordinated debt...................................................................... A3 BBB+ A–
M&T Bank Short-term deposits.................................................................... Prime-1 A-1 F1Long-term deposits .................................................................... Aa3 A A+Senior debt................................................................................. A3 A ASubordinated debt...................................................................... A3 A– A–
Certain customers of the Company obtain financing through the issuance of variable rate demand bonds (“VRDBs”). The VRDBs are generally enhanced by letters of credit provided by M&T Bank. M&T Bank oftentimes acts as remarketing agent for the VRDBs and, at its discretion, may from time-to-time own some of the VRDBs while such instruments are remarketed. When this occurs, the VRDBs are classified as trading account assets in the Company’s consolidated balance sheet. Nevertheless, M&T Bank is not contractually obligated to purchase the VRDBs. The value of VRDBs in the Company’s trading account was not material at December 31, 2019 or December 31, 2018. The total amount of VRDBs outstanding backed by M&T Bank letters of credit was $857 million and $793 million at December 31, 2019 and 2018, respectively. M&T Bank also serves as remarketing agent for most of those bonds.
Table 18
MATURITY DISTRIBUTION OF SELECTED LOANS(a)
December 31, 2019 Demand 2020 2021 - 2024 After 2024 (In thousands)
Commercial, financial, etc..................................... $8,600,988 $2,641,583 $ 9,257,923 $1,781,724 Real estate — construction.................................... 133,424 3,353,498 4,789,471 695,403
Total.................................................................. $8,734,412 $5,995,081 $14,047,394 $2,477,127
Floating or adjustable interest rates....................... $12,034,158 $1,183,197 Fixed or predetermined interest rates .................... 2,013,236 1,293,930
Total.................................................................. $14,047,394 $2,477,127
(a) The data do not include nonaccrual loans.
The Company enters into contractual obligations in the normal course of business that require future cash payments. The contractual amounts and timing of those payments as of December 31, 2019 are summarized in table 19. Off-balance sheet commitments to customers may impact liquidity, including commitments to extend credit, standby letters of credit, commercial letters of credit, financial guarantees and indemnification contracts, and commitments to sell real estate loans. Because many of these commitments or contracts expire without being funded in whole or in part, the contract amounts are not necessarily indicative of future cash flows. Further discussion of these commitments is provided

90
in note 21 of Notes to Financial Statements. Table 19 summarizes the Company’s other commitments as of December 31, 2019 and the timing of the expiration of such commitments.
Table 19
CONTRACTUAL OBLIGATIONS AND OTHER COMMITMENTS
December 31, 2019 Less Than One
Year One to Three
Years Three to Five
Years Over Five
Years Total (In thousands)
Payments due for contractual obligations
Time deposits....................... $ 4,078,663 $1,592,344 $ 86,449 $ — $ 5,757,456 Deposits at Cayman Islands office .................... 1,684,044 — — — 1,684,044 Short-term borrowings......... 62,363 — — — 62,363 Long-term borrowings......... 2,010,251 2,414,461 770,690 1,790,784 6,986,186 Operating leases................... 100,386 173,172 106,147 107,850 487,555 Other .................................... 258,069 187,113 15,994 27,871 489,047 Total..................................... $ 8,193,776 $4,367,090 $ 979,280 $1,926,505 $15,466,651
Other commitments Commitments to extend credit (a)............................ $11,861,919 $8,169,759 $7,439,686 $4,206,642 $31,678,006 Standby letters of credit....... 1,329,397 607,035 287,533 217,467 2,441,432 Commercial letters of credit ................................. 10,658 30,300 101 — 41,059 Financial guarantees and indemnification contracts............................ 160,685 246,159 382,357 3,319,371 4,108,572 Commitments to sell real estate loans........................ 882,915 23,122 — — 906,037 Total..................................... $14,245,574 $9,076,375 $8,109,677 $7,743,480 $39,175,106
(a) Amounts exclude discretionary funding commitments to commercial customers of $9.1 billion that the Company has the unconditional right to cancel prior to funding.
M&T’s primary source of funds to pay for operating expenses, shareholder dividends and treasury stock repurchases has historically been the receipt of dividends from its banking subsidiaries, which are subject to various regulatory limitations. Dividends from any bank subsidiary to M&T are limited by the amount of earnings of the subsidiary in the current year and the two preceding years. For purposes of that test, at December 31, 2019 approximately $605 million was available for payment of dividends to M&T from banking subsidiaries. M&T also may obtain funding through long-term borrowings. Outstanding senior notes of M&T at December 31, 2019 and December 31, 2018 were $770 million and $756 million, respectively. Junior subordinated debentures of M&T associated with trust preferred securities outstanding at December 31, 2019 and December 31, 2018 totaled $525 million and $522 million, respectively.
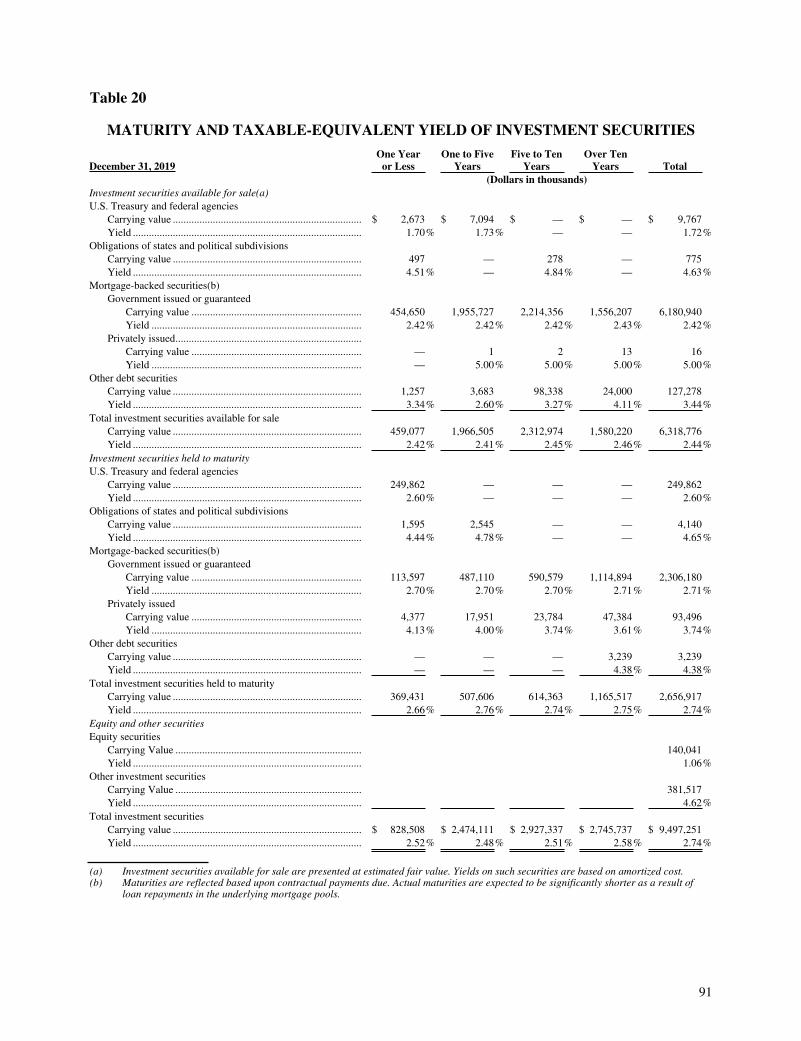
91
Table 20
MATURITY AND TAXABLE-EQUIVALENT YIELD OF INVESTMENT SECURITIES
December 31, 2019 One Year
or Less One to Five
Years Five to Ten
Years Over Ten
Years Total (Dollars in thousands) Investment securities available for sale(a) U.S. Treasury and federal agencies
Carrying value ....................................................................... $ 2,673 $ 7,094 $ — $ — $ 9,767 Yield ...................................................................................... 1.70% 1.73% — — 1.72%
Obligations of states and political subdivisions Carrying value ....................................................................... 497 — 278 — 775 Yield ...................................................................................... 4.51% — 4.84% — 4.63%
Mortgage-backed securities(b) Government issued or guaranteed
Carrying value ................................................................ 454,650 1,955,727 2,214,356 1,556,207 6,180,940 Yield ............................................................................... 2.42% 2.42% 2.42% 2.43% 2.42%
Privately issued...................................................................... Carrying value ................................................................ — 1 2 13 16 Yield ............................................................................... — 5.00% 5.00% 5.00% 5.00%
Other debt securities Carrying value ....................................................................... 1,257 3,683 98,338 24,000 127,278 Yield ...................................................................................... 3.34% 2.60% 3.27% 4.11% 3.44%
Total investment securities available for sale Carrying value ....................................................................... 459,077 1,966,505 2,312,974 1,580,220 6,318,776 Yield ...................................................................................... 2.42% 2.41% 2.45% 2.46% 2.44%
Investment securities held to maturity U.S. Treasury and federal agencies
Carrying value ....................................................................... 249,862 — — — 249,862 Yield ...................................................................................... 2.60% — — — 2.60%
Obligations of states and political subdivisions Carrying value ....................................................................... 1,595 2,545 — — 4,140 Yield ...................................................................................... 4.44% 4.78% — — 4.65%
Mortgage-backed securities(b) Government issued or guaranteed
Carrying value ................................................................ 113,597 487,110 590,579 1,114,894 2,306,180 Yield ............................................................................... 2.70% 2.70% 2.70% 2.71% 2.71%
Privately issued Carrying value ................................................................ 4,377 17,951 23,784 47,384 93,496 Yield ............................................................................... 4.13% 4.00% 3.74% 3.61% 3.74%
Other debt securities Carrying value ....................................................................... — — — 3,239 3,239 Yield ...................................................................................... — — — 4.38% 4.38%
Total investment securities held to maturity Carrying value ....................................................................... 369,431 507,606 614,363 1,165,517 2,656,917 Yield ...................................................................................... 2.66% 2.76% 2.74% 2.75% 2.74%
Equity and other securities Equity securities
Carrying Value ...................................................................... 140,041 Yield ...................................................................................... 1.06%
Other investment securities Carrying Value ...................................................................... 381,517 Yield ...................................................................................... 4.62%
Total investment securities Carrying value ....................................................................... $ 828,508 $ 2,474,111 $ 2,927,337 $ 2,745,737 $ 9,497,251 Yield ...................................................................................... 2.52% 2.48% 2.51% 2.58% 2.74%
(a) Investment securities available for sale are presented at estimated fair value. Yields on such securities are based on amortized cost.(b) Maturities are reflected based upon contractual payments due. Actual maturities are expected to be significantly shorter as a result of
loan repayments in the underlying mortgage pools.

92
Table 21
MATURITY OF DOMESTIC CERTIFICATES OF DEPOSIT AND TIME DEPOSITSWITH BALANCES OF $100,000 OR MORE
December 31, 2019 (In thousands)
Under 3 months ................................................................................................................. $ 371,255 3 to 6 months ..................................................................................................................... 410,710 6 to 12 months ................................................................................................................... 1,045,793 Over 12 months ................................................................................................................. 783,444
Total.............................................................................................................................. $ 2,611,202
Management closely monitors the Company’s liquidity position on an ongoing basis for compliance with internal policies and believes that available sources of liquidity are adequate to meet funding needs anticipated in the normal course of business. Management does not anticipate engaging in any activities, either currently or in the long-term, for which adequate funding would not be available and would therefore result in a significant strain on liquidity at either M&T or its subsidiary banks.
Market risk is the risk of loss from adverse changes in the market prices and/or interest rates of the Company’s financial instruments. The primary market risk the Company is exposed to is interest rate risk. Interest rate risk arises from the Company’s core banking activities of lending and deposit-taking, because assets and liabilities reprice at different times and by different amounts as interest rates change. As a result, net interest income earned by the Company is subject to the effects of changing interest rates. The Company measures interest rate risk by calculating the variability of net interest income in future periods under various interest rate scenarios using projected balances for earning assets, interest-bearing liabilities and derivatives used to hedge interest rate risk. Management’s philosophy toward interest rate risk management is to limit the variability of net interest income. The balances of financial instruments used in the projections are based on expected growth from forecasted business opportunities, anticipated prepayments of loans and investment securities, and expected maturities of investment securities, loans and deposits. Management uses a “value of equity” model to supplement the modeling technique described above. Those supplemental analyses are based on discounted cash flows associated with on- and off-balance sheet financial instruments. Such analyses are modeled to reflect changes in interest rates and provide management with a long-term interest rate risk metric. The Company has entered into interest rate swap agreements to help manage exposure to interest rate risk. At December 31, 2019, the aggregate notional amount of interest rate swap agreements entered into for interest rate risk management purposes that were currently in effect was $17.2 billion. In addition, the Company has entered into $40.4 billion of forward-starting interest rate swap agreements. Information about interest rate swap agreements entered into for interest rate risk management purposes is included herein under the heading “Net Interest Income/Lending and Funding Activities” and in note 18 of Notes to Financial Statements.
The Company’s Asset-Liability Committee, which includes members of senior management, monitors the sensitivity of the Company’s net interest income to changes in interest rates with the aid of a computer model that forecasts net interest income under different interest rate scenarios. In modeling changing interest rates, the Company considers different yield curve shapes that consider both parallel (that is, simultaneous changes in interest rates at each point on the yield curve) and non-

93
parallel (that is, allowing interest rates at points on the yield curve to vary by different amounts) shifts in the yield curve. In utilizing the model, market-implied forward interest rates over the subsequent twelve months are generally used to determine a base interest rate scenario for the net interest income simulation. That calculated base net interest income is then compared to the income calculated under the varying interest rate scenarios. The model considers the impact of ongoing lending and deposit-gathering activities, as well as interrelationships in the magnitude and timing of the repricing of financial instruments, including the effect of changing interest rates on expected prepayments and maturities. When deemed prudent, management has taken actions to mitigate exposure to interest rate risk through the use of on- or off-balance sheet financial instruments and intends to do so in the future. Possible actions include, but are not limited to, changes in the pricing of loan and deposit products, modifying the composition of earning assets and interest-bearing liabilities, and adding to, modifying or terminating existing interest rate swap agreements or other financial instruments used for interest rate risk management purposes.
Table 22 displays as of December 31, 2019 and 2018 the estimated impact on net interest income in the base scenario described above resulting from parallel changes in interest rates across repricing categories during the first modeling year.
Table 22
SENSITIVITY OF NET INTEREST INCOME TO CHANGES IN INTEREST RATES
Calculated Increase (Decrease)in Projected Net Interest Income
December 31 Changes in interest rates 2019 2018 (In thousands) +200 basis points................................................................................ $ 45,345 37,513 +100 basis points................................................................................ 35,838 36,727 -100 basis points................................................................................. (94,616) (114,307)
The Company utilized many assumptions to calculate the impact that changes in interest rates may have on net interest income. The more significant of those assumptions included the rate of prepayments of mortgage-related assets, cash flows from derivative and other financial instruments held for non-trading purposes, loan and deposit volumes and pricing, and deposit maturities. In the scenarios presented, the Company also assumed gradual changes in interest rates during a twelve-month period as compared with the base scenario. In the declining rate scenario, the rate changes may be limited to lesser amounts such that interest rates remain positive on all points of the yield curve. The assumptions used in interest rate sensitivity modeling are inherently uncertain and, as a result, the Company cannot precisely predict the impact of changes in interest rates on net interest income. Actual results may differ significantly from those presented due to the timing, magnitude and frequency of changes in interest rates and changes in market conditions and interest rate differentials (spreads) between maturity/repricing categories, as well as any actions, such as those previously described, which management may take to counter such changes. The sensitivity of net interest income to changes in interest rates lessened as of December 31, 2019 as compared with a year earlier as the Company has entered into interest rate swap agreements to mitigate exposure to declining interest rates. In light of the uncertainties and assumptions associated with the process, the amounts presented in the table are not considered significant to the Company’s past or projected net interest income.
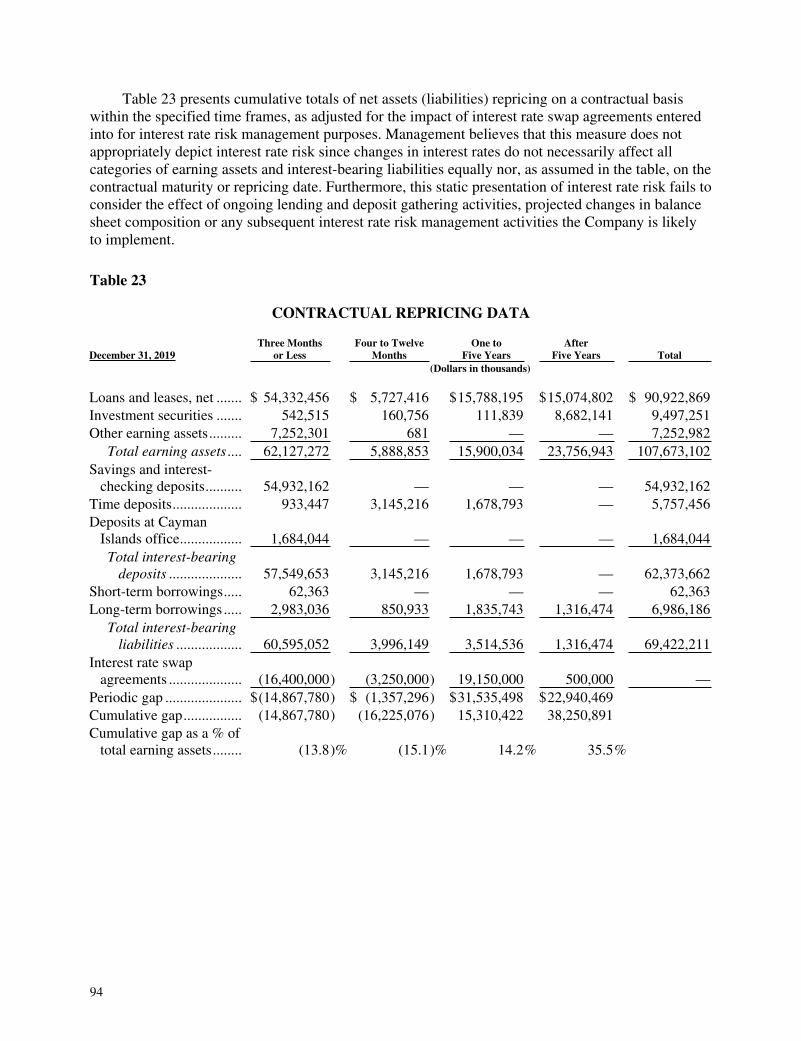
94
Table 23 presents cumulative totals of net assets (liabilities) repricing on a contractual basis within the specified time frames, as adjusted for the impact of interest rate swap agreements entered into for interest rate risk management purposes. Management believes that this measure does not appropriately depict interest rate risk since changes in interest rates do not necessarily affect all categories of earning assets and interest-bearing liabilities equally nor, as assumed in the table, on the contractual maturity or repricing date. Furthermore, this static presentation of interest rate risk fails to consider the effect of ongoing lending and deposit gathering activities, projected changes in balance sheet composition or any subsequent interest rate risk management activities the Company is likely to implement.
Table 23
CONTRACTUAL REPRICING DATA
December 31, 2019 Three Months
or Less Four to Twelve
Months One to
Five Years After
Five Years Total (Dollars in thousands)
Loans and leases, net ....... $ 54,332,456 $ 5,727,416 $15,788,195 $15,074,802 $ 90,922,869 Investment securities ....... 542,515 160,756 111,839 8,682,141 9,497,251 Other earning assets......... 7,252,301 681 — — 7,252,982
Total earning assets.... 62,127,272 5,888,853 15,900,034 23,756,943 107,673,102 Savings and interest- checking deposits.......... 54,932,162 — — — 54,932,162 Time deposits................... 933,447 3,145,216 1,678,793 — 5,757,456 Deposits at Cayman Islands office................. 1,684,044 — — — 1,684,044
Total interest-bearing deposits .................... 57,549,653 3,145,216 1,678,793 — 62,373,662
Short-term borrowings..... 62,363 — — — 62,363 Long-term borrowings..... 2,983,036 850,933 1,835,743 1,316,474 6,986,186
Total interest-bearing liabilities .................. 60,595,052 3,996,149 3,514,536 1,316,474 69,422,211
Interest rate swap agreements .................... (16,400,000) (3,250,000) 19,150,000 500,000 — Periodic gap ..................... $(14,867,780) $ (1,357,296) $31,535,498 $22,940,469 Cumulative gap................ (14,867,780) (16,225,076) 15,310,422 38,250,891 Cumulative gap as a % of total earning assets........ (13.8)% (15.1)% 14.2% 35.5%

95
Changes in fair value of the Company’s financial instruments can also result from a lack of trading activity for similar instruments in the financial markets. That impact is most notable on the values assigned to some of the Company’s investment securities. Information about the fair valuation of investment securities is presented herein under the heading “Capital” and in notes 2 and 20 of Notes to Financial Statements.
The Company engages in limited trading account activities to meet the financial needs of customers and to fund the Company’s obligations under certain deferred compensation plans. Financial instruments utilized for trading account activities consist predominantly of interest rate contracts, such as interest rate swap agreements, and forward and futures contracts related to foreign currencies. The Company generally mitigates the foreign currency and interest rate risk associated with trading account activities by entering into offsetting trading positions that are also included in the trading account. The fair values of trading account positions associated with interest rate contracts and foreign currency and other option and futures contracts are presented in note 18 of Notes to Financial Statements. The amounts of gross and net trading account positions, as well as the type of trading account activities conducted by the Company, are subject to a well-defined series of potential loss exposure limits established by management and approved by M&T’s Board of Directors. However, as with any non-government guaranteed financial instrument, the Company is exposed to credit risk associated with counterparties to the Company’s trading account activities.
The notional amounts of interest rate contracts entered into for trading account purposes totaled $48.6 billion at December 31, 2019 and $42.9 billion at December 31, 2018. The notional amounts of foreign currency and other option and futures contracts entered into for trading account purposes were $1.2 billion and $763 million at December 31, 2019 and 2018, respectively. Although the notional amounts of these contracts are not recorded in the consolidated balance sheet, the unsettled fair values of all financial instruments used for trading account activities are recorded in the consolidated balance sheet. The fair values of all trading account assets and liabilities were $470 million and $80 million, respectively, at December 31, 2019 and $186 million and $178 million, respectively, at December 31, 2018. The fair value asset and liability amounts at December 31, 2019 have been reduced by contractual settlements of $43 million and $281 million, respectively, and at December 31, 2018 by contractual settlements of $171 million and $50 million, respectively. The higher balance of trading account assets at December 31, 2019 was largely the result of increased values associated with interest rate swap agreements entered into with commercial customers that are not subject to periodic variation margin settlement payments. Included in trading account assets at each of December 31, 2019 and 2018 were $21 million of assets related to deferred compensation plans. Changes in the fair values of such assets are recorded as “trading account and foreign exchange gains” in the consolidated statement of income. Included in “other liabilities” in the consolidated balance sheet at each of December 31, 2019 and 2018 were $25 million of liabilities related to deferred compensation plans. Changes in the balances of such liabilities due to the valuation of allocated investment options to which the liabilities are indexed are recorded in “other costs of operations” in the consolidated statement of income. Also included in trading account assets were investments in mutual funds and other assets that the Company was required to hold under terms of certain non-qualified supplemental retirement and other benefit plans that were assumed by the Company in various acquisitions. Those assets totaled $28 million and $25 million at December 31, 2019 and December 31, 2018, respectively.
Given the Company’s policies, limits and positions, management believes that the potential loss exposure to the Company resulting from market risk associated with trading account activities was not material, however, as previously noted, the Company is exposed to credit risk associated with counterparties to transactions related to the Company’s trading account activities. Additional information about the Company’s use of derivative financial instruments in its trading account activities is included in note 18 of Notes to Financial Statements.
96
CapitalShareholders’ equity was $15.7 billion at December 31, 2019 and represented 13.11% of total assets, compared with $15.5 billion or 12.87% at December 31, 2018 and $16.3 billion or 13.70% at December 31, 2017.
Included in shareholders’ equity was preferred stock with financial statement carrying values of $1.25 billion at December 31, 2019 and $1.23 billion at December 31, 2018. On July 30, 2019, M&T issued 40,000 shares of Series G Perpetual Fixed-Rate Reset Non-cumulative Preferred Stock, par value $1.00 per share and liquidation preference of $10,000 per share. Through July 31, 2024 holders of the Series G preferred stock are entitled to receive, only when, as and if declared by M&T’s Board of Directors, non-cumulative cash dividends at an annual rate of 5.0%, payable semiannually in arrears. Subsequent to July 31, 2024 holders will be entitled to receive, only when, as and if declared by M&T’s Board of Directors, non-cumulative cash dividends at an annual rate of the five-year U.S. Treasury Rate plus 3.174%, payable semiannually in arrears. The Series G preferred stock may be redeemed at M&T’s option, in whole or in part, on any dividend payment date on or after August 1, 2024 or, in whole but not in part, at any time within 90 days following a regulatory capital treatment event whereby the full liquidation value of the shares no longer qualifies as “additional Tier 1 capital.” On August 30, 2019 M&T redeemed the 230,000 shares of the Series A and 151,500 shares of the Series C Fixed Rate Cumulative Perpetual Preferred Stock, $1,000 liquidation preference per share, having received the approval of the Federal Reserve to redeem such shares after issuing the Series G preferred stock. Further information concerning M&T’s preferred stock can be found in note 9 of Notes to Financial Statements.
Common shareholders’ equity totaled $14.5 billion, or $110.78 per share, at December 31, 2019, compared with $14.2 billion, or $102.69 per share, at December 31, 2018 and $15.0 billion, or $100.03 per share, at December 31, 2017. Tangible equity per common share, which excludes goodwill and core deposit and other intangible assets and applicable deferred tax balances, was $75.44 at December 31, 2019, compared with $69.28 and $69.08 at December 31, 2018 and 2017, respectively. The Company’s ratio of tangible common equity to tangible assets was 8.55% at December 31, 2019, compared with 8.31% and 9.10% at December 31, 2018 and 2017, respectively. Reconciliations of total common shareholders’ equity and tangible common equity and total assets and tangible assets as of December 31, 2019, 2018 and 2017 are presented in table 2. During 2019, 2018 and 2017, the ratio of average total shareholders’ equity to average total assets was 13.14%, 13.36% and 13.48%, respectively. The ratio of average common shareholders’ equity to average total assets was 12.08%, 12.31% and 12.46% in 2019, 2018 and 2017, respectively.
Shareholders’ equity reflects accumulated other comprehensive income or loss, which includes the net after-tax impact of unrealized gains or losses on investment securities classified as available for sale, unrealized losses on held-to-maturity securities for which an other-than-temporary impairment charge has been recognized, gains or losses associated with interest rate swap agreements designated as cash flow hedges, foreign currency translation adjustments and adjustments to reflect the funded status of defined benefit pension and other postretirement plans. Net unrealized gains on investment securities reflected in shareholders’ equity, net of applicable tax effect, were $37 million, or $.29 per common share, at December 31, 2019, compared with net unrealized losses of $148 million, or $1.06 per common share, at December 31, 2018 and $44 million, or $.29 per common share, at December 31, 2017. Changes in unrealized gains and losses on investment securities are predominantly reflective of the impact of changes in interest rates on the values of such securities. Information about unrealized gains and losses as of December 31, 2019 and 2018 is included in note 2 of Notes to Financial Statements.
Reflected in the carrying amount of available-for-sale investment securities at December 31, 2019 were pre-tax effect unrealized gains of $91 million on securities with an amortized cost of $4.0 billion and pre-tax effect unrealized losses of $30 million on securities with an amortized cost of

97
$2.2 billion. Information concerning the Company’s fair valuations of investment securities is provided in note 20 of Notes to Financial Statements.
Each reporting period the Company reviews its investment securities for other-than-temporary impairment. For debt securities, the Company analyzes the creditworthiness of the issuer or reviews the credit performance of the underlying collateral supporting the bond. For debt securities backed by pools of loans, such as privately issued mortgage-backed securities, the Company estimates the cash flows of the underlying loan collateral using forward-looking assumptions for default rates, loss severities and prepayment speeds. Estimated collateral cash flows are then utilized to estimate bond-specific cash flows to determine the ultimate collectibility of the bond. If the present value of the cash flows indicates that the Company should not expect to recover the entire amortized cost basis of a bond or if the Company intends to sell the bond or it more likely than not will be required to sell the bond before recovery of its amortized cost basis, an other-than-temporary impairment loss is recognized. If an other-than-temporary impairment loss is deemed to have occurred, the investment security’s cost basis is adjusted, as appropriate for the circumstances.
As of December 31, 2019, based on a review of each of the securities in the investment securities portfolio, the Company concluded that the declines in the values of any securities containing an unrealized loss were temporary and that any additional other-than-temporary impairment charges were not appropriate. At December 31, 2019, the Company did not intend to sell nor is it anticipated that it would be required to sell any of its impaired securities, that is, where fair value is less than the cost basis of the security. The Company intends to continue to closely monitor the performance of its securities because changes in their underlying credit performance or other events could cause the cost basis of those securities to become other-than-temporarily impaired. However, because the unrealized losses on available-for-sale investment securities have generally already been reflected in the financial statement values for investment securities and shareholders’ equity, any recognition of an other-than-temporary decline in value of those investment securities would not have a material effect on the Company’s consolidated financial condition. Any other-than-temporary impairment charge related to held-to-maturity securities would result in reductions in the financial statement values for investment securities and shareholders’ equity. Additional information concerning fair value measurements and the Company’s approach to the classification of such measurements is included in note 20 of Notes to Financial Statements.
The Company assessed impairment losses on privately issued mortgage-backed securities in the held-to-maturity portfolio by performing internal modeling to estimate bond-specific cash flows considering recent performance of the mortgage loan collateral and utilizing assumptions about future defaults and loss severity. These bond-specific cash flows also reflect the placement of the bond in the overall securitization structure and the remaining subordination levels. In total, at December 31, 2019 and 2018, the Company had in its held-to-maturity portfolio privately issued mortgage-backed securities with an amortized cost basis of $93 million and $113 million, respectively, and a fair value of $87 million and $103 million, respectively. At December 31, 2019, 81% of the mortgage-backed securities were in the most senior tranche of the securitization structure with 9% being independently rated as investment grade. The mortgage-backed securities are generally collateralized by residential and small-balance commercial real estate loans originated between 2004 and 2008 and had a weighted-average credit enhancement of 11% at December 31, 2019, calculated by dividing the remaining unpaid principal balance of bonds subordinate to the bonds owned by the Company plus any overcollateralization remaining in the securitization structure by the remaining unpaid principal balance of all bonds in the securitization structure. The weighted-average default percentage and loss severity assumptions utilized in the Company’s internal modeling were 31% and 66%, respectively. Given the terms of the securitization structure, some of the bonds held by the Company may defer interest payments in certain circumstances, but after considering the repayment structure and estimated future collateral cash flows of each individual
98
senior and subordinate tranche bond, the Company has concluded that as of December 31, 2019 those privately issued mortgage-backed securities were not other-than-temporarily impaired. Nevertheless, it is possible that adverse changes in the future performance of mortgage loan collateral underlying such securities could impact the Company’s conclusions.
Adjustments to reflect the funded status of defined benefit pension and other postretirement plans, net of applicable tax effect, reduced accumulated other comprehensive income by $342 million, or $2.62 per common share, at December 31, 2019, $261 million, or $1.89 per common share, at December 31, 2018 and $305 million, or $2.03 per common share, at December 31, 2017. Information about the funded status of the Company’s pension and other postretirement benefit plans is included in note 12 of Notes to Financial Statements.
Pursuant to previously approved capital plans and authorizations by M&T’s Board of Directors, during 2019 M&T repurchased 8,257,000 common shares for $1.3 billion. During 2018, M&T repurchased 12,295,817 common shares for $2.2 billion. In 2017, M&T repurchased 7,369,105 common shares for $1.2 billion.
During the fourth quarter of 2019, M&T’s Board of Directors authorized an increase in the quarterly common stock dividend to $1.10 per common share from the previous rate of $1.00 per common share. During 2018, M&T’s Board of Directors authorized increases in the quarterly common stock dividend to $.80 per common share in the second quarter from the previous rate of $.75 per common share and to $1.00 per common share in the third quarter. Cash dividends declared on M&T’s common stock totaled $552 million in 2019, compared with $511 million and $457 million in 2018 and 2017, respectively. Dividends per common share totaled $4.10 in 2019, compared with $3.55 and $3.00 in 2018 and 2017, respectively. Dividends of $72 million in 2019 and $73 million in each of 2018 and 2017 were declared on preferred stock in accordance with the terms of each series.
M&T and its subsidiary banks are required to comply with applicable capital adequacy standards established by the federal banking agencies. Pursuant to those regulations, the minimum capital ratios are as follows:
• 4.5% Common Equity Tier 1 (“CET1”) to risk-weighted assets (each as defined in the capital regulations);
• 6.0% Tier 1 capital (that is, CET1 plus Additional Tier 1 capital) to risk-weighted assets (each as defined in the capital regulations);
• 8.0% Total capital (that is, Tier 1 capital plus Tier 2 capital) to risk-weighted assets (each as defined in the capital regulations); and
• 4.0% Tier 1 capital to average consolidated assets as reported on consolidated financial statements (known as the “leverage ratio”), as defined in the capital regulations.
In addition, capital regulations require a “capital conservation buffer” of 2.5% composed entirely of CET1 on top of these minimum risk-weighted asset ratios. The regulatory capital amounts and ratios of M&T and its bank subsidiaries as of December 31, 2019 are presented in note 23 of Notes to Financial Statements. A detailed discussion of the regulatory capital rules is included in Part I, Item 1 of this Form 10-K under the heading “Capital Requirements.”
The Company is subject to the comprehensive regulatory framework applicable to bank and financial holding companies and their subsidiaries, which includes regular examinations by a number of federal regulators. Regulation of financial institutions such as M&T and its subsidiaries is intended primarily for the protection of depositors, the Deposit Insurance Fund of the FDIC and the banking and financial system as a whole, and generally is not intended for the protection of shareholders, investors or creditors other than insured depositors. Changes in laws, regulations and regulatory policies applicable to the Company’s operations can increase or decrease the cost of doing business, limit or expand permissible activities or affect the competitive environment in which the Company operates, all

99
of which could have a material effect on the business, financial condition or results of operations of the Company and in M&T’s ability to pay dividends. For additional information concerning this comprehensive regulatory framework, refer to Part I, Item 1 of this Form 10-K.
Fourth Quarter ResultsNet income in the fourth quarter of 2019 was $493 million, compared with $546 million in the year-earlier quarter. Diluted and basic earnings per common share were each $3.60 in the final three months of 2019, compared with diluted and basic earnings per common share of $3.76 in the final three months of 2018. The annualized rates of return on average assets and average common shareholders’ equity for the final quarter of 2019 were 1.60% and 12.95%, respectively, compared with 1.84% and 14.80%, respectively, in the corresponding quarter of 2018.
Net operating income during 2019’s fourth quarter was $496 million, compared with $550 million in the year-earlier quarter. Diluted net operating earnings per common share were $3.62 and $3.79 in the fourth quarters of 2019 and 2018, respectively. The annualized net operating returns on average tangible assets and average tangible common equity in the final three months of 2019 were 1.67% and 19.08%, respectively, compared with 1.93% and 22.16%, respectively, in the similar 2018 period. Reconciliations of GAAP results with non-GAAP results for the quarterly periods of 2019 and 2018 are provided in table 25.
Taxable-equivalent net interest income aggregated $1.01 billion in the final quarter of 2019, compared with $1.06 billion in the year-earlier period. That decline was predominantly attributable to a 28 basis point narrowing of the net interest margin to 3.64% in the fourth quarter of 2019 from 3.92% in the final three months of 2018. Partially offsetting the impact of the lower net interest margin was a 3% rise in average earning assets, from $107.8 billion in 2018 to $110.6 billion in 2019. That growth reflects higher average balances of loans and leases, interest-bearing deposits at the Federal Reserve Bank of New York and agreements to resell investment securities, offset by lower average balances of investment securities. Average balances of commercial loans and leases were $23.5 billion in the recent quarter, up $1.2 billion or 5% from $22.4 billion in the fourth quarter of 2018. Average commercial real estate loan balances aggregated $35.0 billion in the final quarter of 2019, up $1.5 billion or 4% from $33.6 billion in the year-earlier quarter. Included in those totals were average balances of loans held for sale of $201 million in the final three months of 2019, compared with $252 million in the similar period of 2018. Average residential real estate loan balances declined $1.1 billion to $16.3 billion in the fourth quarter of 2019 from $17.4 billion in the year-earlier quarter, reflecting ongoing repayments of loans obtained in the acquisition of Hudson City. Included in the residential real estate loan portfolio were loans held for sale that averaged $382 million and $229 million in the final quarters of 2019 and 2018, respectively. Consumer loans averaged $15.3 billion in the last three months of 2019, $1.4 billion or 10% higher than in the corresponding 2018 quarter. That increase resulted from higher average balances of automobile and recreational finance loans. Total loans and leases at December 31, 2019 rose $2.5 billion to $90.9 billion from $88.5 billion at December 31, 2018. Higher commercial loans, commercial real estate loans and consumer loans were partially offset by lower residential real estate loans, reflecting ongoing repayments of loans obtained in the Hudson City acquisition. The net interest spread narrowed in the fourth quarter of 2019 to 3.30%, down 27 basis points from 3.57% in the corresponding quarter of 2018. The yield on earning assets in the last three months of 2019 was 4.27%, down 24 basis points from the year-earlier quarter. That decline reflects the impact of decreases in short-term interest rates initiated by the Federal Reserve in 2019 that contributed to lower yields on loans and leases. The rate paid on interest-bearing liabilities in the 2019’s final quarter was .97%, up 3 basis points from .94% in the similar quarter of 2018. That increase was due, in part, to higher interest rates on deposit accounts associated with the residential mortgage servicing
100
business. The contribution of net interest-free funds to the Company’s net interest margin was .34% and .35% in the fourth quarters of 2019 and 2018, respectively. As a result, the Company’s net interest margin narrowed to 3.64% in the fourth quarter of 2019 from 3.92% in the year-earlier period.
The provision for credit losses was $54 million for the quarter ended December 31, 2019, compared with $38 million in the year-earlier period. Net loan charge-offs were $41 million in the last three months of 2019, representing an annualized .18% of average loans and leases outstanding, compared with $38 million or .17% during the similar 2018 period. Net charge-offs in the fourth quarters of 2019 and 2018 included: net charge-offs of residential real estate loans of less than $1 million in 2019 and $2 million in 2018; net charge-offs of commercial real estate loans of less than $1 million in 2019, compared with net recoveries of less than $1 million in 2018; net charge-offs of commercial loans of $14 million in 2019 and $10 million in 2018; and net charge-offs of consumer loans of $27 million in each of 2019 and 2018.
Other income rose to $521 million in the fourth quarter of 2019 from $481 million in the similar 2018 period. That improvement resulted from significantly higher residential mortgage banking revenues and trust income, partially offset by unrealized losses on investment securities. The rise in residential mortgage banking revenues reflects higher origination and servicing income. The higher trust income was largely due to increased revenues from the ICS businesses.
Other expense totaled $824 million during the recent quarter, compared with $802 million in the final quarter of 2018. Included in such amounts are expenses considered to be “nonoperating” in nature consisting of amortization of core deposit and other intangible assets of $4 million and $5 million during the quarters ended December 31, 2019 and 2018, respectively. Exclusive of those nonoperating expenses, noninterest operating expenses were $819 million in the fourth quarter of 2019 and $797 million in the corresponding 2018 quarter. Significant factors contributing to the higher level of noninterest operating expenses in 2019’s final quarter as compared with the year-earlier quarter were increased costs for salaries and employee benefits and outside data processing and software, partially offset by lower contributions to The M&T Charitable Foundation and a reduction of the valuation allowance for capitalized residential mortgage servicing rights. The Company’s efficiency ratio during the final quarters of 2019 and 2018 was 53.1% and 51.7%, respectively. Table 25 includes a reconciliation of other expense to noninterest operating expense and the calculation of the efficiency ratio for each of the quarters of 2019 and 2018.
Segment Information In accordance with GAAP, the Company’s reportable segments have been determined based upon its internal profitability reporting system, which is organized by strategic business unit. Certain strategic business units have been combined for segment information reporting purposes where the nature of the products and services, the type of customer, and the distribution of those products and services are similar. The reportable segments are Business Banking, Commercial Banking, Commercial Real Estate, Discretionary Portfolio, Residential Mortgage Banking and Retail Banking.
The financial information of the Company’s segments was compiled utilizing the accounting policies described in note 22 of Notes to Financial Statements. The management accounting policies and processes utilized in compiling segment financial information are highly subjective and, unlike financial accounting, are not based on authoritative guidance similar to GAAP. As a result, reported segments and the financial information of the reported segments are not necessarily comparable with similar information reported by other financial institutions. Furthermore, changes in management structure or allocation methodologies and procedures may result in changes in reported segment financial data. Financial information about the Company’s segments is presented in note 22 of Notes

101
to Financial Statements. Each reportable segment benefited from a lower corporate Federal income tax rate in 2018 and 2019 due to the enactment of the Tax Act, as compared with 2017.
The Business Banking segment provides a wide range of services to small businesses and professionals within markets served by the Company through the Company’s branch network, business banking centers and other delivery channels such as telephone banking, Internet banking and automated teller machines. Services and products offered by this segment include various business loans and leases, including loans guaranteed by the Small Business Administration, business credit cards, deposit products, and financial services such as cash management, payroll and direct deposit, merchant credit card and letters of credit. Net income of the Business Banking segment aggregated $168 million in each of 2019 and 2018. Higher net interest income of $17 million in 2019 was largely offset by increases of $11 million in centrally-allocated costs associated with data processing, risk management and other support services provided to the Business Banking segment and $6 million in the provision for credit losses, primarily due to higher net charge-offs. The higher net interest income reflected a six basis point widening of the net interest margin on deposits, higher average deposit balances of $192 million and higher average outstanding loan balances of $151 million. This segment recorded net income of $116 million in 2017. The 45% rise in net income in 2018 as compared with 2017 resulted from a $41 million increase in net interest income, a $5 million decrease in the provision for credit losses, due to lower net charge-offs, and the lower income tax rate in 2018. The growth in net interest income reflected a widening of the net interest margin on deposits of 42 basis points, offset, in part, by a 14 basis point narrowing of the net interest margin on loans. Those favorable factors were partially offset by a $5 million increase in centrally-allocated costs, largely associated with data processing, risk management and other support services provided to the Business Banking segment.
The Commercial Banking segment provides a wide range of credit products and banking services for middle-market and large commercial customers, mainly within the markets served by the Company. Services provided by this segment include commercial lending and leasing, letters of credit, deposit products, and cash management services. The Commercial Banking segment recorded net income of $520 million in 2019, compared with $539 million in 2018. The most significant factors contributing to the 3% decline in net income from 2018 to 2019 included an $18 million increase in centrally-allocated costs, largely associated with data processing, risk management and other support services provided to the Commercial Banking segment, a higher provision for credit losses of $17 million primarily due to lower recoveries of previously charged-off loans, and higher personnel-related costs of $6 million. Partially offsetting those unfavorable factors were lower FDIC assessments of $11 million and a $7 million rise in net interest income that reflected higher average outstanding loan balances of $1.4 billion and a five basis point widening of the net interest margin on deposits offset, in part, by a narrowing of the net interest margin on loans of seven basis points and lower average deposit balances of $612 million. Net income for the Commercial Banking segment totaled $437 million in 2017. The improvement in net income in 2018 as compared with 2017 was predominantly driven by the lower income tax rate in 2018, a $13 million increase in net interest income, lower FDIC assessments of $8 million and a $5 million increase in merchant discount and credit card fees. The increased net interest income reflected a 59 basis point expansion of the net interest margin on deposits, partially offset by a seven basis point narrowing of the net interest margin on loans and lower average deposit balances of $2.2 billion. Offsetting the favorable factors noted above were a $25 million increase in centrally-allocated costs, largely associated with data processing, risk management and other support services provided to the Commercial Banking segment, and higher personnel-related costs of $5 million.
The Commercial Real Estate segment provides credit and deposit services to its customers. Real estate securing loans in this segment is generally located in states where the Company has a branch presence but, to a lesser extent, may be located in other states as well. Commercial real estate loans
102
may be secured by apartment/multifamily buildings; office, retail and industrial space; or other types of collateral. Activities of this segment also include the origination, sales and servicing of commercial real estate loans through the Fannie Mae DUS program and other programs. Commercial real estate loans held for sale are included in this segment. Net income for the Commercial Real Estate segment was $486 million in 2019, up 7% from $453 million in 2018. That improvement was primarily attributable to: a $27 million increase in net interest income, reflecting higher average outstanding loan balances of $914 million; higher mortgage banking revenues as previously noted; higher trading account and foreign exchange gains of $13 million, resulting from increased activity related to interest rate swap agreements executed on behalf of commercial customers; and reduced FDIC assessments of $13 million. Those favorable factors were partially offset by a $25 million increase in centrally-allocated costs associated with data processing, risk management and other support services provided to the Commercial Real Estate segment and an $11 million rise in personnel-related expenses, reflecting merit and other increases and higher incentive-based compensation. Net income for this segment increased 24% in 2018 from $364 million in 2017. That improvement resulted from: the lower income tax rate in 2018; a rise in net interest income of $16 million; lower FDIC assessments of $11 million; higher mortgage banking revenues of $5 million, resulting from increased servicing income; and higher trading account and foreign exchange gains of $5 million, largely due to increased activity related to interest rate swap transactions executed on behalf of commercial customers. Those favorable factors were partially offset by an $11 million rise in the provision for credit losses, mainly due to higher recoveries of previously charged-off loans in 2017, and $10 million increases in each of salaries and employee benefits and allocated operating expenses associated with data processing, risk management and other support services provided to the Commercial Real Estate segment. The higher net interest income was largely attributable to a 52 basis point widening of the net interest margin on deposits, offset, in part, by a four basis point narrowing of the net interest margin on loans.
The Discretionary Portfolio segment includes investment and trading account securities, residential real estate loans and other assets, short-term and long-term borrowed funds, brokered deposits, and Cayman Islands office deposits. This segment also provides foreign exchange services to customers. Net income of the Discretionary Portfolio segment aggregated $144 million in 2019 and $116 million in 2018. The 24% rise in the 2019’s net income as compared with 2018 was predominantly due to $18 million of unrealized valuation gains associated with marketable equity securities (compared with unrealized losses of $6 million in 2018), higher trading account and foreign exchange gains of $7 million resulting from lower valuation losses on interest rate floor contracts and a $7 million decline in FDIC assessments, partially offset by lower net interest income of $18 million, reflecting lower average outstanding loan balances. Net income of the Discretionary Portfolio segment in 2018 declined 14% from $135 million in 2017. That decline reflected a $49 million decrease in net interest income, lower gains on investment securities of $24 million and a $7 million decrease in income from bank owned life insurance. The lower net interest income reflected a narrowing of the net interest margin on loans of five basis points and lower average loan balances of $2.6 billion, reflecting ongoing repayments of loans obtained in the acquisition of Hudson City. During 2017, the Company recorded realized gains on the sale of investment securities of $18 million. Favorable factors offsetting the declines noted included: the lower income tax rate in 2018; a $24 million decline in the provision for credit losses, primarily due to the favorable impact from the Company’s allocation methodologies for the provision for credit losses associated with acquired loans that reflect lower loan balances and net charge-offs; lower FDIC assessments of $6 million; and a decrease in other real estate-related servicing costs.
The Residential Mortgage Banking segment originates and services residential mortgage loans and sells substantially all of those loans in the secondary market to investors or to the Discretionary Portfolio segment. The Company periodically purchases the rights to service loans and also sub-
103
services residential real estate loans for others. Residential real estate loans held for sale are included in this segment. The Residential Mortgage Banking segment’s net income increased 59% to $72 million in 2019 from $45 million in 2018. That year-over-year increase was attributable to higher revenues of $47 million associated with servicing and sub-servicing residential real estate loans (including intersegment revenues), a $37 million rise in revenues from mortgage origination and sales activities (including intersegment revenues), and higher net interest income of $6 million, reflecting a widening of the net interest margin on deposits of 22 basis points and higher average deposit balances of $751 million, offset, in part, by a narrowing of the net interest margin on loans of 73 basis points. Partially offsetting those favorable factors were a $17 million increase in servicing-related costs (including intersegment costs), higher outside data processing and software expenses of $14 million, an $8 million rise in personnel-related costs and a $7 million addition to the valuation allowance for capitalized mortgage servicing rights in 2019. Net income for the Residential Mortgage Banking segment in 2018 declined slightly from $46 million in 2017. That decline resulted from an $18 million decrease in revenues associated with mortgage origination and sales activities (including intersegment revenues) and lower net interest income of $16 million, reflecting a narrowing of the net interest margin on loans of 48 basis points and lower average deposit balances. Offsetting those unfavorable factors were lower servicing-related costs (including intersegment costs) of $14 million and the lower income tax rate in 2018.
The Retail Banking segment offers a variety of services to consumers through several delivery channels which include branch offices, automated teller machines, telephone banking and Internet banking. The Company has branch offices in New York State, Maryland, New Jersey, Pennsylvania, Delaware, Connecticut, Virginia, West Virginia and the District of Columbia. Credit services offered by this segment include consumer installment loans, automobile and recreational finance loans (originated both directly and indirectly through dealers), home equity loans and lines of credit, and credit cards. The segment also offers to its customers deposit products, including demand, savings and time accounts; investment products, including mutual funds and annuities; and other services. Net income for the Retail Banking segment totaled $528 million in 2019 and $541 million in 2018. Factors contributing to the decline in net income in 2019 included a $20 million rise in personnel-related costs due largely to merit and other increases, higher professional services and other operating expenses of $15 million, a $10 million rise in the provision for credit losses, due to higher net charge-offs and loan balances, and a $9 million increase in centrally-allocated costs, largely associated with data processing, risk management and other support services provided to the Retail Banking segment. Those factors were partially offset by increases of $39 million in net interest income and $8 million in service charges on deposit accounts. The net interest income growth reflected higher average outstanding loan balances of $1.2 billion and a widening of the net interest margin on deposits of 10 basis points, partially offset by lower average deposit balances of $1.2 billion. The Retail Banking segment’s net income in 2018 was up 44% from $377 million in 2017. That improvement was predominantly attributable to a $141 million rise in net interest income that reflected a 49 basis point widening of the net interest margin on deposits, partially offset by lower average deposit balances of $2.8 billion, and the lower income tax rate in 2018. Those favorable factors were offset, in part, by a $28 million increase in centrally-allocated costs associated with data processing, risk management and other support services provided to the Retail Banking Segment.
The “All Other” category reflects other activities of the Company that are not directly attributable to the reported segments. Reflected in this category are the amortization of core deposit and other intangible assets resulting from the acquisitions of financial institutions, income associated with BLG, merger-related expenses resulting from acquisitions, and the net impact of the Company’s allocation methodologies for internal transfers for funding charges and credits associated with the earning assets and interest-bearing liabilities of the Company’s reportable segments and the provision for credit losses. The “All Other” category also includes trust income of the Company that reflects

104
the ICS and WAS business activities. The various components of the “All Other” category resulted in net income of $11 million and $55 million in 2019 and 2018, respectively, and a net loss of $66 million in 2017. As compared with 2018, the lower net income in 2019 reflected the impact of the $48 million charge from the sale of the affiliated asset manager and higher expenses for salaries and employee benefits, equipment and net occupancy, and professional services (net of allocations of centralized support services to other segments). Those unfavorable factors were partially offset by lower additions to the reserve for legal matters as previously noted, higher trust income of $35 million, the favorable impact from the Company’s allocation methodologies for internal transfers for funding charges and credits associated with earning assets and interest-bearing liabilities of the Company’s reportable segments, lower contributions to The M&T Charitable Foundation of $29 million, and a $13 million increase in income from BLG. The significant improvement in 2018 as compared with 2017 was driven by the favorable impact from the Company’s allocation methodologies for income taxes and for internal transfers for funding charges and credits associated with earning assets and interest-bearing liabilities of the Company’s reportable segments; higher trust income of $36 million; $24 million of income from BLG in 2018; and lower charitable contributions of $21 million in 2018. Those favorable factors were partially offset by: higher expenses related to the settlements of WT Corp pre-acquisition legal-related matters; a $21 million increase in professional and other outside services expenses; and a $10 million decline in brokerage services income.
Recent Accounting DevelopmentsA discussion of recent accounting developments is included in note 26 of Notes to Financial Statements.
Forward-Looking StatementsManagement’s Discussion and Analysis of Financial Condition and Results of Operations and other sections of this Annual Report contain forward-looking statements that are based on current expectations, estimates and projections about the Company’s business, management’s beliefs and assumptions made by management. Forward-looking statements are typically identified by words such as “believe,” “expect,” “anticipate,” “intend,” “target,” “estimate,” “continue,” “positions,” “prospects” or “potential,” by future conditional verbs such as “will,” “would,” “should,” “could,” or “may,” or by variations of such words or by similar expressions. These statements are not guarantees of future performance and involve certain risks, uncertainties and assumptions (“Future Factors”) which are difficult to predict. Therefore, actual outcomes and results may differ materially from what is expressed or forecasted in such forward-looking statements. Forward-looking statements speak only as of the date they are made and the Company assumes no duty to update forward-looking statements.
Future Factors include changes in interest rates, spreads on earning assets and interest-bearing liabilities, and interest rate sensitivity; prepayment speeds, loan originations, credit losses and market values of loans, collateral securing loans and other assets; sources of liquidity; common shares outstanding; common stock price volatility; fair value of and number of stock-based compensation awards to be issued in future periods; the impact of changes in market values on trust-related revenues; legislation and/or regulation affecting the financial services industry as a whole, and M&T and its subsidiaries individually or collectively, including tax legislation or regulation; regulatory supervision and oversight, including monetary policy and capital requirements; changes in accounting policies or procedures as may be required by the FASB or regulatory agencies; increasing price and product/service competition by competitors, including new entrants; rapid technological developments and changes; the ability to continue to introduce competitive new products and services on a timely, cost-effective basis; the mix of products/services; containing costs and

105
expenses; governmental and public policy changes; protection and validity of intellectual property rights; reliance on large customers; technological, implementation and cost/financial risks in large, multi-year contracts; the outcome of pending and future litigation and governmental proceedings, including tax-related examinations and other matters; continued availability of financing; financial resources in the amounts, at the times and on the terms required to support M&T and its subsidiaries’ future businesses; and material differences in the actual financial results of merger, acquisition and investment activities compared with M&T’s initial expectations, including the full realization of anticipated cost savings and revenue enhancements.
These are representative of the Future Factors that could affect the outcome of the forward-looking statements. In addition, such statements could be affected by general industry and market conditions and growth rates, general economic and political conditions, either nationally or in the states in which M&T and its subsidiaries do business, including interest rate and currency exchange rate fluctuations, changes and trends in the securities markets, and other Future Factors.

106
Table 24QUARTERLY TRENDS
2019 Quarters 2018 Quarters Fourth Third Second First Fourth Third Second First
Earnings and dividends Amounts in thousands, except per share Interest income (taxable-equivalent basis) ......................... $1,191,295 1,235,048 1,243,838 1,232,276 1,226,239 1,173,108 1,134,302 1,086,959 Interest expense .................................................................. 177,070 199,579 196,432 176,249 161,321 138,337 120,118 106,633 Net interest income............................................................. 1,014,225 1,035,469 1,047,406 1,056,027 1,064,918 1,034,771 1,014,184 980,326 Less: provision for credit losses ......................................... 54,000 45,000 55,000 22,000 38,000 16,000 35,000 43,000 Other income ...................................................................... 521,040 527,779 512,095 500,765 480,596 459,294 457,414 458,696 Less: other expense............................................................. 823,683 877,619 873,032 894,348 802,162 775,979 776,577 933,344 Income before income taxes............................................... 657,582 640,629 631,469 640,444 705,352 702,086 660,021 462,678 Applicable income taxes..................................................... 159,124 154,969 152,284 151,735 153,175 170,262 161,464 105,259 Taxable-equivalent adjustment........................................... 5,392 5,579 5,925 5,967 5,958 5,733 5,397 4,809 Net income.......................................................................... $ 493,066 480,081 473,260 482,742 546,219 526,091 493,160 352,610
Net income available to common shareholders-diluted ..... $ 473,372 461,410 452,633 462,086 525,328 505,365 472,600 332,749 Per common share data
Basic earnings............................................................. $ 3.60 3.47 3.34 3.35 3.76 3.54 3.26 2.24 Diluted earnings.......................................................... 3.60 3.47 3.34 3.35 3.76 3.53 3.26 2.23 Cash dividends............................................................ $ 1.10 1.00 1.00 1.00 1.00 1.00 .80 .75
Average common shares outstanding Basic ........................................................................... 131,512 132,965 135,433 137,889 139,744 142,822 144,825 148,688 Diluted ........................................................................ 131,549 132,999 135,464 137,920 139,838 142,976 144,998 148,905
Performance ratios, annualized Return on
Average assets ............................................................ 1.60 % 1.58 % 1.60 % 1.68 % 1.84 % 1.80 % 1.70 % 1.22 %Average common shareholders’ equity ...................... 12.95 % 12.73 % 12.68 % 13.14 % 14.80 % 14.08 % 13.32 % 9.15 %
Net interest margin on average earning assets (taxable-equivalent basis) ................................................ 3.64 % 3.78 % 3.91 % 4.04 % 3.92 % 3.88 % 3.83 % 3.71 %Nonaccrual loans to total loans and leases, net of unearned discount........................................................... 1.06 % 1.12 % .96 % .99 % 1.01 % 1.00 % .93 % .99 %
Net operating (tangible) results (a) Net operating income (in thousands).................................. $ 496,237 483,830 477,001 486,440 550,169 530,619 497,869 357,498 Diluted net operating income per common share............... $ 3.62 3.50 3.37 3.38 3.79 3.56 3.29 2.26 Annualized return on
Average tangible assets .............................................. 1.67 % 1.66 % 1.68 % 1.76 % 1.93 % 1.89 % 1.79 % 1.28 %Average tangible common shareholders’ equity ........ 19.08 % 18.85 % 18.83 % 19.56 % 22.16 % 21.00 % 19.91 % 13.51 %
Efficiency ratio (b) ............................................................. 53.15 % 55.95 % 55.98 % 57.56 % 51.70 % 51.41 % 52.42 % 63.98 %
Balance sheet data In millions, except per share Average balances
Total assets (c) ............................................................ $ 122,554 120,388 118,487 116,839 117,799 115,997 116,413 117,684 Total tangible assets (c) .............................................. 117,938 115,769 113,864 112,213 113,169 111,363 111,775 113,041 Earning assets ............................................................. 110,581 108,643 107,511 106,096 107,785 105,835 106,210 107,231 Investment securities .................................................. 10,044 11,075 12,170 12,949 13,034 13,431 13,856 14,467 Loans and leases, net of unearned discount................ 90,244 90,078 89,150 88,477 87,301 87,132 87,406 87,766 Deposits ...................................................................... 96,903 94,095 91,371 89,733 91,104 89,252 90,195 91,119 Common shareholders’ equity (c) .............................. 14,582 14,464 14,398 14,337 14,157 14,317 14,301 14,827 Tangible common shareholders’ equity (c) ................ 9,966 9,845 9,775 9,711 9,527 9,683 9,663 10,184
At end of quarter Total assets (c) ............................................................ $ 119,873 125,501 121,555 120,025 120,097 116,828 118,426 118,623 Total tangible assets (c) .............................................. 115,258 120,883 116,934 115,400 115,470 112,197 113,790 113,982 Earning assets ............................................................. 107,673 113,067 110,323 108,849 109,321 106,331 107,819 107,976 Investment securities .................................................. 9,497 10,678 11,580 12,537 12,693 13,074 13,283 14,067 Loans and leases, net of unearned discount................ 90,923 89,823 89,878 88,640 88,466 86,680 87,797 87,711 Deposits ...................................................................... 94,770 95,114 91,681 90,470 90,157 89,140 89,273 90,947 Common shareholders’ equity, net of undeclared cumulative preferred dividends (c)........................ 14,467 14,530 14,457 14,353 14,225 14,201 14,343 14,475 Tangible common shareholders’ equity (c) ................ 9,852 9,912 9,836 9,728 9,598 9,570 9,707 9,834 Equity per common share ........................................... 110.78 109.84 107.73 105.04 102.69 100.38 99.43 98.60 Tangible equity per common share ............................ 75.44 74.93 73.29 71.19 69.28 67.64 67.29 66.99
(a) Excludes amortization and balances related to goodwill and core deposit and other intangible assets and merger-related expenses which, except in the calculation of the efficiency ratio, are net of applicable income tax effects. A reconciliation of net income and net operating income appears in Table 25.
(b) Excludes impact of merger-related expenses and net securities transactions.(c) The difference between total assets and total tangible assets, and common shareholders’ equity and tangible common shareholders’ equity, represents goodwill, core
deposit and other intangible assets, net of applicable deferred tax balances. A reconciliation of such balances appears in Table 25 .

107
Table 25RECONCILIATION OF QUARTERLY GAAP TO NON-GAAP MEASURES
2019 Quarters 2018 Quarters Fourth Third Second First Fourth Third Second First
Income statement data (in thousands, except per share)
Net income Net income........................................................ $ 493,066 480,081 473,260 482,742 546,219 526,091 493,160 352,610 Amortization of core deposit and other intangible assets (a)........................................
3,171 3,749 3,741 3,698 3,950 4,528 4,709 4,888
Net operating income ................................ $ 496,237 483,830 477,001 486,440 550,169 530,619 497,869 357,498
Earnings per common share Diluted earnings per common share ................. $ 3.60 3.47 3.34 3.35 3.76 3.53 3.26 2.23 Amortization of core deposit and other intangible assets (a)........................................
.02 .03 .03 .03 .03 .03 .03 .03
Diluted net operating earnings per common share ........................................
$ 3.62 3.50 3.37 3.38 3.79 3.56 3.29 2.26
Other expense Other expense.................................................... $ 823,683 877,619 873,032 894,348 802,162 775,979 776,577 933,344 Amortization of core deposit and other intangible assets .............................................
(4,305) (5,088) (5,077) (5,020) (5,359) (6,143) (6,388) (6,632)
Noninterest operating expense .................. $ 819,378 872,531 867,955 889,328 796,803 769,836 770,189 926,712
Efficiency ratio Noninterest operating expense (numerator)...... $ 819,378 872,531 867,955 889,328 796,803 769,836 770,189 926,712
Taxable-equivalent net interest income ............ $1,014,225 1,035,469 1,047,406 1,056,027 1,064,918 1,034,771 1,014,184 980,326 Other income..................................................... 521,040 527,779 512,095 500,765 480,596 459,294 457,414 458,696 Less: Gain (loss) on bank investment securities ........................................................
(6,452) 3,737 8,911 11,841 4,219 (3,415) 2,326 (9,431)
Denominator ..................................................... $1,541,717 1,559,511 1,550,590 1,544,951 1,541,295 1,497,480 1,469,272 1,448,453
Efficiency ratio.................................................. 53.15% 55.95% 55.98% 57.56% 51.70% 51.41% 52.42% 63.98%
Balance sheet data (in millions) Average assets Average assets................................................... $ 122,554 120,388 118,487 116,839 117,799 115,997 116,413 117,684 Goodwill ........................................................... (4,593) (4,593) (4,593) (4,593) (4,593) (4,593) (4,593) (4,593)Core deposit and other intangible assets........... (31) (36) (41) (45) (50) (55) (62) (68)Deferred taxes ................................................... 8 10 11 12 13 14 17 18
Average tangible assets ............................. $ 117,938 115,769 113,864 112,213 113,169 111,363 111,775 113,041
Average common equity Average total equity.......................................... $ 15,832 15,837 15,630 15,569 15,389 15,549 15,533 16,059 Preferred stock .................................................. (1,250) (1,373) (1,232) (1,232) (1,232) (1,232) (1,232) (1,232)
Average common equity ........................... 14,582 14,464 14,398 14,337 14,157 14,317 14,301 14,827 Goodwill ........................................................... (4,593) (4,593) (4,593) (4,593) (4,593) (4,593) (4,593) (4,593)Core deposit and other intangible assets........... (31) (36) (41) (45) (50) (55) (62) (68)Deferred taxes ................................................... 8 10 11 12 13 14 17 18
Average tangible common equity ............. $ 9,966 9,845 9,775 9,711 9,527 9,683 9,663 10,184
At end of quarter Total assets Total assets........................................................ $ 119,873 125,501 121,555 120,025 120,097 116,828 118,426 118,623 Goodwill ........................................................... (4,593) (4,593) (4,593) (4,593) (4,593) (4,593) (4,593) (4,593)Core deposit and other intangible assets........... (29) (33) (38) (44) (47) (52) (59) (65)Deferred taxes ................................................... 7 8 10 12 13 14 16 17
Total tangible assets .................................. $ 115,258 120,883 116,934 115,400 115,470 112,197 113,790 113,982
Total common equity Total equity ....................................................... $ 15,717 15,780 15,692 15,588 15,460 15,436 15,578 15,710 Preferred stock .................................................. (1,250) (1,250) (1,232) (1,232) (1,232) (1,232) (1,232) (1,232)Undeclared dividends - cumulative preferred stock ...............................................
— — (3) (3) (3) (3) (3) (3)
Common equity, net of undeclared cumulative preferred dividends..............
14,467 14,530 14,457 14,353 14,225 14,201 14,343 14,475
Goodwill ........................................................... (4,593) (4,593) (4,593) (4,593) (4,593) (4,593) (4,593) (4,593)Core deposit and other intangible assets........... (29) (33) (38) (44) (47) (52) (59) (65)Deferred taxes ................................................... 7 8 10 12 13 14 16 17
Total tangible common equity .................. $ 9,852 9,912 9,836 9,728 9,598 9,570 9,707 9,834
(a) After any related tax effect.
108
Item 7A. Quantitative and Qualitative Disclosures About Market Risk.
Incorporated by reference to the discussion contained in Part II, Item 7, “Management’s Discussion and Analysis of Financial Condition and Results of Operations,” under the captions “Liquidity, Market Risk, and Interest Rate Sensitivity” (including Table 22) and “Capital.”
Item 8. Financial Statements and Supplementary Data.
Financial Statements and Supplementary Data consist of the financial statements as indexed and presented below and Table 24 “Quarterly Trends” presented in Part II, Item 7, “Management’s Discussion and Analysis of Financial Condition and Results of Operations.”
Index to Financial Statements and Financial Statement SchedulesReport on Internal Control Over Financial Reporting ...............................................................................................109Report of Independent Registered Public Accounting Firm ......................................................................................110Consolidated Balance Sheet — December 31, 2019 and 2018..................................................................................113Consolidated Statement of Income — Years ended December 31, 2019, 2018 and 2017 ........................................114Consolidated Statement of Comprehensive Income — Years ended December 31, 2019, 2018
and 2017 ................................................................................................................................................................115Consolidated Statement of Cash Flows — Years ended December 31, 2019, 2018 and 2017.................................116Consolidated Statement of Changes in Shareholders’ Equity — Years ended December 31,
2019, 2018 and 2017 .............................................................................................................................................117Notes to Financial Statements ....................................................................................................................................118

109
Report on Internal Control Over Financial Reporting
Management is responsible for establishing and maintaining adequate internal control over financial reporting at M&T Bank Corporation and subsidiaries (“the Company”). Management has assessed the effectiveness of the Company’s internal control over financial reporting as of December 31, 2019 based on criteria described in “Internal Control — Integrated Framework (2013)” issued by the Committee of Sponsoring Organizations of the Treadway Commission. Based on that assessment, management concluded that the Company maintained effective internal control over financial reporting as of December 31, 2019.
The consolidated financial statements of the Company have been audited by PricewaterhouseCoopers LLP, an independent registered public accounting firm, that was engaged to express an opinion as to the fairness of presentation of such financial statements. PricewaterhouseCoopers LLP was also engaged to assess the effectiveness of the Company’s internal control over financial reporting. The report of PricewaterhouseCoopers LLP follows this report.
M&T BANK CORPORATION
René F. Jones Chairman of the Board and Chief Executive Officer
Darren J. King Executive Vice President and Chief Financial Officer
110
Report of Independent Registered Public Accounting Firm
To the Board of Directors and Shareholders ofM&T Bank Corporation
Opinions on the Financial Statements and Internal Control over Financial Reporting
We have audited the accompanying consolidated balance sheet of M&T Bank Corporation and its subsidiaries (the “Company”) as of December 31, 2019 and 2018, and the related consolidated statements of income, of comprehensive income, of changes in shareholders' equity and of cash flows for each of the three years in the period ended December 31, 2019, including the related notes (collectively referred to as the “consolidated financial statements”). We also have audited the Company's internal control over financial reporting as of December 31, 2019, based on criteria established in Internal Control - Integrated Framework (2013) issued by the Committee of Sponsoring Organizations of the Treadway Commission (COSO).
In our opinion, the consolidated financial statements referred to above present fairly, in all material respects, the financial position of the Company as of December 31, 2019 and 2018, and the results of its operations and its cash flows for each of the three years in the period ended December 31, 2019 in conformity with accounting principles generally accepted in the United States of America. Also in our opinion, the Company maintained, in all material respects, effective internal control over financial reporting as of December 31, 2019, based on criteria established in Internal Control - Integrated Framework (2013) issued by the COSO.
Basis for Opinions
The Company's management is responsible for these consolidated financial statements, for maintaining effective internal control over financial reporting, and for its assessment of the effectiveness of internal control over financial reporting, included in the accompanying Report on Internal Control Over Financial Reporting. Our responsibility is to express opinions on the Company’s consolidated financial statements and on the Company's internal control over financial reporting based on our audits. We are a public accounting firm registered with the Public Company Accounting Oversight Board (United States) (PCAOB) and are required to be independent with respect to the Company in accordance with the U.S. federal securities laws and the applicable rules and regulations of the Securities and Exchange Commission and the PCAOB.
We conducted our audits in accordance with the standards of the PCAOB. Those standards require that we plan and perform the audits to obtain reasonable assurance about whether the consolidated financial statements are free of material misstatement, whether due to error or fraud, and whether effective internal control over financial reporting was maintained in all material respects.
Our audits of the consolidated financial statements included performing procedures to assess the risks of material misstatement of the consolidated financial statements, whether due to error or fraud, and performing procedures that respond to those risks. Such procedures included examining, on a test basis, evidence regarding the amounts and disclosures in the consolidated financial statements. Our audits also included evaluating the accounting principles used and significant estimates made by management, as well as evaluating the overall presentation of the consolidated financial statements. Our audit of internal control over financial reporting included obtaining an understanding of internal control over financial reporting, assessing the risk that a material weakness exists, and testing and evaluating the design and operating effectiveness of internal control based on the assessed risk. Our
111
audits also included performing such other procedures as we considered necessary in the circumstances. We believe that our audits provide a reasonable basis for our opinions.
Definition and Limitations of Internal Control over Financial Reporting
A company’s internal control over financial reporting is a process designed to provide reasonable assurance regarding the reliability of financial reporting and the preparation of financial statements for external purposes in accordance with generally accepted accounting principles. A company’s internal control over financial reporting includes those policies and procedures that (i) pertain to the maintenance of records that, in reasonable detail, accurately and fairly reflect the transactions and dispositions of the assets of the company; (ii) provide reasonable assurance that transactions are recorded as necessary to permit preparation of financial statements in accordance with generally accepted accounting principles, and that receipts and expenditures of the company are being made only in accordance with authorizations of management and directors of the company; and (iii) provide reasonable assurance regarding prevention or timely detection of unauthorized acquisition, use, or disposition of the company’s assets that could have a material effect on the financial statements.
Because of its inherent limitations, internal control over financial reporting may not prevent or detect misstatements. Also, projections of any evaluation of effectiveness to future periods are subject to the risk that controls may become inadequate because of changes in conditions, or that the degree of compliance with the policies or procedures may deteriorate.
Critical Audit Matters
The critical audit matter communicated below is a matter arising from the current period audit of the consolidated financial statements that was communicated or required to be communicated to the audit committee and that (i) relates to accounts or disclosures that are material to the consolidated financial statements and (ii) involved our especially challenging, subjective, or complex judgments. The communication of critical audit matters does not alter in any way our opinion on the consolidated financial statements, taken as a whole, and we are not, by communicating the critical audit matter below, providing a separate opinion on the critical audit matter or on the accounts or disclosures to which it relates.
Allowance for Credit Losses – Commercial Loans and Commercial Real Estate Loans Loss Factors
As described in Notes 1 and 4 to the consolidated financial statements, the Company’s allowance for credit losses of $1.1 billion, represents management’s estimate of losses inherent in the loan and lease portfolio of $90.9 billion as of December 31, 2019. The Company’s allowance for credit losses allocated to commercial loans and commercial real estate loans comprise a significant portion of the total allowance for credit losses. The allowance for credit losses allocated to commercial loans and commercial real estate loans is primarily determined by applying loss factors to groups of loan balances based on loan type and management’s classification of commercial loans and commercial real estate loans under the Company’s loan grading system. Factors considered in assigning loan grades and loss factors include borrower-specific information, levels of and trends in portfolio charge-offs and recoveries, levels of and trends in portfolio delinquencies and impaired loans, changes in the risk profile of specific portfolios, trends in volume and terms of loans, effects of changes in credit concentrations, and observed trends and practices in the banking industry.

112
The principal considerations for our determination that performing procedures relating to the allowance for credit losses – commercial loans and commercial real estate loans loss factors is a critical audit matter are (i) the application of significant judgment and estimation by management in determining the commercial loans and commercial real estate loans loss factors, which led to a high degree of auditor judgment and subjectivity in performing procedures related thereto, (ii) a high degree of auditor judgment was necessary to evaluate the evidence obtained related to the commercial loans and commercial real estate loans loss factors, and (iii) the audit effort involved the use of professionals with specialized skill and knowledge to assist in evaluating the audit evidence obtained from these procedures.
Addressing the matter involved performing procedures and evaluating audit evidence in connection with forming our overall opinion on the consolidated financial statements. These procedures included testing the effectiveness of controls relating to the Company’s allowance for credit losses estimation process, including controls over commercial loan and commercial real estate loan loss factors. These procedures also included, among others, testing management’s process for determining the allowance for credit losses allocated to commercial loans and commercial real estate loans, including testing the completeness and accuracy of data used in the estimate and the involvement of professionals with specialized skill and knowledge to assist in evaluating the appropriateness of the methodology and evaluating the reasonableness of the commercial loans and commercial real estate loans loss factors. Evaluating the commercial loan and commercial real estate loan loss factors included evaluating the reasonableness of the impact of borrower-specific information, levels of and trends in portfolio charge-offs and recoveries, levels of and trends in portfolio delinquencies and impaired loans, changes in the risk profile of specific portfolios, trends in volume and terms of loans, effects of changes in credit concentrations, and observed trends and practices in the banking industry.
Buffalo, New YorkFebruary 19, 2020
We have served as the Company’s auditor since 1984.

113
M&T BANK CORPORATION AND SUBSIDIARIES
Consolidated Balance Sheet December 31 (Dollars in thousands, except per share) 2019 2018 Assets Cash and due from banks .......................................................................................................... $ 1,432,805 $ 1,605,439 Interest-bearing deposits at banks ............................................................................................. 7,190,154 8,105,197 Federal funds sold ..................................................................................................................... 3,500 — Trading account......................................................................................................................... 470,129 185,584 Investment securities (includes pledged securities that can be sold or repledged of $200,339 at December 31, 2019; $487,365 at December 31, 2018)
Available for sale (cost: $6,258,276 at December 31, 2019; $8,869,423 at December 31, 2018).................................................................................. 6,318,776 8,682,509 Held to maturity (fair value: $2,699,206 at December 31, 2019; $3,255,483 at December 31, 2018).................................................................................. 2,656,917 3,316,640 Equity and other securities (cost: $487,041 at December 31, 2019; $677,187 at December 31, 2018)..................................................................................... 521,558 693,664
Total investment securities........................................................................................... 9,497,251 12,692,813 Loans and leases........................................................................................................................ 91,188,525 88,733,492
Unearned discount .............................................................................................................. (265,656) (267,015)Loans and leases, net of unearned discount..................................................................... 90,922,869 88,466,477
Allowance for credit losses................................................................................................. (1,051,071) (1,019,444)Loans and leases, net ....................................................................................................... 89,871,798 87,447,033
Premises and equipment............................................................................................................ 1,140,924 647,408 Goodwill.................................................................................................................................... 4,593,112 4,593,112 Core deposit and other intangible assets ................................................................................... 29,034 47,067 Accrued interest and other assets .............................................................................................. 5,644,050 4,773,750
Total assets ................................................................................................................... $ 119,872,757 $ 120,097,403
Liabilities Noninterest-bearing deposits..................................................................................................... $ 32,396,407 $ 32,256,668 Savings and interest-checking deposits..................................................................................... 54,932,162 50,963,744 Time deposits ............................................................................................................................ 5,757,456 6,124,254 Deposits at Cayman Islands office ............................................................................................ 1,684,044 811,906
Total deposits ............................................................................................................... 94,770,069 90,156,572 Short-term borrowings .............................................................................................................. 62,363 4,398,378 Accrued interest and other liabilities......................................................................................... 2,337,490 1,637,348 Long-term borrowings .............................................................................................................. 6,986,186 8,444,914
Total liabilities.............................................................................................................. 104,156,108 104,637,212 Shareholders' equity Preferred stock, $1.00 par, 1,000,000 shares authorized; Issued and outstanding: Liquidation preference of $1,000 per share: 350,000 shares at December 31, 2019 and 731,500 shares at December 31, 2018; Liquidation preference of $10,000 per share: 90,000 shares at December 31, 2019 and 50,000 shares at December 31, 2018 .................. 1,250,000 1,231,500 Common stock, $.50 par, 250,000,000 shares authorized, 159,741,898 shares issued at December 31, 2019; 159,765,044 shares issued at December 31, 2018 ................................................................. 79,871 79,883 Common stock issuable, 21,534 shares at December 31, 2019; 24,563 shares at December 31, 2018 ..................................................................................... 1,566 1,726 Additional paid-in capital.......................................................................................................... 6,593,539 6,579,342 Retained earnings ...................................................................................................................... 12,820,916 11,516,672 Accumulated other comprehensive income (loss), net ............................................................. (206,680) (420,081)Treasury stock — common, at cost — 29,174,402 shares at December 31, 2019; 21,255,275 shares at December 31, 2018 ............................................................................. (4,822,563) (3,528,851)
Total shareholders’ equity ............................................................................................ 15,716,649 15,460,191 Total liabilities and shareholders’ equity ..................................................................... $ 119,872,757 $ 120,097,403
See accompanying notes to financial statements.

114
M&T BANK CORPORATION AND SUBSIDIARIESConsolidated Statement of Income
Year Ended December 31 (In thousands, except per share) 2019 2018 2017
Interest income
Loans and leases, including fees .......................................................... $4,442,182 $4,164,561 $3,742,867 Investment securities
Fully taxable ................................................................................... 288,532 323,912 361,157 Exempt from federal taxes.............................................................. 321 665 1,431
Deposits at banks.................................................................................. 141,397 108,182 61,326 Other..................................................................................................... 7,161 1,391 1,014
Total interest income ................................................................. 4,879,593 4,598,711 4,167,795 Interest expense Savings and interest-checking deposits................................................ 368,003 215,411 133,177 Time deposits ....................................................................................... 95,426 51,423 61,505 Deposits at Cayman Islands office ....................................................... 21,917 5,633 1,186 Short-term borrowings ......................................................................... 24,741 5,386 1,511 Long-term borrowings.......................................................................... 239,242 248,556 189,372
Total interest expense................................................................ 749,329 526,409 386,751 Net interest income............................................................................... 4,130,264 4,072,302 3,781,044 Provision for credit losses .................................................................... 176,000 132,000 168,000 Net interest income after provision for credit losses............................ 3,954,264 3,940,302 3,613,044 Other income Mortgage banking revenues ................................................................. 457,770 360,442 363,827 Service charges on deposit accounts .................................................... 432,978 429,337 427,372 Trust income......................................................................................... 572,608 537,585 501,381 Brokerage services income................................................................... 48,922 51,069 61,445 Trading account and foreign exchange gains ....................................... 62,044 32,547 35,301 Gain (loss) on bank investment securities............................................ 18,037 (6,301) 21,279 Other revenues from operations ........................................................... 469,320 451,321 440,538
Total other income..................................................................... 2,061,679 1,856,000 1,851,143 Other expense Salaries and employee benefits ............................................................ 1,900,797 1,752,264 1,648,794 Equipment and net occupancy.............................................................. 324,079 298,828 295,084 Outside data processing and software .................................................. 229,731 199,025 184,670 FDIC assessments ................................................................................ 41,535 68,526 101,871 Advertising and marketing ................................................................... 93,472 85,710 69,203 Printing, postage and supplies .............................................................. 39,893 35,658 35,960 Amortization of core deposit and other intangible assets .................... 19,490 24,522 31,366 Other costs of operations...................................................................... 819,685 823,529 773,377
Total other expense ................................................................... 3,468,682 3,288,062 3,140,325 Income before taxes ............................................................................. 2,547,261 2,508,240 2,323,862 Income taxes......................................................................................... 618,112 590,160 915,556 Net income............................................................................................ $1,929,149 $1,918,080 $1,408,306
Net income available to common shareholders Basic .......................................................................................... $1,849,509 $1,836,028 $1,327,503 Diluted ....................................................................................... 1,849,511 1,836,035 1,327,517
Net income per common share Basic .......................................................................................... $ 13.76 $ 12.75 $ 8.72 Diluted ....................................................................................... 13.75 12.74 8.70
See accompanying notes to financial statements.

115
M&T BANK CORPORATION AND SUBSIDIARIES
Consolidated Statement of Comprehensive Income
Year Ended December 31 (In thousands) 2019 2018 2017
Net income............................................................................................... $1,929,149 $1,918,080 $1,408,306 Other comprehensive income (loss), net of tax and reclassification adjustments:
Net unrealized gains (losses) on investment securities ...................... 184,906 (86,523) (19,766)Cash flow hedges adjustments ........................................................... 108,520 6,091 (9,912)Foreign currency translation adjustments........................................... 1,091 (2,225) 2,241 Defined benefit plans liability adjustments ........................................ (81,116) 43,243 22,288
Total other comprehensive income (loss) ..................................... 213,401 (39,414) (5,149)Total comprehensive income ........................................................ $2,142,550 $1,878,666 $1,403,157
See accompanying notes to financial statements.

116
M&T BANK CORPORATION AND SUBSIDIARIES
Consolidated Statement of Cash Flows Year Ended December 31 (In thousands) 2019 2018 2017 Cash flows from operating activities Net income.......................................................................................................................................... $ 1,929,149 $ 1,918,080 $ 1,408,306 Adjustments to reconcile net income to net cash provided by operating activities
Provision for credit losses .................................................................................................... 176,000 132,000 168,000 Depreciation and amortization of premises and equipment................................................. 209,937 104,864 109,587 Amortization of capitalized servicing rights ........................................................................ 71,888 49,619 56,172 Amortization of core deposit and other intangible assets .................................................... 19,490 24,522 31,366 Provision for deferred income taxes .................................................................................... 57,548 15,857 400,790 Asset write-downs................................................................................................................ 7,701 24,774 15,429 Net (gain) loss on sales of assets.......................................................................................... 31,526 (23,503) (53,467)Net change in accrued interest receivable, payable ............................................................. 30,923 (7,162) (17,896)Net change in other accrued income and expense ............................................................... 75,930 13,436 (201,981)Net change in loans originated for sale ................................................................................ 130,230 (150,695) 711,657 Net change in trading account assets and liabilities............................................................. (382,767) (11,940) 153,972 Net cash provided by operating activities ............................................................................ 2,357,555 2,089,852 2,781,935
Cash flows from investing activities Proceeds from sales of investment securities
Available for sale......................................................................................................................... 107 418 534,160 Equity and other securities .......................................................................................................... 1,169,876 650,858 178,468
Proceeds from maturities of investment securities Available for sale......................................................................................................................... 2,621,603 1,997,263 2,131,118 Held to maturity........................................................................................................................... 1,162,820 478,172 528,585
Purchases of investment securities Available for sale......................................................................................................................... (28,120) (12,494) (251,185)Held to maturity........................................................................................................................... (495,277) (444,703) (1,425,690)Equity and other securities .......................................................................................................... (979,734) (834,856) (132,378)
Net (increase) decrease in loans and leases ........................................................................................ (2,795,263) (475,895) 1,931,492 Net (increase) decrease in interest-bearing deposits at banks ............................................................ 915,043 (3,026,294) (78,265)Capital expenditures, net .................................................................................................................... (178,049) (97,676) (78,966)Net (increase) decrease in loan servicing advances............................................................................ (470,078) 307,252 37,761 Other, net ............................................................................................................................................ (195,921) 47,904 19,825
Net cash provided (used) by investing activities......................................................................... 727,007 (1,410,051) 3,394,925 Cash flows from financing activities Net increase (decrease) in deposits..................................................................................................... 4,616,082 (2,272,505) (3,075,322)Net increase (decrease) in short-term borrowings .............................................................................. (4,336,015) 4,223,279 11,657 Proceeds from long-term borrowings ................................................................................................. — 1,773,189 2,145,950 Payments on long-term borrowings.................................................................................................... (1,553,493) (1,459,081) (3,433,440)Purchases of treasury stock................................................................................................................. (1,349,785) (2,194,396) (1,205,905)Dividends paid — common................................................................................................................ (552,138) (510,382) (457,402)Dividends paid — preferred ............................................................................................................... (67,454) (72,521) (72,734)Proceeds from issuance of Series G preferred stock .......................................................................... 396,000 — — Redemption of Series A and Series C preferred stock ....................................................................... (381,500) — — Other, net ............................................................................................................................................ (25,393) 17,167 10,675
Net cash used by financing activities .......................................................................................... (3,253,696) (495,250) (6,076,521)Net increase (decrease) in cash, cash equivalents and restricted cash................................................ (169,134) 184,551 100,339 Cash, cash equivalents and restricted cash at beginning of period..................................................... 1,605,439 1,420,888 1,320,549 Cash, cash equivalents and restricted cash at end of period ............................................................... $ 1,436,305 $ 1,605,439 $ 1,420,888
Supplemental disclosure of cash flow information Interest received during the period ..................................................................................................... $ 4,892,301 $ 4,568,991 $ 4,155,723 Interest paid during the period............................................................................................................ 735,787 516,230 405,290 Income taxes paid during the period................................................................................................... 320,513 375,116 494,205 Supplemental schedule of noncash investing and financing activities Real estate acquired in settlement of loans......................................................................................... $ 90,072 $ 72,408 $ 121,292 Securitization of residential mortgage loans allocated to
Available-for-sale investment securities ..................................................................................... $ 5,379 $ 22,448 $ 36,747 Capitalized servicing rights ......................................................................................................... 83 365 422
Adoption of lease accounting standard Right-of-use assets ...................................................................................................................... $ 393,877 — — Other liabilities ............................................................................................................................ 398,810 — —
Additions to right-of-use assets under operating leases ..................................................................... $ 132,219 — —
See accompanying notes to financial statements.

117
M&T BANK CORPORATION AND SUBSIDIARIES
Consolidated Statement of Changes in Shareholders’ Equity Accumulated Other Common Additional Comprehensive Preferred Common Stock Paid-in Retained Income Treasury
Dollars in thousands, except per share Stock Stock Issuable Capital Earnings (Loss), Net Stock Total 2017 Balance — January 1, 2017 ............................. $1,231,500 79,973 2,145 6,676,948 9,222,488 (294,636) (431,796) $16,486,622 Total comprehensive income ........................... — — — — 1,408,306 (5,149) — 1,403,157 Reclassification of income tax effects to retained earnings .......................................... — — — — 64,029 (64,029) — — Preferred stock cash dividends......................... — — — — (72,734) — — (72,734)Exercise of 374,786 Series A stock warrants into 204,133 shares of common stock ............................................... — — — (28,746) — — 28,746 — Purchases of treasury stock.............................. — — — — — — (1,205,905) (1,205,905)Stock-based compensation transactions, net.... — (64) (298) (57,347) (85) — 154,673 96,879 Common stock cash dividends — $3.00 per share .............................................. — — — — (457,200) — — (457,200)Balance — December 31, 2017 ....................... $1,231,500 79,909 1,847 6,590,855 10,164,804 (363,814) (1,454,282) $16,250,819 2018 Cumulative effect of change in accounting principle — equity securities ....................................................... — — — — 16,853 (16,853) — — Total comprehensive income ........................... — — — — 1,918,080 (39,414) — 1,878,666 Preferred stock cash dividends......................... — — — — (72,521) — — (72,521)Exercise of 257,630 Series A stock warrants into 136,676 shares of common stock ............................................... — — — (22,394) — — 22,394 — Purchases of treasury stock.............................. — — — — — — (2,194,396) (2,194,396)Stock-based compensation transactions, net.... — (26) (121) 10,881 (86) — 97,433 108,081 Common stock cash dividends — $3.55 per share .............................................. — — — — (510,458) — — (510,458)Balance — December 31, 2018 ....................... $1,231,500 79,883 1,726 6,579,342 11,516,672 (420,081) (3,528,851) $15,460,191 2019 Total comprehensive income ........................... — — — — 1,929,149 213,401 — 2,142,550 Preferred stock cash dividends......................... — — — — (72,482) — — (72,482)Redemption of Series A and Series C preferred stock ............................................... (381,500) — — — — — — (381,500)Issuance of Series G preferred stock................ 400,000 — — (4,000) — — — 396,000 Purchases of treasury stock.............................. — — — — — — (1,349,785) (1,349,785)Stock-based compensation transactions, net.... — (12) (160) 18,197 (207) — 56,073 73,891 Common stock cash dividends — $4.10 per share .............................................. — — — — (552,216) — — (552,216)Balance — December 31, 2019 ....................... $1,250,000 79,871 1,566 6,593,539 12,820,916 (206,680) (4,822,563) $15,716,649
See accompanying notes to financial statements.
118
M&T BANK CORPORATION AND SUBSIDIARIES
Notes to Financial Statements
1. Significant accounting policiesM&T Bank Corporation (“M&T”) is a bank holding company headquartered in Buffalo, New York. Through subsidiaries, M&T provides individuals, corporations and other businesses, and institutions with commercial and retail banking services, including loans and deposits, trust, mortgage banking, asset management, insurance and other financial services. Banking activities are largely focused on consumers residing in New York State, Maryland, New Jersey, Pennsylvania, Delaware, Connecticut, Virginia, West Virginia and the District of Columbia and on small and medium-size businesses based in those areas. Certain subsidiaries also conduct activities in other areas.
The accounting and reporting policies of M&T and subsidiaries (“the Company”) are in accordance with accounting principles generally accepted in the United States of America (“GAAP”) and general practices within the banking industry. The preparation of financial statements in conformity with GAAP requires management to make estimates and assumptions that affect the reported amounts of assets and liabilities and disclosure of contingent assets and liabilities at the date of the financial statements and the reported amounts of revenues and expenses during the reporting period. Actual results could differ from those estimates. The significant accounting policies are as follows:
ConsolidationThe consolidated financial statements include M&T and all of its subsidiaries. All significant intercompany accounts and transactions of consolidated subsidiaries have been eliminated in consolidation. The financial statements of M&T included in note 25 report investments in subsidiaries under the equity method. Information about some limited purpose entities that are affiliates of the Company but are not included in the consolidated financial statements appears in note 19.
Consolidated Statement of Cash FlowsFor purposes of this statement, cash and due from banks and federal funds sold are considered cash and cash equivalents.
Securities purchased under agreements to resell and securities sold under agreements to repurchaseSecurities purchased under agreements to resell and securities sold under agreements to repurchase are treated as collateralized financing transactions and are recorded at amounts equal to the cash or other consideration exchanged. It is generally the Company’s policy to take possession of collateral pledged to secure agreements to resell.
Trading accountFinancial instruments used for trading purposes are stated at fair value. Realized gains and losses and unrealized changes in fair value of financial instruments utilized in trading activities are included in “trading account and foreign exchange gains” in the consolidated statement of income.
Investment securitiesInvestments in debt securities are classified as held to maturity and stated at amortized cost when management has the positive intent and ability to hold such securities to maturity. Investments in other debt securities are classified as available for sale and stated at estimated fair value with unrealized changes in fair value included in “accumulated other comprehensive income (loss), net.”

119
Investments in equity securities having readily determinable fair values are stated at fair value and, beginning in 2018, unrealized changes in fair value are included in earnings. Investments in equity securities that do not have readily determinable fair values are stated at cost minus impairment, if any, plus or minus changes resulting from observable price changes in orderly transactions for the identical or a similar investment of the same issuer. Prior to 2018, equity securities with readily determinable fair values were classified as available for sale. Amortization of premiums and accretion of discounts for investment securities available for sale and held to maturity are included in interest income.
Other securities are stated at cost and include stock of the Federal Reserve Bank of New York and the Federal Home Loan Bank (“FHLB”) of New York.
Individual debt securities are written down through a charge to earnings when declines in value below the cost basis of a security are considered to be other than temporary. In cases where fair value is less than amortized cost and the Company intends to sell a debt security, it is more likely than not to be required to sell a debt security before recovery of its amortized cost basis, or the Company does not expect to recover the entire amortized cost basis of a debt security, an other-than-temporary impairment is considered to have occurred. If the Company intends to sell the debt security or more likely than not will be required to sell the security before recovery of its amortized cost basis, the other-than-temporary impairment is recognized in earnings equal to the entire difference between the debt security’s amortized cost basis and its fair value. If the Company does not expect to recover the entire amortized cost basis of the security, the Company does not intend to sell the security and it is not more likely than not that the Company will be required to sell the security before recovery of its amortized cost basis, the other-than-temporary impairment is separated into (a) the amount representing the credit loss and (b) the amount related to all other factors. The amount of the other-than-temporary impairment related to the credit loss is recognized in earnings while the amount related to other factors is recognized in other comprehensive income, net of applicable taxes. Subsequently, the Company accounts for the other-than-temporarily impaired debt security as if the security had been purchased on the measurement date of the other-than-temporary impairment at an amortized cost basis equal to the previous amortized cost basis less the other-than-temporary impairment recognized in earnings. Realized gains and losses on the sales of investment securities are determined using the specific identification method.
Loans and leasesThe Company’s accounting methods for loans depends on whether the loans were originated by the Company or were acquired in a business combination.
Originated loans and leasesInterest income on loans is accrued on a level yield method. Loans are placed on nonaccrual status and previously accrued interest thereon is charged against income when principal or interest is delinquent 90 days, unless management determines that the loan status clearly warrants other treatment. Nonaccrual commercial loans and commercial real estate loans are returned to accrual status when borrowers have demonstrated an ability to repay their loans and there are no delinquent principal and interest payments. Consumer loans not secured by residential real estate are returned to accrual status when all past due principal and interest payments have been paid by the borrower. Loans secured by residential real estate are returned to accrual status when they are deemed to have an insignificant delay in payments of 90 days or less. Loan balances are charged off when it becomes evident that such balances are not fully collectible. For commercial loans and commercial real estate loans, charge-offs are recognized after an assessment by credit personnel of the capacity and willingness of the borrower to repay, the estimated value of any collateral, and any other potential

120
sources of repayment. A charge-off is recognized when, after such assessment, it becomes evident that the loan balance is not fully collectible. For loans secured by residential real estate, the excess of the loan balances over the net realizable value of the property collateralizing the loan is charged-off when the loan becomes 150 days delinquent. Consumer loans are generally charged-off when the loans are 91 to 180 days past due, depending on whether the loan is collateralized and the status of repossession activities with respect to such collateral. Loan fees and certain direct loan origination costs are deferred and recognized as an interest yield adjustment over the life of the loan. Net deferred fees have been included in unearned discount as a reduction of loans outstanding. Commitments to sell real estate loans are utilized by the Company to hedge the exposure to changes in fair value of real estate loans held for sale. The carrying value of hedged real estate loans held for sale recorded in the consolidated balance sheet includes changes in estimated fair market value during the hedge period, typically from the date of close through the sale date. Valuation adjustments made on these loans and commitments are included in “mortgage banking revenues.”
Except for consumer and residential mortgage loans that are considered smaller balance homogenous loans and are evaluated collectively, the Company considers a loan to be impaired for purposes of applying GAAP when, based on current information and events, it is probable that the Company will be unable to collect all amounts according to the contractual terms of the loan agreement or the loan is delinquent 90 days. Regardless of loan type, the Company considers a loan to be impaired if it qualifies as a troubled debt restructuring. Impaired loans are classified as either nonaccrual or as loans renegotiated at below market rates which continue to accrue interest, provided that a credit assessment of the borrower’s financial condition results in an expectation of full repayment under the modified contractual terms. Certain loans greater than 90 days delinquent are not considered impaired if they are well-secured and in the process of collection. Loans less than 90 days delinquent are deemed to have an insignificant delay in payment and are generally not considered impaired. Impairment of a loan is measured based on the present value of expected future cash flows discounted at the loan’s effective interest rate, the loan’s observable market price, or the fair value of collateral if the loan is collateral-dependent. Interest received on impaired loans placed on nonaccrual status is generally applied to reduce the carrying value of the loan or, if principal is considered fully collectible, recognized as interest income.
Residual value estimates for commercial leases are generally determined through internal or external reviews of the leased property. The Company reviews commercial lease residual values at least annually and recognizes residual value impairments deemed to be other than temporary.
Loans and leases acquired in a business combinationLoans acquired in a business combination subsequent to December 31, 2008 were initially recorded at fair value with no carry-over of an acquired entity’s previously established allowance for credit losses. Purchased impaired loans represent specifically identified loans with evidence of credit deterioration for which it was probable at acquisition that the Company would be unable to collect all contractual principal and interest payments. For purchased impaired loans and other loans acquired at a discount that was, in part, attributable to credit quality, the excess of cash flows expected at acquisition over the estimated fair value of acquired loans was recognized as interest income over the remaining lives of the loans. Subsequent decreases in the expected cash flows required the Company to evaluate the need for additions to the Company’s allowance for credit losses. Subsequent improvements in expected cash flows resulted first in the recovery of any related allowance for credit losses and then in recognition of additional interest income over the then-remaining lives of the loans.
121
For all other acquired loans, the difference between the fair value and outstanding principal balance of the loans is recognized as an adjustment to interest income over the lives of those loans. Those loans are then accounted for in a manner that is similar to originated loans.
Allowance for credit lossesThe allowance for credit losses represents, in management’s judgment, the amount of losses inherent in the loan and lease portfolio as of the balance sheet date. The allowance is determined by management’s evaluation of the loan and lease portfolio based on such factors as the differing economic risks associated with each loan category, the current financial condition of specific borrowers, the economic environment in which borrowers operate, the level of delinquent loans, the value of any collateral and, where applicable, the existence of any guarantees or indemnifications. The effects of probable decreases in expected principal cash flows on loans acquired at a discount are also considered in the establishment of the allowance for credit losses.
Assets taken in foreclosure of defaulted loansAssets taken in foreclosure of defaulted loans are primarily comprised of commercial and residential real property and are included in “other assets” in the consolidated balance sheet. An in-substance repossession or foreclosure occurs and a creditor is considered to have received physical possession of residential real estate property collateralizing a consumer mortgage loan upon either (1) the creditor obtaining legal title to the residential real estate property upon completion of a foreclosure or (2) the borrower conveying all interest in the residential real estate property to the creditor to satisfy that loan through completion of a deed in lieu of foreclosure or through a similar legal agreement. Upon acquisition of assets taken in satisfaction of a defaulted loan, the excess of the remaining loan balance over the asset’s estimated fair value less costs to sell is charged-off against the allowance for credit losses. Subsequent declines in value of the assets are recognized as “other costs of operations” in the consolidated statement of income.
Premises and equipmentPremises and equipment are stated at cost less accumulated depreciation. Depreciation expense is computed principally using the straight-line method over the estimated useful lives of the assets.
Capitalized servicing rightsCapitalized servicing assets are included in “other assets” in the consolidated balance sheet. Separately recognized servicing assets are initially measured at fair value. The Company uses the amortization method to subsequently measure servicing assets. Under that method, capitalized servicing assets are charged to expense in proportion to and over the period of estimated net servicing income.
To estimate the fair value of servicing rights, the Company considers market prices for similar assets and the present value of expected future cash flows associated with the servicing rights calculated using assumptions that market participants would use in estimating future servicing income and expense. Such assumptions include estimates of the cost of servicing loans, loan default rates, an appropriate discount rate, and prepayment speeds. For purposes of evaluating and measuring impairment of capitalized servicing rights, the Company stratifies such assets based on the predominant risk characteristics of the underlying financial instruments that are expected to have the most impact on projected prepayments, cost of servicing and other factors affecting future cash flows associated with the servicing rights. Such factors may include financial asset or loan type, note rate and term. The amount of impairment recognized is the amount by which the carrying value of the capitalized servicing rights for a stratum exceeds estimated fair value. Impairment is recognized through a valuation allowance.

122
Sales and securitizations of financial assetsTransfers of financial assets for which the Company has surrendered control of the financial assets are accounted for as sales. Interests in a sale of financial assets that continue to be held by the Company, including servicing rights, are initially measured at fair value. The fair values of retained debt securities are generally determined through reference to independent pricing information. The fair values of retained servicing rights and any other retained interests are determined based on the present value of expected future cash flows associated with those interests and by reference to market prices for similar assets.
Securitization structures typically require the use of special-purpose trusts that are considered variable interest entities. A variable interest entity is included in the consolidated financial statements if the Company has the power to direct the activities that most significantly impact the variable interest entity’s economic performance and has the obligation to absorb losses or the right to receive benefits of the variable interest entity that could potentially be significant to that entity.
Goodwill and core deposit and other intangible assetsGoodwill represents the excess of the cost of an acquired entity over the fair value of the identifiable net assets acquired. Goodwill is not amortized, but rather is tested for impairment at least annually at the reporting unit level, which is either at the same level or one level below an operating segment. Other acquired intangible assets with finite lives, such as core deposit intangibles, are initially recorded at estimated fair value and are amortized over their estimated lives. Core deposit and other intangible assets are generally amortized using accelerated methods over estimated useful lives of five to ten years. The Company periodically assesses whether events or changes in circumstances indicate that the carrying amounts of core deposit and other intangible assets may be impaired.
Derivative financial instrumentsThe Company accounts for derivative financial instruments at fair value. If certain conditions are met, a derivative may be specifically designated as (a) a hedge of the exposure to changes in the fair value of a recognized asset or liability or an unrecognized firm commitment, (b) a hedge of the exposure to variable cash flows of a forecasted transaction or (c) a hedge of the foreign currency exposure of a net investment in a foreign operation, an unrecognized firm commitment, an available-for-sale security, or a foreign currency denominated forecasted transaction.
The Company utilizes interest rate swap agreements as part of the management of interest rate risk to modify the repricing characteristics of certain portions of its portfolios of earning assets and interest-bearing liabilities. For such agreements, amounts receivable or payable are recognized as accrued under the terms of the agreement and the net differential is recorded as an adjustment to interest income or expense of the related asset or liability. Interest rate swap agreements may be designated as either fair value hedges or cash flow hedges. In a fair value hedge, the fair values of the interest rate swap agreements and changes in the fair values of the hedged items are recorded in the Company’s consolidated balance sheet with the corresponding gain or loss recognized in current earnings. The difference between changes in the fair values of interest rate swap agreements and the hedged items represents hedge ineffectiveness and, beginning in 2018, is recorded in the same income statement line item that is used to present the earnings effect of the hedged item in the consolidated statement of income. In a cash flow hedge, the derivative’s unrealized gain or loss is initially recorded as a component of other comprehensive income and subsequently reclassified into earnings when the forecasted transaction affects earnings. Prior to 2018, hedge ineffectiveness for fair value and cash flow hedges was recorded in “other revenues from operations” in the consolidated statement of income. In addition, for cash flow hedges, the effective portion of the derivative’s unrealized gain or loss was initially recorded as a component of other comprehensive income and subsequently reclassified into earnings when the forecasted transaction affected earnings.

123
The Company utilizes commitments to sell real estate loans to hedge the exposure to changes in the fair value of real estate loans held for sale. Commitments to originate real estate loans to be held for sale and commitments to sell real estate loans are generally recorded in the consolidated balance sheet at estimated fair value.
Derivative instruments not related to mortgage banking activities, including financial futures commitments and interest rate swap agreements, that do not satisfy the hedge accounting requirements are recorded at fair value and are generally classified as trading account assets or liabilities with resultant changes in fair value being recognized in “trading account and foreign exchange gains” in the consolidated statement of income.
Stock-based compensationStock-based compensation expense is recognized over the vesting period of the stock-based grant based on the estimated grant date value of the stock-based compensation, except that the recognition of compensation costs is accelerated for stock-based awards granted to retirement-eligible employees and employees who will become retirement-eligible prior to full vesting of the award because the Company’s incentive compensation plan allows for vesting at the time an employee retires.
Income taxesDeferred tax assets and liabilities are recognized for the future tax effects attributable to differences between the financial statement value of existing assets and liabilities and their respective tax bases and carryforwards. Deferred tax assets and liabilities are measured using enacted tax rates and laws.
The Company evaluates uncertain tax positions using the two-step process required by GAAP. The first step requires a determination of whether it is more likely than not that a tax position will be sustained upon examination, including resolution of any related appeals or litigation processes, based on the technical merits of the position. Under the second step, a tax position that meets the more-likely-than-not recognition threshold is measured at the largest amount of benefit that is greater than fifty percent likely of being realized upon ultimate settlement.
The Company accounts for its investments in qualified affordable housing projects using the proportional amortization method. Under that method, the Company amortizes the initial cost of the investment in proportion to the tax credits and other tax benefits received and recognizes the net investment performance in the income statement as a component of income tax expense.
Earnings per common shareBasic earnings per common share exclude dilution and are computed by dividing income available to common shareholders by the weighted-average number of common shares outstanding (exclusive of shares represented by the unvested portion of restricted stock and restricted stock unit grants) and common shares issuable under deferred compensation arrangements during the period. Diluted earnings per common share reflect shares represented by the unvested portion of restricted stock and restricted stock unit grants and the potential dilution that could occur if securities or other contracts to issue common stock were exercised or converted into common stock or resulted in the issuance of common stock that then shared in earnings. Proceeds assumed to have been received on such exercise or conversion are assumed to be used to purchase shares of M&T common stock at the average market price during the period, as required by the “treasury stock method” of accounting.
GAAP requires that unvested share-based payment awards that contain nonforfeitable rights to dividends or dividend equivalents (whether paid or unpaid) shall be considered participating securities and shall be included in the computation of earnings per common share pursuant to the two-class method. The Company has issued stock-based compensation awards in the form of restricted stock and restricted stock units that contain such rights and, accordingly, the Company’s earnings per common share are calculated using the two-class method.

124
Treasury stockRepurchases of shares of M&T common stock are recorded at cost as a reduction of shareholders’ equity. Reissuances of shares of treasury stock are recorded at average cost.
2. Investment securitiesOn January 1, 2018, the Company adopted amended guidance requiring equity investments with readily determinable fair values to be measured at fair value with changes in fair value recognized in the consolidated statement of income. This amended guidance excludes equity method investments, investments in consolidated subsidiaries, exchange membership ownership interests, and Federal Home Loan Bank of New York and Federal Reserve Bank of New York capital stock. Upon adoption the Company reclassified $17 million, after-tax effect, from accumulated other comprehensive income to retained earnings, representing the difference between fair value and the cost basis of equity investments with readily determinable fair values at January 1, 2018. The amortized cost and estimated fair value of investment securities were as follows:
Amortized
Cost
GrossUnrealized
Gains
GrossUnrealized
Losses EstimatedFair Value
(In thousands)
December 31, 2019 Investment securities available for sale: U.S. Treasury and federal agencies........................................... $ 9,742 $ 41 $ 16 $ 9,767 Obligations of states and political subdivisions........................ 776 2 3 775 Mortgage-backed securities:
Government issued or guaranteed ....................................... 6,113,913 88,634 21,607 6,180,940 Privately issued.................................................................... 16 — — 16
Other debt securities ................................................................. 133,829 2,046 8,597 127,278 6,258,276 90,723 30,223 6,318,776 Investment securities held to maturity: U.S. Treasury and federal agencies........................................... 249,862 286 — 250,148 Obligations of states and political subdivisions........................ 4,140 16 — 4,156 Mortgage-backed securities:
Government issued or guaranteed ....................................... 2,306,180 50,381 1,992 2,354,569 Privately issued.................................................................... 93,496 11,779 18,181 87,094
Other debt securities ................................................................. 3,239 — — 3,239 2,656,917 62,462 20,173 2,699,206 Total debt securities .................................................................. $8,915,193 $ 153,185 $ 50,396 $9,017,982
Equity and other securities: Readily marketable equity — at fair value.......................... $ 105,524 $ 34,786 $ 269 $ 140,041 Other — at cost.................................................................... 381,517 — — 381,517
Total equity and other securities ............................................... $ 487,041 $ 34,786 $ 269 $ 521,558
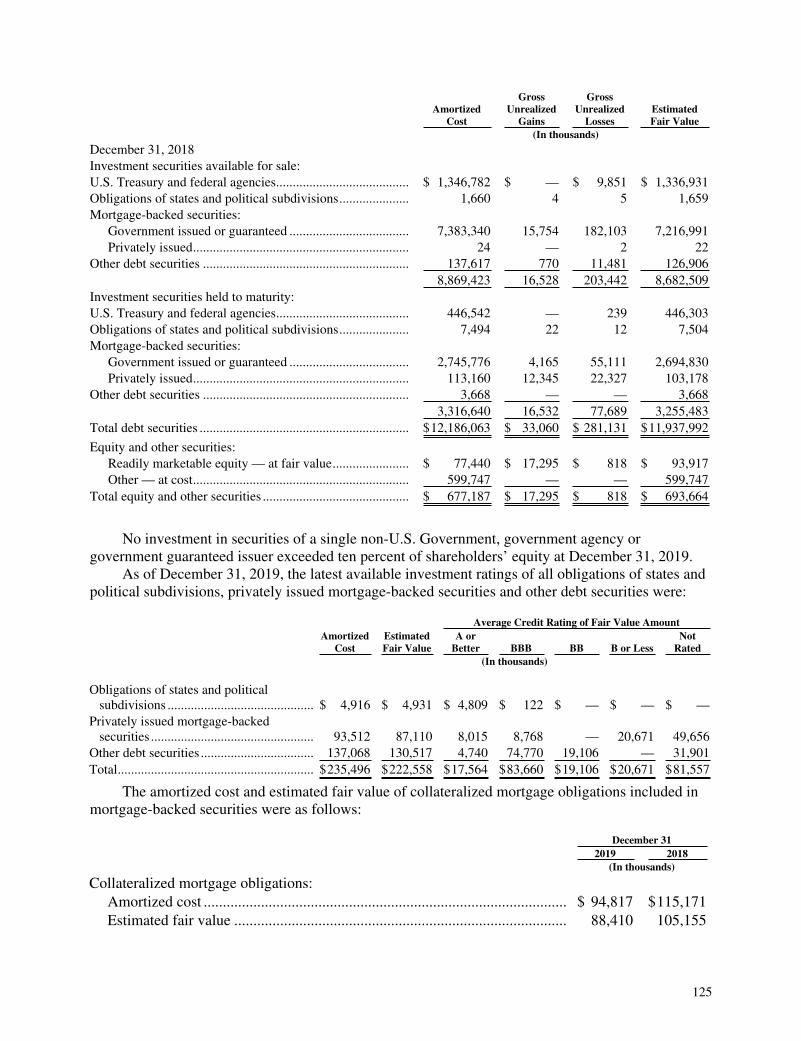
125
Amortized
Cost
GrossUnrealized
Gains
GrossUnrealized
Losses EstimatedFair Value
(In thousands)
December 31, 2018 Investment securities available for sale: U.S. Treasury and federal agencies........................................ $ 1,346,782 $ — $ 9,851 $ 1,336,931 Obligations of states and political subdivisions..................... 1,660 4 5 1,659 Mortgage-backed securities:
Government issued or guaranteed .................................... 7,383,340 15,754 182,103 7,216,991 Privately issued................................................................. 24 — 2 22
Other debt securities .............................................................. 137,617 770 11,481 126,906 8,869,423 16,528 203,442 8,682,509 Investment securities held to maturity: U.S. Treasury and federal agencies........................................ 446,542 — 239 446,303 Obligations of states and political subdivisions..................... 7,494 22 12 7,504 Mortgage-backed securities:
Government issued or guaranteed .................................... 2,745,776 4,165 55,111 2,694,830 Privately issued................................................................. 113,160 12,345 22,327 103,178
Other debt securities .............................................................. 3,668 — — 3,668 3,316,640 16,532 77,689 3,255,483 Total debt securities ............................................................... $12,186,063 $ 33,060 $ 281,131 $11,937,992
Equity and other securities: Readily marketable equity — at fair value....................... $ 77,440 $ 17,295 $ 818 $ 93,917 Other — at cost................................................................. 599,747 — — 599,747
Total equity and other securities ............................................ $ 677,187 $ 17,295 $ 818 $ 693,664
No investment in securities of a single non-U.S. Government, government agency or government guaranteed issuer exceeded ten percent of shareholders’ equity at December 31, 2019.
As of December 31, 2019, the latest available investment ratings of all obligations of states and political subdivisions, privately issued mortgage-backed securities and other debt securities were:
Average Credit Rating of Fair Value Amount
Amortized
Cost EstimatedFair Value
A orBetter BBB BB B or Less
NotRated
(In thousands)
Obligations of states and political subdivisions ............................................ $ 4,916 $ 4,931 $ 4,809 $ 122 $ — $ — $ — Privately issued mortgage-backed securities ................................................. 93,512 87,110 8,015 8,768 — 20,671 49,656 Other debt securities .................................. 137,068 130,517 4,740 74,770 19,106 — 31,901 Total........................................................... $235,496 $222,558 $17,564 $83,660 $19,106 $20,671 $81,557
The amortized cost and estimated fair value of collateralized mortgage obligations included in mortgage-backed securities were as follows:
December 31 2019 2018 (In thousands)
Collateralized mortgage obligations: Amortized cost ............................................................................................... $ 94,817 $115,171 Estimated fair value ....................................................................................... 88,410 105,155

126
Gross realized gains on investment securities were $23 million in 2017. During 2017, the Company sold a portion of its Fannie Mae and Freddie Mac preferred stock holdings held in the available-for-sale investment securities portfolio for a gain of $18 million. There were no significant gross realized gains or losses from sales of investment securities in 2019 or 2018. There were no significant gross realized losses from sales of investment securities in 2017.
At December 31, 2019, the amortized cost and estimated fair value of debt securities by contractual maturity were as follows:
Amortized
Cost EstimatedFair Value
(In thousands)
Debt securities available for sale: Due in one year or less................................................................................................ $ 4,418 4,427 Due after one year through five years......................................................................... 10,717 10,777 Due after five years through ten years ........................................................................ 99,212 98,616 Due after ten years ...................................................................................................... 30,000 24,000 144,347 137,820 Mortgage-backed securities available for sale............................................................ 6,113,929 6,180,956 $ 6,258,276 6,318,776
Debt securities held to maturity: Due in one year or less................................................................................................ $ 251,457 251,749 Due after one year through five years......................................................................... 2,545 2,555 Due after ten years ...................................................................................................... 3,239 3,239 257,241 257,543 Mortgage-backed securities held to maturity ............................................................. 2,399,676 2,441,663 $ 2,656,917 2,699,206

127
A summary of investment securities that as of December 31, 2019 and 2018 had been in a continuous unrealized loss position for less than twelve months and those that had been in a continuous unrealized loss position for twelve months or longer follows:
Less Than 12 Months 12 Months or More
Fair
Value Unrealized
Losses Fair
Value Unrealized
Losses (In thousands)
December 31, 2019 Investment securities available for sale: U.S. Treasury and federal agencies...................................... $ 1,406 (7) 2,893 (9)Obligations of states and political subdivisions................... — — 277 (3)Mortgage-backed securities:
Government issued or guaranteed .................................. 117,299 (222) 2,002,364 (21,385)Other debt securities............................................................. 6,600 (354) 56,313 (8,243) 125,305 (583) 2,061,847 (29,640)Investment securities held to maturity: Mortgage-backed securities:
Government issued or guaranteed .................................. 2,727 (5) 145,235 (1,987)Privately issued............................................................... — — 49,656 (18,181)
2,727 (5) 194,891 (20,168)Total ..................................................................................... $ 128,032 (588) 2,256,738 (49,808)
December 31, 2018 Investment securities available for sale: U.S. Treasury and federal agencies...................................... $ 273 (2) 1,335,559 (9,849)Obligations of states and political subdivisions................... 629 (5) — — Mortgage-backed securities:
Government issued or guaranteed .................................. 405,558 (2,892) 5,646,773 (179,211)Privately issued............................................................... 22 (2) — —
Other debt securities............................................................. 53,478 (2,187) 66,014 (9,294) 459,960 (5,088) 7,048,346 (198,354)Investment securities held to maturity: U.S. Treasury and federal agencies...................................... 446,303 (239) — — Obligations of states and political subdivisions................... — — 3,126 (12)Mortgage-backed securities:
Government issued or guaranteed .................................. 179,354 (989) 2,082,723 (54,122)Privately issued............................................................... — — 51,943 (22,327)
625,657 (1,228) 2,137,792 (76,461)Total ..................................................................................... $1,085,617 (6,316) 9,186,138 (274,815)
The Company owned 641 individual investment securities with aggregate gross unrealized losses of $50 million at December 31, 2019. Based on a review of each of the securities in the investment securities portfolio at December 31, 2019, the Company concluded that it expected to recover the amortized cost basis of its investment. As of December 31, 2019, the Company does not intend to sell nor is it anticipated that it would be required to sell any of its impaired investment securities at a loss. At December 31, 2019, the Company has not identified events or changes in circumstances which may have a significant adverse effect on the fair value of the $382 million of cost method investment securities.

128
At December 31, 2019, investment securities with a carrying value of $1.9 billion, including $1.5 billion of investment securities available for sale, were pledged to secure borrowings from various FHLBs, repurchase agreements, governmental deposits, interest rate swap agreements and available lines of credit as described in note 8.
Investment securities pledged by the Company to secure obligations whereby the secured party is permitted by contract or custom to sell or repledge such collateral totaled $200 million at December 31, 2019. The pledged securities included securities of the U.S. Treasury and federal agencies and mortgage-backed securities.
3. Loans and leasesTotal loans and leases outstanding were comprised of the following:
December 31 2019 2018 (In thousands)
Loans Commercial, financial, etc....................................................................... $22,575,700 $21,730,012 Real estate:
Residential .......................................................................................... 16,098,125 17,150,658 Commercial......................................................................................... 26,718,325 25,666,200 Construction........................................................................................ 9,010,297 8,823,635
Consumer................................................................................................. 15,373,881 13,956,086 Total loans........................................................................................... 89,776,328 87,326,591
Leases Commercial......................................................................................... 1,412,197 1,406,901
Total loans and leases .............................................................................. 91,188,525 88,733,492 Less: unearned discount........................................................................... (265,656) (267,015)Total loans and leases, net of unearned discount..................................... $90,922,869 $88,466,477
One-to-four family residential mortgage loans held for sale were $414 million at December 31, 2019 and $205 million at December 31, 2018. Commercial real estate loans held for sale were $28 million at December 31, 2019 and $347 million at December 31, 2018.
As of December 31, 2019, approximately $3.9 billion of commercial real estate loan balances serviced for others had been sold with recourse in conjunction with the Company’s participation in the Fannie Mae Delegated Underwriting and Servicing (“DUS”) program. At December 31, 2019, the Company estimated that the recourse obligations described above were not material to the Company’s consolidated financial position. There have been no material losses incurred as a result of those credit recourse arrangements.
In addition to recourse obligations, as described in note 21, the Company is contractually obligated to repurchase previously sold residential real estate loans that do not ultimately meet investor sale criteria related to underwriting procedures or loan documentation. When required to do so, the Company may reimburse loan purchasers for losses incurred or may repurchase certain loans. Charges incurred for such obligation were not material in 2019, 2018 or 2017.

129
A summary of current, past due and nonaccrual loans as of December 31, 2019 and 2018 follows:
Current 30-89 DaysPast Due
AccruingLoans Past
Due 90Days orMore (a)
AccruingLoans
Acquired ata DiscountPast Due90 days
or More (b) Purchased
Impaired (c) Nonaccrual Total
(In thousands)
December 31, 2019 Commercial, financial, leasing, etc............................................. $23,290,797 184,011 16,776 27 — 346,557 $23,838,168 Real estate:
Commercial ........................... 26,311,414 165,579 6,740 — 15,601 158,474 26,657,808 Residential builder and developer ............................ 1,521,315 21,195 — — 753 3,982 1,547,245 Other commercial construction ........................ 7,204,148 95,346 3,360 — 1,237 32,770 7,336,861 Residential............................. 12,760,040 451,274 486,515 5,788 143,145 235,663 14,082,425 Residential — limited documentation .................... 1,858,037 65,215 181 — 66,809 83,427 2,073,669
Consumer: Home equity lines and loans ................................... 4,386,511 30,229 — 1,662 — 63,215 4,481,617 Recreational finance.............. 5,484,997 36,827 — 99 — 14,219 5,536,142 Automobile............................ 3,787,221 78,478 — — — 21,293 3,886,992 Other...................................... 1,395,240 45,978 5,156 32,056 — 3,512 1,481,942
Total............................................ $87,999,720 1,174,132 518,728 39,632 227,545 963,112 $90,922,869
December 31, 2018
Commercial, financial, leasing, etc............................................. $22,701,020 39,798 2,567 168 — 234,423 $22,977,976 Real estate:
Commercial ........................... 25,250,983 134,474 11,457 10 9,769 203,672 25,610,365 Residential builder and developer ............................ 1,665,178 20,333 — — — 4,798 1,690,309 Other commercial construction ........................ 6,982,077 43,615 14,344 — 641 22,205 7,062,882 Residential............................. 13,591,790 404,808 189,682 6,650 203,044 233,352 14,629,326 Residential — limited documentation .................... 2,278,040 72,544 — — 89,851 84,685 2,525,120
Consumer: Home equity lines and loans ................................... 4,758,513 25,416 — 5,033 — 71,292 4,860,254 Recreational finance.............. 4,085,781 29,947 — 235 — 11,199 4,127,162 Automobile............................ 3,555,757 79,804 — — — 23,359 3,658,920 Other...................................... 1,271,811 15,598 4,477 27,654 — 4,623 1,324,163
Total............................................ $86,140,950 866,337 222,527 39,750 303,305 893,608 $88,466,477
(a) Excludes loans acquired at a discount.(b) Loans acquired at a discount that were recorded at fair value at acquisition date. This category does not
include purchased impaired loans that are presented separately.(c) Accruing loans acquired at a discount that were impaired at acquisition date and recorded at fair value.
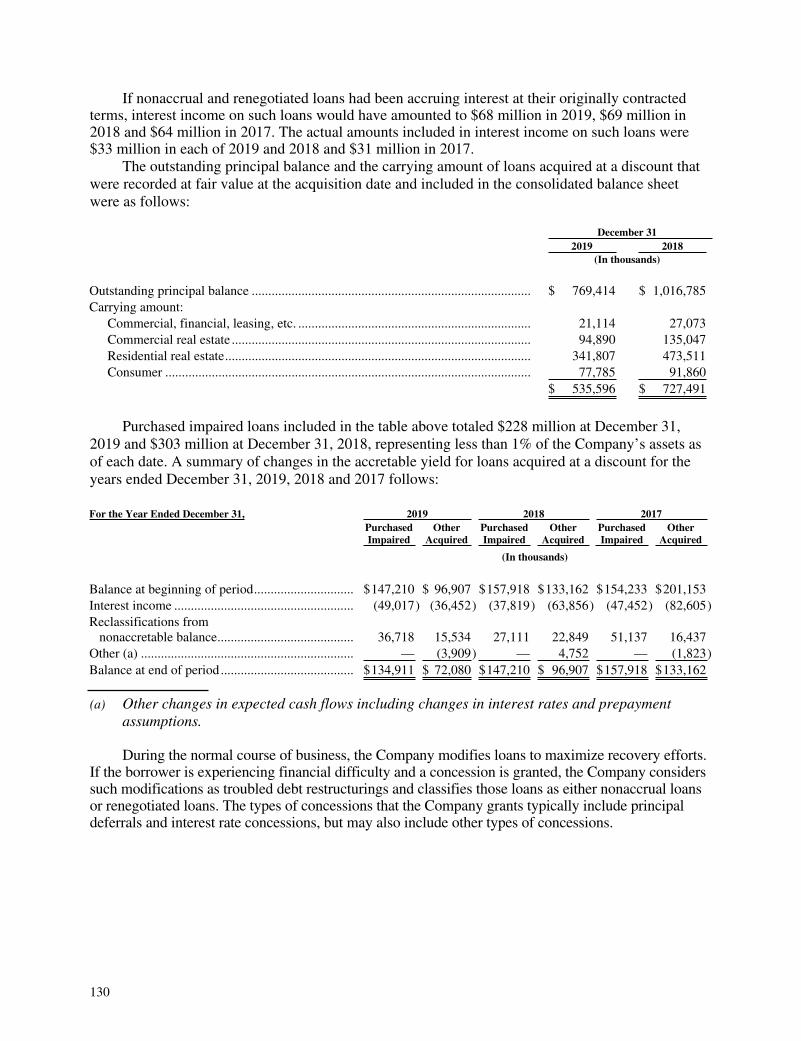
130
If nonaccrual and renegotiated loans had been accruing interest at their originally contracted terms, interest income on such loans would have amounted to $68 million in 2019, $69 million in 2018 and $64 million in 2017. The actual amounts included in interest income on such loans were $33 million in each of 2019 and 2018 and $31 million in 2017.
The outstanding principal balance and the carrying amount of loans acquired at a discount that were recorded at fair value at the acquisition date and included in the consolidated balance sheet were as follows:
December 31 2019 2018 (In thousands)
Outstanding principal balance .................................................................................... $ 769,414 $ 1,016,785 Carrying amount:
Commercial, financial, leasing, etc. ...................................................................... 21,114 27,073 Commercial real estate .......................................................................................... 94,890 135,047 Residential real estate............................................................................................ 341,807 473,511 Consumer .............................................................................................................. 77,785 91,860
$ 535,596 $ 727,491
Purchased impaired loans included in the table above totaled $228 million at December 31, 2019 and $303 million at December 31, 2018, representing less than 1% of the Company’s assets as of each date. A summary of changes in the accretable yield for loans acquired at a discount for the years ended December 31, 2019, 2018 and 2017 follows:
For the Year Ended December 31, 2019 2018 2017
PurchasedImpaired
OtherAcquired
PurchasedImpaired
OtherAcquired
PurchasedImpaired
OtherAcquired
(In thousands)
Balance at beginning of period.............................. $147,210 $ 96,907 $157,918 $133,162 $154,233 $201,153 Interest income ...................................................... (49,017) (36,452) (37,819) (63,856) (47,452) (82,605)Reclassifications from nonaccretable balance......................................... 36,718 15,534 27,111 22,849 51,137 16,437 Other (a) ................................................................ — (3,909) — 4,752 — (1,823)Balance at end of period........................................ $134,911 $ 72,080 $147,210 $ 96,907 $157,918 $133,162
(a) Other changes in expected cash flows including changes in interest rates and prepayment assumptions.
During the normal course of business, the Company modifies loans to maximize recovery efforts. If the borrower is experiencing financial difficulty and a concession is granted, the Company considers such modifications as troubled debt restructurings and classifies those loans as either nonaccrual loans or renegotiated loans. The types of concessions that the Company grants typically include principal deferrals and interest rate concessions, but may also include other types of concessions.

131
The tables that follow summarize the Company’s loan modification activities that were considered troubled debt restructurings for the years ended December 31, 2019, 2018 and 2017:
Post-modification (a)
Year Ended December 31, 2019 Number
Pre-modification
Recorded Investment
Principal Deferral
Interest Rate
Reduction Other
Combination of
Concession Types Total
(Dollars in thousands)
Commercial, financial, leasing, etc. .................. 150 $ 63,715 $10,485 $ — $ — $ 52,871 $ 63,356 Real estate:
Commercial .................................................. 51 48,315 5,193 — — 26,152 31,345 Residential builder and developer ................ 2 1,330 1,068 — — — 1,068 Other commercial construction .................... 3 1,559 — — — 1,500 1,500 Residential.................................................... 83 21,695 10,819 — — 11,907 22,726 Residential — limited documentation ........................................... 6 1,409 399 — — 1,044 1,443
Consumer: Home equity lines and loans ........................ 41 4,127 176 — — 4,004 4,180 Recreational finance..................................... 10 265 265 — — — 265 Automobile................................................... 66 1,141 1,076 — — 65 1,141
Total................................................................... 412 $ 143,556 $29,481 $ — $ — $ 97,543 $127,024
Year Ended December 31, 2018 Commercial, financial, leasing, etc. .................. 203 $ 102,445 $50,490 $ 803 $ 6,210 $ 45,411 $102,914 Real estate:
Commercial .................................................. 83 30,217 16,870 175 4,686 9,000 30,731 Other commercial construction .................... 1 752 746 — — — 746 Residential.................................................... 134 34,798 19,962 — — 18,110 38,072 Residential — limited documentation ........................................... 9 1,887 827 — — 1,423 2,250
Consumer: Home equity lines and loans ........................ 47 3,952 224 — — 3,755 3,979 Recreational finance..................................... 7 202 202 — — — 202 Automobile................................................... 73 1,330 1,318 — — 12 1,330
Total................................................................... 557 $ 175,583 $90,639 $ 978 $10,896 $ 77,711 $180,224
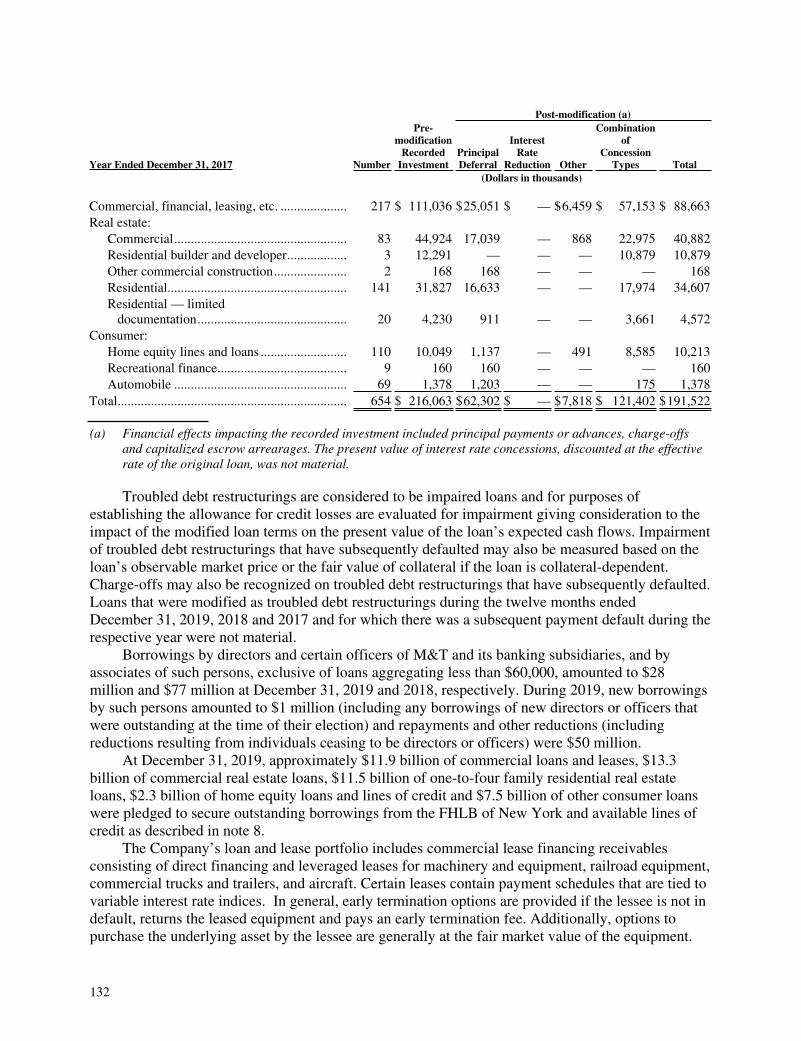
132
Post-modification (a)
Year Ended December 31, 2017 Number
Pre-modification
Recorded Investment
Principal Deferral
Interest Rate
Reduction Other
Combination of
Concession Types Total
(Dollars in thousands)
Commercial, financial, leasing, etc. .................... 217 $ 111,036 $25,051 $ — $6,459 $ 57,153 $ 88,663 Real estate:
Commercial.................................................... 83 44,924 17,039 — 868 22,975 40,882 Residential builder and developer.................. 3 12,291 — — — 10,879 10,879 Other commercial construction...................... 2 168 168 — — — 168 Residential...................................................... 141 31,827 16,633 — — 17,974 34,607 Residential — limited documentation............................................. 20 4,230 911 — — 3,661 4,572
Consumer: Home equity lines and loans .......................... 110 10,049 1,137 — 491 8,585 10,213 Recreational finance....................................... 9 160 160 — — — 160 Automobile .................................................... 69 1,378 1,203 — — 175 1,378
Total..................................................................... 654 $ 216,063 $62,302 $ — $7,818 $ 121,402 $191,522
(a) Financial effects impacting the recorded investment included principal payments or advances, charge-offs and capitalized escrow arrearages. The present value of interest rate concessions, discounted at the effective rate of the original loan, was not material.
Troubled debt restructurings are considered to be impaired loans and for purposes of establishing the allowance for credit losses are evaluated for impairment giving consideration to the impact of the modified loan terms on the present value of the loan’s expected cash flows. Impairment of troubled debt restructurings that have subsequently defaulted may also be measured based on the loan’s observable market price or the fair value of collateral if the loan is collateral-dependent. Charge-offs may also be recognized on troubled debt restructurings that have subsequently defaulted. Loans that were modified as troubled debt restructurings during the twelve months ended December 31, 2019, 2018 and 2017 and for which there was a subsequent payment default during the respective year were not material.
Borrowings by directors and certain officers of M&T and its banking subsidiaries, and by associates of such persons, exclusive of loans aggregating less than $60,000, amounted to $28 million and $77 million at December 31, 2019 and 2018, respectively. During 2019, new borrowings by such persons amounted to $1 million (including any borrowings of new directors or officers that were outstanding at the time of their election) and repayments and other reductions (including reductions resulting from individuals ceasing to be directors or officers) were $50 million.
At December 31, 2019, approximately $11.9 billion of commercial loans and leases, $13.3 billion of commercial real estate loans, $11.5 billion of one-to-four family residential real estate loans, $2.3 billion of home equity loans and lines of credit and $7.5 billion of other consumer loans were pledged to secure outstanding borrowings from the FHLB of New York and available lines of credit as described in note 8.
The Company’s loan and lease portfolio includes commercial lease financing receivables consisting of direct financing and leveraged leases for machinery and equipment, railroad equipment, commercial trucks and trailers, and aircraft. Certain leases contain payment schedules that are tied to variable interest rate indices. In general, early termination options are provided if the lessee is not in default, returns the leased equipment and pays an early termination fee. Additionally, options to purchase the underlying asset by the lessee are generally at the fair market value of the equipment.
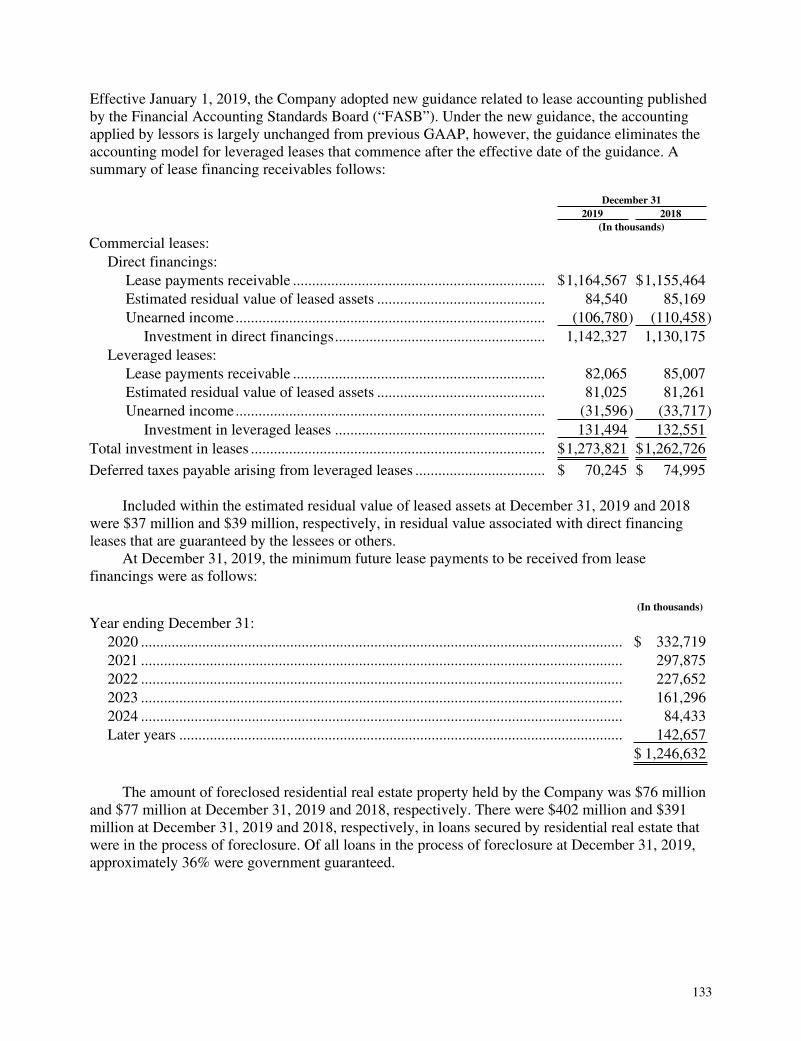
133
Effective January 1, 2019, the Company adopted new guidance related to lease accounting published by the Financial Accounting Standards Board (“FASB”). Under the new guidance, the accounting applied by lessors is largely unchanged from previous GAAP, however, the guidance eliminates the accounting model for leveraged leases that commence after the effective date of the guidance. A summary of lease financing receivables follows:
December 31 2019 2018 (In thousands)
Commercial leases: Direct financings:
Lease payments receivable .................................................................. $1,164,567 $1,155,464 Estimated residual value of leased assets ............................................ 84,540 85,169 Unearned income................................................................................. (106,780) (110,458)
Investment in direct financings....................................................... 1,142,327 1,130,175 Leveraged leases:
Lease payments receivable .................................................................. 82,065 85,007 Estimated residual value of leased assets ............................................ 81,025 81,261 Unearned income................................................................................. (31,596) (33,717)
Investment in leveraged leases ....................................................... 131,494 132,551 Total investment in leases ............................................................................. $1,273,821 $1,262,726
Deferred taxes payable arising from leveraged leases .................................. $ 70,245 $ 74,995
Included within the estimated residual value of leased assets at December 31, 2019 and 2018 were $37 million and $39 million, respectively, in residual value associated with direct financing leases that are guaranteed by the lessees or others.
At December 31, 2019, the minimum future lease payments to be received from lease financings were as follows:
(In thousands)
Year ending December 31: 2020 .............................................................................................................................. $ 332,719 2021 .............................................................................................................................. 297,875 2022 .............................................................................................................................. 227,652 2023 .............................................................................................................................. 161,296 2024 .............................................................................................................................. 84,433 Later years .................................................................................................................... 142,657
$ 1,246,632
The amount of foreclosed residential real estate property held by the Company was $76 million and $77 million at December 31, 2019 and 2018, respectively. There were $402 million and $391 million at December 31, 2019 and 2018, respectively, in loans secured by residential real estate that were in the process of foreclosure. Of all loans in the process of foreclosure at December 31, 2019, approximately 36% were government guaranteed.
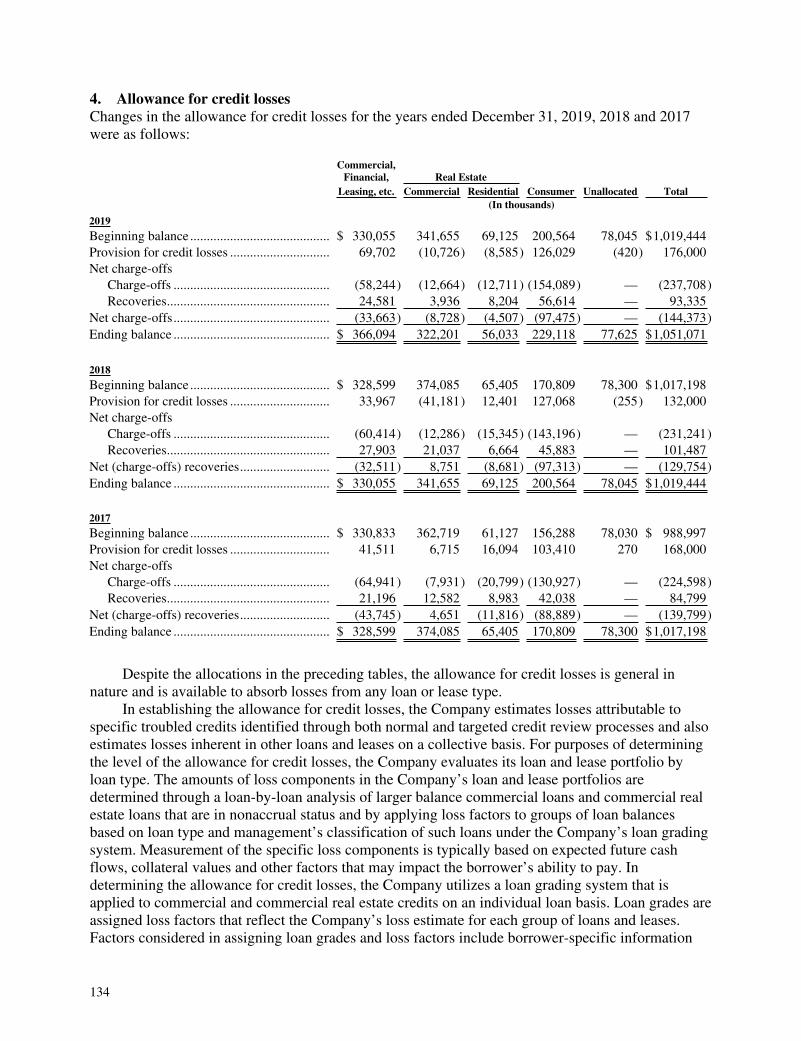
134
4. Allowance for credit lossesChanges in the allowance for credit losses for the years ended December 31, 2019, 2018 and 2017 were as follows:
Commercial,
Financial, Real Estate Leasing, etc. Commercial Residential Consumer Unallocated Total
(In thousands)
2019 Beginning balance .......................................... $ 330,055 341,655 69,125 200,564 78,045 $1,019,444 Provision for credit losses .............................. 69,702 (10,726) (8,585) 126,029 (420) 176,000 Net charge-offs
Charge-offs ............................................... (58,244) (12,664) (12,711) (154,089) — (237,708)Recoveries................................................. 24,581 3,936 8,204 56,614 — 93,335
Net charge-offs............................................... (33,663) (8,728) (4,507) (97,475) — (144,373)Ending balance ............................................... $ 366,094 322,201 56,033 229,118 77,625 $1,051,071
2018
Beginning balance .......................................... $ 328,599 374,085 65,405 170,809 78,300 $1,017,198 Provision for credit losses .............................. 33,967 (41,181) 12,401 127,068 (255) 132,000 Net charge-offs
Charge-offs ............................................... (60,414) (12,286) (15,345) (143,196) — (231,241)Recoveries................................................. 27,903 21,037 6,664 45,883 — 101,487
Net (charge-offs) recoveries........................... (32,511) 8,751 (8,681) (97,313) — (129,754)Ending balance ............................................... $ 330,055 341,655 69,125 200,564 78,045 $1,019,444
2017
Beginning balance .......................................... $ 330,833 362,719 61,127 156,288 78,030 $ 988,997 Provision for credit losses .............................. 41,511 6,715 16,094 103,410 270 168,000 Net charge-offs
Charge-offs ............................................... (64,941) (7,931) (20,799) (130,927) — (224,598)Recoveries................................................. 21,196 12,582 8,983 42,038 — 84,799
Net (charge-offs) recoveries........................... (43,745) 4,651 (11,816) (88,889) — (139,799)Ending balance ............................................... $ 328,599 374,085 65,405 170,809 78,300 $1,017,198
Despite the allocations in the preceding tables, the allowance for credit losses is general in nature and is available to absorb losses from any loan or lease type.
In establishing the allowance for credit losses, the Company estimates losses attributable to specific troubled credits identified through both normal and targeted credit review processes and also estimates losses inherent in other loans and leases on a collective basis. For purposes of determining the level of the allowance for credit losses, the Company evaluates its loan and lease portfolio by loan type. The amounts of loss components in the Company’s loan and lease portfolios are determined through a loan-by-loan analysis of larger balance commercial loans and commercial real estate loans that are in nonaccrual status and by applying loss factors to groups of loan balances based on loan type and management’s classification of such loans under the Company’s loan grading system. Measurement of the specific loss components is typically based on expected future cash flows, collateral values and other factors that may impact the borrower’s ability to pay. In determining the allowance for credit losses, the Company utilizes a loan grading system that is applied to commercial and commercial real estate credits on an individual loan basis. Loan grades are assigned loss factors that reflect the Company’s loss estimate for each group of loans and leases. Factors considered in assigning loan grades and loss factors include borrower-specific information

135
related to expected future cash flows and operating results, collateral values, geographic location, financial condition and performance, payment status, and other information; levels of and trends in portfolio charge-offs and recoveries; levels of and trends in portfolio delinquencies and impaired loans; changes in the risk profile of specific portfolios; trends in volume and terms of loans; effects of changes in credit concentrations; and observed trends and practices in the banking industry.
The following tables provide information with respect to loans and leases that were considered impaired as of December 31, 2019 and 2018 and for the years ended December 31, 2019, 2018 and 2017.
December 31, 2019 December 31, 2018
Recorded
Investment
UnpaidPrincipalBalance
RelatedAllowance
RecordedInvestment
UnpaidPrincipalBalance
RelatedAllowance
(In thousands)
With an allowance recorded: Commercial, financial, leasing, etc..................... $230,444 257,745 74,435 153,478 175,549 46,034 Real estate:
Commercial ................................................... 60,745 73,026 7,713 110,253 125,117 11,937 Residential builder and developer ................. 9,559 9,856 121 5,981 6,557 462 Other commercial construction ..................... 12,425 24,908 1,354 10,563 11,113 640 Residential ..................................................... 125,623 145,497 6,873 124,974 147,817 5,402 Residential — limited documentation........... 64,268 77,359 2,300 74,156 90,066 3,000
Consumer: Home equity lines and loans ......................... 46,325 51,238 8,957 47,982 53,248 9,135 Recreational finance ...................................... 5,270 9,579 1,095 6,138 9,163 1,261 Automobile.................................................... 3,256 3,344 703 3,527 3,599 729 Other.............................................................. 4,542 8,341 915 5,203 8,380 1,046
562,457 660,893 104,466 542,255 630,609 79,646 With no related allowance recorded:
Commercial, financial, leasing, etc..................... 139,127 152,132 — 105,507 136,128 — Real estate:
Commercial ................................................... 117,751 131,406 — 113,376 124,657 — Residential builder and developer ................. 3,378 3,378 — 2,593 2,602 — Other commercial construction ..................... 20,345 21,306 — 11,710 11,880 — Residential ..................................................... 18,090 23,365 — 15,379 20,496 — Residential — limited documentation........... 4,985 8,348 — 5,631 9,796 —
303,676 339,935 — 254,196 305,559 — Total:
Commercial, financial, leasing, etc..................... 369,571 409,877 74,435 258,985 311,677 46,034 Real estate:
Commercial ................................................... 178,496 204,432 7,713 223,629 249,774 11,937 Residential builder and developer ................. 12,937 13,234 121 8,574 9,159 462 Other commercial construction ..................... 32,770 46,214 1,354 22,273 22,993 640 Residential ..................................................... 143,713 168,862 6,873 140,353 168,313 5,402 Residential — limited documentation........... 69,253 85,707 2,300 79,787 99,862 3,000
Consumer: Home equity lines and loans ......................... 46,325 51,238 8,957 47,982 53,248 9,135 Recreational finance ...................................... 5,270 9,579 1,095 6,138 9,163 1,261 Automobile.................................................... 3,256 3,344 703 3,527 3,599 729 Other.............................................................. 4,542 8,341 915 5,203 8,380 1,046
Total ......................................................................... $866,133 1,000,828 104,466 796,451 936,168 79,646
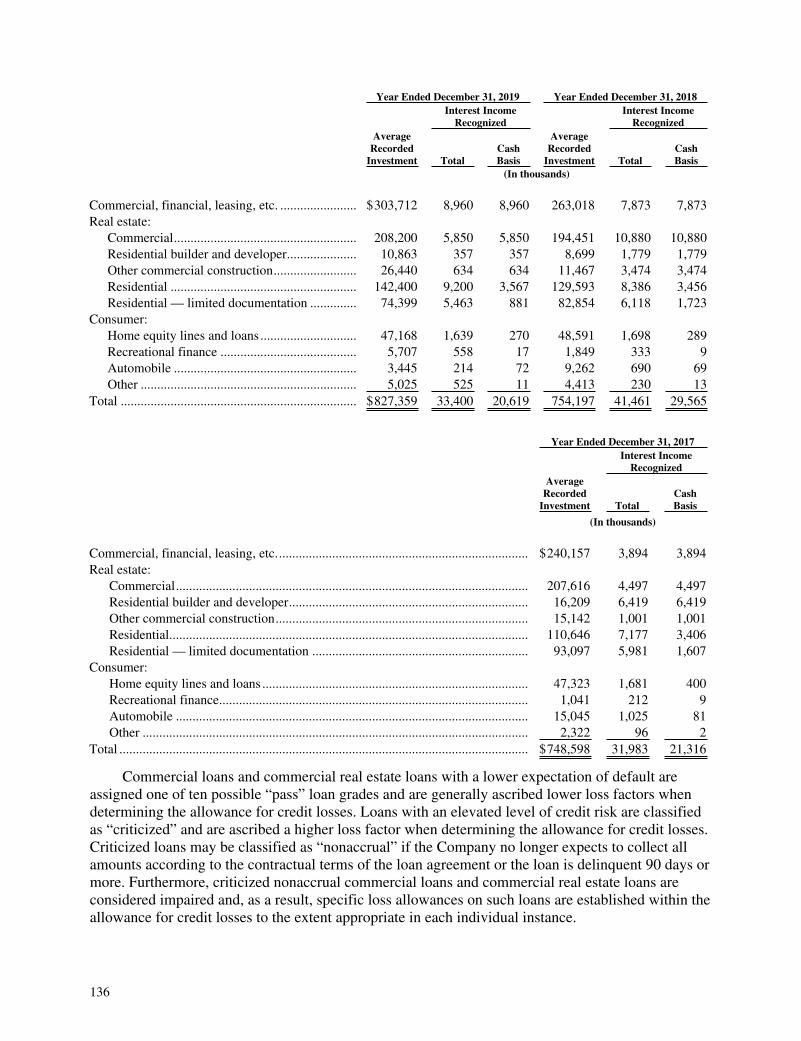
136
Year Ended December 31, 2019 Year Ended December 31, 2018
Interest Income
Recognized Interest Income
Recognized
AverageRecorded
Investment Total CashBasis
AverageRecorded
Investment Total CashBasis
(In thousands)
Commercial, financial, leasing, etc. ....................... $303,712 8,960 8,960 263,018 7,873 7,873 Real estate:
Commercial....................................................... 208,200 5,850 5,850 194,451 10,880 10,880 Residential builder and developer..................... 10,863 357 357 8,699 1,779 1,779 Other commercial construction......................... 26,440 634 634 11,467 3,474 3,474 Residential ........................................................ 142,400 9,200 3,567 129,593 8,386 3,456 Residential — limited documentation .............. 74,399 5,463 881 82,854 6,118 1,723
Consumer: Home equity lines and loans............................. 47,168 1,639 270 48,591 1,698 289 Recreational finance ......................................... 5,707 558 17 1,849 333 9 Automobile ....................................................... 3,445 214 72 9,262 690 69 Other ................................................................. 5,025 525 11 4,413 230 13
Total ....................................................................... $827,359 33,400 20,619 754,197 41,461 29,565
Year Ended December 31, 2017
Interest Income
Recognized
AverageRecorded
Investment Total CashBasis
(In thousands)
Commercial, financial, leasing, etc............................................................................ $240,157 3,894 3,894 Real estate: Commercial.......................................................................................................... 207,616 4,497 4,497 Residential builder and developer........................................................................ 16,209 6,419 6,419 Other commercial construction............................................................................ 15,142 1,001 1,001 Residential............................................................................................................ 110,646 7,177 3,406 Residential — limited documentation ................................................................. 93,097 5,981 1,607 Consumer: Home equity lines and loans ................................................................................ 47,323 1,681 400 Recreational finance............................................................................................. 1,041 212 9 Automobile .......................................................................................................... 15,045 1,025 81 Other .................................................................................................................... 2,322 96 2 Total ........................................................................................................................... $748,598 31,983 21,316
Commercial loans and commercial real estate loans with a lower expectation of default are assigned one of ten possible “pass” loan grades and are generally ascribed lower loss factors when determining the allowance for credit losses. Loans with an elevated level of credit risk are classified as “criticized” and are ascribed a higher loss factor when determining the allowance for credit losses. Criticized loans may be classified as “nonaccrual” if the Company no longer expects to collect all amounts according to the contractual terms of the loan agreement or the loan is delinquent 90 days or more. Furthermore, criticized nonaccrual commercial loans and commercial real estate loans are considered impaired and, as a result, specific loss allowances on such loans are established within the allowance for credit losses to the extent appropriate in each individual instance.
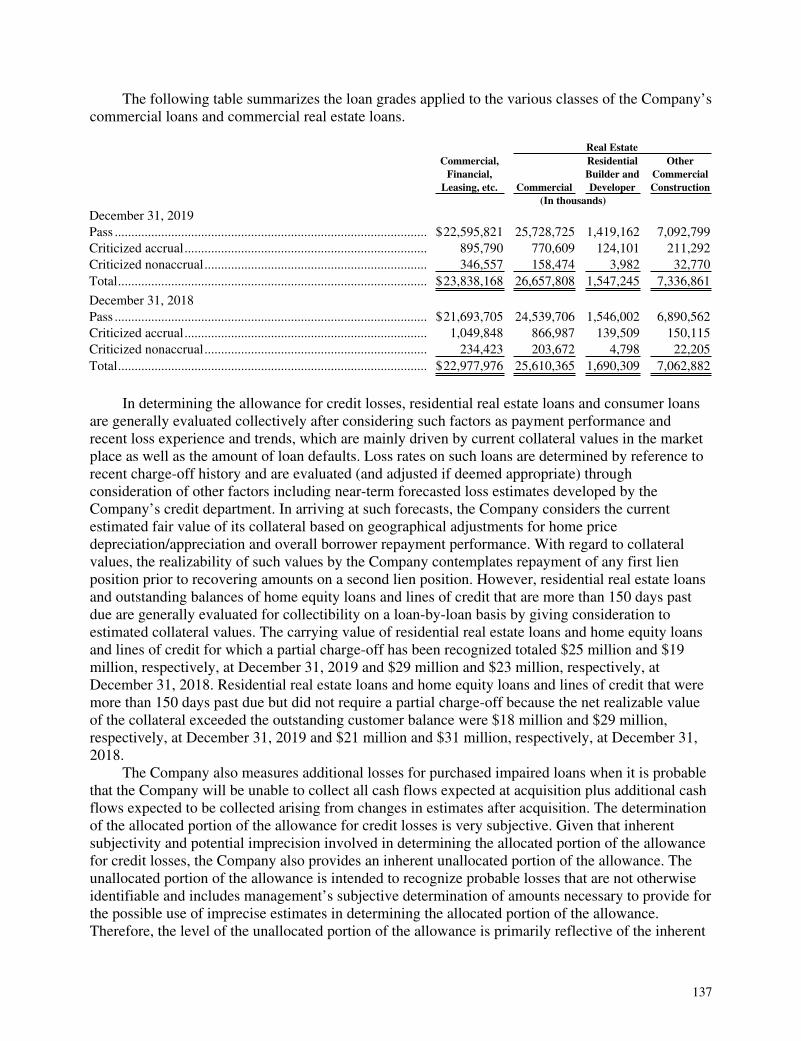
137
The following table summarizes the loan grades applied to the various classes of the Company’s commercial loans and commercial real estate loans.
Real Estate Commercial, Residential Other Financial, Builder and Commercial Leasing, etc. Commercial Developer Construction (In thousands)
December 31, 2019 Pass .............................................................................................. $22,595,821 25,728,725 1,419,162 7,092,799 Criticized accrual......................................................................... 895,790 770,609 124,101 211,292 Criticized nonaccrual................................................................... 346,557 158,474 3,982 32,770 Total............................................................................................. $23,838,168 26,657,808 1,547,245 7,336,861
December 31, 2018 Pass .............................................................................................. $21,693,705 24,539,706 1,546,002 6,890,562 Criticized accrual......................................................................... 1,049,848 866,987 139,509 150,115 Criticized nonaccrual................................................................... 234,423 203,672 4,798 22,205 Total............................................................................................. $22,977,976 25,610,365 1,690,309 7,062,882
In determining the allowance for credit losses, residential real estate loans and consumer loans are generally evaluated collectively after considering such factors as payment performance and recent loss experience and trends, which are mainly driven by current collateral values in the market place as well as the amount of loan defaults. Loss rates on such loans are determined by reference to recent charge-off history and are evaluated (and adjusted if deemed appropriate) through consideration of other factors including near-term forecasted loss estimates developed by the Company’s credit department. In arriving at such forecasts, the Company considers the current estimated fair value of its collateral based on geographical adjustments for home price depreciation/appreciation and overall borrower repayment performance. With regard to collateral values, the realizability of such values by the Company contemplates repayment of any first lien position prior to recovering amounts on a second lien position. However, residential real estate loans and outstanding balances of home equity loans and lines of credit that are more than 150 days past due are generally evaluated for collectibility on a loan-by-loan basis by giving consideration to estimated collateral values. The carrying value of residential real estate loans and home equity loans and lines of credit for which a partial charge-off has been recognized totaled $25 million and $19 million, respectively, at December 31, 2019 and $29 million and $23 million, respectively, at December 31, 2018. Residential real estate loans and home equity loans and lines of credit that were more than 150 days past due but did not require a partial charge-off because the net realizable value of the collateral exceeded the outstanding customer balance were $18 million and $29 million, respectively, at December 31, 2019 and $21 million and $31 million, respectively, at December 31, 2018.
The Company also measures additional losses for purchased impaired loans when it is probable that the Company will be unable to collect all cash flows expected at acquisition plus additional cash flows expected to be collected arising from changes in estimates after acquisition. The determination of the allocated portion of the allowance for credit losses is very subjective. Given that inherent subjectivity and potential imprecision involved in determining the allocated portion of the allowance for credit losses, the Company also provides an inherent unallocated portion of the allowance. The unallocated portion of the allowance is intended to recognize probable losses that are not otherwise identifiable and includes management’s subjective determination of amounts necessary to provide for the possible use of imprecise estimates in determining the allocated portion of the allowance. Therefore, the level of the unallocated portion of the allowance is primarily reflective of the inherent

138
imprecision in the various calculations used in determining the allocated portion of the allowance for credit losses. Other factors that could also lead to changes in the unallocated portion include the effects of expansion into new markets for which the Company does not have the same degree of familiarity and experience regarding portfolio performance in changing market conditions, the introduction of new loan and lease product types, and other risks associated with the Company’s loan portfolio that may not be specifically identifiable.
The allocation of the allowance for credit losses summarized on the basis of the Company’s impairment methodology was as follows:
Commercial,
Financial, Real Estate Leasing, etc. Commercial Residential Consumer Total (In thousands)
December 31, 2019 Individually evaluated for impairment ............................. $ 74,435 9,188 9,173 11,670 $ 104,466 Collectively evaluated for impairment ............................. 291,659 313,013 43,656 217,448 865,776 Purchased impaired........................................................... — — 3,204 — 3,204 Allocated........................................................................... $ 366,094 322,201 56,033 229,118 973,446
Unallocated ....................................................................... 77,625 Total.................................................................................. $1,051,071
December 31, 2018 Individually evaluated for impairment ............................. $ 46,034 13,039 8,402 12,171 $ 79,646 Collectively evaluated for impairment ............................. 284,021 328,616 48,326 188,393 849,356 Purchased impaired........................................................... — — 12,397 — 12,397 Allocated........................................................................... $ 330,055 341,655 69,125 200,564 941,399
Unallocated ....................................................................... 78,045 Total.................................................................................. $1,019,444
The recorded investment in loans and leases summarized on the basis of the Company’s impairment methodology was as follows:
Commercial,
Financial, Real Estate Leasing, etc. Commercial Residential Consumer Total (In thousands)
December 31, 2019 Individually evaluated for impairment....................... $ 369,571 224,203 212,966 59,393 $ 866,133 Collectively evaluated for impairment...................... 23,468,597 35,300,120 15,733,174 15,327,300 89,829,191 Purchased impaired .................................................... — 17,591 209,954 — 227,545 Total ........................................................................... $23,838,168 35,541,914 16,156,094 15,386,693 $90,922,869
December 31, 2018 Individually evaluated for impairment....................... $ 258,985 254,476 220,140 62,850 $ 796,451 Collectively evaluated for impairment....................... 22,718,991 34,098,670 16,641,411 13,907,649 87,366,721 Purchased impaired .................................................... — 10,410 292,895 — 303,305 Total ........................................................................... $22,977,976 34,363,556 17,154,446 13,970,499 $88,466,477
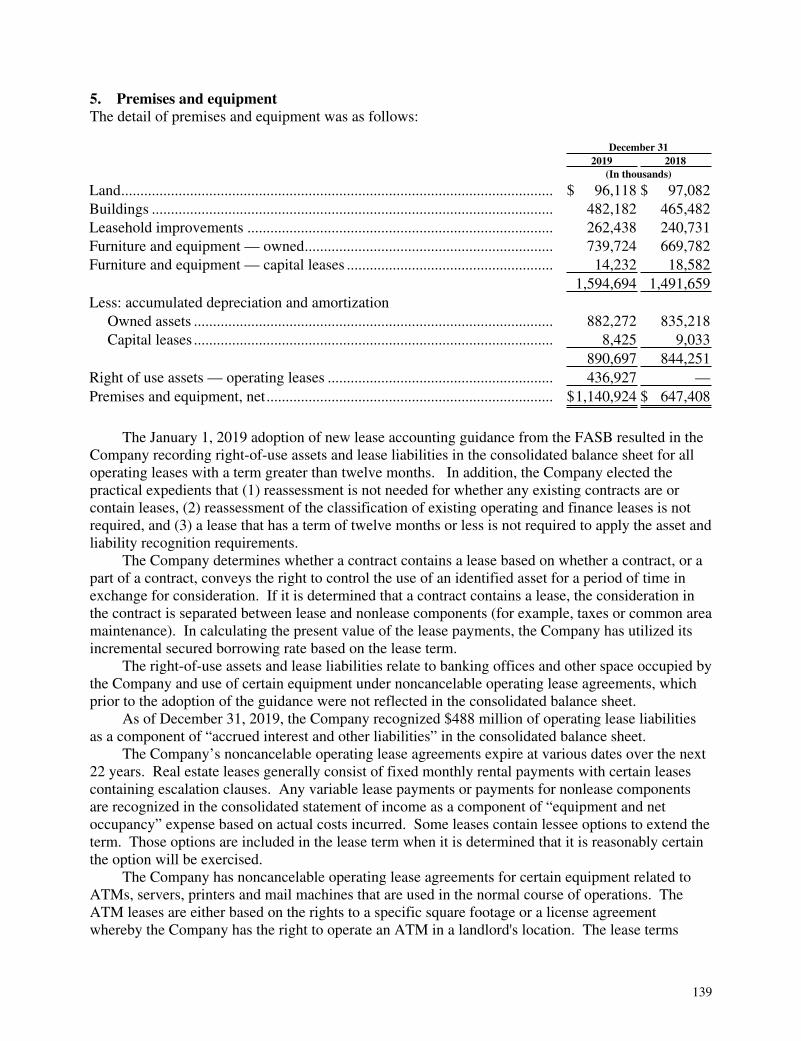
139
5. Premises and equipmentThe detail of premises and equipment was as follows:
December 31 2019 2018 (In thousands)
Land................................................................................................................. $ 96,118 $ 97,082 Buildings ......................................................................................................... 482,182 465,482 Leasehold improvements ................................................................................ 262,438 240,731 Furniture and equipment — owned................................................................. 739,724 669,782 Furniture and equipment — capital leases ...................................................... 14,232 18,582 1,594,694 1,491,659 Less: accumulated depreciation and amortization
Owned assets .............................................................................................. 882,272 835,218 Capital leases .............................................................................................. 8,425 9,033
890,697 844,251 Right of use assets — operating leases ........................................................... 436,927 — Premises and equipment, net........................................................................... $1,140,924 $ 647,408
The January 1, 2019 adoption of new lease accounting guidance from the FASB resulted in the Company recording right-of-use assets and lease liabilities in the consolidated balance sheet for all operating leases with a term greater than twelve months. In addition, the Company elected the practical expedients that (1) reassessment is not needed for whether any existing contracts are or contain leases, (2) reassessment of the classification of existing operating and finance leases is not required, and (3) a lease that has a term of twelve months or less is not required to apply the asset and liability recognition requirements.
The Company determines whether a contract contains a lease based on whether a contract, or a part of a contract, conveys the right to control the use of an identified asset for a period of time in exchange for consideration. If it is determined that a contract contains a lease, the consideration in the contract is separated between lease and nonlease components (for example, taxes or common area maintenance). In calculating the present value of the lease payments, the Company has utilized its incremental secured borrowing rate based on the lease term.
The right-of-use assets and lease liabilities relate to banking offices and other space occupied by the Company and use of certain equipment under noncancelable operating lease agreements, which prior to the adoption of the guidance were not reflected in the consolidated balance sheet.
As of December 31, 2019, the Company recognized $488 million of operating lease liabilities as a component of “accrued interest and other liabilities” in the consolidated balance sheet.
The Company’s noncancelable operating lease agreements expire at various dates over the next 22 years. Real estate leases generally consist of fixed monthly rental payments with certain leases containing escalation clauses. Any variable lease payments or payments for nonlease components are recognized in the consolidated statement of income as a component of “equipment and net occupancy” expense based on actual costs incurred. Some leases contain lessee options to extend the term. Those options are included in the lease term when it is determined that it is reasonably certain the option will be exercised.
The Company has noncancelable operating lease agreements for certain equipment related to ATMs, servers, printers and mail machines that are used in the normal course of operations. The ATM leases are either based on the rights to a specific square footage or a license agreement whereby the Company has the right to operate an ATM in a landlord's location. The lease terms

140
generally contain both fixed payments and variable payments that are transaction-based. Given the transaction-based nature of the variable payments, such payments are excluded from the measurement of the right-of-use asset and lease liability and are recognized in the consolidated statement of income as a component of “equipment and net occupancy” expense when incurred.
The following table presents information about the Company’s lease costs for operating leases recorded in the consolidated balance sheet, cash paid toward lease liabilities, and the weighted-average remaining term and discount rates of the operating leases.
Year Ended December 31, 2019
(Dollars in thousands)
Lease cost Operating lease cost.................................................................................. $ 100,669 Short-term lease cost................................................................................. 105 Variable lease cost .................................................................................... 2,332
Total lease cost..................................................................................... $ 103,106
Other information Right-of-use assets obtained in exchange for new operating lease liabilities ..................................................................... $ 132,219 Cash paid toward lease liabilities ............................................................. 101,869 Weighted-average remaining lease term .................................................. 7 years Weighted-average discount rate ............................................................... 3.01%
Minimum lease payments under noncancelable operating leases are summarized in the following table.
(In thousands)
Year ending December 31: 2020............................................................................................................ $ 100,447 2021............................................................................................................ 95,199 2022............................................................................................................ 79,794 2023............................................................................................................ 62,766 2024............................................................................................................ 50,539 Later years .................................................................................................. 154,585
Total lease payments....................................................................................... 543,330 Less: imputed interest ..................................................................................... 55,775 Total ................................................................................................................ $ 487,555
Net lease expense for all operating leases totaled $111 million in 2018 and $114 million in 2017. All other operating leasing activities were not material to the Company’s consolidated results of operations. Minimum lease payments required under capital leases are not material.

141
6. Capitalized servicing assetsChanges in capitalized servicing assets were as follows:
Residential Mortgage Loans Commercial Mortgage Loans For the Year Ended December 31, 2019 2018 2017 2019 2018 2017
(In thousands)
Beginning balance .......................... $120,509 $114,978 $117,351 $114,663 $114,076 $103,764 Originations .................................... 26,067 28,985 28,792 41,370 26,298 34,620 Purchases ........................................ 144,326 454 699 — — — Amortization................................... (46,491) (23,908) (31,864) (25,397) (25,711) (24,308) 244,411 120,509 114,978 130,636 114,663 114,076 Valuation allowance ....................... (7,000) — — — — — Ending balance, net ........................ $237,411 $120,509 $114,978 $130,636 $114,663 $114,076
Residential mortgage loans serviced for others were $32.3 billion at December 31, 2019, $22.2 billion at December 31, 2018 and $22.6 billion at December 31, 2017. Excluded from residential mortgage loans serviced for others were loans sub-serviced for others of $62.8 billion, $56.8 billion and $56.6 billion at December 31, 2019, 2018, and 2017, respectively. On January 31, 2019, the Company purchased servicing rights for residential real estate loans that had outstanding principal balances at that date of approximately $13.3 billion. The purchase price of such servicing rights was approximately $144 million. Commercial mortgage loans serviced for others were $17.6 billion at December 31, 2019, $15.5 billion at December 31, 2018 and $13.6 billion at December 31, 2017. Excluded from commercial mortgage loans serviced for others were loans sub-serviced for others of $3.4 billion at December 31, 2019, $2.7 billion at December 31, 2018 and $2.6 billion at December 31, 2017.
The estimated fair value of capitalized residential mortgage loan servicing assets was approximately $297 million at December 31, 2019 and $240 million at December 31, 2018. The fair value of capitalized residential mortgage loan servicing assets was estimated using weighted-average discount rates of 10.6% and 11.4% at December 31, 2019 and 2018, respectively, and contemporaneous prepayment assumptions that vary by loan type. At December 31, 2019 and 2018, the discount rate represented a weighted-average option-adjusted spread (“OAS”) of 928 basis points (hundredths of one percent) and 963 basis points, respectively, over market implied forward London Interbank Offered Rates (“LIBOR”). The estimated fair value of capitalized residential mortgage loan servicing rights may vary significantly in subsequent periods due to changing interest rates and the effect thereof on prepayment speeds. The estimated fair value of capitalized commercial mortgage loan servicing assets was approximately $153 million and $135 million at December 31, 2019 and 2018, respectively. An 18% discount rate was used to estimate the fair value of capitalized commercial mortgage loan servicing rights at December 31, 2019 and 2018 with no prepayment assumptions because, in general, the servicing agreements allow the Company to share in customer loan prepayment fees and thereby recover the remaining carrying value of the capitalized servicing rights associated with such loan. The Company’s ability to realize the carrying value of capitalized commercial mortgage servicing rights is more dependent on the borrowers’ abilities to repay the underlying loans than on prepayments or changes in interest rates.
The key economic assumptions used to determine the fair value of significant portfolios of capitalized servicing rights at December 31, 2019 and the sensitivity of such value to changes in those assumptions are summarized in the table that follows. Those calculated sensitivities are hypothetical and actual changes in the fair value of capitalized servicing rights may differ significantly from the amounts presented herein. The effect of a variation in a particular assumption on the fair value of the servicing rights is calculated without changing any other assumption. In

142
reality, changes in one factor may result in changes in another which may magnify or counteract the sensitivities. The changes in assumptions are presumed to be instantaneous.
Residential Commercial (Dollars in thousands)
Weighted-average prepayment speeds ............................................. 15.84% Impact on fair value of 10% adverse change............................... $ (16,555) Impact on fair value of 20% adverse change............................... (31,475)
Weighted-average OAS.................................................................... 9.28% Impact on fair value of 10% adverse change............................... $ (8,070) Impact on fair value of 20% adverse change............................... (15,663)
Weighted-average discount rate ....................................................... 18.00%Impact on fair value of 10% adverse change............................... $ (6,948)Impact on fair value of 20% adverse change............................... (13,395)
7. Goodwill and other intangible assetsThe Company does not amortize goodwill, however, core deposit and other intangible assets are amortized over the estimated life of each respective asset. At December 31, 2019 the Company reduced by $933 million the gross carrying amount and accumulated amortization associated with intangible assets that had been fully amortized and, therefore, had no remaining net carrying amount. Total amortizing intangible assets were comprised of the following:
Gross Carrying
Amount AccumulatedAmortization
Net CarryingAmount
(In thousands)
December 31, 2019 Core deposit ...................................................... $ 131,664 $ 105,802 $ 25,862 Other ................................................................. 6,757 3,585 3,172 Total.................................................................. $ 138,421 $ 109,387 $ 29,034
December 31, 2018 Core deposit ...................................................... $ 887,459 $ 843,572 $ 43,887 Other ................................................................. 182,568 179,388 3,180 Total.................................................................. $ 1,070,027 $ 1,022,960 $ 47,067
Amortization of core deposit and other intangible assets was generally computed using accelerated methods over original amortization periods of three to ten years. The weighted-average original amortization period was approximately eight years. Amortization expense for core deposit and other intangible assets was $19 million, $25 million and $31 million for the years ended December 31, 2019, 2018 and 2017, respectively. Estimated amortization expense in future years for such intangible assets is as follows:
(In thousands)
Year ending December 31: 2020............................................................................................................................. $ 14,869 2021............................................................................................................................. 10,167 2022............................................................................................................................. 3,998
$ 29,034
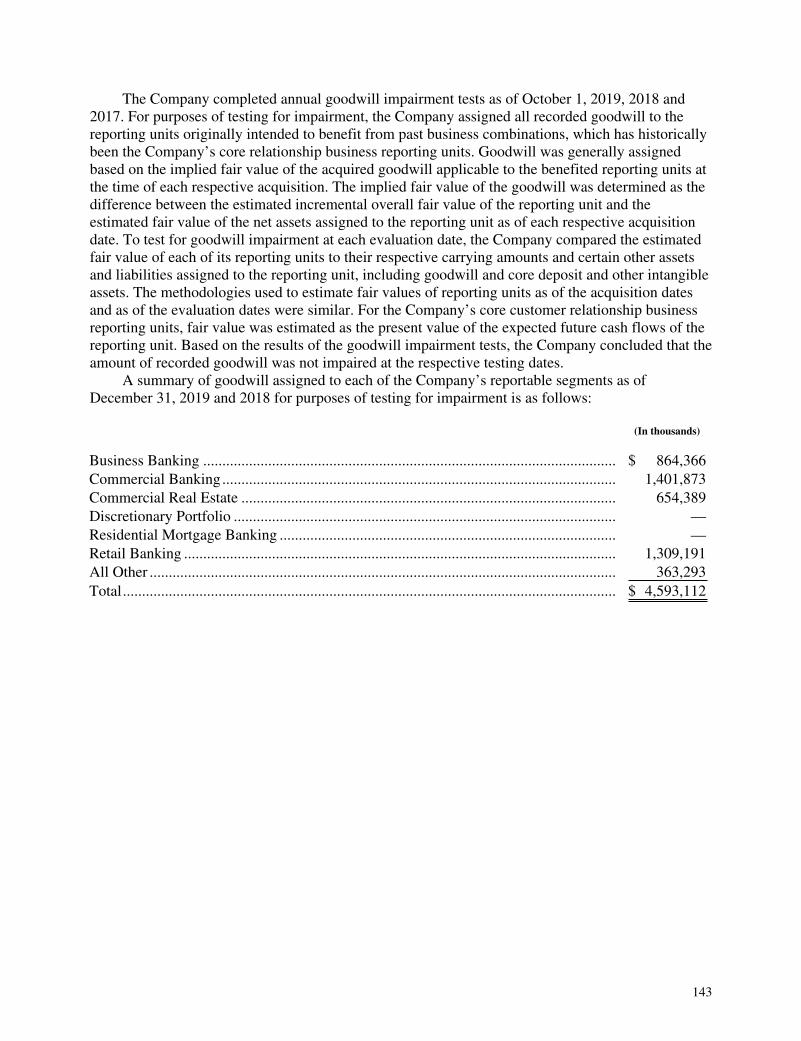
143
The Company completed annual goodwill impairment tests as of October 1, 2019, 2018 and 2017. For purposes of testing for impairment, the Company assigned all recorded goodwill to the reporting units originally intended to benefit from past business combinations, which has historically been the Company’s core relationship business reporting units. Goodwill was generally assigned based on the implied fair value of the acquired goodwill applicable to the benefited reporting units at the time of each respective acquisition. The implied fair value of the goodwill was determined as the difference between the estimated incremental overall fair value of the reporting unit and the estimated fair value of the net assets assigned to the reporting unit as of each respective acquisition date. To test for goodwill impairment at each evaluation date, the Company compared the estimated fair value of each of its reporting units to their respective carrying amounts and certain other assets and liabilities assigned to the reporting unit, including goodwill and core deposit and other intangible assets. The methodologies used to estimate fair values of reporting units as of the acquisition dates and as of the evaluation dates were similar. For the Company’s core customer relationship business reporting units, fair value was estimated as the present value of the expected future cash flows of the reporting unit. Based on the results of the goodwill impairment tests, the Company concluded that the amount of recorded goodwill was not impaired at the respective testing dates.
A summary of goodwill assigned to each of the Company’s reportable segments as of December 31, 2019 and 2018 for purposes of testing for impairment is as follows:
(In thousands)
Business Banking ............................................................................................................ $ 864,366 Commercial Banking....................................................................................................... 1,401,873 Commercial Real Estate .................................................................................................. 654,389 Discretionary Portfolio .................................................................................................... — Residential Mortgage Banking ........................................................................................ — Retail Banking ................................................................................................................. 1,309,191 All Other .......................................................................................................................... 363,293 Total................................................................................................................................. $ 4,593,112

144
8. BorrowingsThe amounts and interest rates of short-term borrowings were as follows:
Federal FundsPurchased
andRepurchaseAgreements
OtherShort-termBorrowings Total
(Dollars in thousands)
At December 31, 2019 Amount outstanding .................................................... $ 62,363 $ — $ 62,363 Weighted-average interest rate.................................... 0.14% — 0.14%
For the year ended December 31, 2019 Highest amount at a month-end .................................. $3,402,566 $5,000,000 Daily-average amount outstanding ............................. 260,322 799,068 $ 1,059,390 Weighted-average interest rate.................................... 1.86% 2.49% 2.34%
At December 31, 2018 Amount outstanding .................................................... $ 198,378 $4,200,000 $ 4,398,378 Weighted-average interest rate.................................... 1.68% 2.63% 2.58%
For the year ended December 31, 2018 Highest amount at a month-end .................................. $2,654,416 $4,200,000 Daily-average amount outstanding ............................. 261,200 69,465 $ 330,665 Weighted-average interest rate.................................... 1.49% 2.16% 1.63%
At December 31, 2017 Amount outstanding .................................................... $ 175,099 $ — $ 175,099 Weighted-average interest rate.................................... 0.92% — 0.92%
For the year ended December 31, 2017 Highest amount at a month-end .................................. $ 204,977 $1,500,000 Daily-average amount outstanding ............................. 188,459 16,164 $ 204,623 Weighted-average interest rate.................................... 0.69% 1.27% 0.74%
Short-term borrowings have a stated maturity of one year or less at the date the Company enters into the obligation. In general, short-term repurchase agreements outstanding at December 31, 2019 matured on the next business day following year-end.
At December 31, 2019, M&T Bank had lines of credit under formal agreements as follows:
(In thousands)
Outstanding borrowings ................................................................................................. $ 1,869 Unused............................................................................................................................ 32,578,083
At December 31, 2019, M&T Bank had borrowing facilities available with the FHLBs whereby M&T Bank could borrow up to approximately $18.2 billion. Additionally, M&T Bank had an available line of credit with the Federal Reserve Bank of New York totaling approximately $14.4 billion at December 31, 2019. M&T Bank is required to pledge loans and investment securities as collateral for these borrowing facilities.

145
Long-term borrowings were as follows: December 31, 2019 2018 (In thousands)
Senior notes of M&T: Variable rate due 2023 ....................................................................... $ 249,756 $ 249,688 3.55% due 2023.................................................................................. 520,454 506,021
Senior notes of M&T Bank: Variable rate due 2021 ....................................................................... 349,893 349,794 Variable rate due 2022 ....................................................................... 249,758 249,658 2.25% due 2019.................................................................................. — 645,801 2.05% due 2020.................................................................................. 749,254 737,793 2.10% due 2020.................................................................................. 749,864 741,965 2.625% due 2021................................................................................ 654,136 646,301 2.50% due 2022.................................................................................. 652,714 634,525 2.90% due 2025.................................................................................. 749,572 749,488
Advances from FHLB: Fixed rates .......................................................................................... 1,815 576,446
Agreements to repurchase securities....................................................... 101,679 409,154 Subordinated notes of M&T Bank:
Variable rate due 2020 ....................................................................... 409,361 409,361 Variable rate due 2021 ....................................................................... 500,000 500,000 3.40% due 2027.................................................................................. 514,353 481,692
Junior subordinated debentures of M&T associated with preferred capital securities:
Fixed rates: BSB Capital Trust I — 8.125%, due 2028 .................................... 15,728 15,705 Provident Trust I — 8.29%, due 2028........................................... 28,235 27,489 Southern Financial Statutory Trust I — 10.60%, due 2030 .......... 6,770 6,713
Variable rates: First Maryland Capital I — due 2027 ........................................... 147,871 147,333 First Maryland Capital II — due 2027 .......................................... 149,943 149,280 Allfirst Asset Trust — due 2029 ................................................... 96,930 96,785 BSB Capital Trust III — due 2033................................................ 15,464 15,464 Provident Statutory Trust III — due 2033..................................... 55,867 55,143 Southern Financial Capital Trust III — due 2033......................... 8,236 8,141
Other ....................................................................................................... 8,533 35,174 $ 6,986,186 $ 8,444,914
The senior notes of M&T were issued in July 2018. The variable rate notes pay interest quarterly at a rate that is indexed to the three-month LIBOR. The contractual interest rates for those notes were 2.62% at December 31, 2019 and 2.51% at December 31, 2018.

146
The variable rate senior notes of M&T Bank pay interest quarterly at rates that are indexed to the three-month LIBOR. The contractual interest rates for those notes ranged from 2.21% to 2.54% at December 31, 2019 and 2.76% to 3.25% at December 31, 2018. The weighted-average contractual interest rate was 2.34% at December 31, 2019 and 2.96% at December 31, 2018.
Long-term fixed rate advances from the FHLB had weighted-average contractual interest rates of 5.82% at December 31, 2019 and 2.06% at December 31, 2018. Advances from the FHLB outstanding at December 31, 2019 mature in 2029 and 2035 and are secured by residential real estate loans, commercial real estate loans and investment securities.
The remaining long-term agreement to repurchase securities at December 31, 2019 had a contractual interest rate of 4.29%. Agreements to repurchase securities outstanding at December 31, 2018 had contractual interest rates that ranged from 4.09% to 4.58%. The outstanding agreement at December 31, 2019 has a repurchase date in 2020, however, the contractual maturities of the underlying investment securities extend beyond such repurchase date. The agreement is subject to legally enforceable master netting arrangements, however, the Company has not offset any amounts related to the agreement in its consolidated financial statements. The Company posted collateral consisting primarily of government guaranteed mortgage-backed securities of $108 million and $428 million at December 31, 2019 and 2018, respectively.
The subordinated notes of M&T Bank are unsecured and are subordinate to the claims of its other creditors. The notes that mature in 2020 pay interest monthly at a rate that is indexed to the one-month LIBOR. The contractual interest rate was 3.02% and 3.72% at December 31, 2019 and 2018, respectively. The notes that mature in 2021 pay interest quarterly at a rate that is indexed to the three-month LIBOR. The contractual interest rate was 2.55% at December 31, 2019 and 3.38% at December 31, 2018.
The fixed and variable rate junior subordinated deferrable interest debentures of M&T (“Junior Subordinated Debentures”) are held by various trusts and were issued in connection with the issuance by those trusts of preferred capital securities (“Capital Securities”) and common securities (“Common Securities”). The proceeds from the issuances of the Capital Securities and the Common Securities were used by the trusts to purchase the Junior Subordinated Debentures. The Common Securities of each of those trusts are wholly owned by M&T and are the only class of each trust’s securities possessing general voting powers. The Capital Securities represent preferred undivided interests in the assets of the corresponding trust. Under the Federal Reserve Board’s risk-based capital guidelines, the Capital Securities qualify for inclusion in Tier 2 regulatory capital. The variable rate Junior Subordinated Debentures pay interest quarterly at rates that are indexed to the three-month LIBOR. Those rates ranged from 2.76% to 5.34% at December 31, 2019 and from 3.39% to 5.69% at December 31, 2018. The weighted-average variable rates payable on those Junior Subordinated Debentures were 3.37% at December 31, 2019 and 3.94% at December 31, 2018.
Holders of the Capital Securities receive preferential cumulative cash distributions unless M&T exercises its right to extend the payment of interest on the Junior Subordinated Debentures as allowed by the terms of each such debenture, in which case payment of distributions on the respective Capital Securities will be deferred for comparable periods. During an extended interest period, M&T may not pay dividends or distributions on, or repurchase, redeem or acquire any shares of its capital stock. In general, the agreements governing the Capital Securities, in the aggregate, provide a full, irrevocable and unconditional guarantee by M&T of the payment of distributions on, the redemption of, and any liquidation distribution with respect to the Capital Securities. The obligations under such guarantee and the Capital Securities are subordinate and junior in right of payment to all senior indebtedness of M&T.
The Capital Securities will remain outstanding until the Junior Subordinated Debentures are repaid at maturity, are redeemed prior to maturity or are distributed in liquidation to the trusts. The Capital Securities are mandatorily redeemable in whole, but not in part, upon repayment at the stated
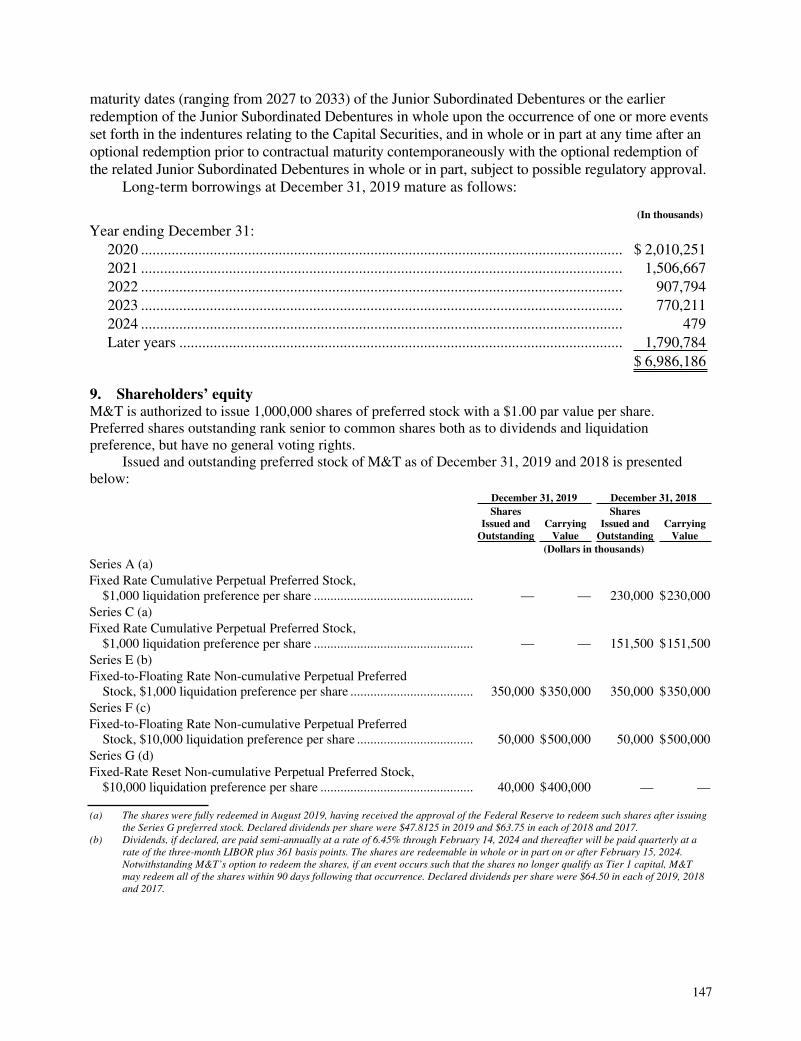
147
maturity dates (ranging from 2027 to 2033) of the Junior Subordinated Debentures or the earlier redemption of the Junior Subordinated Debentures in whole upon the occurrence of one or more events set forth in the indentures relating to the Capital Securities, and in whole or in part at any time after an optional redemption prior to contractual maturity contemporaneously with the optional redemption of the related Junior Subordinated Debentures in whole or in part, subject to possible regulatory approval.
Long-term borrowings at December 31, 2019 mature as follows:
(In thousands)
Year ending December 31: 2020 .............................................................................................................................. $ 2,010,251 2021 .............................................................................................................................. 1,506,667 2022 .............................................................................................................................. 907,794 2023 .............................................................................................................................. 770,211 2024 .............................................................................................................................. 479 Later years .................................................................................................................... 1,790,784
$ 6,986,186
9. Shareholders’ equityM&T is authorized to issue 1,000,000 shares of preferred stock with a $1.00 par value per share. Preferred shares outstanding rank senior to common shares both as to dividends and liquidation preference, but have no general voting rights.
Issued and outstanding preferred stock of M&T as of December 31, 2019 and 2018 is presented below: December 31, 2019 December 31, 2018
SharesIssued and
Outstanding Carrying
Value
SharesIssued and
Outstanding Carrying
Value (Dollars in thousands)
Series A (a) Fixed Rate Cumulative Perpetual Preferred Stock, $1,000 liquidation preference per share ................................................ — — 230,000 $230,000 Series C (a) Fixed Rate Cumulative Perpetual Preferred Stock, $1,000 liquidation preference per share ................................................ — — 151,500 $151,500 Series E (b) Fixed-to-Floating Rate Non-cumulative Perpetual Preferred Stock, $1,000 liquidation preference per share ..................................... 350,000 $350,000 350,000 $350,000 Series F (c) Fixed-to-Floating Rate Non-cumulative Perpetual Preferred Stock, $10,000 liquidation preference per share ................................... 50,000 $500,000 50,000 $500,000 Series G (d) Fixed-Rate Reset Non-cumulative Perpetual Preferred Stock, $10,000 liquidation preference per share .............................................. 40,000 $400,000 — —
(a) The shares were fully redeemed in August 2019, having received the approval of the Federal Reserve to redeem such shares after issuing the Series G preferred stock. Declared dividends per share were $47.8125 in 2019 and $63.75 in each of 2018 and 2017.
(b) Dividends, if declared, are paid semi-annually at a rate of 6.45% through February 14, 2024 and thereafter will be paid quarterly at a rate of the three-month LIBOR plus 361 basis points. The shares are redeemable in whole or in part on or after February 15, 2024. Notwithstanding M&T’s option to redeem the shares, if an event occurs such that the shares no longer qualify as Tier 1 capital, M&T may redeem all of the shares within 90 days following that occurrence. Declared dividends per share were $64.50 in each of 2019, 2018 and 2017.

148
(c) Dividends, if declared, are paid semi-annually at a rate of 5.125% through October 31, 2026 and thereafter will be paid quarterly at a rate of the three-month LIBOR plus 352 basis points. The shares are redeemable in whole or in part on or after November 1, 2026. Notwithstanding M&T’s option to redeem the shares, if an event occurs such that the shares no longer qualify as Tier 1 capital, M&T may redeem all of the shares within 90 days following that occurrence. Declared dividends per share were $512.50 in each of 2019, 2018 and 2017.
(d) Dividends, if declared, are paid semi-annually at a rate of 5.0% through July 31, 2024 and thereafter will be paid semiannually at a rate of the five-year U.S. Treasury rate plus 3.174%. The shares are redeemable in whole or in part on or after August 1, 2024. Notwithstanding M&T’s option to redeem the shares, if an event occurs such that the shares no longer qualify as Tier 1 capital, M&T may redeem all of the shares within 90 days following that occurrence. Declared dividends per share were $125.694 in 2019.
10. Revenue from contracts with customersEffective January 1, 2018 the Company adopted amended accounting and disclosure guidance for revenue from contracts with customers under the modified retrospective approach. A significant amount of the Company’s revenues are derived from net interest income on financial assets and liabilities, mortgage banking revenues, trading account and foreign exchange gains, investment securities gains, loan and letter of credit fees, income from bank-owned life insurance, and certain other revenues that are generally excluded from the scope of the amended guidance for revenue from contracts with customers. As a result of the adoption, the Company began reporting credit card interchange revenue net of $25 million and $14 million of rewards in other revenues from operations for the years ended December 31, 2019 and 2018, respectively. Credit card rewards expense of $13 million for the year ended December 31, 2017 was included in other costs of operations. The adjustment to beginning retained earnings as well as the impact of any changes in timing of revenue recognition of noninterest income items within the scope of the guidance was not material to the Company’s consolidated financial position at December 31, 2017 or its consolidated results of operations for the year ended December 31, 2018.
For noninterest income revenue streams, the Company recognizes the expected amount of consideration as revenue when the performance obligations related to the services under the terms of a contract are satisfied. The Company’s contracts generally do not contain terms that necessitate significant judgment to determine the amount of revenue to recognize. The Company generally charges customer accounts or otherwise bills customers upon completion of its services. Typically the Company’s contracts with customers have a duration of one year or less and payment for services is received at least annually, but oftentimes more frequently as services are provided. At December 31, 2019 and 2018, the Company had $62 million and $56 million, respectively, of uncollected amounts receivable related to recognized revenue from the sources in the accompanying tables. Such amounts are classified in accrued interest and other assets in the Company’s consolidated balance sheet. In certain situations the Company is paid in advance of providing services and defers the recognition of revenue until its service obligation is satisfied. At each of December 31, 2019 and 2018, the Company had deferred revenue of $43 million related to the sources in the accompanying tables and recorded such amounts in accrued interest and other liabilities on its consolidated balance sheet. The following tables summarize sources of the Company’s noninterest income during 2019 and 2018 that are subject to the amended guidance.

149
Business Banking
Commercial Banking
Commercial Real Estate
Discretionary Portfolio
Residential Mortgage Banking
Retail Banking
All Other Total
Year Ended December 31, 2019 (In thousands)
Classification in consolidated statement of income Service charges on deposit accounts ... $60,690 93,044 9,828 — 4 263,659 5,753 $ 432,978 Trust income........................................ 31 963 — — — — 571,614 572,608 Brokerage services income.................. — — — — — — 48,922 48,922 Other revenues from operations:
Merchant discount and credit card fees...................................... 36,844 52,161 2,516 — — 12,140 3,381 107,042 Other .............................................. — 7,498 8,615 1,776 3,492 36,144 34,088 91,613
$97,565 153,666 20,959 1,776 3,496 311,943 663,758 $1,253,163
Year Ended December 31, 2018
Classification in consolidated statement of income Service charges on deposit accounts ... $62,323 96,407 9,870 — 10 254,590 6,137 $ 429,337 Trust income........................................ 9 917 — — — — 536,659 537,585 Brokerage services income.................. — — — — — — 51,069 51,069 Other revenues from operations:
Merchant discount and credit card fees...................................... 34,557 52,051 2,213 — — 14,924 2,208 105,953 Other .............................................. — 8,796 7,259 1,738 3,814 38,529 30,233 90,369
$96,889 158,171 19,342 1,738 3,824 308,043 626,306 $1,214,313
Service charges on deposit accounts include fees deducted directly from customer account balances, such as account maintenance, insufficient funds and other transactional service charges, and also include debit card interchange revenue resulting from customer initiated transactions. Account maintenance charges are generally recognized as revenue on a monthly basis, whereas other fees are recognized after the respective service is provided.
Trust income includes fees related to the Institutional Client Services (“ICS”) business and the Wealth Advisory Services (“WAS”) business. Revenues from the ICS business are largely derived from a variety of trustee, agency, investment, cash management and administrative services, whereas revenues from the WAS business are mainly derived from asset management, fiduciary services, and family office services. Trust fees may be billed in arrears or in advance and are recognized as revenues as the Company’s performance obligations are satisfied. Certain fees are based on a percentage of assets invested or under management and are recognized as the service is performed and constraints regarding the uncertainty of the amount of fees are resolved.
Brokerage services income includes revenues from the sale of mutual funds and annuities and securities brokerage fees. Such revenues are generally recognized at the time of transaction execution. Mutual fund and other distribution fees are recognized upon initial placement of customer funds as well as in future periods as such customers continue to hold amounts in those mutual funds.
Other revenues from operations include merchant discount and credit card fees such as interchange fees and merchant discount fees that are generally recognized when the cardholder’s transaction is approved and settled. Beginning in 2018, credit card rewards accrued to cardholders are recognized as a reduction of interchange revenue. Also included in other revenues from operations are insurance commissions, ATM surcharge fees, and advisory fees. Insurance commissions are recognized at the

150
time the insurance policy is executed with the customer. Insurance renewal commissions are recognized upon subsequent renewal of the policy. ATM surcharge fees are included in revenue at the time of the respective ATM transaction. Advisory fees are generally recognized at the conclusion of the advisory engagement when the Company has satisfied its service obligation.
11. Stock-based compensation plansStock-based compensation expense was $76 million in 2019, $66 million in 2018 and $61 million in 2017. The Company recognized income tax benefits related to stock-based compensation of $19 million in 2019, $24 million in 2018 and $35 million in 2017.
The Company’s equity incentive compensation plan allows for the issuance of various forms of stock-based compensation, including stock options, restricted stock and restricted stock units, including performance-based awards. At December 31, 2019 and 2018, respectively, there were 3,742,478 and 2,833,428 shares available for future grant under the Company’s equity incentive compensation plan.
Stock awardsStock awards are comprised of restricted stock and restricted stock units. Stock awards granted since 2014 generally vest over three years. Stock awards granted prior to 2014 vested over four years. A portion of stock awards granted after 2013 require a performance condition to be met before such awards vest. The Company may issue shares from treasury stock to the extent available or issue new shares. The number of restricted shares issued was 181,939 in 2017 with a weighted-average grant date fair value of $30 million. There were no restricted shares issued in 2019 or 2018. The number of restricted stock units issued was 448,487 in 2019, 348,512 in 2018 and 235,983 in 2017, with a weighted-average grant date fair value of $74 million, $66 million and $38 million, respectively. Unrecognized compensation expense associated with restricted stock units was $22 million as of December 31, 2019 and is expected to be recognized over a weighted-average period of approximately one year.
A summary of restricted stock and restricted stock unit activity follows:
RestrictedStock UnitsOutstanding
Weighted-Average
Grant Price
RestrictedStock
Outstanding
Weighted-Average
Grant Price
Unvested at January 1, 2019.................................... 556,875 $ 170.07 179,439 $ 144.18 Granted .................................................................... 448,487 164.63 — — Vested ...................................................................... (298,243) 157.90 (113,894) 133.69 Cancelled ................................................................. (15,892) 173.48 (1,954) 161.42 Unvested at December 31, 2019.............................. 691,227 $ 171.72 63,591 $ 162.45
Stock option awardsStock options issued generally vest over three years and are exercisable over terms not exceeding ten years and one day. The Company used an option pricing model to estimate the grant date present value of stock options granted. The Company granted 164,244 and 116,852 stock options in 2019 and 2018, respectively. Stock options granted in 2017 were not significant. The fair value of options granted in each of 2019, 2018 and 2017 was not material.

151
A summary of stock option activity follows:
Weighted-Average
StockOptions
Outstanding Exercise
Price Life
(In Years)
AggregateIntrinsic Value(In thousands)
Outstanding at January 1, 2019 ............................... 220,591 $ 157.98 Granted .................................................................... 164,244 164.54 Exercised ................................................................. (76,181) 122.55 Expired..................................................................... (3,202) 176.41 Outstanding at December 31, 2019 ......................... 305,452 $ 170.15 8.0 $ 2,301
Exercisable at December 31, 2019 .......................... 66,076 $ 159.96 5.1 $ 1,454
For 2019, 2018 and 2017, M&T received $9 million, $60 million and $72 million, respectively, in cash and realized tax benefits from the exercise of stock options of $1 million, $3 million and $10 million, respectively. The intrinsic value of stock options exercised during those periods was $3 million, $16 million and $31 million, respectively. As of December 31, 2019, the amount of unrecognized compensation cost related to non-vested stock options was not material. The total grant date fair value of stock options vested during 2019, 2018 and 2017 was not material. Upon the exercise of stock options, the Company may issue shares from treasury stock to the extent available or issue new shares.
Stock purchase planThe stock purchase plan provides eligible employees of the Company with the right to purchase shares of M&T common stock at a discount through accumulated payroll deductions. In connection with the employee stock purchase plan, shares of M&T common stock issued were 71,676 in 2019, 58,167 in 2018 and 66,504 in 2017. As of December 31, 2019, there were 2,310,751 shares available for issuance under the plan. M&T received cash for shares purchased through the employee stock purchase plan of $11 million in 2019 and $10 million in each of 2018 and 2017. Compensation expense recognized for the stock purchase plan was not significant in 2019, 2018 or 2017.
Deferred bonus planThe Company provided a deferred bonus plan pursuant to which eligible employees could elect to defer all or a portion of their annual incentive compensation awards and allocate such awards to several investment options, including M&T common stock. Participants could elect the timing of distributions from the plan. Such distributions are payable in cash with the exception of balances allocated to M&T common stock which are distributable in the form of M&T common stock. Shares of M&T common stock distributable pursuant to the terms of the deferred bonus plan were 16,491 and 18,292 at December 31, 2019 and 2018, respectively. The obligation to issue shares is included in “common stock issuable” in the consolidated balance sheet.
Directors’ stock planThe Company maintains a compensation plan for non-employee members of the Company’s boards of directors and directors advisory councils that allows such members to receive all or a portion of their compensation in shares of M&T common stock. Through December 31, 2019, 282,532 shares had been issued in connection with the directors’ stock plan.
Through acquisitions, the Company assumed obligations to issue shares of M&T common stock related to deferred directors compensation plans. Shares of common stock issuable under such plans

152
were 5,043 and 6,271 at December 31, 2019 and 2018, respectively. The obligation to issue shares is included in “common stock issuable” in the consolidated balance sheet.
12. Pension plans and other postretirement benefitsThe Company provides defined benefit pension and other postretirement benefits (including health care and life insurance benefits) to qualified retired employees. The Company uses a December 31 measurement date for all of its plans.
Net periodic pension expense for defined benefit plans consisted of the following:
Year Ended December 31 2019 2018 2017 (In thousands)
Service cost ......................................................................... $ 17,294 $ 20,346 $ 20,193 Interest cost on benefit obligation ....................................... 81,579 74,704 79,270 Expected return on plan assets ............................................ (122,139) (123,127) (108,524)Amortization of prior service cost....................................... 557 557 557 Recognized net actuarial loss .............................................. 21,992 43,793 29,263 Net periodic pension cost (benefit) ..................................... $ (717) $ 16,273 $ 20,759
Net other postretirement benefits expense for defined benefit plans consisted of the following:
Year Ended December 31 2019 2018 2017 (In thousands)
Service cost ......................................................................... $ 859 $ 938 $ 1,172 Interest cost on benefit obligation ....................................... 2,344 2,293 3,716 Amortization of prior service credit .................................... (4,730) (4,729) (1,359)Recognized net actuarial gain ............................................. (1,247) (826) (988)Net other postretirement benefits cost (benefit).................. $ (2,774) $ (2,324) $ 2,541
Service cost is reflected in salaries and employee benefits expense. The other components of net periodic benefit expense are reflected in other costs of operations.

153
Data relating to the funding position of the defined benefit plans were as follows:
Pension Benefits Other
Postretirement Benefits 2019 2018 2019 2018 (In thousands)
Change in benefit obligation: Benefit obligation at beginning of year .................. $1,949,613 $2,188,736 $ 59,991 $ 68,637 Service cost ............................................................. 17,294 20,346 859 938 Interest cost ............................................................. 81,579 74,704 2,344 2,293 Plan participants’ contributions .............................. — — 2,749 2,974 Actuarial (gain) loss................................................ 298,713 (228,897) (687) (4,758)Medicare Part D reimbursement............................. — — 370 508 Benefits paid ........................................................... (99,870) (105,276) (9,134) (10,601)Benefit obligation at end of year ............................ 2,247,329 1,949,613 56,492 59,991
Change in plan assets: Fair value of plan assets at beginning of year ...................................................................... 1,833,833 2,014,891 — — Actual return on plan assets.................................... 293,546 (90,657) — — Employer contributions .......................................... 10,431 14,875 6,015 7,119 Plan participants’ contributions .............................. — — 2,749 2,974 Medicare Part D reimbursement............................. — — 370 508 Benefits paid ........................................................... (99,870) (105,276) (9,134) (10,601)Fair value of plan assets at end of year................... 2,037,940 1,833,833 — —
Funded status ............................................................... $ (209,389) $ (115,780) $(56,492) $(59,991)
Accrued liabilities recognized in the consolidated balance sheet ....................................... $ (209,389) $ (115,780) $(56,492) $(59,991)
Amounts recognized in accumulated other comprehensive income (“AOCI”) were:
Net loss (gain)......................................................... $ 507,029 $ 401,716 $(17,308) $(17,868)Net prior service cost (credit) ................................. 1,834 2,391 (27,007) (31,737)Pre-tax adjustment to AOCI ................................... 508,863 404,107 (44,315) (49,605)Taxes....................................................................... (133,779) (106,240) 11,650 13,041 Net adjustment to AOCI ......................................... $ 375,084 $ 297,867 $(32,665) $(36,564)
The Company has an unfunded supplemental pension plan for certain key executives and others. The projected benefit obligation and accumulated benefit obligation included in the preceding data related to such plan were $154 million as of December 31, 2019 and $143 million as of December 31, 2018.
The accumulated benefit obligation for all defined benefit pension plans was $2.2 billion and $1.9 billion at December 31, 2019 and 2018, respectively.
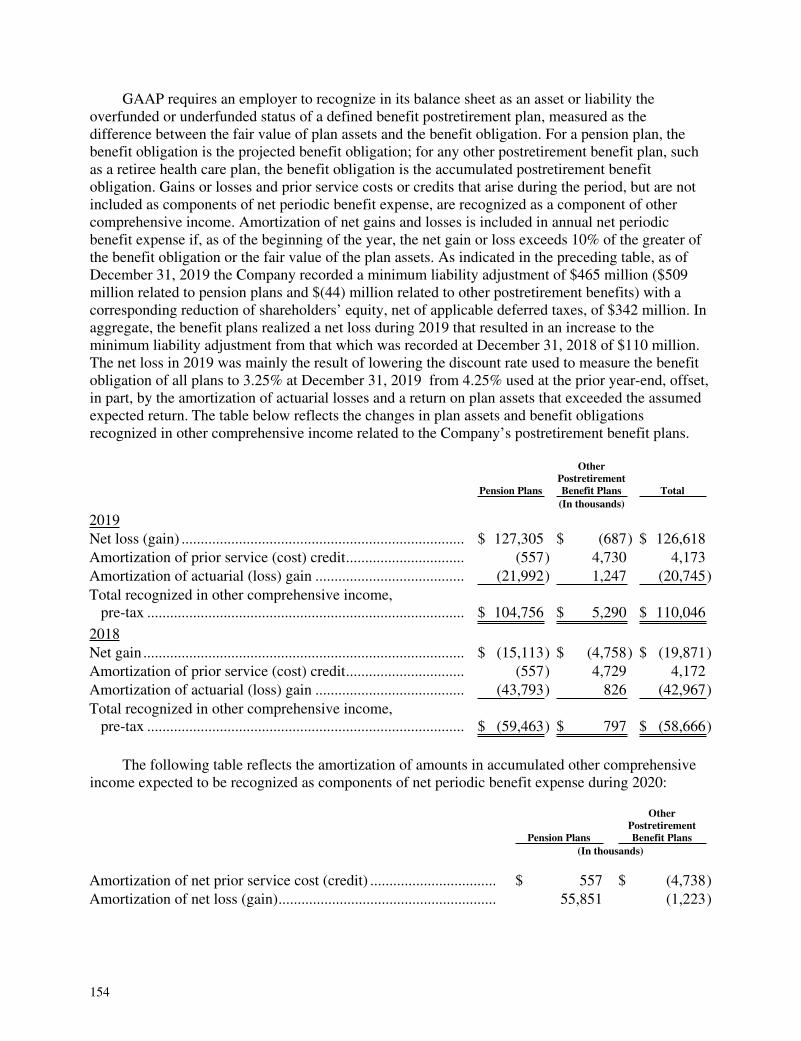
154
GAAP requires an employer to recognize in its balance sheet as an asset or liability the overfunded or underfunded status of a defined benefit postretirement plan, measured as the difference between the fair value of plan assets and the benefit obligation. For a pension plan, the benefit obligation is the projected benefit obligation; for any other postretirement benefit plan, such as a retiree health care plan, the benefit obligation is the accumulated postretirement benefit obligation. Gains or losses and prior service costs or credits that arise during the period, but are not included as components of net periodic benefit expense, are recognized as a component of other comprehensive income. Amortization of net gains and losses is included in annual net periodic benefit expense if, as of the beginning of the year, the net gain or loss exceeds 10% of the greater of the benefit obligation or the fair value of the plan assets. As indicated in the preceding table, as of December 31, 2019 the Company recorded a minimum liability adjustment of $465 million ($509 million related to pension plans and $(44) million related to other postretirement benefits) with a corresponding reduction of shareholders’ equity, net of applicable deferred taxes, of $342 million. In aggregate, the benefit plans realized a net loss during 2019 that resulted in an increase to the minimum liability adjustment from that which was recorded at December 31, 2018 of $110 million. The net loss in 2019 was mainly the result of lowering the discount rate used to measure the benefit obligation of all plans to 3.25% at December 31, 2019 from 4.25% used at the prior year-end, offset, in part, by the amortization of actuarial losses and a return on plan assets that exceeded the assumed expected return. The table below reflects the changes in plan assets and benefit obligations recognized in other comprehensive income related to the Company’s postretirement benefit plans.
Pension Plans
OtherPostretirementBenefit Plans Total
(In thousands)
2019 Net loss (gain) .......................................................................... $ 127,305 $ (687) $ 126,618 Amortization of prior service (cost) credit............................... (557) 4,730 4,173 Amortization of actuarial (loss) gain ....................................... (21,992) 1,247 (20,745)Total recognized in other comprehensive income, pre-tax ................................................................................... $ 104,756 $ 5,290 $ 110,046
2018 Net gain .................................................................................... $ (15,113) $ (4,758) $ (19,871)Amortization of prior service (cost) credit............................... (557) 4,729 4,172 Amortization of actuarial (loss) gain ....................................... (43,793) 826 (42,967)Total recognized in other comprehensive income, pre-tax ................................................................................... $ (59,463) $ 797 $ (58,666)
The following table reflects the amortization of amounts in accumulated other comprehensive income expected to be recognized as components of net periodic benefit expense during 2020:
Pension Plans
OtherPostretirementBenefit Plans
(In thousands)
Amortization of net prior service cost (credit) ................................. $ 557 $ (4,738)Amortization of net loss (gain)......................................................... 55,851 (1,223)
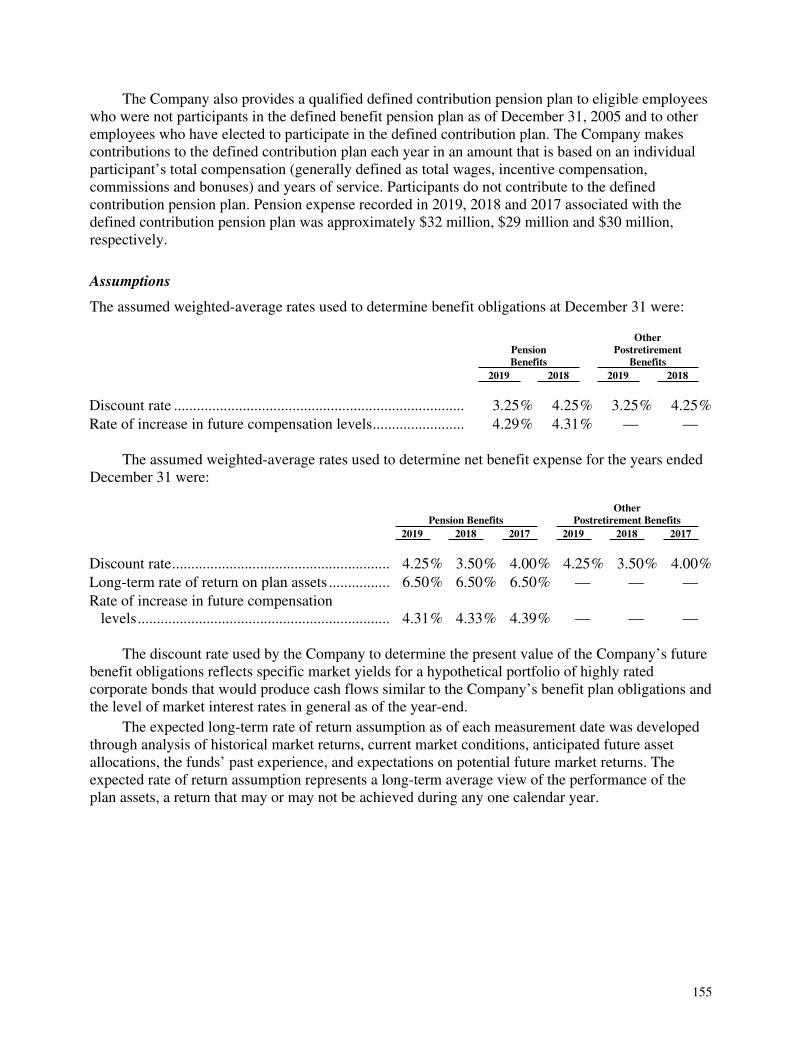
155
The Company also provides a qualified defined contribution pension plan to eligible employees who were not participants in the defined benefit pension plan as of December 31, 2005 and to other employees who have elected to participate in the defined contribution plan. The Company makes contributions to the defined contribution plan each year in an amount that is based on an individual participant’s total compensation (generally defined as total wages, incentive compensation, commissions and bonuses) and years of service. Participants do not contribute to the defined contribution pension plan. Pension expense recorded in 2019, 2018 and 2017 associated with the defined contribution pension plan was approximately $32 million, $29 million and $30 million, respectively.
Assumptions
The assumed weighted-average rates used to determine benefit obligations at December 31 were:
PensionBenefits
OtherPostretirement
Benefits 2019 2018 2019 2018
Discount rate ............................................................................ 3.25% 4.25% 3.25% 4.25%Rate of increase in future compensation levels........................ 4.29% 4.31% — —
The assumed weighted-average rates used to determine net benefit expense for the years ended December 31 were:
Pension Benefits Other
Postretirement Benefits 2019 2018 2017 2019 2018 2017
Discount rate......................................................... 4.25% 3.50% 4.00% 4.25% 3.50% 4.00%Long-term rate of return on plan assets ................ 6.50% 6.50% 6.50% — — — Rate of increase in future compensation levels.................................................................. 4.31% 4.33% 4.39% — — —
The discount rate used by the Company to determine the present value of the Company’s future benefit obligations reflects specific market yields for a hypothetical portfolio of highly rated corporate bonds that would produce cash flows similar to the Company’s benefit plan obligations and the level of market interest rates in general as of the year-end.
The expected long-term rate of return assumption as of each measurement date was developed through analysis of historical market returns, current market conditions, anticipated future asset allocations, the funds’ past experience, and expectations on potential future market returns. The expected rate of return assumption represents a long-term average view of the performance of the plan assets, a return that may or may not be achieved during any one calendar year.

156
The Company’s defined benefit pension plan is sensitive to the long-term rate of return on plan assets and the discount rate. To demonstrate the sensitivity of pension expense to changes in these assumptions, with all other assumptions held constant, 25 basis point increases in: the rate of return on plan assets would have resulted in a decrease in pension expense of approximately $5 million; and the discount rate would have resulted in a decrease in pension expense of approximately $8 million. Decreases of 25 basis points in those assumptions would have resulted in similar changes in amount, but in the opposite direction from the changes presented in the preceding sentence. Additionally, an increase of 25 basis points in the discount rate would have decreased the benefit obligation by$75 million and a decrease of 25 basis points in the discount rate would have increased the benefit obligation by $79 million at December 31, 2019.
For measurement of other postretirement benefits, a 6.25% annual rate of increase in the per capita cost of covered health care benefits was assumed for 2020. The rate was assumed to decrease to 5.00% over nine years. A one-percentage point change in assumed health care cost trend rates would have had the following effects:
+1% -1% (In thousands)
Increase (decrease) in: Service and interest cost.......................................................................................... $ 49 $ (45)Accumulated postretirement benefit obligation...................................................... 834 (747)
Plan assets
The Company’s policy is to invest the pension plan assets in a prudent manner for the purpose of providing benefit payments to participants and mitigating reasonable expenses of administration. The Company’s investment strategy is designed to provide a total return that, over the long-term, places an emphasis on the preservation of capital. The strategy attempts to maximize investment returns on assets at a level of risk deemed appropriate by the Company while complying with applicable regulations and laws. The investment strategy utilizes asset diversification as a principal determinant for establishing an appropriate risk profile while emphasizing total return realized from capital appreciation, dividends and interest income. The target allocations for plan assets are generally 25 to 60 percent equity securities, 10 to 65 percent debt securities, and 5 to 60 percent money-market investments/cash equivalents and other investments, although holdings could be more or less than these general guidelines based on market conditions at the time and actions taken or recommended by the investment managers providing advice to the Company. Assets are managed by a combination of internal and external investment managers. Equity securities may include investments in domestic and international equities, through individual securities, mutual funds and exchange-traded funds. Debt securities may include investments in corporate bonds of companies from diversified industries, mortgage-backed securities guaranteed by government agencies and U.S. Treasury securities, through individual securities and mutual funds. Additionally, the Company’s defined benefit pension plan held $439 million (22% of total assets) of real estate funds, private investments, hedge funds and other investments at December 31, 2019. Returns on invested assets are periodically compared with target market indices for each asset type to aid management in evaluating such returns. Furthermore, management regularly reviews the investment policy and may, if deemed appropriate, make changes to the target allocations noted above.

157
The fair values of the Company’s pension plan assets at December 31, 2019 and 2018, by asset category, were as follows:
Fair Value Measurement of Plan Assets At December 31, 2019
Total
Quoted Pricesin ActiveMarkets
for Identical Assets(Level 1)
SignificantObservable
Inputs(Level 2)
SignificantUnobservable
Inputs(Level 3)
(In thousands)
Asset category: Money-market investments ..................................... $ 38,461 $ 33,870 $ 4,591 $ — Equity securities:
M&T ................................................................... 148,603 148,603 — — Domestic(a) ........................................................ 219,663 219,663 — — International(b) ................................................... 10,476 10,476 — — Mutual funds:
Domestic(a).................................................... 238,872 238,872 — — International(b) .............................................. 381,433 381,433 — —
999,047 999,047 — — Debt securities:
Corporate(c)........................................................ 112,783 — 112,783 — Government ........................................................ 190,679 — 190,679 — International........................................................ 6,648 — 6,648 — Mutual funds:
Domestic(d) ................................................... 249,075 249,075 — — 559,185 249,075 310,110 — Other:
Diversified mutual fund...................................... 86,980 86,980 — — Real estate partnerships ...................................... 21,905 3,939 — 17,966 Private equity / debt............................................ 87,966 — — 87,966 Hedge funds........................................................ 231,807 116,029 — 115,778 Guaranteed deposit fund..................................... 10,527 — — 10,527
439,185 206,948 — 232,237 Total(e) .................................................................... $2,035,878 $ 1,488,940 $314,701 $ 232,237

158
Fair Value Measurement of Plan Assets At December 31, 2018
Total
Quoted Pricesin ActiveMarkets
for Identical Assets(Level 1)
SignificantObservable
Inputs(Level 2)
SignificantUnobservable
Inputs(Level 3)
(In thousands)
Asset category: Money-market investments....................................... $ 23,049 $ 10,794 $ 12,255 $ — Equity securities:
M&T..................................................................... 125,299 125,299 — — Domestic(a) .......................................................... 191,640 191,640 — — International(b)..................................................... 7,752 7,752 — — Mutual funds:
Domestic(a) ..................................................... 216,523 216,523 — — International(b) ................................................ 316,923 316,923 — —
858,137 858,137 — — Debt securities:
Corporate(c) ......................................................... 103,672 — 103,672 — Government .......................................................... 182,034 — 182,034 — International ......................................................... 2,140 — 2,140 — Mutual funds:
Domestic(d) ..................................................... 280,902 280,902 — — International..................................................... 20,661 20,661 — —
589,409 301,563 287,846 — Other:
Diversified mutual fund ....................................... 74,446 74,446 — — Real estate partnerships ........................................ 11,807 2,791 — 9,016 Private equity / debt.............................................. 63,699 — — 63,699 Hedge funds.......................................................... 200,811 125,309 — 75,502 Guaranteed deposit fund....................................... 10,415 — — 10,415
361,178 202,546 — 158,632 Total(e)...................................................................... $1,831,773 $ 1,373,040 $300,101 $ 158,632
(a) This category is mainly comprised of equities of companies primarily within the small-cap, mid-cap and large-cap sectors of the U.S. economy and range across diverse industries.
(b) This category is comprised of equities in companies primarily within the mid-cap and large-cap sectors of international markets mainly in developed and emerging markets in Europe and the Pacific Rim.
(c) This category represents investment grade bonds of U.S. issuers from diverse industries.(d) Approximately 80% of the mutual funds were invested in investment grade bonds and 20% in
high-yielding bonds at December 31, 2019. Approximately 77% of the mutual funds were invested in investment grade bonds and 23% in high-yielding bonds at December 31, 2018. The holdings within the funds were spread across diverse industries.
(e) Excludes dividends and interest receivable totaling $2 million at each of December 31, 2019 and 2018.
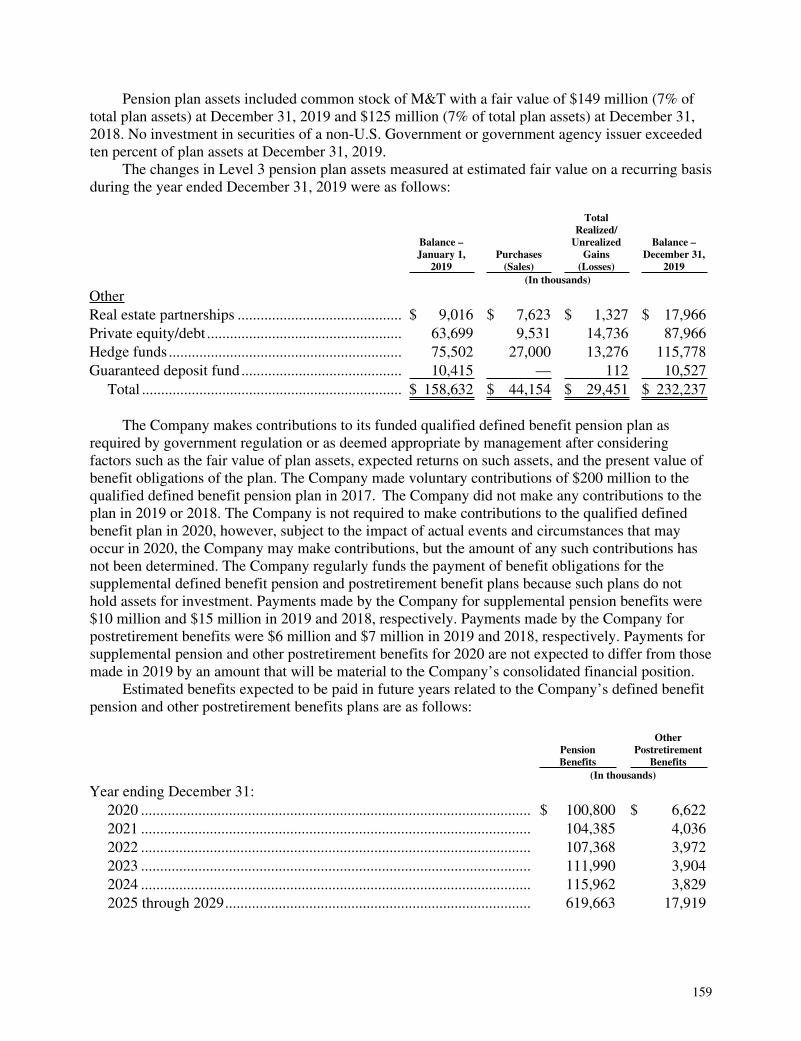
159
Pension plan assets included common stock of M&T with a fair value of $149 million (7% of total plan assets) at December 31, 2019 and $125 million (7% of total plan assets) at December 31, 2018. No investment in securities of a non-U.S. Government or government agency issuer exceeded ten percent of plan assets at December 31, 2019.
The changes in Level 3 pension plan assets measured at estimated fair value on a recurring basis during the year ended December 31, 2019 were as follows:
Balance –January 1,
2019 Purchases
(Sales)
TotalRealized/
UnrealizedGains
(Losses)
Balance –December 31,
2019 (In thousands)
Other Real estate partnerships ........................................... $ 9,016 $ 7,623 $ 1,327 $ 17,966 Private equity/debt ................................................... 63,699 9,531 14,736 87,966 Hedge funds ............................................................. 75,502 27,000 13,276 115,778 Guaranteed deposit fund.......................................... 10,415 — 112 10,527
Total .................................................................... $ 158,632 $ 44,154 $ 29,451 $ 232,237
The Company makes contributions to its funded qualified defined benefit pension plan as required by government regulation or as deemed appropriate by management after considering factors such as the fair value of plan assets, expected returns on such assets, and the present value of benefit obligations of the plan. The Company made voluntary contributions of $200 million to the qualified defined benefit pension plan in 2017. The Company did not make any contributions to the plan in 2019 or 2018. The Company is not required to make contributions to the qualified defined benefit plan in 2020, however, subject to the impact of actual events and circumstances that may occur in 2020, the Company may make contributions, but the amount of any such contributions has not been determined. The Company regularly funds the payment of benefit obligations for the supplemental defined benefit pension and postretirement benefit plans because such plans do not hold assets for investment. Payments made by the Company for supplemental pension benefits were $10 million and $15 million in 2019 and 2018, respectively. Payments made by the Company for postretirement benefits were $6 million and $7 million in 2019 and 2018, respectively. Payments for supplemental pension and other postretirement benefits for 2020 are not expected to differ from those made in 2019 by an amount that will be material to the Company’s consolidated financial position.
Estimated benefits expected to be paid in future years related to the Company’s defined benefit pension and other postretirement benefits plans are as follows:
PensionBenefits
OtherPostretirement
Benefits (In thousands)
Year ending December 31: 2020 ...................................................................................................... $ 100,800 $ 6,622 2021 ...................................................................................................... 104,385 4,036 2022 ...................................................................................................... 107,368 3,972 2023 ...................................................................................................... 111,990 3,904 2024 ...................................................................................................... 115,962 3,829 2025 through 2029................................................................................ 619,663 17,919
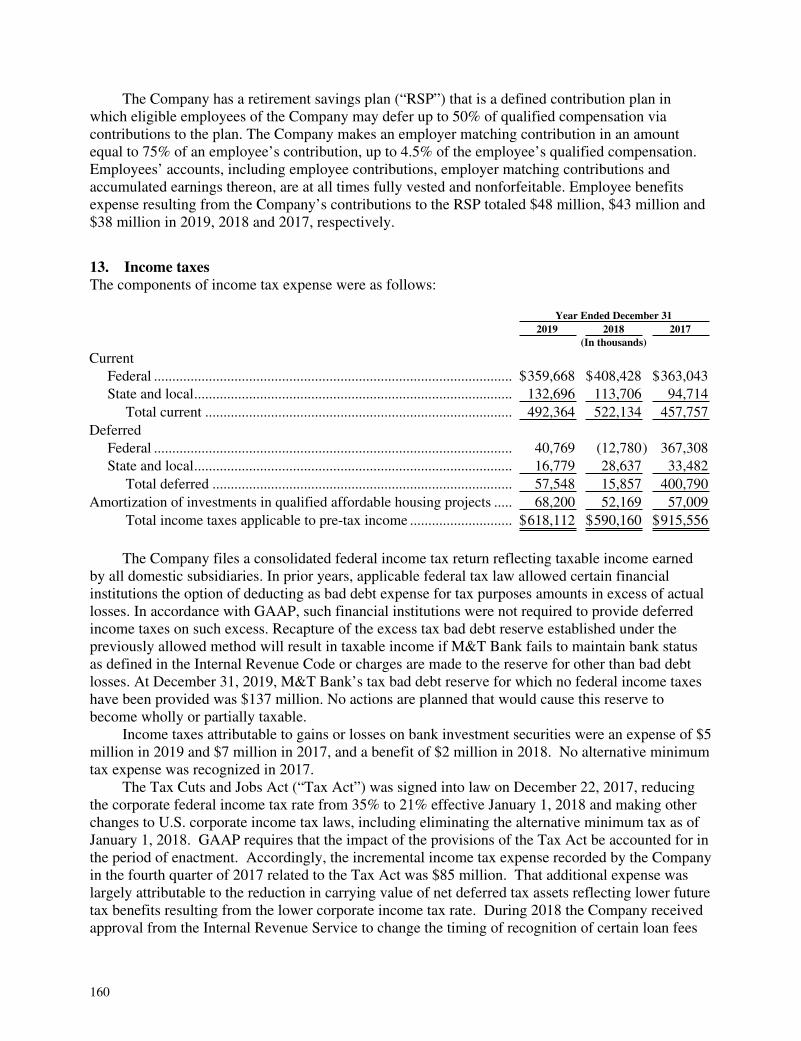
160
The Company has a retirement savings plan (“RSP”) that is a defined contribution plan in which eligible employees of the Company may defer up to 50% of qualified compensation via contributions to the plan. The Company makes an employer matching contribution in an amount equal to 75% of an employee’s contribution, up to 4.5% of the employee’s qualified compensation. Employees’ accounts, including employee contributions, employer matching contributions and accumulated earnings thereon, are at all times fully vested and nonforfeitable. Employee benefits expense resulting from the Company’s contributions to the RSP totaled $48 million, $43 million and $38 million in 2019, 2018 and 2017, respectively.
13. Income taxesThe components of income tax expense were as follows:
Year Ended December 31 2019 2018 2017 (In thousands)
Current Federal .................................................................................................. $359,668 $408,428 $363,043 State and local....................................................................................... 132,696 113,706 94,714
Total current .................................................................................... 492,364 522,134 457,757 Deferred
Federal .................................................................................................. 40,769 (12,780) 367,308 State and local....................................................................................... 16,779 28,637 33,482
Total deferred .................................................................................. 57,548 15,857 400,790 Amortization of investments in qualified affordable housing projects ..... 68,200 52,169 57,009
Total income taxes applicable to pre-tax income ............................ $618,112 $590,160 $915,556
The Company files a consolidated federal income tax return reflecting taxable income earned by all domestic subsidiaries. In prior years, applicable federal tax law allowed certain financial institutions the option of deducting as bad debt expense for tax purposes amounts in excess of actual losses. In accordance with GAAP, such financial institutions were not required to provide deferred income taxes on such excess. Recapture of the excess tax bad debt reserve established under the previously allowed method will result in taxable income if M&T Bank fails to maintain bank status as defined in the Internal Revenue Code or charges are made to the reserve for other than bad debt losses. At December 31, 2019, M&T Bank’s tax bad debt reserve for which no federal income taxes have been provided was $137 million. No actions are planned that would cause this reserve to become wholly or partially taxable.
Income taxes attributable to gains or losses on bank investment securities were an expense of $5 million in 2019 and $7 million in 2017, and a benefit of $2 million in 2018. No alternative minimum tax expense was recognized in 2017.
The Tax Cuts and Jobs Act (“Tax Act”) was signed into law on December 22, 2017, reducing the corporate federal income tax rate from 35% to 21% effective January 1, 2018 and making other changes to U.S. corporate income tax laws, including eliminating the alternative minimum tax as of January 1, 2018. GAAP requires that the impact of the provisions of the Tax Act be accounted for in the period of enactment. Accordingly, the incremental income tax expense recorded by the Company in the fourth quarter of 2017 related to the Tax Act was $85 million. That additional expense was largely attributable to the reduction in carrying value of net deferred tax assets reflecting lower future tax benefits resulting from the lower corporate income tax rate. During 2018 the Company received approval from the Internal Revenue Service to change the timing of recognition of certain loan fees

161
retroactive to 2017. Given the reduction of the federal income tax rate, the change resulted in a $15 million reduction of income tax expense in 2018.
Total income taxes differed from the amount computed by applying the statutory federal income tax rate to pre-tax income as follows:
Year Ended December 31 2019 2018 2017 (In thousands)
Income taxes at statutory federal income tax rate ............................ $534,925 $526,730 $813,352 Increase (decrease) in taxes:
Tax-exempt income ..................................................................... (27,319) (26,186) (40,778)State and local income taxes, net of federal income tax effect .... 118,085 112,451 83,327 Qualified affordable housing project federal tax credits, net....... (15,324) (12,240) (16,015)Initial impact of enactment of Tax Act ........................................ — — 85,431 Other ............................................................................................ 7,745 (10,595) (9,761)
$618,112 $590,160 $915,556
Deferred tax assets (liabilities) were comprised of the following at December 31:
2019 2018 2017 (In thousands)
Losses on loans and other assets ................................................ $ 309,523 $ 322,818 $ 345,609 Operating lease liabilities ........................................................... 128,178 — — Retirement benefits .................................................................... 55,048 30,057 45,322 Postretirement and other employee benefits .............................. 24,023 23,563 26,009 Incentive and other compensation plans .................................... 26,861 24,796 25,050 Interest on loans ......................................................................... — — 37,900 Stock-based compensation ......................................................... 27,912 26,759 26,676 Unrealized losses........................................................................ — 52,580 — Losses on cash flow hedges ....................................................... — 1,861 4,033 Other........................................................................................... 69,863 43,880 66,247
Gross deferred tax assets ....................................................... 641,408 526,314 576,846 Right of use assets and other leasing transactions...................... (326,626) (186,787) (181,159)Unrealized gains ......................................................................... (13,322) — (94,285)Capitalized servicing rights ........................................................ (56,649) (54,894) (51,781)Depreciation and amortization ................................................... (66,925) (61,881) (52,733)Interest on loans ......................................................................... (23,552) (18,920) — Gains on cash flow hedges ......................................................... (36,845) — — Other........................................................................................... (40,472) (30,211) (25,632)
Gross deferred tax liabilities.................................................. (564,391) (352,693) (405,590)Net deferred tax asset ................................................................. $ 77,017 $ 173,621 $ 171,256
The Company believes that it is more likely than not that the deferred tax assets will be realized through taxable earnings or alternative tax strategies.
The income tax credits shown in the statement of income of M&T in note 25 arise principally from operating losses before dividends from subsidiaries.

162
A reconciliation of the beginning and ending amount of unrecognized tax benefits follows:
Federal,State andLocal Tax
AccruedInterest
UnrecognizedIncome Tax
Benefits (In thousands)
Gross unrecognized tax benefits at January 1, 2017........................ $ 35,889 $ 7,915 $ 43,804 Increases as a result of tax positions taken during 2017............... 13,019 — 13,019 Increases as a result of tax positions taken in prior years ............. — 1,379 1,379 Decreases as a result of settlements with taxing authorities ......... (332) (168) (500) Decreases as a result of tax positions taken in prior years............ (3,144) (3,475) (6,619)Gross unrecognized tax benefits at December 31, 2017.................. 45,432 5,651 51,083 Increases as a result of tax positions taken during 2018............... 13,426 — 13,426 Increases as a result of tax positions taken in prior years ............. — 1,969 1,969 Decreases as a result of settlements with taxing authorities ......... (664) (289) (953) Decreases as a result of tax positions taken in prior years............ (1,920) (702) (2,622)Gross unrecognized tax benefits at December 31, 2018.................. 56,274 6,629 62,903 Increases as a result of tax positions taken during 2019............... 6,996 — 6,996 Increases as a result of tax positions taken in prior years ............. 3,265 3,255 6,520 Decreases as a result of tax positions taken in prior years............ (7,566) (2,685) (10,251)Gross unrecognized tax benefits at December 31, 2019.................. $ 58,969 $ 7,199 66,168
Less: Federal, state and local income tax benefits ........................... (13,208)Net unrecognized tax benefits at December 31, 2019 that, if recognized, would impact the effective income tax rate ........... $ 52,960
The Company’s policy is to recognize interest and penalties, if any, related to unrecognized tax benefits in income taxes in the consolidated statement of income. The balance of accrued interest at December 31, 2019 is included in the table above. The Company’s federal, state and local income tax returns are routinely subject to examinations from various governmental taxing authorities. Such examinations may result in challenges to the tax return treatment applied by the Company to specific transactions. Management believes that the assumptions and judgment used to record tax-related assets or liabilities have been appropriate. Should determinations rendered by tax authorities ultimately indicate that management’s assumptions were inappropriate, the result and adjustments required could have a material effect on the Company’s results of operations. Examinations by the Internal Revenue Service of the Company’s federal income tax returns have been largely concluded through 2018, although under statute the income tax returns from 2016 through 2018 could be adjusted. The Company also files income tax returns in over forty states and numerous local jurisdictions. Substantially all material state and local matters have been concluded for years through 2013. It is not reasonably possible to estimate when examinations for any subsequent years will be completed.
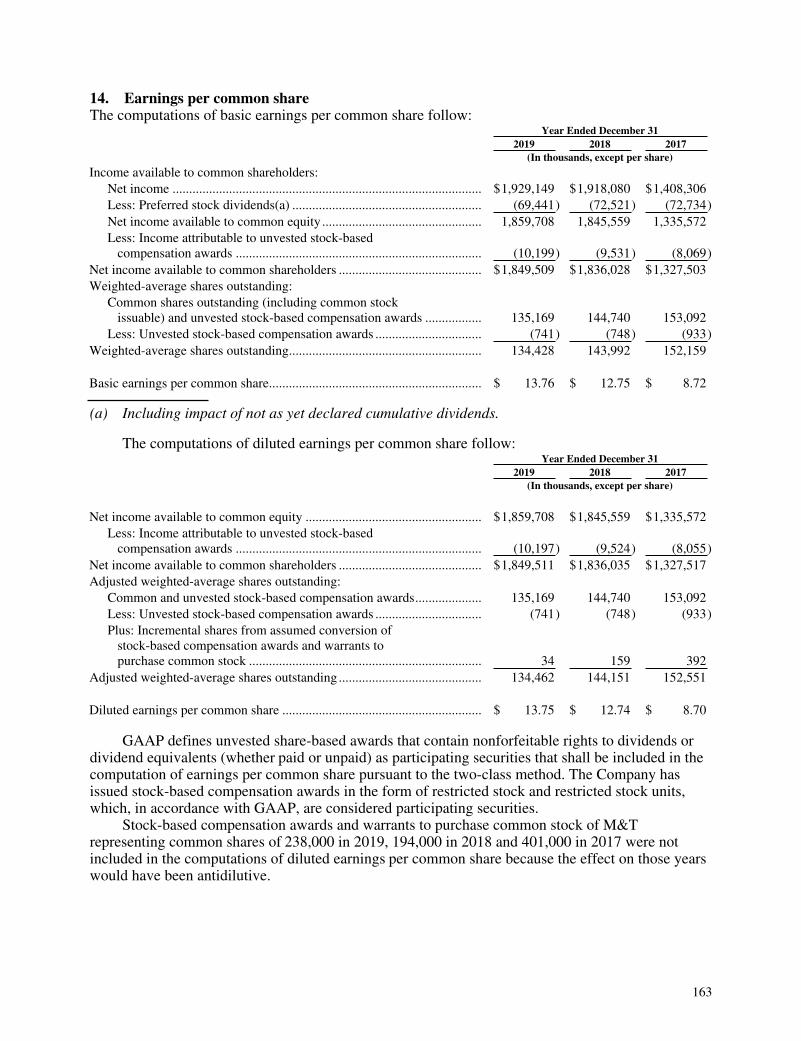
163
14. Earnings per common shareThe computations of basic earnings per common share follow:
Year Ended December 31 2019 2018 2017 (In thousands, except per share)
Income available to common shareholders: Net income ............................................................................................. $1,929,149 $1,918,080 $1,408,306 Less: Preferred stock dividends(a) ......................................................... (69,441) (72,521) (72,734)Net income available to common equity ................................................ 1,859,708 1,845,559 1,335,572 Less: Income attributable to unvested stock-based compensation awards .......................................................................... (10,199) (9,531) (8,069)
Net income available to common shareholders ........................................... $1,849,509 $1,836,028 $1,327,503 Weighted-average shares outstanding:
Common shares outstanding (including common stock issuable) and unvested stock-based compensation awards ................. 135,169 144,740 153,092 Less: Unvested stock-based compensation awards ................................ (741) (748) (933)
Weighted-average shares outstanding.......................................................... 134,428 143,992 152,159 Basic earnings per common share................................................................ $ 13.76 $ 12.75 $ 8.72
(a) Including impact of not as yet declared cumulative dividends.
The computations of diluted earnings per common share follow: Year Ended December 31 2019 2018 2017 (In thousands, except per share)
Net income available to common equity ..................................................... $1,859,708 $1,845,559 $1,335,572
Less: Income attributable to unvested stock-based compensation awards .......................................................................... (10,197) (9,524) (8,055)
Net income available to common shareholders ........................................... $1,849,511 $1,836,035 $1,327,517 Adjusted weighted-average shares outstanding:
Common and unvested stock-based compensation awards.................... 135,169 144,740 153,092 Less: Unvested stock-based compensation awards ................................ (741) (748) (933)Plus: Incremental shares from assumed conversion of stock-based compensation awards and warrants to purchase common stock ...................................................................... 34 159 392
Adjusted weighted-average shares outstanding ........................................... 134,462 144,151 152,551 Diluted earnings per common share ............................................................ $ 13.75 $ 12.74 $ 8.70
GAAP defines unvested share-based awards that contain nonforfeitable rights to dividends or dividend equivalents (whether paid or unpaid) as participating securities that shall be included in the computation of earnings per common share pursuant to the two-class method. The Company has issued stock-based compensation awards in the form of restricted stock and restricted stock units, which, in accordance with GAAP, are considered participating securities.
Stock-based compensation awards and warrants to purchase common stock of M&T representing common shares of 238,000 in 2019, 194,000 in 2018 and 401,000 in 2017 were not included in the computations of diluted earnings per common share because the effect on those years would have been antidilutive.
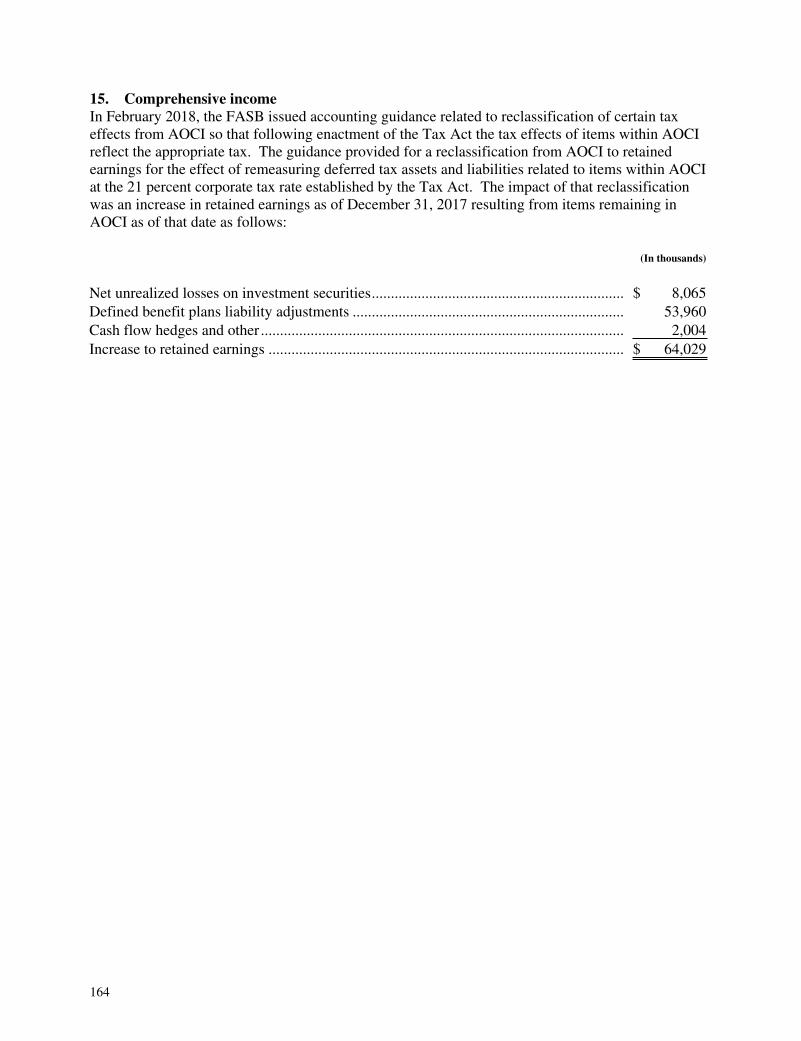
164
15. Comprehensive incomeIn February 2018, the FASB issued accounting guidance related to reclassification of certain tax effects from AOCI so that following enactment of the Tax Act the tax effects of items within AOCI reflect the appropriate tax. The guidance provided for a reclassification from AOCI to retained earnings for the effect of remeasuring deferred tax assets and liabilities related to items within AOCI at the 21 percent corporate tax rate established by the Tax Act. The impact of that reclassification was an increase in retained earnings as of December 31, 2017 resulting from items remaining in AOCI as of that date as follows: (In thousands)
Net unrealized losses on investment securities.................................................................. $ 8,065 Defined benefit plans liability adjustments ....................................................................... 53,960 Cash flow hedges and other ............................................................................................... 2,004 Increase to retained earnings ............................................................................................. $ 64,029

165
The following tables display the components of other comprehensive income (loss) and amounts reclassified from accumulated other comprehensive income (loss) to net income:
Investment Defined
Benefit Total
Amount
Income
Securities (a) Plans Other Before Tax Tax Net (In thousands)
Balance — January 1, 2019 ............................................................... $ (200,107) (354,502) (14,719) $ (569,328) 149,247 $(420,081)Other comprehensive income before reclassifications: Unrealized holding gains, net ...................................................... 247,411 — — 247,411 (65,009) 182,402 Foreign currency translation adjustment...................................... — — 1,381 1,381 (290) 1,091 Unrealized gains on cash flow hedges ......................................... — — 160,373 160,373 (42,163) 118,210 Current year benefit plans losses ................................................. — (126,618) — (126,618) 33,287 (93,331)Total other comprehensive income (loss) before reclassifications............................................................................... 247,411 (126,618) 161,754 282,547 (74,175) 208,372 Amounts reclassified from accumulated other comprehensive income that (increase) decrease net income:
Amortization of unrealized holding losses on held-to-maturity (“HTM”) securities ...................................... 3,394 — — 3,394 (c) (892) 2,502 Losses realized in net income ...................................................... 3 — — 3 (d) (1) 2 Accretion of net gain on terminated cash flow hedges ..................................................................................... — — (136) (136) (e) 36 (100) Net yield adjustment from cash flow hedges currently in effect.................................................................... — — (13,011) (13,011) (c) 3,421 (9,590) Amortization of prior service credit............................................. — (4,173) — (4,173) (f) 1,097 (3,076) Amortization of actuarial losses................................................... — 20,745 — 20,745 (f) (5,454) 15,291 Total other comprehensive income (loss) .......................................... 250,808 (110,046) 148,607 289,369 (75,968) 213,401 Balance — December 31, 2019 ......................................................... $ 50,701 (464,548) 133,888 $ (279,959) 73,279 $(206,680)
Balance — January 1, 2018 ............................................................... $ (59,957) (413,168) (20,165) $ (493,290) 129,476 $(363,814)Cumulative effect of change in accounting principle — equity securities (a) ......................................................................... (22,795) — — (22,795) 5,942 (16,853)Other comprehensive income before reclassifications: Unrealized holding losses, net ..................................................... (121,589) — — (121,589) 31,946 (89,643) Foreign currency translation adjustment...................................... — — (2,817) (2,817) 592 (2,225) Unrealized losses on cash flow hedges........................................ — — (4,965) (4,965) 1,306 (3,659) Current year benefit plans gains .................................................. — 19,871 — 19,871 (5,224) 14,647 Total other comprehensive income (loss) before reclassifications............................................................................... (121,589) 19,871 (7,782) (109,500) 28,620 (80,880)Amounts reclassified from accumulated other comprehensive income that (increase) decrease net income:
Amortization of unrealized holding losses on HTM securities........................................................................ 4,252 — — 4,252 (c) (1,118) 3,134 Gains realized in net income........................................................ (18) — — (18)(d) 4 (14) Accretion of net gain on terminated cash flow hedges ..................................................................................... — — (111) (111) (e) 29 (82) Net yield adjustment from cash flow hedges currently in effect.................................................................... — — 13,339 13,339 (c) (3,507) 9,832 Amortization of prior service credit............................................. — (4,172) — (4,172) (f) 1,097 (3,075) Amortization of actuarial losses................................................... — 42,967 — 42,967 (f) (11,296) 31,671 Total other comprehensive income (loss) .......................................... (117,355) 58,666 5,446 (53,243) 13,829 (39,414)Balance — December 31, 2018 ......................................................... $ (200,107) (354,502) (14,719) $ (569,328) 149,247 $(420,081)
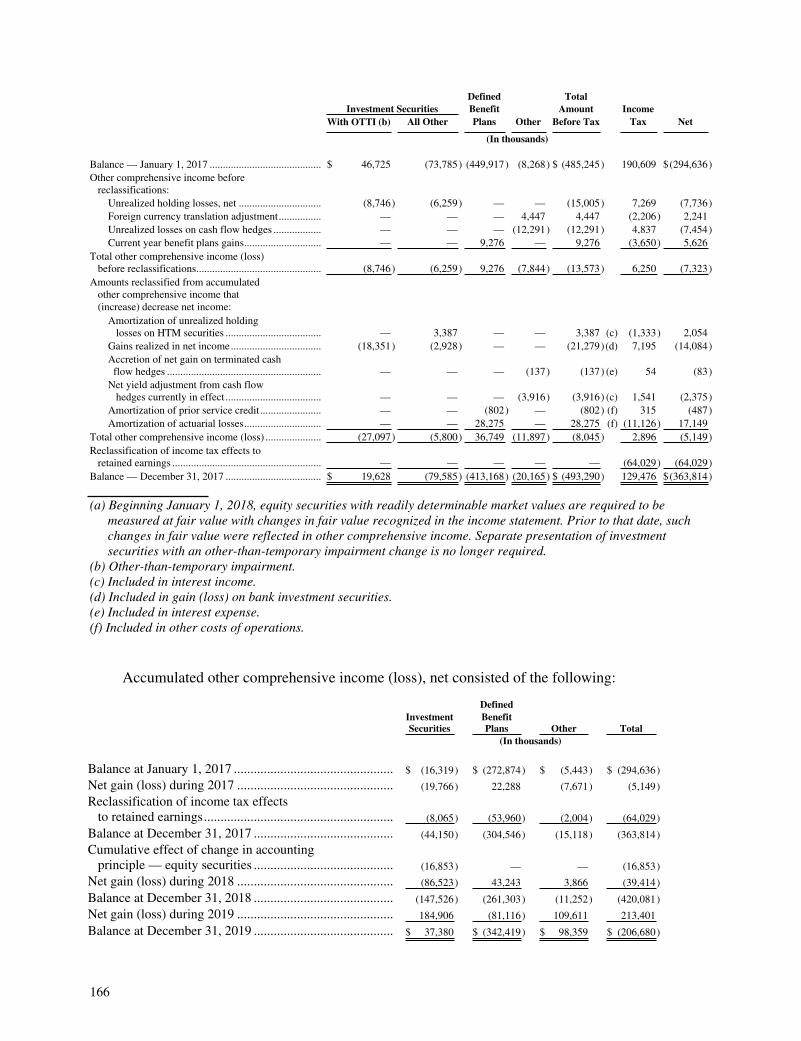
166
Defined Total Investment Securities Benefit Amount Income
With OTTI (b) All Other Plans Other Before Tax Tax Net
(In thousands)
Balance — January 1, 2017 .......................................... $ 46,725 (73,785) (449,917) (8,268) $ (485,245) 190,609 $(294,636)Other comprehensive income before reclassifications:
Unrealized holding losses, net ............................... (8,746) (6,259) — — (15,005) 7,269 (7,736)Foreign currency translation adjustment................ — — — 4,447 4,447 (2,206) 2,241 Unrealized losses on cash flow hedges .................. — — — (12,291) (12,291) 4,837 (7,454)Current year benefit plans gains............................. — — 9,276 — 9,276 (3,650) 5,626
Total other comprehensive income (loss) before reclassifications............................................... (8,746) (6,259) 9,276 (7,844) (13,573) 6,250 (7,323)Amounts reclassified from accumulated other comprehensive income that (increase) decrease net income:
Amortization of unrealized holding losses on HTM securities .................................... — 3,387 — — 3,387 (c) (1,333) 2,054 Gains realized in net income.................................. (18,351) (2,928) — — (21,279)(d) 7,195 (14,084)Accretion of net gain on terminated cash flow hedges .......................................................... — — — (137) (137) (e) 54 (83)Net yield adjustment from cash flow hedges currently in effect .................................... — — — (3,916) (3,916) (c) 1,541 (2,375)Amortization of prior service credit....................... — — (802) — (802) (f) 315 (487)Amortization of actuarial losses............................. — — 28,275 — 28,275 (f) (11,126) 17,149
Total other comprehensive income (loss) ..................... (27,097) (5,800) 36,749 (11,897) (8,045) 2,896 (5,149)Reclassification of income tax effects to retained earnings ........................................................ — — — — — (64,029) (64,029)Balance — December 31, 2017 .................................... $ 19,628 (79,585) (413,168) (20,165) $ (493,290) 129,476 $(363,814)
(a) Beginning January 1, 2018, equity securities with readily determinable market values are required to be measured at fair value with changes in fair value recognized in the income statement. Prior to that date, such changes in fair value were reflected in other comprehensive income. Separate presentation of investment securities with an other-than-temporary impairment change is no longer required.
(b) Other-than-temporary impairment.(c) Included in interest income. (d) Included in gain (loss) on bank investment securities. (e) Included in interest expense. (f) Included in other costs of operations.
Accumulated other comprehensive income (loss), net consisted of the following:
Defined
InvestmentSecurities
Benefit Plans Other Total
(In thousands)
Balance at January 1, 2017 ................................................ $ (16,319) $ (272,874) $ (5,443) $ (294,636) Net gain (loss) during 2017 ............................................... (19,766) 22,288 (7,671) (5,149) Reclassification of income tax effects to retained earnings......................................................... (8,065) (53,960) (2,004) (64,029) Balance at December 31, 2017 .......................................... (44,150) (304,546) (15,118) (363,814) Cumulative effect of change in accounting principle — equity securities .......................................... (16,853) — — (16,853) Net gain (loss) during 2018 ............................................... (86,523) 43,243 3,866 (39,414) Balance at December 31, 2018 .......................................... (147,526) (261,303) (11,252) (420,081) Net gain (loss) during 2019 ............................................... 184,906 (81,116) 109,611 213,401 Balance at December 31, 2019 .......................................... $ 37,380 $ (342,419) $ 98,359 $ (206,680)
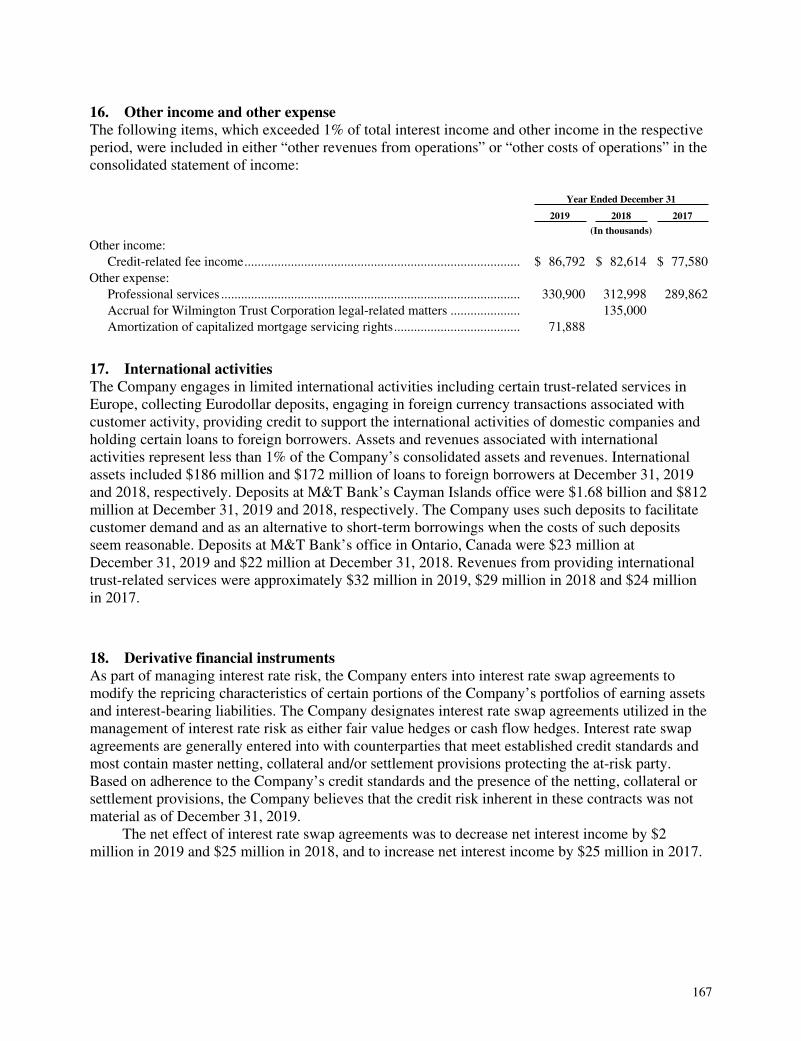
167
16. Other income and other expenseThe following items, which exceeded 1% of total interest income and other income in the respective period, were included in either “other revenues from operations” or “other costs of operations” in the consolidated statement of income:
Year Ended December 31 2019 2018 2017 (In thousands)
Other income: Credit-related fee income................................................................................... $ 86,792 $ 82,614 $ 77,580
Other expense: Professional services .......................................................................................... 330,900 312,998 289,862 Accrual for Wilmington Trust Corporation legal-related matters ..................... 135,000 Amortization of capitalized mortgage servicing rights...................................... 71,888
17. International activitiesThe Company engages in limited international activities including certain trust-related services in Europe, collecting Eurodollar deposits, engaging in foreign currency transactions associated with customer activity, providing credit to support the international activities of domestic companies and holding certain loans to foreign borrowers. Assets and revenues associated with international activities represent less than 1% of the Company’s consolidated assets and revenues. International assets included $186 million and $172 million of loans to foreign borrowers at December 31, 2019 and 2018, respectively. Deposits at M&T Bank’s Cayman Islands office were $1.68 billion and $812 million at December 31, 2019 and 2018, respectively. The Company uses such deposits to facilitate customer demand and as an alternative to short-term borrowings when the costs of such deposits seem reasonable. Deposits at M&T Bank’s office in Ontario, Canada were $23 million at December 31, 2019 and $22 million at December 31, 2018. Revenues from providing international trust-related services were approximately $32 million in 2019, $29 million in 2018 and $24 million in 2017.
18. Derivative financial instrumentsAs part of managing interest rate risk, the Company enters into interest rate swap agreements to modify the repricing characteristics of certain portions of the Company’s portfolios of earning assets and interest-bearing liabilities. The Company designates interest rate swap agreements utilized in the management of interest rate risk as either fair value hedges or cash flow hedges. Interest rate swap agreements are generally entered into with counterparties that meet established credit standards and most contain master netting, collateral and/or settlement provisions protecting the at-risk party. Based on adherence to the Company’s credit standards and the presence of the netting, collateral or settlement provisions, the Company believes that the credit risk inherent in these contracts was not material as of December 31, 2019.
The net effect of interest rate swap agreements was to decrease net interest income by $2 million in 2019 and $25 million in 2018, and to increase net interest income by $25 million in 2017.
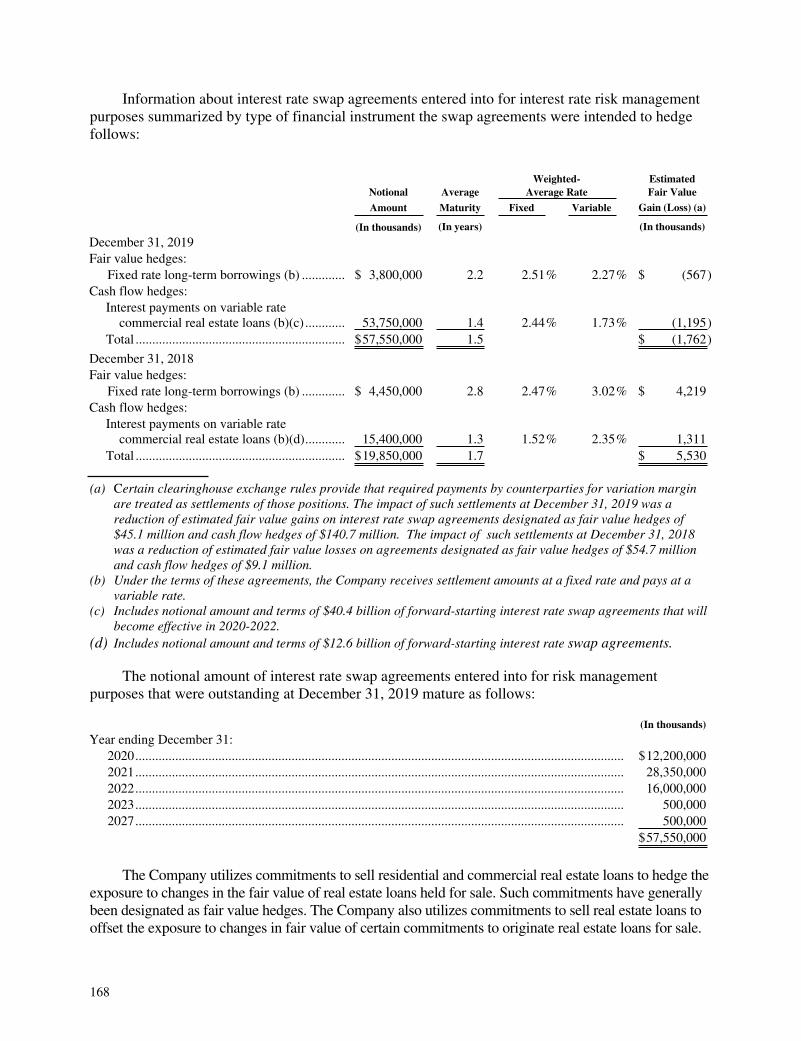
168
Information about interest rate swap agreements entered into for interest rate risk management purposes summarized by type of financial instrument the swap agreements were intended to hedge follows:
Weighted- Estimated
Notional Average Average Rate Fair Value
Amount Maturity Fixed Variable Gain (Loss) (a)
(In thousands) (In years) (In thousands) December 31, 2019 Fair value hedges:
Fixed rate long-term borrowings (b) ............. $ 3,800,000 2.2 2.51% 2.27% $ (567)Cash flow hedges: Interest payments on variable rate commercial real estate loans (b)(c) ............ 53,750,000 1.4 2.44% 1.73% (1,195) Total ............................................................... $57,550,000 1.5 $ (1,762)
December 31, 2018 Fair value hedges:
Fixed rate long-term borrowings (b) ............. $ 4,450,000 2.8 2.47% 3.02% $ 4,219 Cash flow hedges: Interest payments on variable rate commercial real estate loans (b)(d)............ 15,400,000 1.3 1.52% 2.35% 1,311 Total ............................................................... $19,850,000 1.7 $ 5,530
(a) Certain clearinghouse exchange rules provide that required payments by counterparties for variation margin are treated as settlements of those positions. The impact of such settlements at December 31, 2019 was a reduction of estimated fair value gains on interest rate swap agreements designated as fair value hedges of $45.1 million and cash flow hedges of $140.7 million. The impact of such settlements at December 31, 2018 was a reduction of estimated fair value losses on agreements designated as fair value hedges of $54.7 million and cash flow hedges of $9.1 million.
(b) Under the terms of these agreements, the Company receives settlement amounts at a fixed rate and pays at a variable rate.
(c) Includes notional amount and terms of $40.4 billion of forward-starting interest rate swap agreements that will become effective in 2020-2022.
(d) Includes notional amount and terms of $12.6 billion of forward-starting interest rate swap agreements.
The notional amount of interest rate swap agreements entered into for risk management purposes that were outstanding at December 31, 2019 mature as follows:
(In thousands)
Year ending December 31: 2020................................................................................................................................................... $12,200,000 2021................................................................................................................................................... 28,350,000 2022................................................................................................................................................... 16,000,000 2023................................................................................................................................................... 500,000 2027................................................................................................................................................... 500,000 $57,550,000
The Company utilizes commitments to sell residential and commercial real estate loans to hedge the exposure to changes in the fair value of real estate loans held for sale. Such commitments have generally been designated as fair value hedges. The Company also utilizes commitments to sell real estate loans to offset the exposure to changes in fair value of certain commitments to originate real estate loans for sale.

169
Derivative financial instruments used for trading account purposes included interest rate contracts, foreign exchange and other option contracts, foreign exchange forward and spot contracts, and financial futures. Interest rate contracts entered into for trading account purposes had notional values of $48.6 billion and $42.9 billion at December 31, 2019 and 2018, respectively. The notional amounts of foreign currency and other option and futures contracts entered into for trading account purposes aggregated $1.2 billion and $763 million at December 31, 2019 and 2018, respectively.
Information about the fair values of derivative instruments in the Company’s consolidated balance sheet and consolidated statement of income follows:
Asset Derivatives Liability Derivatives Fair Value Fair Value December 31 December 31 2019 2018 2019 2018 (In thousands)
Derivatives designated and qualifying as hedging instruments Interest rate swap agreements (a)................................................................ $ 232 $ 5,530 $ 1,994 $ — Commitments to sell real estate loans (a) ................................................... 1,195 1,090 421 6,434 1,427 6,620 2,415 6,434 Derivatives not designated and qualifying as hedging instruments Mortgage-related commitments to originate real estate loans for sale (a) ............................................................................................... 11,965 9,304 1,225 1,592 Commitments to sell real estate loans (a) ................................................... 3,074 3,702 3,548 4,535 Trading:
Interest rate contracts (b) ...................................................................... 398,295 118,687 68,103 169,255 Foreign exchange and other option and futures contracts (b)............... 12,506 10,549 11,800 8,870
425,840 142,242 84,676 184,252 Total derivatives ......................................................................................... $ 427,267 $ 148,862 $ 87,091 $ 190,686
(a) Asset derivatives are reported in other assets and liability derivatives are reported in other liabilities.(b) Asset derivatives are reported in trading account assets and liability derivatives are reported in other
liabilities. The impact of variation margin settlement payments at December 31, 2019 and December 31, 2018 was a reduction of the estimated fair value of interest rate contracts in the trading account in an asset position of $43.3 million and $170.7 million, respectively, and in a liability position of $281.3 million and $49.7 million, respectively.

170
Amount of Gain (Loss) Recognized
Year Ended
December 31, 2019 Year Ended
December 31, 2018 Year Ended
December 31, 2017
Derivative Hedged
Item Derivative Hedged
Item Derivative Hedged
Item (In thousands)
Derivatives in fair value hedging relationships Interest rate swap agreements:
Fixed rate long-term borrowings (a).............. $ 95,006 (94,742) $(10,006) 10,969 $(52,392) 51,628
Derivatives not designated as hedging instruments Trading:
Interest rate contracts (b) ............................... $ 24,701 $ 4,506 $ 5,398 Foreign exchange and other option and futures contracts (b) .................................... 8,511 9,416 6,821
Total .................................................................... $ 33,212 $ 13,922 $ 12,219
(a) Effective January 1, 2018, reported as an adjustment to interest expense. Prior to 2018, reported as other revenues from operations.
(b) Reported as trading account and foreign exchange gains.
Carrying Amount of the
Hedged Item
Cumulative Amount of Fair Value Hedging
Adjustment Increasing (Decreasing) the Carrying
Amount of theHedged Item
December 31 December 31
2019 2018 2019 2018
(In thousands)
Location in the Consolidated Balance Sheet of the Hedged Items in Fair Value Hedges
Long-term debt ................................................................... $3,840,775 $4,394,109 $ 43,640 $(51,102)
The amount of gain (loss) recognized in the consolidated statement of income associated with derivatives designated as cash flow hedges was not material.
The Company also has commitments to sell and commitments to originate residential and commercial real estate loans that are considered derivatives. The Company designates certain of the commitments to sell real estate loans as fair value hedges of real estate loans held for sale. The Company also utilizes commitments to sell real estate loans to offset the exposure to changes in the fair value of certain commitments to originate real estate loans for sale. As a result of these activities, net unrealized pre-tax gains related to hedged loans held for sale, commitments to originate loans for sale and commitments to sell loans were approximately $18 million at each of December 31, 2019 and 2018. Changes in unrealized gains and losses are included in mortgage banking revenues and, in general, are realized in subsequent periods as the related loans are sold and commitments satisfied.
The Company does not offset derivative asset and liability positions in its consolidated financial statements. The Company’s exposure to credit risk by entering into derivative contracts is mitigated through master netting agreements and collateral posting or settlement requirements. Master netting agreements covering interest rate and foreign exchange contracts with the same party include a right

171
to set-off that becomes enforceable in the event of default, early termination or under other specific conditions.
The aggregate fair value of derivative financial instruments in a liability position, which are subject to enforceable master netting arrangements, was $51 million and $21 million at December 31, 2019 and 2018, respectively, for which the Company was required to post collateral relating to those positions of $50 million and $18 million at December 31, 2019 and 2018, respectively. Certain of the Company’s derivative financial instruments contain provisions that require the Company to maintain specific credit ratings from credit rating agencies to avoid higher collateral posting requirements. If the Company’s debt ratings were to fall below specified ratings, the counterparties of the derivative financial instruments could demand immediate incremental collateralization on those instruments in a net liability position. The aggregate fair value of all derivative financial instruments with such credit risk-related contingent features in a net liability position on December 31, 2019 was not significant. If the credit risk-related contingent features had been triggered on December 31, 2019, the Company would not have been required to post any additional collateral with counterparties.
The aggregate fair value of derivative financial instruments in an asset position, which are subject to enforceable master netting arrangements, was $6 million and $18 million at December 31, 2019 and 2018, respectively. Counterparties posted collateral relating to those positions of $5 million and $16 million at December 31, 2019 and 2018, respectively. Trading account interest rate swap agreements entered into with customers are subject to the Company’s credit risk standards and often contain collateral provisions.
In addition to the derivative contracts noted above, the Company clears certain derivative transactions through a clearinghouse, rather than directly with counterparties. Those transactions cleared through a clearinghouse require initial margin collateral and variation margin payments depending on the contracts being in a net asset or liability position. The amount of initial margin collateral posted by the Company was $84 million and $65 million at December 31, 2019 and 2018, respectively. The fair value asset and liability amounts of derivative contracts have been reduced by variation margin payments treated as settlements as described herein. Variation margin on derivative contracts not treated as settlements continues to represent collateral posted or received by the Company.
19. Variable interest entitiesThe Company’s securitization activity has consisted of securitizing loans originated for sale into government issued or guaranteed mortgage-backed securities. The amounts of those securitizations in 2019, 2018 and 2017 are presented in the Company’s consolidated statement of cash flows. The Company has not recognized any losses as a result of having securitized assets.
As described in note 8, M&T has issued junior subordinated debentures payable to various trusts that have issued Capital Securities. M&T owns the common securities of those trust entities. The Company is not considered to be the primary beneficiary of those entities and, accordingly, the trusts are not included in the Company’s consolidated financial statements. At each of December 31, 2019 and 2018, the Company included the junior subordinated debentures as “long-term borrowings” in its consolidated balance sheet and recognized $23 million in other assets for its “investment” in the common securities of the trusts that will be concomitantly repaid to M&T by the respective trust from the proceeds of M&T’s repayment of the junior subordinated debentures associated with preferred capital securities described in note 8.
The Company has invested as a limited partner in various partnerships that collectively had total assets of approximately $1.5 billion at of December 31, 2019 and $1.1 billion at December 31, 2018. Those partnerships generally construct or acquire properties for which the investing partners are
172
eligible to receive certain federal income tax credits in accordance with government guidelines. Such investments may also provide tax deductible losses to the partners. The partnership investments also assist the Company in achieving its community reinvestment initiatives. As a limited partner, there is no recourse to the Company by creditors of the partnerships. However, the tax credits that result from the Company’s investments in such partnerships are generally subject to recapture should a partnership fail to comply with the respective government regulations. The Company’s carrying amount of its investments in such partnerships was $748 million, including $414 million of unfunded commitments, at December 31, 2019 and $523 million, including $280 million of unfunded commitments, at December 31, 2018. Contingent commitments to provide additional capital contributions to these partnerships were not material at December 31, 2019. The Company has not provided financial or other support to the partnerships that was not contractually required. The Company’s maximum exposure to loss from its investments in such partnerships as of December 31, 2019 was $984 million, including possible recapture of certain tax credits. Management currently estimates that no material losses are probable as a result of the Company’s involvement with such entities. The Company, in its position as limited partner, does not direct the activities that most significantly impact the economic performance of the partnerships and, therefore, in accordance with the accounting provisions for variable interest entities, the partnership entities are not included in the Company’s consolidated financial statements. The Company’s investment in qualified affordable housing projects is amortized to income taxes in the consolidated statement of income as tax credits and other tax benefits resulting from deductible losses associated with the projects are received.
The Company serves as investment advisor for certain registered money-market funds. The Company has no explicit arrangement to provide support to those funds, but may waive portions of its allowable management fees as a result of market conditions.
20. Fair value measurementsGAAP permits an entity to choose to measure eligible financial instruments and other items at fair value. The Company has not made any fair value elections at December 31, 2019.
Pursuant to GAAP, fair value is defined as the price that would be received to sell an asset or paid to transfer a liability in an orderly transaction between market participants at the measurement date. A three-level hierarchy exists in GAAP for fair value measurements based upon the inputs to the valuation of an asset or liability.
• Level 1 — Valuation is based on quoted prices in active markets for identical assets and liabilities.
• Level 2 — Valuation is determined from quoted prices for similar assets or liabilities in active markets, quoted prices for identical or similar instruments in markets that are not active or by model-based techniques in which all significant inputs are observable in the market.
• Level 3 — Valuation is derived from model-based and other techniques in which at least one significant input is unobservable and which may be based on the Company’s own estimates about the assumptions that market participants would use to value the asset or liability.
When available, the Company attempts to use quoted market prices in active markets to determine fair value and classifies such items as Level 1 or Level 2. If quoted market prices in active markets are not available, fair value is often determined using model-based techniques incorporating various assumptions including interest rates, prepayment speeds and credit losses. Assets and liabilities valued using model-based techniques are classified as either Level 2 or Level 3, depending on the lowest level classification of an input that is considered significant to the overall valuation.

173
The following is a description of the valuation methodologies used for the Company’s assets and liabilities that are measured on a recurring basis at estimated fair value.
Trading account assets and liabilitiesTrading account assets and liabilities include interest rate contracts and foreign exchange contracts with customers who require such services with offsetting positions with third parties to minimize the Company’s risk with respect to such transactions. The Company generally determines the fair value of its derivative trading account assets and liabilities using externally developed pricing models based on market observable inputs and, therefore, classifies such valuations as Level 2. Mutual funds held in connection with deferred compensation and other arrangements have been classified as Level 1 valuations. Valuations of investments in municipal and other bonds can generally be obtained through reference to quoted prices in less active markets for the same or similar securities or through model-based techniques in which all significant inputs are observable and, therefore, such valuations have been classified as Level 2.
Investment securities available for sale and equity securitiesThe majority of the Company’s available-for-sale investment securities have been valued by reference to prices for similar securities or through model-based techniques in which all significant inputs are observable and, therefore, such valuations have been classified as Level 2. Certain investments in mutual funds and equity securities are actively traded and, therefore, have been classified as Level 1 valuations.
Real estate loans held for saleThe Company utilizes commitments to sell real estate loans to hedge the exposure to changes in fair value of real estate loans held for sale. The carrying value of hedged real estate loans held for sale includes changes in estimated fair value during the hedge period. Typically, the Company attempts to hedge real estate loans held for sale from the date of close through the sale date. The fair value of hedged real estate loans held for sale is generally calculated by reference to quoted prices in secondary markets for commitments to sell real estate loans with similar characteristics and, accordingly, such loans have been classified as a Level 2 valuation.
Commitments to originate real estate loans for sale and commitments to sell real estate loansThe Company enters into various commitments to originate real estate loans for sale and commitments to sell real estate loans. Such commitments are considered to be derivative financial instruments and, therefore, are carried at estimated fair value on the consolidated balance sheet. The estimated fair values of such commitments were generally calculated by reference to quoted prices in secondary markets for commitments to sell real estate loans to certain government-sponsored entities and other parties. The fair valuations of commitments to sell real estate loans generally result in a Level 2 classification. The estimated fair value of commitments to originate real estate loans for sale is adjusted to reflect the Company’s anticipated commitment expirations. The estimated commitment expirations are considered significant unobservable inputs contributing to the Level 3 classification of commitments to originate real estate loans for sale. Significant unobservable inputs used in the determination of estimated fair value of commitments to originate real estate loans for sale are included in the accompanying table of significant unobservable inputs to Level 3 measurements.
Interest rate swap agreements used for interest rate risk managementThe Company utilizes interest rate swap agreements as part of the management of interest rate risk to modify the repricing characteristics of certain portions of its portfolios of earning assets and interest-bearing liabilities. The Company generally determines the fair value of its interest rate swap

174
agreements using externally developed pricing models based on market observable inputs and, therefore, classifies such valuations as Level 2. The Company has considered counterparty credit risk in the valuation of its interest rate swap agreement assets and has considered its own credit risk in the valuation of its interest rate swap agreement liabilities.
The following tables present assets and liabilities at December 31, 2019 and 2018 measured at estimated fair value on a recurring basis:
Fair Value
Measurements Level 1 (a) Level 2 (a) Level 3 (In thousands)
December 31, 2019 Trading account assets............................................. $ 470,129 $ 49,040 $ 421,089 $ — Investment securities available for sale:
U.S. Treasury and federal agencies.................... 9,767 — 9,767 — Obligations of states and political subdivisions..................................................... 775 — 775 — Mortgage-backed securities:
Government issued or guaranteed ................ 6,180,940 — 6,180,940 — Privately issued............................................. 16 — — 16
Other debt securities........................................... 127,278 — 127,278 — 6,318,776 — 6,318,760 16 Equity securities ...................................................... 140,041 100,637 39,404 — Real estate loans held for sale ................................. 442,079 — 442,079 — Other assets (b) ........................................................ 16,466 — 4,501 11,965
Total assets......................................................... $ 7,387,491 $ 149,677 $ 7,225,833 $ 11,981
Trading account liabilities ....................................... $ 79,903 $ — $ 79,903 $ — Other liabilities (b) .................................................. 7,188 — 5,963 1,225
Total liabilities ................................................... $ 87,091 $ — $ 85,866 $ 1,225
December 31, 2018 Trading account assets............................................. $ 185,584 $ 46,018 $ 139,566 $ — Investment securities available for sale:
U.S. Treasury and federal agencies.................... 1,336,931 — 1,336,931 — Obligations of states and political subdivisions..................................................... 1,659 — 1,659 — Mortgage-backed securities:
Government issued or guaranteed ................ 7,216,991 — 7,216,991 — Privately issued............................................. 22 — — 22
Other debt securities........................................... 126,906 — 126,906 — 8,682,509 — 8,682,487 22
Equity securities ...................................................... 93,917 71,989 21,928 — Real estate loans held for sale ................................. 551,697 — 551,697 — Other assets (b) ........................................................ 19,626 — 10,322 9,304
Total assets......................................................... $ 9,533,333 $ 118,007 $ 9,406,000 $ 9,326
Trading account liabilities ....................................... $ 178,125 $ — $ 178,125 $ — Other liabilities (b) .................................................. 12,561 — 10,969 1,592
Total liabilities ................................................... $ 190,686 $ — $ 189,094 $ 1,592
(a) There were no significant transfers between Level 1 and Level 2 of the fair value hierarchy during the years ended December 31, 2019 and 2018.
(b) Comprised predominantly of interest rate swap agreements used for interest rate risk management (Level 2), commitments to sell real estate loans (Level 2) and commitments to originate real estate loans to be held for sale (Level 3).
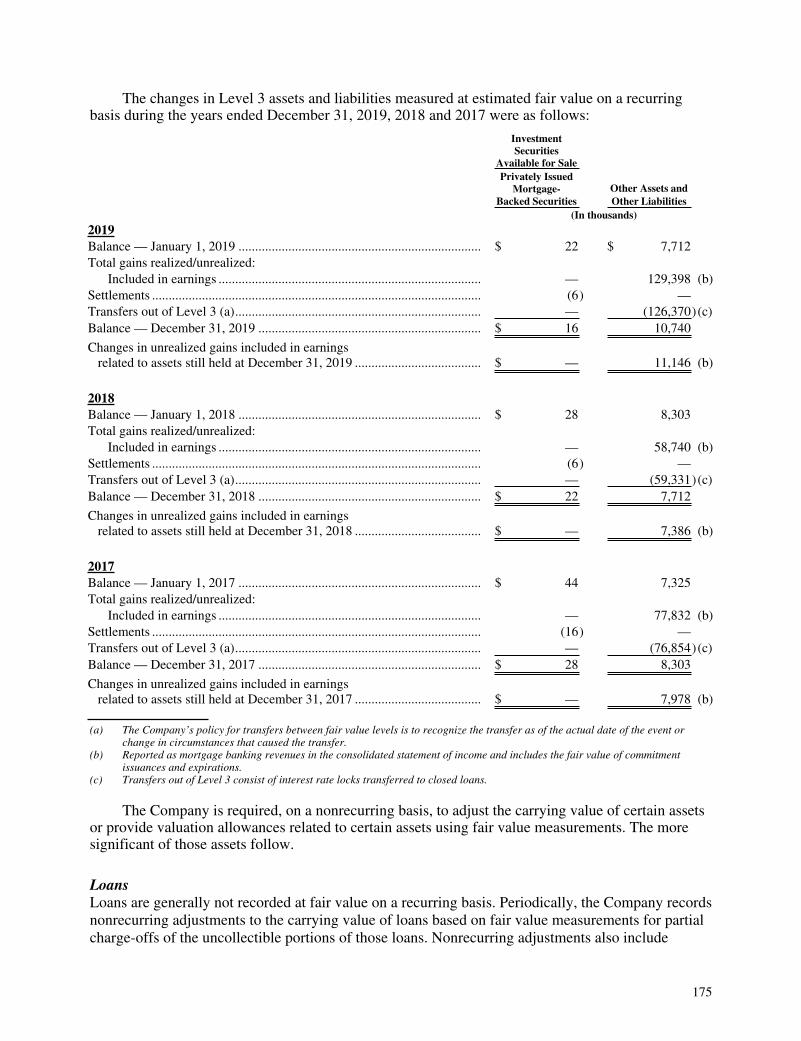
175
The changes in Level 3 assets and liabilities measured at estimated fair value on a recurring basis during the years ended December 31, 2019, 2018 and 2017 were as follows:
InvestmentSecurities
Available for Sale
Privately Issued Mortgage-
Backed Securities Other Assets and Other Liabilities
(In thousands)
2019 Balance — January 1, 2019 ......................................................................... $ 22 $ 7,712 Total gains realized/unrealized: Included in earnings ............................................................................... — 129,398 (b)Settlements ................................................................................................... (6) — Transfers out of Level 3 (a).......................................................................... — (126,370)(c)Balance — December 31, 2019 ................................................................... $ 16 10,740
Changes in unrealized gains included in earnings related to assets still held at December 31, 2019 ...................................... $ — 11,146 (b)
2018 Balance — January 1, 2018 ......................................................................... $ 28 8,303 Total gains realized/unrealized: Included in earnings ............................................................................... — 58,740 (b)Settlements ................................................................................................... (6) — Transfers out of Level 3 (a).......................................................................... — (59,331)(c)Balance — December 31, 2018 ................................................................... $ 22 7,712
Changes in unrealized gains included in earnings related to assets still held at December 31, 2018 ...................................... $ — 7,386 (b)
2017 Balance — January 1, 2017 ......................................................................... $ 44 7,325 Total gains realized/unrealized: Included in earnings ............................................................................... — 77,832 (b)Settlements ................................................................................................... (16) — Transfers out of Level 3 (a).......................................................................... — (76,854)(c)Balance — December 31, 2017 ................................................................... $ 28 8,303
Changes in unrealized gains included in earnings related to assets still held at December 31, 2017 ...................................... $ — 7,978 (b)
(a) The Company’s policy for transfers between fair value levels is to recognize the transfer as of the actual date of the event or change in circumstances that caused the transfer.
(b) Reported as mortgage banking revenues in the consolidated statement of income and includes the fair value of commitment issuances and expirations.
(c) Transfers out of Level 3 consist of interest rate locks transferred to closed loans.
The Company is required, on a nonrecurring basis, to adjust the carrying value of certain assets or provide valuation allowances related to certain assets using fair value measurements. The more significant of those assets follow.
LoansLoans are generally not recorded at fair value on a recurring basis. Periodically, the Company records nonrecurring adjustments to the carrying value of loans based on fair value measurements for partial charge-offs of the uncollectible portions of those loans. Nonrecurring adjustments also include
176
certain impairment amounts for collateral-dependent loans when establishing the allowance for credit losses. Such amounts are generally based on the fair value of the underlying collateral supporting the loan and, as a result, the carrying value of the loan less the calculated valuation amount does not necessarily represent the fair value of the loan. Real estate collateral is typically valued using appraisals or other indications of value based on recent comparable sales of similar properties or assumptions generally observable in the marketplace and the related nonrecurring fair value measurement adjustments have generally been classified as Level 2, unless significant adjustments have been made to the valuation that are not readily observable by market participants. Non-real estate collateral supporting commercial loans generally consists of business assets such as receivables, inventory and equipment. Fair value estimations are typically determined by discounting recorded values of those assets to reflect estimated net realizable value considering specific borrower facts and circumstances and the experience of credit personnel in their dealings with similar borrower collateral liquidations. Such discounts were generally in the range of 10% to 85% at December 31, 2019. As these discounts are not readily observable and are considered significant, the valuations have been classified as Level 3. Automobile collateral is typically valued by reference to independent pricing sources based on recent sales transactions of similar vehicles, and the related non-recurring fair value measurement adjustments have been classified as Level 2. Collateral values for other consumer installment loans are generally estimated based on historical recovery rates for similar types of loans. As these recovery rates are not readily observable by market participants, such valuation adjustments have been classified as Level 3. Loans subject to nonrecurring fair value measurement were $305 million at December 31, 2019, ($115 million and $190 million of which were classified as Level 2 and Level 3, respectively), $268 million at December 31, 2018 ($120 million and $148 million of which were classified as Level 2 and Level 3, respectively), and $210 million at December 31, 2017 ($145 million and $65 million of which were classified as Level 2 and Level 3, respectively). Changes in fair value recognized during the years ended December 31, 2019, 2018 and 2017 for partial charge-offs of loans and loan impairment reserves on loans held by the Company at the end of each of those years were decreases of $110 million, $83 million and $56 million, respectively.
Assets taken in foreclosure of defaulted loansAssets taken in foreclosure of defaulted loans are primarily comprised of commercial and residential real property and are generally measured at the lower of cost or fair value less costs to sell. The fair value of the real property is generally determined using appraisals or other indications of value based on recent comparable sales of similar properties or assumptions generally observable in the marketplace, and the related nonrecurring fair value measurement adjustments have generally been classified as Level 2. Assets taken in foreclosure of defaulted loans subject to nonrecurring fair value measurement were $21 million and $28 million at December 31, 2019 and December 31, 2018, respectively. Changes in fair value recognized during the years ended December 31, 2019, 2018 and 2017 for foreclosed assets held by the Company at the end of each of those years were not material.
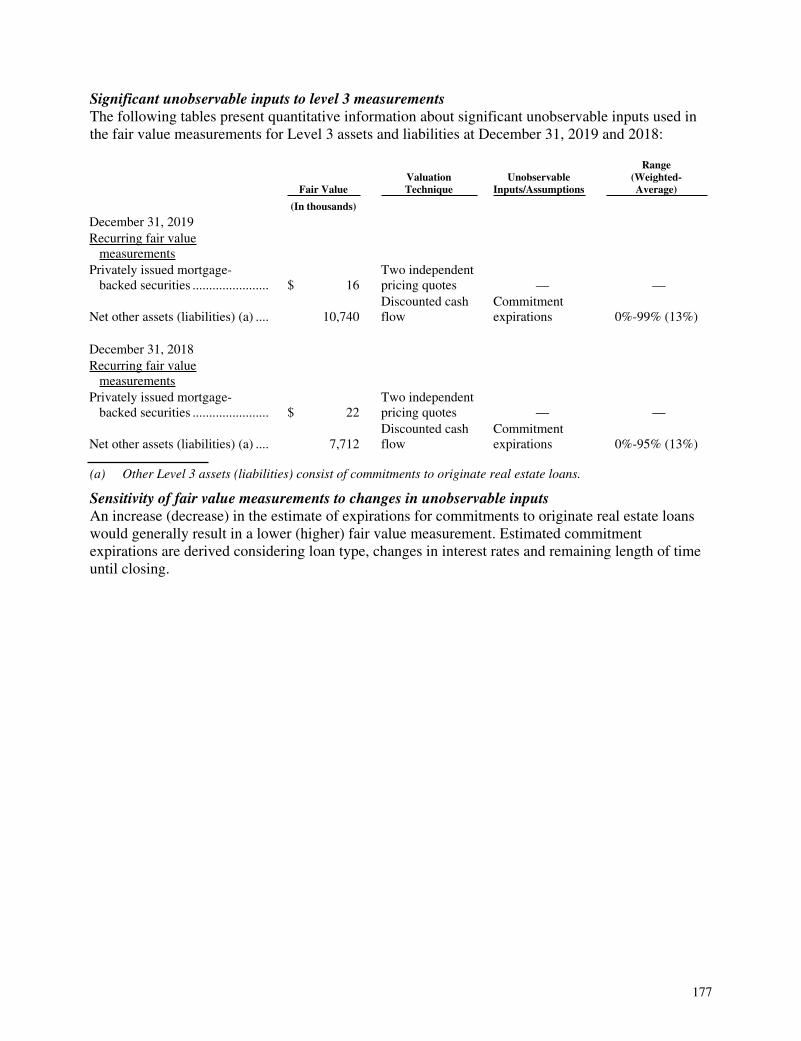
177
Significant unobservable inputs to level 3 measurementsThe following tables present quantitative information about significant unobservable inputs used in the fair value measurements for Level 3 assets and liabilities at December 31, 2019 and 2018:
Fair Value ValuationTechnique
UnobservableInputs/Assumptions
Range(Weighted-Average)
(In thousands)
December 31, 2019
Recurring fair value measurements Privately issued mortgage- backed securities ....................... $ 16
Two independent pricing quotes — —
Net other assets (liabilities) (a) .... 10,740 Discounted cash flow
Commitment expirations 0%-99% (13%)
December 31, 2018 Recurring fair value measurements Privately issued mortgage- backed securities ....................... $ 22
Two independent pricing quotes — —
Net other assets (liabilities) (a) .... 7,712 Discounted cash flow
Commitment expirations 0%-95% (13%)
(a) Other Level 3 assets (liabilities) consist of commitments to originate real estate loans.
Sensitivity of fair value measurements to changes in unobservable inputsAn increase (decrease) in the estimate of expirations for commitments to originate real estate loans would generally result in a lower (higher) fair value measurement. Estimated commitment expirations are derived considering loan type, changes in interest rates and remaining length of time until closing.
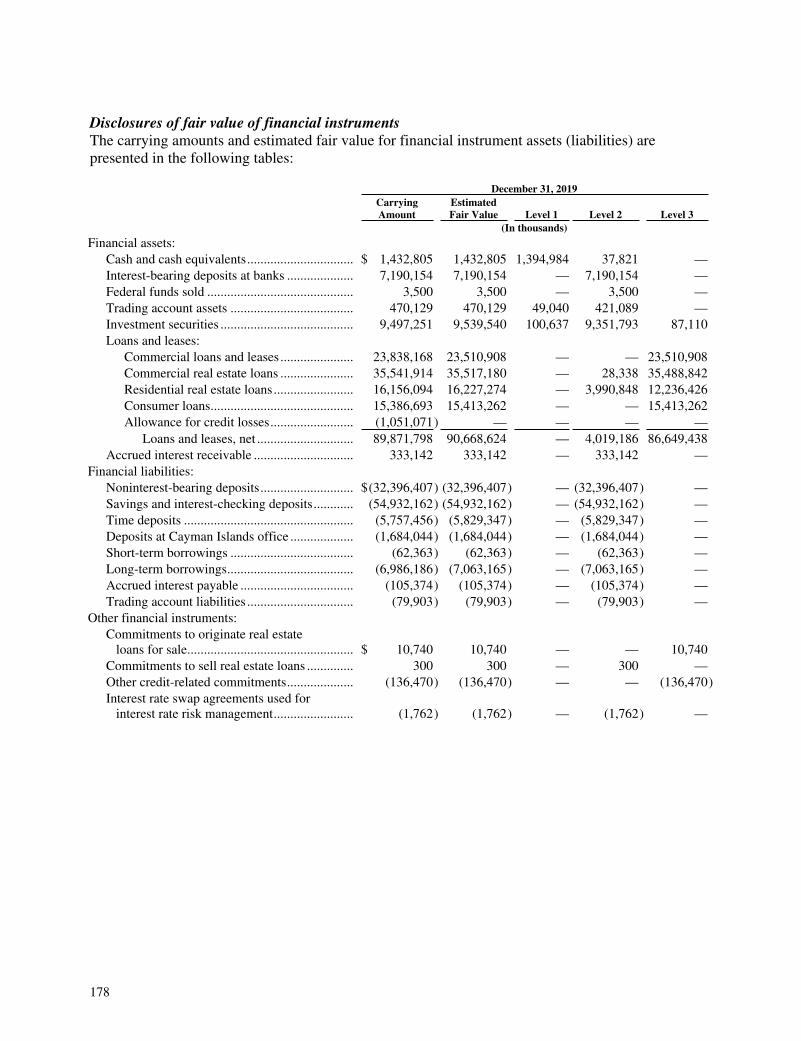
178
Disclosures of fair value of financial instrumentsThe carrying amounts and estimated fair value for financial instrument assets (liabilities) are presented in the following tables:
December 31, 2019
CarryingAmount
EstimatedFair Value Level 1 Level 2 Level 3
(In thousands)
Financial assets: Cash and cash equivalents................................ $ 1,432,805 1,432,805 1,394,984 37,821 — Interest-bearing deposits at banks .................... 7,190,154 7,190,154 — 7,190,154 — Federal funds sold ............................................ 3,500 3,500 — 3,500 — Trading account assets ..................................... 470,129 470,129 49,040 421,089 — Investment securities ........................................ 9,497,251 9,539,540 100,637 9,351,793 87,110 Loans and leases:
Commercial loans and leases...................... 23,838,168 23,510,908 — — 23,510,908 Commercial real estate loans ...................... 35,541,914 35,517,180 — 28,338 35,488,842 Residential real estate loans........................ 16,156,094 16,227,274 — 3,990,848 12,236,426 Consumer loans........................................... 15,386,693 15,413,262 — — 15,413,262 Allowance for credit losses......................... (1,051,071) — — — —
Loans and leases, net ............................. 89,871,798 90,668,624 — 4,019,186 86,649,438 Accrued interest receivable .............................. 333,142 333,142 — 333,142 —
Financial liabilities: Noninterest-bearing deposits............................ $(32,396,407) (32,396,407) — (32,396,407) — Savings and interest-checking deposits............ (54,932,162) (54,932,162) — (54,932,162) — Time deposits ................................................... (5,757,456) (5,829,347) — (5,829,347) — Deposits at Cayman Islands office ................... (1,684,044) (1,684,044) — (1,684,044) — Short-term borrowings ..................................... (62,363) (62,363) — (62,363) — Long-term borrowings...................................... (6,986,186) (7,063,165) — (7,063,165) — Accrued interest payable .................................. (105,374) (105,374) — (105,374) — Trading account liabilities ................................ (79,903) (79,903) — (79,903) —
Other financial instruments: Commitments to originate real estate loans for sale.................................................. $ 10,740 10,740 — — 10,740 Commitments to sell real estate loans .............. 300 300 — 300 — Other credit-related commitments.................... (136,470) (136,470) — — (136,470)Interest rate swap agreements used for interest rate risk management........................ (1,762) (1,762) — (1,762) —
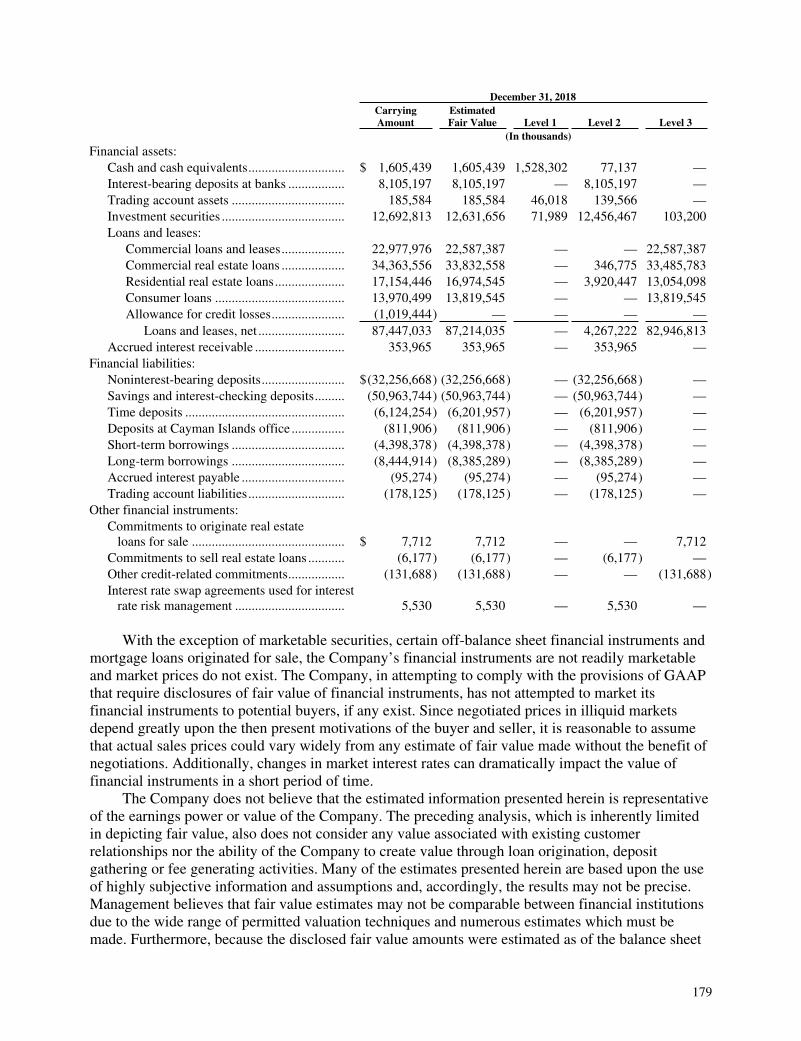
179
December 31, 2018
CarryingAmount
EstimatedFair Value Level 1 Level 2 Level 3
(In thousands)
Financial assets: Cash and cash equivalents............................. $ 1,605,439 1,605,439 1,528,302 77,137 — Interest-bearing deposits at banks ................. 8,105,197 8,105,197 — 8,105,197 — Trading account assets .................................. 185,584 185,584 46,018 139,566 — Investment securities ..................................... 12,692,813 12,631,656 71,989 12,456,467 103,200 Loans and leases:
Commercial loans and leases................... 22,977,976 22,587,387 — — 22,587,387 Commercial real estate loans ................... 34,363,556 33,832,558 — 346,775 33,485,783 Residential real estate loans..................... 17,154,446 16,974,545 — 3,920,447 13,054,098 Consumer loans ....................................... 13,970,499 13,819,545 — — 13,819,545 Allowance for credit losses...................... (1,019,444) — — — —
Loans and leases, net .......................... 87,447,033 87,214,035 — 4,267,222 82,946,813 Accrued interest receivable ........................... 353,965 353,965 — 353,965 —
Financial liabilities: Noninterest-bearing deposits......................... $(32,256,668) (32,256,668) — (32,256,668) — Savings and interest-checking deposits......... (50,963,744) (50,963,744) — (50,963,744) — Time deposits ................................................ (6,124,254) (6,201,957) — (6,201,957) — Deposits at Cayman Islands office ................ (811,906) (811,906) — (811,906) — Short-term borrowings .................................. (4,398,378) (4,398,378) — (4,398,378) — Long-term borrowings .................................. (8,444,914) (8,385,289) — (8,385,289) — Accrued interest payable ............................... (95,274) (95,274) — (95,274) — Trading account liabilities............................. (178,125) (178,125) — (178,125) —
Other financial instruments: Commitments to originate real estate loans for sale .............................................. $ 7,712 7,712 — — 7,712 Commitments to sell real estate loans ........... (6,177) (6,177) — (6,177) — Other credit-related commitments................. (131,688) (131,688) — — (131,688)Interest rate swap agreements used for interest rate risk management ................................. 5,530 5,530 — 5,530 —
With the exception of marketable securities, certain off-balance sheet financial instruments and mortgage loans originated for sale, the Company’s financial instruments are not readily marketable and market prices do not exist. The Company, in attempting to comply with the provisions of GAAP that require disclosures of fair value of financial instruments, has not attempted to market its financial instruments to potential buyers, if any exist. Since negotiated prices in illiquid markets depend greatly upon the then present motivations of the buyer and seller, it is reasonable to assume that actual sales prices could vary widely from any estimate of fair value made without the benefit of negotiations. Additionally, changes in market interest rates can dramatically impact the value of financial instruments in a short period of time.
The Company does not believe that the estimated information presented herein is representative of the earnings power or value of the Company. The preceding analysis, which is inherently limited in depicting fair value, also does not consider any value associated with existing customer relationships nor the ability of the Company to create value through loan origination, deposit gathering or fee generating activities. Many of the estimates presented herein are based upon the use of highly subjective information and assumptions and, accordingly, the results may not be precise. Management believes that fair value estimates may not be comparable between financial institutions due to the wide range of permitted valuation techniques and numerous estimates which must be made. Furthermore, because the disclosed fair value amounts were estimated as of the balance sheet

180
date, the amounts actually realized or paid upon maturity or settlement of the various financial instruments could be significantly different.
21. Commitments and contingenciesIn the normal course of business, various commitments and contingent liabilities are outstanding. The following table presents the Company’s significant commitments. Certain of these commitments are not included in the Company’s consolidated balance sheet.
December 31 2019 2018 (In thousands)
Commitments to extend credit Home equity lines of credit..................................................................................... $ 5,442,160 5,484,197 Commercial real estate loans to be sold.................................................................. 164,076 229,401 Other commercial real estate .................................................................................. 9,029,608 7,556,722 Residential real estate loans to be sold ................................................................... 423,056 245,211 Other residential real estate..................................................................................... 448,375 219,351 Commercial and other............................................................................................. 16,170,731 14,363,803
Standby letters of credit................................................................................................ 2,441,432 2,326,991 Commercial letters of credit ......................................................................................... 41,059 55,808 Financial guarantees and indemnification contracts .................................................... 4,108,572 3,529,136 Commitments to sell real estate loans .......................................................................... 906,037 940,692
Commitments to extend credit are agreements to lend to customers, generally having fixed expiration dates or other termination clauses that may require payment of a fee. In addition to the amounts presented in the preceding table, the Company had discretionary funding commitments to commercial customers of $9.1 billion and $8.6 billion at December 31, 2019 and 2018, respectively, that the Company had the unconditional right to cancel prior to funding. Standby and commercial letters of credit are conditional commitments issued to guarantee the performance of a customer to a third party. Standby letters of credit generally are contingent upon the failure of the customer to perform according to the terms of the underlying contract with the third party, whereas commercial letters of credit are issued to facilitate commerce and typically result in the commitment being funded when the underlying transaction is consummated between the customer and a third party. The credit risk associated with commitments to extend credit and standby and commercial letters of credit is essentially the same as that involved with extending loans to customers and is subject to normal credit policies. Collateral may be obtained based on management’s assessment of the customer’s creditworthiness.
Financial guarantees and indemnification contracts are predominantly comprised of recourse obligations associated with sold loans and other guarantees and commitments. Included in financial guarantees and indemnification contracts are loan principal amounts sold with recourse in conjunction with the Company’s involvement in the Fannie Mae DUS program. The Company’s maximum credit risk for recourse associated with loans sold under this program totaled approximately $3.9 billion and $3.4 billion at December 31, 2019 and 2018, respectively.
Since many loan commitments, standby letters of credit, and guarantees and indemnification contracts expire without being funded in whole or in part, the contract amounts are not necessarily indicative of future cash flows.
The Company utilizes commitments to sell real estate loans to hedge exposure to changes in the fair value of real estate loans held for sale. Such commitments are considered derivatives and along

181
with commitments to originate real estate loans to be held for sale are recorded in the consolidated balance sheet at estimated fair market value. The Company is contractually obligated to repurchase previously sold residential real estate loans that do not ultimately meet investor sale criteria related to underwriting procedures or loan documentation. When required to do so, the Company may reimburse loan purchasers for losses incurred or may repurchase certain loans. The Company reduces residential mortgage banking revenues by an estimate for losses related to its obligations to loan purchasers. The amount of those charges is based on the volume of loans sold, the level of reimbursement requests received from loan purchasers and estimates of losses that may be associated with previously sold loans. At December 31, 2019, the Company believes that its obligation to loan purchasers was not material to the Company’s consolidated financial position.
Wilmington Trust, N.A., a wholly owned bank subsidiary of M&T, provides retirement services, including serving in certain trustee roles relating to Employee Stock Ownership Plans (“ESOPs”). Beginning in 2010, the U.S. Department of Labor (“DOL”) announced that it would increase its focus on ESOP transactions, particularly with regard to valuation issues relating to ESOP transactions. Beginning in late 2013, Wilmington Trust, N.A. began receiving requests for information and subpoenas relating to certain ESOP transactions for which it acted as trustee. In June 2016, Wilmington Trust, N.A. received a DOL subpoena seeking information on its global ESOP trustee business. In addition to these investigations, the DOL has commenced three lawsuits against Wilmington Trust, N.A. relating to its role as trustee of three ESOP transactions. In July 2019, Wilmington Trust, N.A. reached a settlement in principle with the DOL to resolve certain pending DOL ESOP matters. Although a formal settlement agreement has yet to be finalized and executed, the Company does not expect that the agreed-upon settlement will have a material incremental impact on the Company’s consolidated financial position or results of operations. Wilmington Trust, N.A. is also currently a defendant in five pending private party lawsuits relating to its role as trustee for five ESOP transactions. Under applicable transaction documents, Wilmington Trust, N.A. may be entitled to indemnification by the ESOP plan sponsors. These matters could result in damages, settlements, penalties, restitution, reputational damage or additional costs and expenses.
M&T and its subsidiaries are subject in the normal course of business to various pending and threatened legal proceedings and other matters in which claims for monetary damages are asserted. On an on-going basis management, after consultation with legal counsel, assesses the Company’s liabilities and contingencies in connection with such proceedings. For those matters where it is probable that the Company will incur losses and the amounts of the losses can be reasonably estimated, the Company records an expense and corresponding liability in its consolidated financial statements. To the extent the pending or threatened litigation could result in exposure in excess of that liability, the amount of such excess is not currently estimable. Although not considered probable, the range of reasonably possible losses for such matters in the aggregate, beyond the existing recorded liability, was between $0 and $50 million. Although the Company does not believe that the outcome of pending litigations will be material to the Company’s consolidated financial position, it cannot rule out the possibility that such outcomes will be material to the consolidated results of operations for a particular reporting period in the future.
22. Segment informationReportable segments have been determined based upon the Company’s internal profitability reporting system, which is organized by strategic business unit. Certain strategic business units have been combined for segment information reporting purposes where the nature of the products and services, the type of customer and the distribution of those products and services are similar. The

182
reportable segments are Business Banking, Commercial Banking, Commercial Real Estate, Discretionary Portfolio, Residential Mortgage Banking and Retail Banking.
The financial information of the Company’s segments was compiled utilizing the accounting policies described in note 1 with certain exceptions. The more significant of these exceptions are described herein. The Company allocates interest income or interest expense using a methodology that charges users of funds (assets) interest expense and credits providers of funds (liabilities) with income based on the maturity, prepayment and/or repricing characteristics of the assets and liabilities. A provision for credit losses is allocated to segments in an amount based largely on actual net charge-offs incurred by the segment during the period plus or minus an amount necessary to adjust the segment’s allowance for credit losses due to changes in loan balances. In contrast, the level of the consolidated provision for credit losses is determined using the methodologies described in notes 1 and 4. The net effects of these allocations are recorded in the “All Other” category. Indirect fixed and variable expenses incurred by certain centralized support areas are allocated to segments based on actual usage (for example, volume measurements) and other criteria. Certain types of administrative expenses and bankwide expense accruals (including amortization of core deposit and other intangible assets associated with acquisitions of financial institutions) are generally not allocated to segments. Income taxes are allocated to segments based on the Company’s marginal statutory tax rate adjusted for any tax-exempt income or non-deductible expenses. Equity is allocated to the segments based on regulatory capital requirements and in proportion to an assessment of the inherent risks associated with the business of the segment (including interest, credit and operating risk).
The management accounting policies and processes utilized in compiling segment financial information are highly subjective and, unlike financial accounting, are not based on authoritative guidance similar to GAAP. As a result, reported segment results are not necessarily comparable with similar information reported by other financial institutions. Furthermore, changes in management structure or allocation methodologies and procedures may result in changes in reported segment financial data.

183
Information about the Company’s segments is presented in the accompanying table. Income statement amounts are in thousands of dollars. Balance sheet amounts are in millions of dollars.
For the Years Ended December 31, 2019, 2018 and 2017 Business Banking Commercial Banking Commercial Real Estate Discretionary Portfolio 2019 2018 2017 2019 2018 2017 2019 2018 2017 2019 2018 2017
Net interest income(a) ............ $451,307 $434,579 $393,948 $ 828,888 $ 821,812 $ 809,301 $ 692,526 $ 665,220 $ 649,378 $ 209,807 $ 228,051 $ 277,095 Noninterest income ................ 113,855 111,600 112,512 289,558 288,908 283,447 214,970 183,955 169,966 26,919 (9,690) 23,851 565,162 546,179 506,460 1,118,446 1,110,720 1,092,748 907,496 849,175 819,344 236,726 218,361 300,946 Provision for credit losses ...... 16,501 10,916 15,598 25,580 8,976 11,876 1,537 3,159 (7,524) 3,608 6,683 31,119 Amortization of core deposit and other intangible assets..... — — — — — — 1,060 1,060 1,060 — — — Depreciation and other amortization......................... 412 382 393 554 496 509 25,560 25,852 24,410 263 187 279 Other noninterest expense ...... 319,136 305,340 294,493 384,013 364,102 339,936 240,736 217,387 207,493 52,901 65,393 76,021 Income (loss) before taxes...... 229,113 229,541 195,976 708,299 737,146 740,427 638,603 601,717 593,905 179,954 146,098 193,527 Income tax expense (benefit).... 60,617 61,279 80,043 187,835 198,229 303,556 152,977 148,807 229,770 36,342 29,872 58,559 Net income (loss) ................... $168,496 $168,262 $115,933 $ 520,464 $ 538,917 $ 436,871 $ 485,626 $ 452,910 $ 364,135 $ 143,612 $ 116,226 $ 134,968
Average total assets (in millions) ......................... $ 5,793 $ 5,631 $ 5,602 $ 28,142 $ 26,626 $ 26,573 $ 23,921 $ 22,885 $ 22,741 $ 29,081 $ 32,123 $ 37,203
Capital expenditures (in millions) ......................... $ 1 $ — $ — $ 2 $ — $ — $ — $ — $ 1 $ — $ 1 $ —
For the Years Ended December 31, 2019, 2018 and 2017
Residential Mortgage
Banking Retail Banking All Other Total 2019 2018 2017 2019 2018 2017 2019 2018 2017 2019 2018 2017
Net interest income(a) ............ $ 20,008 $ 13,933 $ 30,328 $1,389,788 $1,351,165 $1,210,066 $ 537,940 $ 557,542 $ 410,928 $4,130,264 $4,072,302 $3,781,044 Noninterest income ................ 393,372 305,560 321,589 327,562 324,228 329,833 695,443 651,439 609,945 2,061,679 1,856,000 1,851,143 413,380 319,493 351,917 1,717,350 1,675,393 1,539,899 1,233,383 1,208,981 1,020,873 6,191,943 5,928,302 5,632,187 Provision for credit losses ...... 382 (2,178) 1,254 122,135 112,572 107,412 6,257 (8,128) 8,265 176,000 132,000 168,000 Amortization of core deposit and other intangible assets..... — — — — — — 18,430 23,462 30,306 19,490 24,522 31,366 Depreciation and other amortization......................... 46,901 24,288 32,011 38,394 35,274 38,234 68,840 68,004 69,923 180,924 154,483 165,759 Other noninterest expense ...... 274,414 241,624 247,639 839,636 789,783 758,153 1,157,432 1,125,428 1,019,465 3,268,268 3,109,057 2,943,200 Income (loss) before taxes...... 91,683 55,759 71,013 717,185 737,764 636,100 (17,576) 215 (107,086) 2,547,261 2,508,240 2,323,862 Income tax expense (benefit) ... 19,355 10,272 25,446 189,611 196,467 258,934 (28,625) (54,766) (40,752) 618,112 590,160 915,556 Net income (loss) ................... $ 72,328 $ 45,487 $ 45,567 $ 527,574 $ 541,297 $ 377,166 $ 11,049 $ 54,981 $ (66,334) $1,929,149 $1,918,080 $1,408,306
Average total assets (in millions) ......................... $ 2,611 $ 2,161 $ 2,355 $ 15,083 $ 13,656 $ 12,702 $ 14,953 $ 13,877 $ 13,684 $ 119,584 $ 116,959 $ 120,860
Capital expenditures (in millions) ......................... $ 1 $ 1 $ — $ 76 $ 31 $ 34 $ 98 $ 65 $ 44 $ 178 $ 98 $ 79
(a) Net interest income is the difference between actual taxable-equivalent interest earned on assets and interest paid on liabilities by a segment and a funding charge (credit) based on the Company’s internal funds transfer pricing methodology. Segments are charged a cost to fund any assets (e.g. loans) and are paid a funding credit for any funds provided (e.g. deposits). The taxable-equivalent adjustment aggregated $22,863,000 in 2019, $21,897,000 in 2018 and $34,570,000 in 2017 and is eliminated in “All Other” net interest income and income tax expense (benefit).
The Business Banking segment provides deposit, lending, cash management and other financial services to small businesses and professionals through the Company’s banking office network and several other delivery channels, including business banking centers, telephone banking, Internet banking and automated teller machines. The Commercial Banking segment provides a wide range of credit products and banking services to middle-market and large commercial customers, mainly within the markets the Company serves. Among the services provided by this segment are commercial lending and leasing, letters of credit, deposit products and cash management services. The Commercial Real Estate segment provides credit services which are secured by various types of multifamily residential and commercial real estate and deposit services to its customers. Activities of this segment include the origination, sales and servicing of commercial real estate loans. Commercial real estate loans held for sale are included in the Commercial Real Estate Segment. The Discretionary Portfolio segment includes securities; residential real estate loans and other assets; short-term and long-term borrowed funds; brokered deposits; and Cayman Islands branch deposits. This segment also provides foreign exchange services to customers. The Residential Mortgage Banking segment originates and services residential real estate loans for consumers and sells

184
substantially all originated loans in the secondary market to investors or to the Discretionary Portfolio segment. The segment periodically purchases servicing rights to loans that have been originated by other entities. Residential real estate loans held for sale are included in the Residential Mortgage Banking segment. The Retail Banking segment offers a variety of services to consumers through several delivery channels that include banking offices, automated teller machines, and telephone, mobile and Internet banking. The “All Other” category includes other operating activities of the Company that are not directly attributable to the reported segments; the difference between the provision for credit losses and the calculated provision allocated to the reportable segments; goodwill and core deposit and other intangible assets resulting from acquisitions of financial institutions; merger-related gains and expenses resulting from acquisitions; the net impact of the Company’s internal funds transfer pricing methodology; eliminations of transactions between reportable segments; certain nonrecurring transactions; the residual effects of unallocated support systems and general and administrative expenses; and the impact of interest rate risk management strategies. The amount of intersegment activity eliminated in arriving at consolidated totals was included in the “All Other” category as follows:
Year Ended December 31 2019 2018 2017 (In thousands)
Revenues ............................................................................. $ (48,559) $ (41,285) $ (43,941)Expenses.............................................................................. (18,218) (24,660) (32,623)Income taxes (benefit)......................................................... (7,976) (4,371) (4,606)Net income (loss) ................................................................ (22,365) (12,254) (6,712)
The Company conducts substantially all of its operations in the United States. There are no transactions with a single customer that in the aggregate result in revenues that exceed ten percent of consolidated total revenues.

185
23. Regulatory mattersPayment of dividends by M&T’s banking subsidiaries is restricted by various legal and regulatory limitations. Dividends from any banking subsidiary to M&T are limited by the amount of earnings of the banking subsidiary in the current year and the preceding two years. For purposes of this test, at December 31, 2019, approximately $605 million was available for payment of dividends to M&T from banking subsidiaries. M&T may pay dividends and repurchase stock only in accordance with a capital plan that the Federal Reserve Board has not objected to.
Banking regulations prohibit extensions of credit by the subsidiary banks to M&T unless appropriately secured by assets. Securities of affiliates are not eligible as collateral for this purpose.
The bank subsidiaries are required to maintain reserves against certain deposit liabilities. During the maintenance periods that included December 31, 2019 and 2018, cash and due from banks and interest-earning deposits at banks included a daily average of $666 million and $684 million, respectively, for such purpose.
M&T and its subsidiary banks are required to comply with applicable capital adequacy regulations established by the federal banking agencies. Failure to meet minimum capital requirements can result in certain mandatory, and possibly additional discretionary, actions by regulators that, if undertaken, could have a material effect on the Company’s financial statements. Pursuant to the rules in effect as of December 31, 2019, the required minimum and well capitalized capital ratios are as follows:
Well Minimum Capitalized
● Common equity Tier 1 ("CET1") to risk-weighted assets ........................ 4.5% 6.5% ● Tier 1 capital to risk-weighted assets ........................................................ 6.0% 8.0% ● Total capital to risk-weighted assets ......................................................... 8.0% 10.0% ● Leverage — Tier 1 capital to average total assets, as defined .................. 4.0% 5.0%
In addition, capital regulations require a “capital conservation buffer” of 2.5% composed entirely of CET1 on top of the minimum risk-weighted asset ratios.
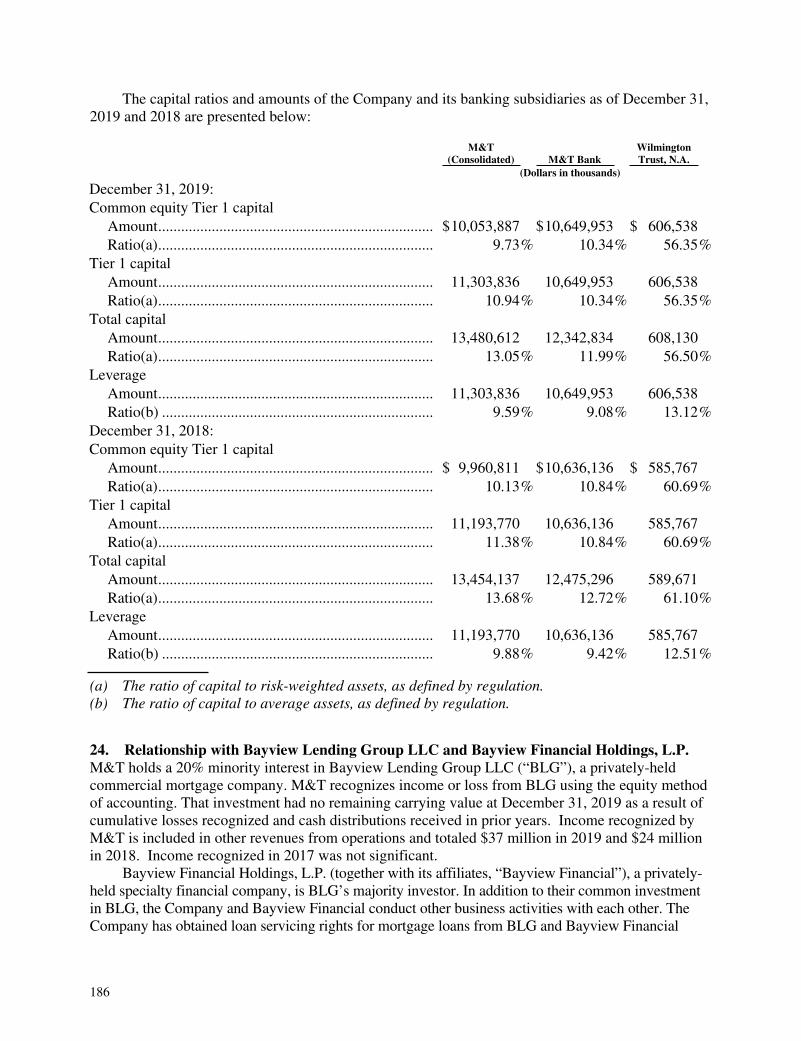
186
The capital ratios and amounts of the Company and its banking subsidiaries as of December 31, 2019 and 2018 are presented below:
M&T
(Consolidated) M&T Bank WilmingtonTrust, N.A.
(Dollars in thousands)
December 31, 2019: Common equity Tier 1 capital
Amount........................................................................ $10,053,887 $10,649,953 $ 606,538 Ratio(a)........................................................................ 9.73% 10.34% 56.35%
Tier 1 capital Amount........................................................................ 11,303,836 10,649,953 606,538 Ratio(a)........................................................................ 10.94% 10.34% 56.35%
Total capital Amount........................................................................ 13,480,612 12,342,834 608,130 Ratio(a)........................................................................ 13.05% 11.99% 56.50%
Leverage Amount........................................................................ 11,303,836 10,649,953 606,538 Ratio(b) ....................................................................... 9.59% 9.08% 13.12%
December 31, 2018: Common equity Tier 1 capital
Amount........................................................................ $ 9,960,811 $10,636,136 $ 585,767 Ratio(a)........................................................................ 10.13% 10.84% 60.69%
Tier 1 capital Amount........................................................................ 11,193,770 10,636,136 585,767 Ratio(a)........................................................................ 11.38% 10.84% 60.69%
Total capital Amount........................................................................ 13,454,137 12,475,296 589,671 Ratio(a)........................................................................ 13.68% 12.72% 61.10%
Leverage Amount........................................................................ 11,193,770 10,636,136 585,767 Ratio(b) ....................................................................... 9.88% 9.42% 12.51%
(a) The ratio of capital to risk-weighted assets, as defined by regulation.(b) The ratio of capital to average assets, as defined by regulation.
24. Relationship with Bayview Lending Group LLC and Bayview Financial Holdings, L.P.M&T holds a 20% minority interest in Bayview Lending Group LLC (“BLG”), a privately-held commercial mortgage company. M&T recognizes income or loss from BLG using the equity method of accounting. That investment had no remaining carrying value at December 31, 2019 as a result of cumulative losses recognized and cash distributions received in prior years. Income recognized by M&T is included in other revenues from operations and totaled $37 million in 2019 and $24 million in 2018. Income recognized in 2017 was not significant.
Bayview Financial Holdings, L.P. (together with its affiliates, “Bayview Financial”), a privately-held specialty financial company, is BLG’s majority investor. In addition to their common investment in BLG, the Company and Bayview Financial conduct other business activities with each other. The Company has obtained loan servicing rights for mortgage loans from BLG and Bayview Financial
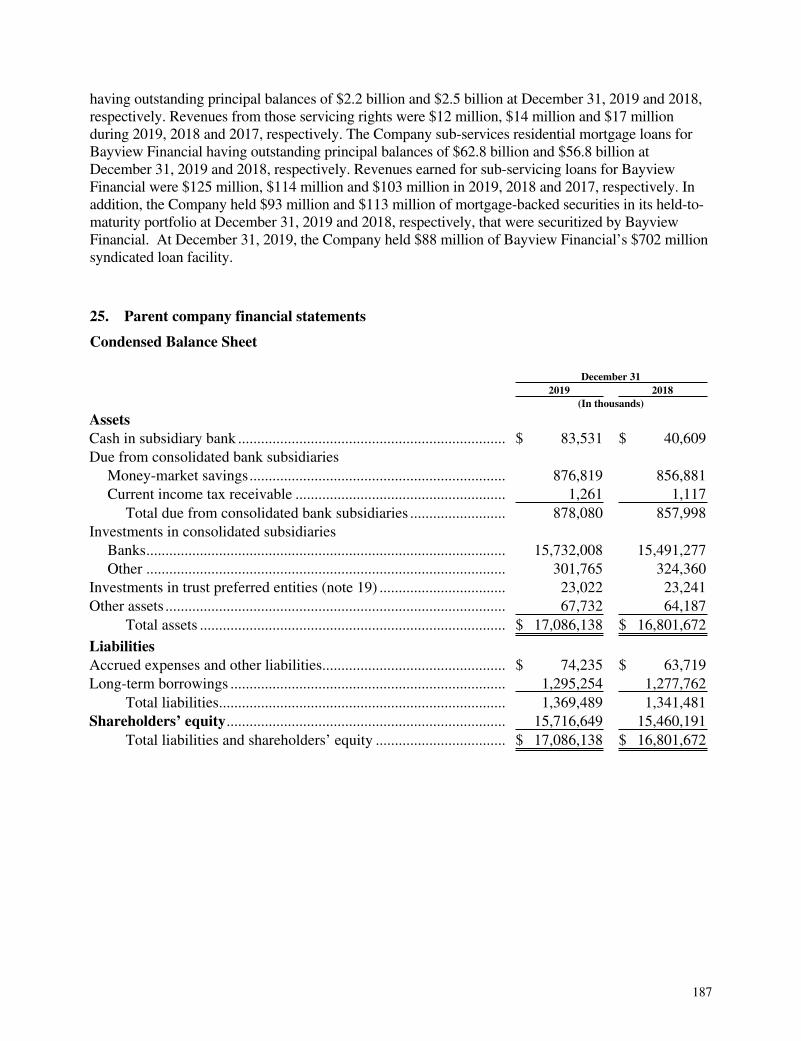
187
having outstanding principal balances of $2.2 billion and $2.5 billion at December 31, 2019 and 2018, respectively. Revenues from those servicing rights were $12 million, $14 million and $17 million during 2019, 2018 and 2017, respectively. The Company sub-services residential mortgage loans for Bayview Financial having outstanding principal balances of $62.8 billion and $56.8 billion at December 31, 2019 and 2018, respectively. Revenues earned for sub-servicing loans for Bayview Financial were $125 million, $114 million and $103 million in 2019, 2018 and 2017, respectively. In addition, the Company held $93 million and $113 million of mortgage-backed securities in its held-to-maturity portfolio at December 31, 2019 and 2018, respectively, that were securitized by Bayview Financial. At December 31, 2019, the Company held $88 million of Bayview Financial’s $702 million syndicated loan facility.
25. Parent company financial statements
Condensed Balance Sheet
December 31 2019 2018 (In thousands)
Assets Cash in subsidiary bank ...................................................................... $ 83,531 $ 40,609 Due from consolidated bank subsidiaries
Money-market savings................................................................... 876,819 856,881 Current income tax receivable ....................................................... 1,261 1,117
Total due from consolidated bank subsidiaries ......................... 878,080 857,998 Investments in consolidated subsidiaries
Banks.............................................................................................. 15,732,008 15,491,277 Other .............................................................................................. 301,765 324,360
Investments in trust preferred entities (note 19) ................................. 23,022 23,241 Other assets ......................................................................................... 67,732 64,187
Total assets ................................................................................ $ 17,086,138 $ 16,801,672
Liabilities Accrued expenses and other liabilities................................................ $ 74,235 $ 63,719 Long-term borrowings ........................................................................ 1,295,254 1,277,762
Total liabilities........................................................................... 1,369,489 1,341,481 Shareholders’ equity......................................................................... 15,716,649 15,460,191
Total liabilities and shareholders’ equity .................................. $ 17,086,138 $ 16,801,672

188
Condensed Statement of Income
Year Ended December 31 2019 2018 2017 (In thousands, except per share)
Income Dividends from consolidated bank subsidiaries.................. $ 2,025,000 $ 1,250,000 $ 1,540,000 Equity in earnings of Bayview Lending Group LLC.......... 36,740 23,500 352 Other income....................................................................... 7,216 2,417 9,493
Total income................................................................... 2,068,956 1,275,917 1,549,845 Expense Interest on long-term borrowings........................................ 51,938 36,354 21,591 Other expense...................................................................... 25,236 23,894 19,636
Total expense.................................................................. 77,174 60,248 41,227 Income before income taxes and equity in undistributed income of subsidiaries...................................................... 1,991,782 1,215,669 1,508,618 Income tax credits ............................................................... 8,313 8,446 26,453 Income before equity in undistributed income of subsidiaries ...................................................................... 2,000,095 1,224,115 1,535,071 Equity in undistributed income of subsidiaries Net income of subsidiaries .................................................. 1,954,054 1,943,965 1,413,235 Less: dividends received ..................................................... (2,025,000) (1,250,000) (1,540,000)Equity in undistributed income of subsidiaries................... (70,946) 693,965 (126,765)Net income........................................................................... $ 1,929,149 $ 1,918,080 $ 1,408,306
Net income per common share Basic ............................................................................... $ 13.76 $ 12.75 $ 8.72 Diluted ............................................................................ 13.75 12.74 8.70

189
Condensed Statement of Cash Flows
Year Ended December 31 2019 2018 2017 (In thousands)
Cash flows from operating activities Net income ............................................................................. $ 1,929,149 $ 1,918,080 $ 1,408,306 Adjustments to reconcile net income to net cash provided by operating activities
Equity in undistributed income of subsidiaries ................. 70,946 (693,965) 126,765 Provision for deferred income taxes.................................. 5,263 4,949 4,543 Net change in accrued income and expense ...................... (34,525) (8,242) (170)Gain on sale of assets ........................................................ — — (2,995)Net cash provided by operating activities.......................... 1,970,833 1,220,822 1,536,449
Cash flows from investing activities Proceeds from sales or maturities of investment securities ........................................................... 100 — — Other, net ................................................................................ 51,235 29,933 12,407
Net cash provided by investing activities .......................... 51,335 29,933 12,407 Cash flows from financing activities Purchases of treasury stock .................................................... (1,349,785) (2,194,396) (1,205,905)Dividends paid — common.................................................... (552,138) (510,382) (457,402)Dividends paid — preferred ................................................... (67,454) (72,521) (72,734)Proceeds from long-term borrowings..................................... — 748,595 — Redemption of Series A and Series C preferred stock..................................................................... (381,500) — — Proceeds from issuance of Series G preferred stock .............. 396,000 — — Other, net ................................................................................ (4,431) 45,913 34,524
Net cash used by financing activities ................................ (1,959,308) (1,982,791) (1,701,517)Net increase (decrease) in cash and cash equivalents ............ 62,860 (732,036) (152,661)Cash and cash equivalents at beginning of year..................... 897,490 1,629,526 1,782,187 Cash and cash equivalents at end of year ............................... $ 960,350 $ 897,490 $ 1,629,526
Supplemental disclosure of cash flow information Interest received during the year ............................................ $ 1,752 $ 2,219 $ 2,313 Interest paid during the year................................................... 49,451 17,482 18,498 Income taxes received during the year ................................... 6,251 6,362 21,740

190
26. Recent accounting developmentsThe following table provides a description of accounting standards that were adopted by the Company in 2019 as well as standards that are not effective that could have an impact to M&T’s consolidated financial statements upon adoption.
Standard DescriptionRequired date
of adoption Effect on consolidated financial statements
Standards Adopted in 2019
Leases The new guidance requires lessees to record a right-of-use asset and a lease liability for all leases with a term greater than 12 months. While the guidance requires all leases to be recognized in the balance sheet, there continues to be a differentiation between finance leases and operating leases for purposes of income statement recognition and cash flow statement presentation. For finance leases, interest on the lease liability and amortization of the right-of-use asset is recognized separately in the statement of income. Repayments of principal on those lease liabilities are classified within financing activities and payments of interest on the lease liability are classified within operating activities in the statement of cash flows. For operating leases, a single lease cost is recognized in the statement of income and allocated over the lease term, generally on a straight-line basis. All cash payments are presented within operating activities in the statement of cash flows. The accounting applied by lessors is largely unchanged, however, the guidance eliminates the accounting model for leveraged leases for leases that commence after the effective date of the guidance.
January 1, 2019 The Company adopted the guidance on January 1, 2019 and applied the guidance retrospectively at the beginning of the period of adoption. The Company occupies certain banking offices and uses certain equipment under noncancelable operating lease agreements which prior to the adoption of the guidance were not reflected in its consolidated balance sheet. Upon adoption, the Company recognized a right-of-use asset of $394 million and increased liabilities by $399 million as a result of recognizing lease liabilities in its consolidated balance sheet. The new guidance did not have a material impact on the Company’s consolidated statement of income.
Premium Amortization on Purchased Callable Debt Securities
The amended guidance requires the premium on callable debt securities to be amortized to the earliest call date. The amendments do not require an accounting change for securities held at a discount; the discount continues to be amortized to maturity.
January 1, 2019 The Company adopted the amended guidance effective January 1, 2019 and applied the modified retrospective approach for reporting purposes. The adoption did not have a material effect on the Company’s consolidated financial position nor on its results of operations.

191
Standard DescriptionRequired date
of adoption Effect on consolidated financial statements
Standards Not Yet Adopted as of December 31, 2019
Measurement of Credit Losses on Financial Instruments
The amended guidance replaces the incurred loss model for determining the allowance for credit losses. The guidance requires financial assets measured at amortized cost to be presented at the net amount expected to be collected. The allowance for credit losses will represent a valuation account that is deducted from the amortized cost basis of the financial assets to present their net carrying value at the amount expected to be collected. The income statement will reflect the measurement of credit losses for newly recognized financial assets as well as expected increases or decreases of expected credit losses that have taken place during the period. When determining the allowance, expected credit losses over the contractual term of the financial asset(s) (taking into account prepayments) will be estimated considering relevant information about past events, current conditions, and reasonable and supportable forecasts that affect the collectibility of the reported amount. The amended guidance also requires recording an allowance for credit losses for purchased financial assets with a more-than-insignificant amount of credit deterioration since origination. The initial allowance for these assets will be added to the purchase price at acquisition rather than being reported as an expense. Subsequent changes in the allowance will be recorded through the income statement as an expense adjustment. In addition, the amended guidance requires credit losses relating to available-for-sale debt securities to be recorded through an allowance for credit losses. The calculation of credit losses for available-for-sale securities will be similar to how it is determined under existing guidance.
January 1, 2020 The Company has completed its development, validation, and implementation of models and processes used to estimate current expected credit losses as required by the credit losses guidance. The Company’s approach for estimating current expected credit losses for loans includes utilizing macro-economic assumptions to project losses over a two-year reasonable and supportable forecast period. Subsequent to the forecast period, the Company reverts to longer term historical loss experience to estimate expected credit losses over the remaining contractual life. Based on portfolio composition, current economic conditions, and reasonable and supportable forecasts of future conditions, the Company recognized an increase to the allowance for credit losses of $132 million upon adoption of the standard on January 1, 2020 as compared with the allowance for credit losses recognized on its consolidated balance sheet at December 31, 2019.
The effect on the allowance for credit losses is primarily attributable to increases in reserves for residential mortgage loans and consumer loans, which generally have longer estimated lives as compared with commercial and commercial real estate loans. The adoption did not have a material effect on the allowance for credit losses on held-to-maturity debt securities as most of this portfolio consists of U.S. Treasury and federal agency securities.
Simplifying the Test for Goodwill Impairment
The amended guidance eliminates step 2 from the goodwill impairment test.
January 1, 2020 The Company adopted the amended guidance effective January 1, 2020 using a prospective transition method and will incorporate the guidance as necessary when circumstances arise for the guidance to be utilized. The Company does not expect the guidance will have a material impact on its consolidated financial statements, unless at some point in the future one of its reporting units were to fail step 1 of the goodwill impairment test.
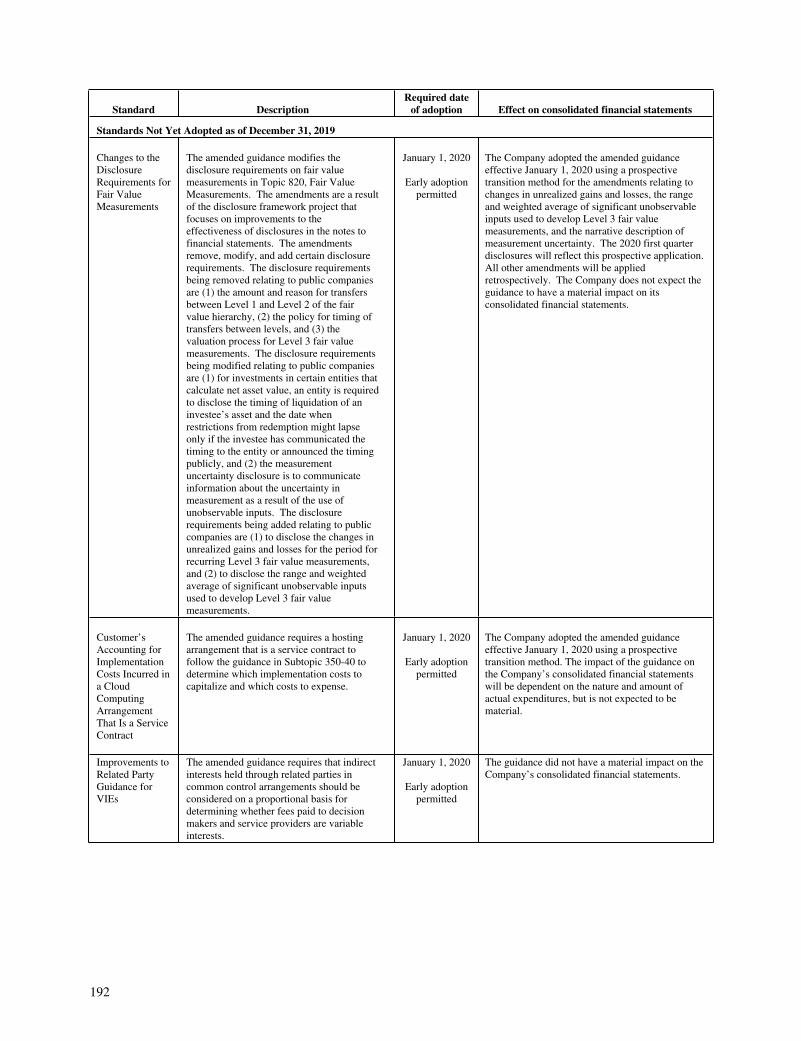
192
Standard DescriptionRequired date
of adoption Effect on consolidated financial statements
Standards Not Yet Adopted as of December 31, 2019
Changes to the Disclosure Requirements for Fair Value Measurements
The amended guidance modifies the disclosure requirements on fair value measurements in Topic 820, Fair Value Measurements. The amendments are a result of the disclosure framework project that focuses on improvements to the effectiveness of disclosures in the notes to financial statements. The amendments remove, modify, and add certain disclosure requirements. The disclosure requirements being removed relating to public companies are (1) the amount and reason for transfers between Level 1 and Level 2 of the fair value hierarchy, (2) the policy for timing of transfers between levels, and (3) the valuation process for Level 3 fair value measurements. The disclosure requirements being modified relating to public companies are (1) for investments in certain entities that calculate net asset value, an entity is required to disclose the timing of liquidation of an investee’s asset and the date when restrictions from redemption might lapse only if the investee has communicated the timing to the entity or announced the timing publicly, and (2) the measurement uncertainty disclosure is to communicate information about the uncertainty in measurement as a result of the use of unobservable inputs. The disclosure requirements being added relating to public companies are (1) to disclose the changes in unrealized gains and losses for the period for recurring Level 3 fair value measurements, and (2) to disclose the range and weighted average of significant unobservable inputs used to develop Level 3 fair value measurements.
January 1, 2020
Early adoption permitted
The Company adopted the amended guidance effective January 1, 2020 using a prospective transition method for the amendments relating to changes in unrealized gains and losses, the range and weighted average of significant unobservable inputs used to develop Level 3 fair value measurements, and the narrative description of measurement uncertainty. The 2020 first quarter disclosures will reflect this prospective application. All other amendments will be applied retrospectively. The Company does not expect the guidance to have a material impact on its consolidated financial statements.
Customer’s Accounting for Implementation Costs Incurred in a Cloud Computing Arrangement That Is a Service Contract
The amended guidance requires a hosting arrangement that is a service contract to follow the guidance in Subtopic 350-40 to determine which implementation costs to capitalize and which costs to expense.
January 1, 2020
Early adoption permitted
The Company adopted the amended guidance effective January 1, 2020 using a prospective transition method. The impact of the guidance on the Company’s consolidated financial statements will be dependent on the nature and amount of actual expenditures, but is not expected to be material.
Improvements to Related Party Guidance for VIEs
The amended guidance requires that indirect interests held through related parties in common control arrangements should be considered on a proportional basis for determining whether fees paid to decision makers and service providers are variable interests.
January 1, 2020
Early adoption permitted
The guidance did not have a material impact on the Company’s consolidated financial statements.

193
Standard DescriptionRequired date
of adoption Effect on consolidated financial statements
Standards Not Yet Adopted as of December 31, 2019
Changes to the Disclosure Requirements for Defined Benefit Plans
The amended guidance modifies the disclosure requirements for employers that sponsor defined benefit pension or other postretirement plans. The disclosure requirements being removed relating to public companies are (1) the amounts in accumulated other comprehensive income expected to be recognized as components of net periodic benefit cost over the next fiscal year, (2) the amount and timing of plan assets expected to be returned to the employer, (3) the 2001 disclosure requirement relating to Japanese Welfare Pension Insurance Law, (4) related party disclosures about the amount of future annual benefits covered by insurance, and (5) the effects of a one-percentage-point change in assumed health care cost trends on the benefit cost and obligation. The disclosure requirements being added relating to public companies are (1) the weighted-average interest crediting rates for cash balance plans , and (2) an explanation of the reasons for significant gains and losses related to changes in the benefit obligation for the period.
January 1, 2021
Early adoption permitted
The amendments should be applied retrospectively. The Company does not expect the guidance to have a material impact on its consolidated financial statements.
Clarifying the Interactions Between Equity Securities, Equity Method and Joint Ventures, and Derivatives and Hedging
The amendments clarify the following guidance:1. That an entity should consider observable transactions that require it to either apply or discontinue the equity method of accounting for the purposes of applying the measurement alternative in the equity securities investments guidance immediately before applying or upon discontinuing the equity method of accounting.2. For the purpose of applying the derivatives and hedging guidance an entity should not consider whether, upon the settlement of a forward contract or exercise of a purchased option, individually or with existing investments, the underlying securities would be accounted for under the equity method of accounting or the fair value option in accordance with the financial instruments guidance. An entity also would evaluate the remaining characteristics in the derivatives and hedging guidance to determine the accounting for those forward contracts and purchased options.
January 1, 2021
Early adoption permitted
The amendments should be applied on a prospective basis. The Company does not expect the guidance will have a material impact on its consolidated financial statements.

194
Standard DescriptionRequired date
of adoption Effect on consolidated financial statements
Standards Not Yet Adopted as of December 31, 2019Simplifying the Accounting for Income Taxes
The amendments remove the following exceptions for accounting for income taxes: 1. Exception to the incremental approach for intraperiod tax allocation when there is a loss from continuing operations and income or a gain from other items (for example, discontinued operations or other comprehensive income) 2. Exception to the requirement to recognize a deferred tax liability for equity method investments when a foreign subsidiary becomes an equity method investment 3. Exception to the ability not to recognize a deferred tax liability for a foreign subsidiary when a foreign equity method investment becomes a subsidiary 4. Exception to the general methodology for calculating income taxes in an interim period when a year-to-date loss exceeds the anticipated loss for the year.
The amendments also simplify the accounting for income taxes by doing the following: 1. Requiring that an entity recognize a franchise tax (or similar tax) that is partially based on income as an income-based tax and account for any incremental amount incurred as a non-income-based tax. 2. Requiring that an entity evaluate when a step up in the tax basis of goodwill should be considered part of the business combination in which the book goodwill was originally recognized and when it should be considered a separate transaction. 3. Specifying that an entity is not required to allocate the consolidated amount of current and deferred tax expense to a legal entity that is not subject to tax in its separate financial statements. However, an entity may elect to do so (on an entity-by-entity basis) for a legal entity that is both not subject to tax and disregarded by the taxing authority. 4. Requiring that an entity reflect the effect of an enacted change in tax laws or rates in the annual effective tax rate computation in the interim period that includes the enactment date. 5. Making minor Codification improvements for income taxes related to employee stock ownership plans and investments in qualified affordable housing projects accounted for using the equity method.
January 1, 2021
Early adoption permitted
The amendments related to separate financial statements of legal entities that are not subject to tax should be applied on a retrospective basis for all periods presented. The amendments related to changes in ownership of foreign equity method investments or foreign subsidiaries should be applied on a modified retrospective basis through a cumulative-effect adjustment to retained earnings as of the beginning of the fiscal year of adoption. The amendments related to franchise taxes that are partially based on income should be applied on either a retrospective basis for all periods presented or a modified retrospective basis through a cumulative-effect adjustment to retained earnings as of the beginning of the fiscal year of adoption. All other amendments should be applied on a prospective basis.Early adoption of the amendments in an interim period would require recognition of any adjustments as of the beginning of the annual period that includes that interim period. Additionally, an early adoption election would require adoption of all the amendments in the same period. The Company is evaluating the impact that the guidance will have on its consolidated financial statements.

195
Item 9. Changes in and Disagreements with Accountants on Accounting and Financial Disclosure.
None.
Item 9A. Controls and Procedures.
(a) Evaluation of disclosure controls and procedures. Based upon their evaluation of the effectiveness of M&T’s disclosure controls and procedures (as defined in Exchange Act rules 13a-15(e) and 15d-15(e)), René F. Jones, Chairman of the Board and Chief Executive Officer, and Darren J. King, Executive Vice President and Chief Financial Officer, concluded that M&T’s disclosure controls and procedures were effective as of December 31, 2019.
(b) Management’s annual report on internal control over financial reporting. Included under the heading “Report on Internal Control Over Financial Reporting” at Item 8 of this Annual Report on Form 10-K.
(c) Attestation report of the registered public accounting firm. Included under the heading “Report of Independent Registered Public Accounting Firm” at Item 8 of this Annual Report on Form 10-K.
(d) Changes in internal control over financial reporting. M&T regularly assesses the adequacy of its internal control over financial reporting and enhances its controls in response to internal control assessments and internal and external audit and regulatory recommendations. No changes in internal control over financial reporting have been identified in connection with the evaluation of disclosure controls and procedures during the quarter ended December 31, 2019 that have materially affected, or are reasonably likely to materially affect, M&T’s internal control over financial reporting.
Item 9B. Other Information.
None.
PART III
Item 10. Directors, Executive Officers and Corporate Governance.
The information required to be furnished pursuant to Items 401, 405, 406 and 407(c)(3), (d)(4) and (d)(5) of Regulation S-K will be included in M&T’s Proxy Statement for the 2020 Annual Meeting of Shareholders, to be filed with the SEC pursuant to Regulation 14A on or about March 9, 2020 (the “2020 Proxy Statement”). The information concerning M&T’s directors will appear under the caption “NOMINEES FOR DIRECTOR” in the 2020 Proxy Statement. The information concerning M&T’s Code of Ethics for CEO and Senior Financial Officers will appear under the caption “CORPORATE GOVERNANCE OF M&T BANK CORPORATION” in the 2020 Proxy Statement. The information regarding M&T’s Audit Committee will appear under the caption “CORPORATE GOVERNANCE OF M&T BANK CORPORATION.” Such information is incorporated herein by reference.
The information concerning M&T’s executive officers is presented under the caption “Executive Officers of the Registrant” contained in Part I of this Annual Report on Form 10-K.

196
Item 11. Executive Compensation.
The information required to be furnished pursuant to Items 402 and 407 of Regulation S-K will appear under the captions “COMPENSATION DISCUSSION AND ANALYSIS,” “EXECUTIVE COMPENSATION,” “DIRECTOR COMPENSATION,” “NOMINATION, COMPENSATION AND GOVERNANCE COMMITTEE INTERLOCKS AND INSIDER PARTICIPATION,” and “NOMINATION, COMPENSATION AND GOVERNANCE COMMITTEE REPORT” in the 2020 Proxy Statement. Such information is incorporated herein by reference.
Item 12. Security Ownership of Certain Beneficial Owners and Management and Related Stockholder Matters.
The information required to be furnished pursuant to Item 403 of Regulation S-K will appear under the caption “STOCK OWNERSHIP INFORMATION” in the 2020 Proxy Statement. Such information is incorporated herein by reference.
The information required to be furnished pursuant to Item 201(d) concerning equity compensation plans is presented under the caption “Market for Registrant’s Common Equity, Related Stockholder Matters and Issuer Purchases of Equity Securities” contained in Part II, Item 5 of this Annual Report on Form 10-K.
Item 13. Certain Relationships and Related Transactions, and Director Independence.
The information required to be furnished pursuant to Items 404 and 407 of Regulation S-K will appear under the caption “TRANSACTIONS WITH DIRECTORS AND EXECUTIVE OFFICERS” and “CORPORATE GOVERNANCE OF M&T BANK CORPORATION” in the 2020 Proxy Statement. Such information is incorporated herein by reference.
Item 14. Principal Accountant Fees and Services.
The information required to be furnished by Item 9 of Schedule 14A will appear under the caption “PROPOSAL TO RATIFY THE APPOINTMENT OF PRICEWATERHOUSECOOPERS LLP AS THE INDEPENDENT REGISTERED PUBLIC ACCOUNTING FIRM OF M&T BANK CORPORATION FOR THE YEAR ENDING DECEMBER 31, 2020” in the 2020 Proxy Statement. Such information is incorporated herein by reference.
PART IV
Item 15. Exhibits and Financial Statement Schedules.
(a) Financial statements and financial statement schedules filed as part of this Annual Report on Form 10-K. See Part II, Item 8. “Financial Statements and Supplementary Data.” Financial statement schedules are not required or are inapplicable, and therefore have been omitted.
(b) Exhibits required by Item 601 of Regulation S-K. The exhibits listed have been previously filed, are filed herewith or are incorporated herein by reference to other filings.
3.1 Restated Certificate of Incorporation of M&T Bank Corporation dated November 18, 2010. Incorporated by reference to Exhibit 3.1 to the Form 8-K dated November 19, 2010 (File No. 1-9861).

197
3.2 Amended and Restated Bylaws of M&T Bank Corporation, effective April 17, 2018. Incorporated by reference to Exhibit 3.2 to the Form 8-K dated April 20, 2018 (File No. 1-9861).
3.3 Certificate of Amendment to Certificate of Incorporation with respect to Perpetual 6.875% Non-Cumulative Preferred Stock, Series D, dated May 26, 2011. Incorporated by reference to Exhibit 3.1 of M&T Bank Corporation’s Form 8-K dated May 26, 2011 (File No. 1-9861).
3.4 Certificate of Amendment to Restated Certificate of Incorporation of M&T Bank Corporation, dated April 19, 2013. Incorporated by reference to Exhibit 3.1 to the Form 8-K dated April 22, 2013 (File No. 1-9861).
3.5 Certificate of Amendment to Restated Certificate of Incorporation of M&T Bank Corporation, dated February 11, 2014. Incorporated by reference to Exhibit 3.1 to the Form 8-K dated February 11, 2014 (File No. 1-9861).
3.6 Certificate of Amendment to Certificate of Incorporation with respect to Perpetual Fixed-to-Floating Rate Non-Cumulative Preferred Stock, Series F, dated October 27, 2016. Incorporated by reference to Exhibit 3.1 of M&T Bank Corporation’s Form 8-K dated October 28, 2016 (File No. 1-9861).
3.7 Certificate of Amendment to Certificate of Incorporation of M&T Bank Corporation with respect to Perpetual 5.0% Fixed-Rate Reset Non-Cumulative Preferred Stock, Series G, dated July 29, 2019. Incorporated by reference to Exhibit 3.1 of M&T Bank Corporation’s Form 8-K dated July 30, 2019 (File No. 1-9861).
4.1 There are no instruments with respect to long-term debt of M&T Bank Corporation and its subsidiaries that involve securities authorized under the instrument in an amount exceeding 10 percent of the total assets of M&T Bank Corporation and its subsidiaries on a consolidated basis. M&T Bank Corporation agrees to provide the SEC with a copy of instruments defining the rights of holders of long-term debt of M&T Bank Corporation and its subsidiaries on request.
10.1 M&T Bank Corporation Annual Executive Incentive Plan. Incorporated by reference to Exhibit No. 10.3 to the Form 10-Q for the quarter ended June 30, 1998 (File No. 1-9861).*
10.2 Supplemental Deferred Compensation Agreement between Manufacturers and Traders Trust Company and Brian E. Hickey dated as of July 21, 1994, as amended. Incorporated by reference to Exhibit 10.2 to the Form 10-K for the year ended December 31, 2016 (File No. 1-9861).*
10.3 M&T Bank Corporation Supplemental Pension Plan, as amended and restated. Incorporated by reference to Exhibit 10.1 to the Form 10-Q for the quarter ended March 31, 2016 (File No. 1-9861).*
10.4 Amendment No. 1 to M&T Bank Corporation Supplemental Pension Plan. Incorporated by reference to Exhibit 10.4 of M&T Bank Corporation’s Form 10-K for the year ended December 31, 2018 (File No. 1-9861).
10.5 Amendment No. 2 to M&T Bank Corporation Supplemental Pension Plan.. Incorporated by reference to Exhibit 10.5 of M&T Bank Corporation’s Form 10-K for the year ended December 31, 2018 (File No. 1-9861).
10.6 M&T Bank Corporation Supplemental Retirement Savings Plan. Incorporated by reference to Exhibit 10.2 to the Form 10-Q for the quarter ended March 31, 2016 (File No. 1-9861).*
10.7 Amendment No. 1 to M&T Bank Corporation Supplemental Retirement Plan. Incorporated by reference to Exhibit 10.7 of M&T Bank Corporation’s Form 10-K for the year ended December 31, 2018 (File No. 1-9861).

198
10.8 Amendment No. 2 to M&T Bank Corporation Supplemental Retirement Plan. Incorporated by reference to Exhibit 10.8 of M&T Bank Corporation’s Form 10-K for the year ended December 31, 2018 (File No. 1-9861).
10.9 M&T Bank Corporation Deferred Bonus Plan, as amended and restated. Incorporated by reference to Exhibit 10.6 to the Form 10-K for the year ended December 31, 2016 (File No. 1-9861).*
10.10 M&T Bank Corporation 2008 Directors’ Stock Plan, as amended. Incorporated by reference to Exhibit 4.1 to the Form S-8 dated October 19, 2012 (File No. 333-184504).*
10.11 M&T Bank Corporation Employee Stock Purchase Plan. Incorporated by reference to Exhibit 10.22 to the Form 10-K for the year ended December 31, 2012 (File No. 1-9861).*
10.12 M&T Bank Corporation 2009 Equity Incentive Compensation Plan. Incorporated by reference to Appendix A to the Proxy Statement of M&T Bank Corporation dated March 5, 2015 (File No. 1-9861).*
10.13 M&T Bank Corporation Form of Restricted Stock Award Agreement. Incorporated by reference to Exhibit 10.25 to the Form 10-K for the year ended December 31, 2013 (File No. 1-9861).*
10.14 M&T Bank Corporation Form of Restricted Stock Unit Award Agreement. Incorporated by reference to Exhibit 10.26 to the Form 10-K for the year ended December 31, 2013 (File No. 1-9861).*
10.15 M&T Bank Corporation Form of Performance-Vested Restricted Stock Unit Award Agreement. Incorporated by reference to Exhibit 10.27 to the Form 10-K for the year ended December 31, 2013 (File No. 1-9861).*
10.16 M&T Bank Corporation Form of Performance-Vested Restricted Stock Unit Award Agreement (for named executive officers (“NEOs”) subject to Section 162 (m) of the Internal Revenue Code of 1986, as amended from time to time). Incorporated by reference to Exhibit 10.1 to the Form 10-Q for the quarter ended March 31, 2014 (File No. 1-9861).*
10.17 Hudson City Bancorp, Inc. Amended and Restated 2011 Stock Incentive Plan. Incorporated by reference to Exhibit 4.6 to the Form S-8 dated November 2, 2015 (File No. 333-184411).*
10.18 Hudson City Bancorp, Inc. 2006 Stock Incentive Plan. Incorporated by reference to Exhibit 4.7 to the Form S-8 dated November 2, 2015 (File No. 333-184411).*
10.19 M&T Bank Corporation 2019 Equity Incentive Compensation Plan. Incorporated by reference to Appendix A to the Proxy Statement of M&T Bank Corporation dated March 7, 2019 (File No. 1-9861).*
10.20 M&T Bank Corporation Form of Performance Share Unit Award Agreement. Incorporated by reference to Exhibit 10.1 to M&T Bank Corporation’s Form 10-Q for the quarter ended March 31, 2019 (File No. 1-9861).*
11.1 Statement re: Computation of Earnings Per Common Share. Incorporated by reference to note 14 of Notes to Financial Statements filed herewith in Part II, Item 8, “Financial Statements and Supplementary Data.”
21.1 Subsidiaries of the Registrant. Incorporated by reference to the caption “Subsidiaries” contained in Part I, Item 1 hereof.
23.1 Consent of PricewaterhouseCoopers LLP re: Registration Statements on Form S-8 (Nos. 33-32044, 333-43175, 333-16077, 333-40640, 333-84384, 333-127406, 333-150122, 333-164015, 333-163992, 333-160769, 333-159795, 333-170740, 333-189099, 333-184504, 333-189097, 333-184411 and 333-231217) and Form S-3 (No. 333-227644). Filed herewith.

199
31.1 Certification of Chief Executive Officer under Section 302 of the Sarbanes-Oxley Act of 2002. Filed herewith.
31.2 Certification of Chief Financial Officer under Section 302 of the Sarbanes-Oxley Act of 2002. Filed herewith.
32.1 Certification of Chief Executive Officer under 18 U.S.C. §1350 pursuant to Section 906 of the Sarbanes-Oxley Act of 2002. Filed herewith.
32.2 Certification of Chief Financial Officer under 18 U.S.C. §1350 pursuant to Section 906 of the Sarbanes-Oxley Act of 2002. Filed herewith.
101.INS Inline XBRL Instance Document – the instance document does not appear in the Interactive Data File because its XBRL tags are embedded within the Inline XBRL document.
101.SCH Inline XBRL Taxonomy Extension Schema. Filed herewith.101.CAL Inline XBRL Taxonomy Extension Calculation Linkbase. Filed herewith.101.LAB Inline XBRL Taxonomy Extension Label Linkbase. Filed herewith.101.PRE Inline XBRL Taxonomy Extension Presentation Linkbase. Filed herewith.101.DEF Inline XBRL Taxonomy Definition Linkbase. Filed herewith.104 The cover page from M&T Bank Corporation’s Annual Report on Form 10-K for the year
ended December 31, 2019 has been formatted in Inline XBRL.
* Management contract or compensatory plan or arrangement.
(c) Additional financial statement schedules. None.
Item 16. Form 10-K Summary.
None.
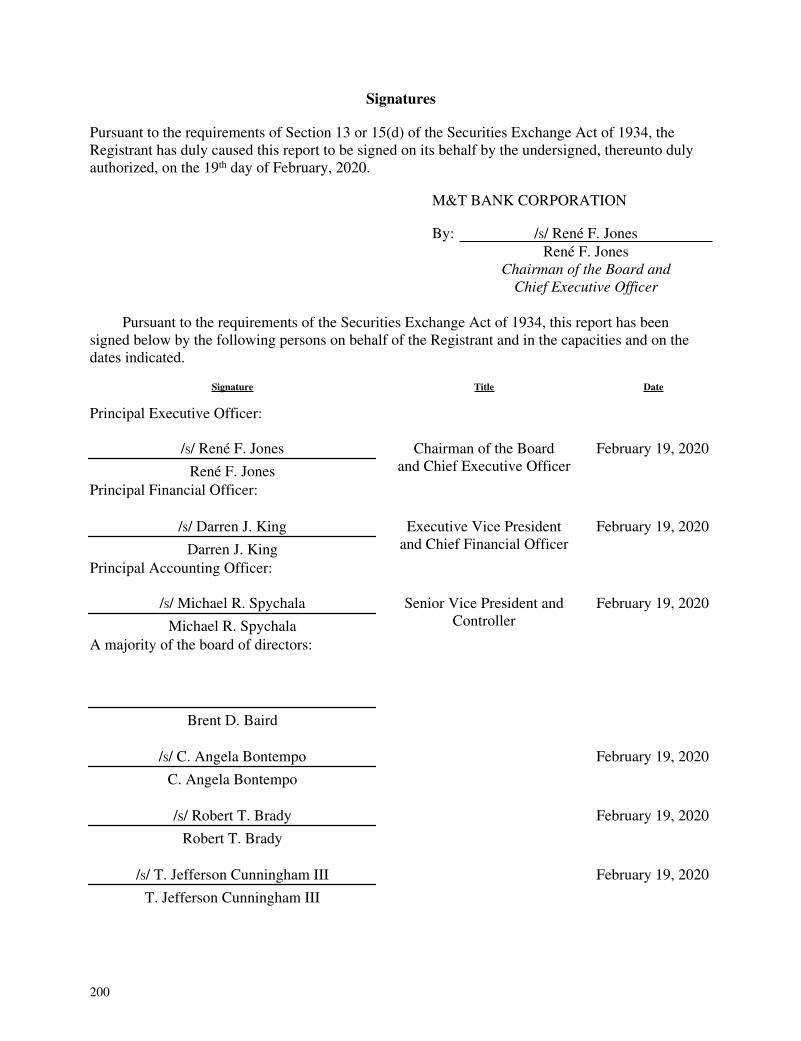
200
Signatures
Pursuant to the requirements of Section 13 or 15(d) of the Securities Exchange Act of 1934, the Registrant has duly caused this report to be signed on its behalf by the undersigned, thereunto duly authorized, on the 19th day of February, 2020.
M&T BANK CORPORATION
By: /S/ René F. JonesRené F. Jones
Chairman of the Board andChief Executive Officer
Pursuant to the requirements of the Securities Exchange Act of 1934, this report has been signed below by the following persons on behalf of the Registrant and in the capacities and on the dates indicated.
Signature Title Date
Principal Executive Officer:
/S/ René F. Jones
René F. Jones
Chairman of the Boardand Chief Executive Officer
February 19, 2020
Principal Financial Officer:
/S/ Darren J. King
Darren J. King
Executive Vice Presidentand Chief Financial Officer
February 19, 2020
Principal Accounting Officer:
/S/ Michael R. Spychala
Michael R. Spychala
Senior Vice President andController
February 19, 2020
A majority of the board of directors:
Brent D. Baird
/S/ C. Angela Bontempo
C. Angela Bontempo
February 19, 2020
/s/ Robert T. Brady
Robert T. Brady
February 19, 2020
/S/ T. Jefferson Cunningham III
T. Jefferson Cunningham III
February 19, 2020

201
/s/ Gary N. Geisel Gary N. Geisel
February 19, 2020
/S/ Richard S. Gold
Richard S. Gold
February 19, 2020
/S/ Richard A. Grossi
Richard A. Grossi
February 19, 2020
/S/ John D. Hawke, Jr.
John D. Hawke, Jr.
February 19, 2020
/S/ René F. Jones
René F. Jones
February 19, 2020
/S/ Richard H. Ledgett, Jr.
Richard H. Ledgett, Jr.
February 19, 2020
/S/ Newton P. S. Merrill
Newton P. S. Merrill
February 19, 2020
/S/ Kevin J. Pearson
Kevin J. Pearson
February 19, 2020
/S/ Melinda R. Rich
Melinda R. Rich
February 19, 2020
/S/ Robert E. Sadler, Jr.
Robert E. Sadler, Jr.
February 19, 2020
/S/ Denis J. Salamone
Denis J. Salamone
February 19, 2020
/S/ John R. Scannell
John R. Scannell
February 19, 2020
/S/ David S. Scharfstein
David S. Scharfstein
February 19, 2020
/S/ Herbert L. Washington
Herbert L. Washington
February 19, 2020