Embed Size (px)
Citation preview

FINAL REPORT.DOC 1
MALTA GAS PROJECT FEASIBILITY STUDY (“EVALUATION”)
FINAL REPORT
INDEX
1. Introduction. 2. Executive Summary.
3. Gas Market Identification.
3.1. Macro Economic Energy Scenario. 3.2. Power Demand: Base Case. 3.3. Power Plants Despatching Model. 3.4. Gas Consumption for Power Generation: Base Case. 3.5. Gas Consumption for Other Uses. 3.6. Power Demand: High and Low Cases. 3.7. Total Gas Demand. 4. Power Generation System: Investment and O&M Costs.
4.1. Existing Generation Units: Costs of Conversion to Gas. 4.2. New CCGT units: Construction Programme and Budget Cost; Main Characteristics. 4.3. O&M Costs: Saving from Switching from Liquid Fuels to Natural Gas. 4.4. Electric Efficiencies: improvement from Switching from Liquid Fuels to Natural Gas. 4.5. LSFO Usable According to Environmental Regulations.
5. Gas Market Value.
5.1. Methodology. 5.2. Reference Energy Scenario. 5.3. Results.
5.3.1. Results According Energy to the Scenario Evolution. 5.3.2. Parametric Results.

FINAL REPORT.DOC 2
6. Gas Lines Feasibility Study.
6.1. Scope of the Work. 6.2. Results of the Study.
6.2.1. Routes characterisation. 6.2.1.1. Sicilian Onshore Pipeline Section. 6.2.1.2. Offshore Pipeline Section. 6.2.1.3. Maltese Onshore Pipeline Section
6.2.2. Pipeline Hydraulic Simulation and Sizing. 6.2.2.1. Sicilian and Offshore Pipeline Sections. 6.2.2.2. Maltese Onshore Pipeline Section.
6.2.3. Costs Estimation. 7. Legal Framework and Tax Regime. 7.1. Research and Survey activities. 7.2. Construction of undersea pipeline terminal. 7.3. Setting up a limited liability company in Malta. 7.4. Domestic Tax Provisions. 7.5. Energy Charter Treaty. 7.6. Enemalta Corporation. 8. International Institutions Contributions. 9. Gas Sales Agreement – Outline of the Main Terms. 10. Final Considerations. Enclosures: 1. Memorandum of Understanding. 2. Despatching Model Summary (2.1-2.5). 3. Despatching Model Iterations (3.01-3.11) 4. Gas Consumption High and Low Cases; Gas Consumption for Other Uses. 5. Gas Turbines Heat Rates. 6. Gas Market Value. 7. Pipelines Feasibility Studies (7.1-7.2). 8. Overview Onshore Italy. 9. Outline of Gas Supply Agreement.
FINAL REPORT.DOC 3
1. INTRODUCTION. On January 11th, 2002 , Enemalta and Eni signed a Memorandum of Understanding (Encl. 1) in order to jointly carry out the technical and economic Feasibility Study of the project to supply natural gas to Malta (the “Malta Gas Project) by a submarine gas line (sealine) coming from Sicily. The Feasibility Study goal is to assess the subject to the required level of detail in order to allow both Parties to evaluate the opportunity to start negotiations for the definition of the Final Agreements necessary to develop and to implement the Project. The Feasibility Study dealt basically with two main issues:
- the definition of the quantities of natural gas to be supplied and of its market value; - the technical feasibility and the investment costs of the pipelines to be built.
Other topics, such as the cost of conversion of existing power generation units to natural gas, the present Maltese Legal Framework and Tax Regime related to the natural gas business and the Main Terms characteristic of a Gas Sales Agreement, have been analysed . The main results are synthesized in the Executive Summary and the single topics are analysed in detail in the following chapters.

FINAL REPORT.DOC 4
2. EXECUTIVE SUMMARY. a) Given the high construction cost of the pipeline when compared with the expected gas volumes to be delivered to Malta, several assumptions where agreed at the beginning of the Study in order to optimise the gas transport costs and therefore to improve the economic feasibility of the project. The most important are: • All the existing power generation units will be converted to natural gas fuel as soon as it will
be available; • All the new power generation units will be natural gas fired CCGT’s; • Liquid fuels for power generation to be considered only as back-up ones (all units will be
dual fuel ones for production security reasons); • Only major Industrial & Commercial customers located near the pipeline will have the
opportunity to switch to gas; • No gas supplies are foreseen for households .
Another basic assumption was that the cost of the gas fired power production in Malta won’t have to be more expensive than by the alternative fuels. b) Gas deliveries have been assumed to start on January 1st, 2005 and to last for 25 years up to the end of 2029. All the “physical” quantities have been considered to evolve until 2015 and then to remain constant until 2029. The power demand evolution considered is typical of a mature electricity market and varies in the years between 2,5% an 1,5% . The total country’s expected Gross Power Production rises consequently from 2.081 GWh in 2005 to 2.418 GWh in 2015 . The related Consumption of Natural Gas in this period of time varies between a maximum of 575 Million cubic meters in 2008 and a minimum of 505 Million cubic meters in 2013 . Table 1 . Expected Power Production and related Gas Consumption in Malta .
Malta Gas Project: Gas Consumption vs. Power Prod uction
1.900
2.000
2.100
2.200
2.300
2.400
2.500
2005 2006 2007 2008 2009 2010 2011 2012 2013 2014 2015
Pow
er P
rodu
c. [G
Wh/
y]
460
480
500
520
540
560
580
600
Gas
Con
sum
p. [M
smc/
y]
Power Production Gas Consumption

FINAL REPORT.DOC 5
The above gas consumption has been computed according to the Enemalta’s three new CCGT’s construction programme and by the agreed despatching model which establishes the production “Merit Order” according to the units’ electric efficiency and takes into account specific requirements of the electric system such as the spinning reserve and the minimum required production per power station. The three new CCGT’s are scheduled to start production in 2005, 2009 and 2013 respectively. The decrease of the gas consumption in 2009 and 2013 respect to the previous years is the direct consequence of the high efficiency (50%) of the new combined cycle being commissioned in those two years and substituting old, less efficient steam units (efficiency less than 30%). Table 2 . Expected Gas Consumption for Power Generation and overall Electricity Production Efficiency in Malta .
Malta Gas Project: Gas Consumption & Electric Effi ciency
559565 566
575
516 516524
532
505513
52137,4% 37,6% 38,0% 38,0%
43,0% 43,7% 43,6% 43,6%
46,7% 46,6% 46,6%
460
480
500
520
540
560
580
600
2005 2006 2007 2008 2009 2010 2011 2012 2013 2014 2015
Gas
Con
sum
p. [M
mc/
y]
25,0%
30,0%
35,0%
40,0%
45,0%
50,0%
Gas Consumption Average Efficiency
Gas consumption for other uses has been quantified as 18,5 Million cubic meters whose build up will take several years. Power generation has therefore confirmed to be the Malta Gas Project’s “Real Customer”. A “High” and a “Low” Demand cases have been defined too. Given the low power demand growth considered in the “Base Demand” case and the maturity of the Maltese power market, the variations of the Gross Power Production and of the related Gas Consumption are negligible in both cases (Power Production in 2015 would be 2.488 GWh in the High Demand case and 2.363 GWh in the Low Demand one, versus 2.418 GWh in the Base Demand case). c) The fuels alternative to natural gas for power generation in Malta are fuel oil (for steam units) and gasoil (for gas turbines equipped units). The Market Value of Natural Gas in Malta has therefore been identified as the unit value of gas (expressed in US$/MMBTU) which generates the same total expenditure that would be incurred by
FINAL REPORT.DOC 6
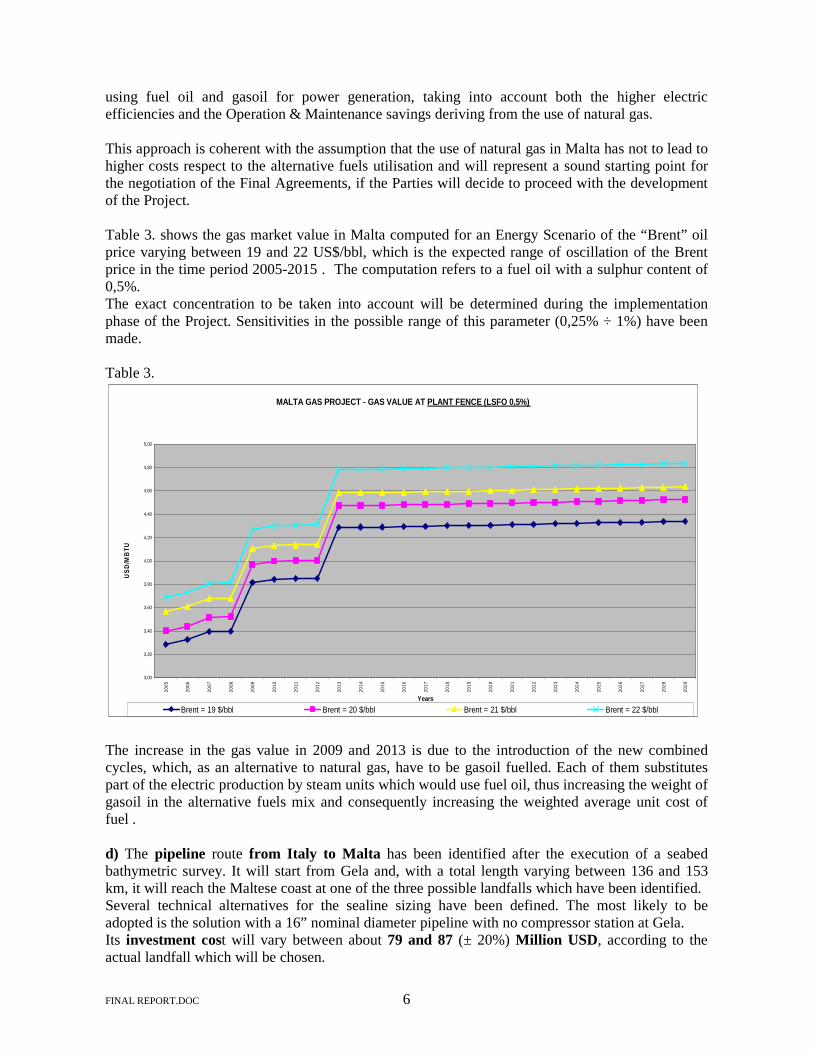
using fuel oil and gasoil for power generation, taking into account both the higher electric efficiencies and the Operation & Maintenance savings deriving from the use of natural gas. This approach is coherent with the assumption that the use of natural gas in Malta has not to lead to higher costs respect to the alternative fuels utilisation and will represent a sound starting point for the negotiation of the Final Agreements, if the Parties will decide to proceed with the development of the Project. Table 3. shows the gas market value in Malta computed for an Energy Scenario of the “Brent” oil price varying between 19 and 22 US$/bbl, which is the expected range of oscillation of the Brent price in the time period 2005-2015 . The computation refers to a fuel oil with a sulphur content of 0,5%. The exact concentration to be taken into account will be determined during the implementation phase of the Project. Sensitivities in the possible range of this parameter (0,25% ÷ 1%) have been made. Table 3.
MALTA GAS PROJECT - GAS VALUE AT PLANT FENCE (LSFO 0,5%)
3,00
3,20
3,40
3,60
3,80
4,00
4,20
4,40
4,60
4,80
5,00
2005
2006
2007
2008
2009
2010
2011
2012
2013
2014
2015
2016
2017
2018
2019
2020
2021
2022
2023
2024
2025
2026
2027
2028
2029
Years
US
D/M
BT
U
Brent = 19 $/bbl Brent = 20 $/bbl Brent = 21 $/bbl Brent = 22 $/bbl
The increase in the gas value in 2009 and 2013 is due to the introduction of the new combined cycles, which, as an alternative to natural gas, have to be gasoil fuelled. Each of them substitutes part of the electric production by steam units which would use fuel oil, thus increasing the weight of gasoil in the alternative fuels mix and consequently increasing the weighted average unit cost of fuel . d) The pipeline route from Italy to Malta has been identified after the execution of a seabed bathymetric survey. It will start from Gela and, with a total length varying between 136 and 153 km, it will reach the Maltese coast at one of the three possible landfalls which have been identified. Several technical alternatives for the sealine sizing have been defined. The most likely to be adopted is the solution with a 16” nominal diameter pipeline with no compressor station at Gela. Its investment cost will vary between about 79 and 87 (± 20%) Million USD , according to the actual landfall which will be chosen.

FINAL REPORT.DOC 7
Two Maltese onshore pipeline routes have been identified, coherently with the above mentioned landfalls. Their lengths vary between 13,1 and 14,4 km and the investment cost between 14 and 15 Million USD. The total estimated investment cost, taking into account also development, financing and other costs related to the project implementation (estimated as 4.5 Million USD), varies therefore between about 99 and 106 Million USD. e) The Gas Sales Agreement will be negotiated in case the Parties decide to proceed with the project implementation. It is anyway envisaged that, in order to be consistent with the Project’s needs and make it economically feasible, it will have to be a “Long Term - Take or Pay” one . f) Some main observations can be made at the end of the this Feasibility Study, which should be taken into consideration by the Parties while evaluating if and how to proceed with the Project implementation:
i. From the technical point of view the construction of the gas lines doesn’t present particular difficulties ;
ii. The high construction costs of the pipelines, when compared to the volumes of gas to
be supplied, determine high specific transportation costs. These costs have to be minimised in order to improve the economic feasibility of the Project. In particular a substantial Grant from the International Institutions, as well as strong financial support, will be necessary as well as the optimisation of the fiscal regime applied;
iii. Following the issue of the “Natural Gas (Market) Regulations, 2002”, the specific
legislation for the gas sector (permitting, operations, commercial activities, fiscal regime, ….), where necessary, will have to be completed in order to guarantee the feasibility of the Project;
iv. The assumed construction programme of the new CCGT’s is of fundamental
importance for the Project. Any delay or change in it could require to shift the Project implementation or could change significantly its economics and consequently its economic feasibility for one or both the Parties.
v. Even if beyond the specific scope of this study, it has to be highlighted that, in order to
maximise the confidence in the Project’s feasibility by all the “actors” involved in it (shareholders, institutions, lenders, …), the structure of the electricity prices in Malta will have to be more cost reflective in the future.

FINAL REPORT.DOC 8
3. GAS MARKET IDENTIFICATION. 3.1. Macro Economic Scenario.
A reference Macro-economic scenario has been defined :
• Growth Rate: 2002 – 2010 2.5 % per year (real terms) 2011 – 2029 2.0 % per year (real terms) • Yearly Inflation Rate to be used in the economic evaluations :
2003 = 2,1% ; 2004 = 2,0% ; 2005-2029 = 1,9%
• Euro/US$ Exchange Rate:
2002 2003 2004 2005 2006 2007 2008 2009 2010-2029
1,099 1,053 1,000 1,000 1,000 1,000 1,000 0,971 0,952 3.2. Power Demand: Base Case. On the basis of the “maturity” of Maltese power market and of the above economic scenario, the “base case” power demand forecast has been prepared.
Yearly growth rate (Electricity demand - final uses)
2002 2.5 % 2003 2.2 % 2004 2.0 % 2005 1.7 % 2006 – 2015 1.5% 2016 – 2029 0 % (no growth)
Electricity demand (final uses – starting level 2001) = 1510 GWh Demand at plateau (final uses - from 2015 to 2029) = 1904 GWh
Starting from the demand forecast values, gross generation (including generation & distribution losses, own uses and no-revenue sales) was computed year by year, under assumptions based on historical data. Table 4 shows the results for 2005, 2010 and 2015. Table 4. Power System Main Data Evolution .
(values in GWh/yr) 2005 2010 2015-2029 Final Demand 1638,88 1768,04 1904,08 Own Uses 124,88 112,27 120,91 Distribution Losses 317,62 365,10 393,19 Total Gross Production 2081,38 2245,41 2418,18
FINAL REPORT.DOC 9
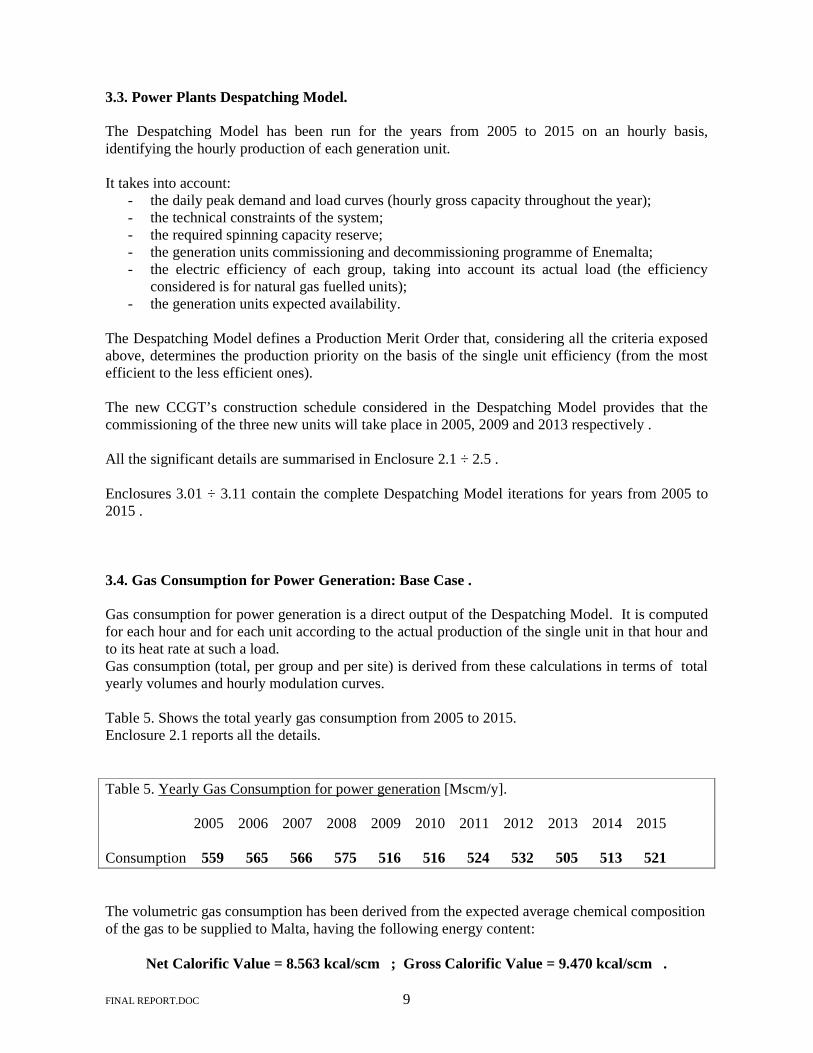
3.3. Power Plants Despatching Model. The Despatching Model has been run for the years from 2005 to 2015 on an hourly basis, identifying the hourly production of each generation unit. It takes into account:
- the daily peak demand and load curves (hourly gross capacity throughout the year); - the technical constraints of the system; - the required spinning capacity reserve; - the generation units commissioning and decommissioning programme of Enemalta; - the electric efficiency of each group, taking into account its actual load (the efficiency
considered is for natural gas fuelled units); - the generation units expected availability.
The Despatching Model defines a Production Merit Order that, considering all the criteria exposed above, determines the production priority on the basis of the single unit efficiency (from the most efficient to the less efficient ones). The new CCGT’s construction schedule considered in the Despatching Model provides that the commissioning of the three new units will take place in 2005, 2009 and 2013 respectively . All the significant details are summarised in Enclosure 2.1 ÷ 2.5 .
Enclosures 3.01 ÷ 3.11 contain the complete Despatching Model iterations for years from 2005 to 2015 . 3.4. Gas Consumption for Power Generation: Base Case . Gas consumption for power generation is a direct output of the Despatching Model. It is computed for each hour and for each unit according to the actual production of the single unit in that hour and to its heat rate at such a load. Gas consumption (total, per group and per site) is derived from these calculations in terms of total yearly volumes and hourly modulation curves. Table 5. Shows the total yearly gas consumption from 2005 to 2015. Enclosure 2.1 reports all the details. Table 5. Yearly Gas Consumption for power generation [Mscm/y]. 2005 2006 2007 2008 2009 2010 2011 2012 2013 2014 2015 Consumption 559 565 566 575 516 516 524 532 505 513 521 The volumetric gas consumption has been derived from the expected average chemical composition of the gas to be supplied to Malta, having the following energy content:
Net Calorific Value = 8.563 kcal/scm ; Gross Calorific Value = 9.470 kcal/scm .

FINAL REPORT.DOC 10
3.5. Gas Consumption for Other Uses . According to the agreed scope of work, a first attempt to assess potential consumption of gas for uses different from power generation has been made. The approach in this case is based on an assumed “potential” substitution of natural gas for liquid fuels, irrespective of the actual sector of use, of pricing/competitive elements and of customers’ location. Preliminary figures have been obtained for a “base case” as well as for “High Demand” and “Low Demand” cases, differences are obtained through different penetration rates (see Table 6.). The level of liquid fuels demand, potentially suitable for substitution, corresponds to the present consumption. No growth has been applied because : 1) the limited data available prevented to perform an appropriate analysis; 2) the volumes involved are so small that, even under the assumption of continuous growth,
constitute a fraction of potential demand in power generation.
Table 6. Gas Consumption for Other Uses . Scenario Penetration Rate Volume Base Case 25 % 18.5 Mill cu.m/yr High Demand 40 % 28 Mill cu.m/yr Low Demand 0 % 0 Mill cu.m/yr
These volumes are assumed to be utilised with a load factor of 0.35 . Details on this paragraph are reported in Enclosure 4. 3.6. Power Demand : High and Low Cases. Two alternative cases (“High Demand” and “Low Demand“ respectively) have been prepared as a first attempt to provide a range of possible results for discussion. The macro-economic scenario, however, has not been changed (same GDP growth throughout the forecast period); the different results derive from changes in the coefficients that link the power demand growth to the economic growth. The main results of this preliminary assessment are reported in Tables 7 and 8 : Table 7. Power Demand Growth rate (final uses) in the alternative cases .
High Dem. Low Dem.
2002 2.5 % 2.4 % 2003 2.4 % 2.0 % 2004 2.2 % 1.7 % 2005 2.1 % 1.5 % 2006 – 2010 1.9 % 1.4 % 2011 – 2015 1.6 % 1.3 %
2016 – 2029 0 % (no growth) 0 % (no growth)
FINAL REPORT.DOC 11
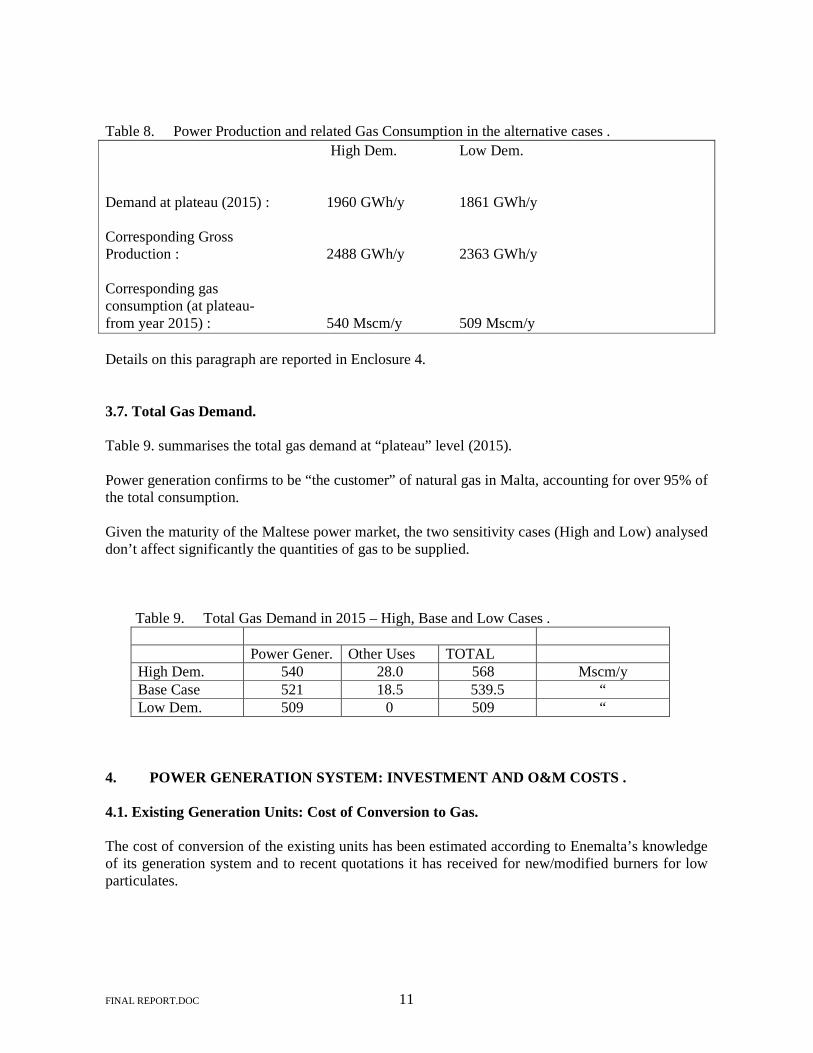
Table 8. Power Production and related Gas Consumption in the alternative cases . High Dem. Low Dem. Demand at plateau (2015) : 1960 GWh/y 1861 GWh/y Corresponding Gross Production : 2488 GWh/y 2363 GWh/y Corresponding gas consumption (at plateau- from year 2015) : 540 Mscm/y 509 Mscm/y Details on this paragraph are reported in Enclosure 4. 3.7. Total Gas Demand.
Table 9. summarises the total gas demand at “plateau” level (2015). Power generation confirms to be “the customer” of natural gas in Malta, accounting for over 95% of the total consumption. Given the maturity of the Maltese power market, the two sensitivity cases (High and Low) analysed don’t affect significantly the quantities of gas to be supplied. Table 9. Total Gas Demand in 2015 – High, Base and Low Cases .
Power Gener. Other Uses TOTAL High Dem. 540 28.0 568 Mscm/y Base Case 521 18.5 539.5 “ Low Dem. 509 0 509 “
4. POWER GENERATION SYSTEM: INVESTMENT AND O&M COSTS . 4.1. Existing Generation Units: Cost of Conversion to Gas. The cost of conversion of the existing units has been estimated according to Enemalta’s knowledge of its generation system and to recent quotations it has received for new/modified burners for low particulates.

FINAL REPORT.DOC 12
These costs are presently estimated as shown in Table 10 . Table 10 . Cost of the existing power units conversion to natural gas . Conversion of CCGT n° 1 714.000 Euro Conversion of CCGT n° 2 714.000 Euro Conversion of Delimara boilers n° 1 & 2 952.000 Euro each Conversion of Marsa boilers n° 5 & 6 476.000 Euro each Conversion of Marsa boilers n° 7 & 8 976.000 Euro each The above costs have been computed considering an Euro/Lm exchange rate of 2,38 . The total conversion cost, to be borne within the first gas delivery date, is therefore estimated as 6.236.000 Euro . The Marsa boilers n° 3 and 4 will not be converted to gas, being their decommissioning scheduled for 2006 and 2007 respectively (see Encl. 2.1). 4.2. New CCGT units: Construction Programme and Budget Costs; Main Characteristics. The new CCGT units are scheduled to start commercial operation in 2005, 2009 and 2013 respectively. The decommissioning of the Marsa steam units will be consistent with this programme (for details see Enclosure 2.1) . The budget cost for the construction of the new CCGT units is estimated to be between 90 and 110 Million Euro each . These units will have a capacity of 110 MW each and will be equipped by two gas turbines each. This choice, as already done for the existing combined cycle, is due to the necessity of maximising the reliability of the whole power generation system, which is an isolated one. The above configuration also allows a higher operational flexibility while maintaining high generation efficiencies. 4.3. O&M Costs: Savings from Switching from Liquid Fuels to Natural Gas. O&M costs of the existing steam units will not change significantly when operated by gas instead by fuel oil. Therefore in the continuation of the Study their variations have been considered equal to zero.
Savings in O&M costs for units equipped with gas turbines when operated by gas instead of gasoil are expected. They are presently identified as:
• 70.000 Euro/(year x unit) for open cycle units;
• 550.000 Euro/(year x unit) for CCGT units.
FINAL REPORT.DOC 13
4.4. Electric Efficiencies: improvement from Switching from Liquid Fuels to Natural Gas. No electric efficiency improvement is expected for steam units when switching from fuel oil to natural gas as a fuel. An improvement of about 1% , instead, takes place when gas turbines equipped units use natural gas instead of gasoil, as can be seen in Enclosure 5. The reference gas turbine is the GE PG6541. Its nominal Heat Rate passes from 10.970 Btu/kWh to 10.860 Btu/kWh . Also nominal capacity increases of about 2% . In the continuation of the Study the efficiency change has been assumed equal to 1% . 4.5. LSFO Usable According to the Environmental Regulations. The exact maximum sulphur content of the fuel oil whose use will be permitted from 2005 has not been definitively defined yet. Three possible alternatives of sulphur content in the fuel oil have been identified and used for the computation of the gas market value at Malta, as reported in the following chapter: 0,25% , 0,5% , 1% . 5. GAS MARKET VALUE. 5.1. Methodology. The fuels alternative to natural gas for power generation in Malta are fuel oil (for steam units) and gasoil (for gas turbines equipped units). The Market Value of Natural Gas in Malta has therefore been identified as the unit value of gas (expressed in US$/MMBTU) which generates the same total expenditure that would be incurred by using fuel oil and gasoil for power generation, taking into account the higher electric efficiencies and the Operation & Maintenance savings deriving from the use of natural gas. The gas market value has been computed in three alternative scenarios considering a sulphur content in the fuel oil of 0,25% , 0,5% , 1% , respectively. Enclosure 6 contains the computation algorithm. The total expenditure generated by the use of liquid fuels has been computed as follows:
a. The gas volumes to be used, year by year, by GT equipped units and by steam units have been derived from the Despatching Model;
b. The quantities of gasoil and fuel oil necessary in the liquid fuels scenario have been consequently computed taking into account the generation efficiency difference of the gas turbine equipped units (when fuelled by gasoil instead of by natural gas) and the specific heating values of the various fuels;

FINAL REPORT.DOC 14
c. The total cost of the liquid fuels per each year (expressed in US$) has been calculated multiplying the respective yearly quantities by the fuels’ unit costs, derived by the adopted Energy Scenario, in that year;
d. The savings in O&M have been computed, per each year, according to the number of Open Cycle GT and of CCGT units installed in that year and applying the Inflation Rate defined in point 3.1. They have been converted in US$ utilising the yearly exchange ratio defined in point 3.1. ;
e. The total yearly expenditure has been computed, on a yearly basis, as the sum of the total costs referred to in point c. and of the savings defined in point d. ;
f. The gas market value has been defined by dividing, again year by year, the total yearly expenditure of point e. by the energy content of the volume of gas to be utilised in the specific year. The gas market value is expressed in US$/MMBTU and is referred to its gross calorific value.
5.2. Reference Energy Scenario. The Reference Energy Scenario (Enclosure 6 – Energy Scenario) links, year by year, the prices of the liquid fuels to the expected “Brent Spot price” . All prices are expressed in nominal terms; the liquid fuels prices are expressed in US$ per metric ton and considered as delivered in the Mediterranean on a CIF basis; the Brent price is in US$/bbl. The Reference Energy Scenario adopted is sourced from Eni’s Economic and Energy Reference Scenario, March 2002 . A substantial stability of the oil prices is foreseen: the Brent price oscillates between 19 and 22 US$/bbl in the period 2005 ÷ 2015 . 5.3. Results The gas market value, computed on a yearly basis, has been has been worked out in two different ways: - Utilising, for each year, the expected prices of the liquid fuels in that year. This shows the
expenditure to be most likely born ; - On a “parametric” basis, that is to say considering a constant energy scenario (constant prices)
over the entire time period considered. This is a “sensitivity analysis” giving the value of gas in the various years as the consequence of the “assumed” the oil prices.
5.3.1. Results according to the Energy Scenario Evolution. They are shown in the “Gas Value Energy Scenario x%” sheets of Enclosure 6, where x% represents the fuel oil sulphur content used in the specific computation. The variations in the gas value are due to the joint effect of the oil product prices fluctuations and of the weight of fuel oil and of gasoil in the reference fuels basket. Fuel oil accounts for about 50% in the first years. Due to the commissioning of the new CCGT’s, to their priority in the production merit order and to the decommissioning of the old steam units, it becomes about 5% in 2015, gasoil accounting for the remaining 95% .

FINAL REPORT.DOC 15
5.3.2. Parametric Results. They are shown in the “Graph by Energy Price@Plantx%” sheets of Enclosure 6. The Brent prices considered to compute the gas value at Malta are 19, 20, 21, 22 US$/bbl. The fuel oil and gasoil prices related to each Brent price are computed as the arithmetic average of their specific prices in the years when, in the Reference Energy Scenario between 2002 and 2015, the Brent has that specific price . The Parametric Lines, besides representing a sensitivity analysis of the gas value versus the Brent price, show more clearly the influence, on the gas value, of the variations of the liquid fuels relative weights. The yearly small variations of the gas value are due both to the optimisation of the generation system utilisation and to the inflation applied to O&M savings. The large variations are given by the entering in operation of the new combined cycles in 2009 and 2013. These significant increases in the unit value of gas are counterbalanced by the sharp decrease of the gas volumes utilised for power generation. After 2015, having all the physical quantities been frozen, the small increase of the gas value is solely due to the inflation on O&M savings. 6. GAS LINES FEASIBILITY STUDY. 6.1. Scope of the Work. The expected results of subject feasibility study were the following:
• Routes characterisation
• Pipelines hydraulic simulation and sizing
• Costs estimation The feasibility study was awarded, in two separate phases, to Snamprogetti, the engineering Company of Eni Group.
6.2. Results of the Study 6.2.1. Routes Characterisation 6.2.1.1. Sicilian Onshore Pipeline Section Different alternative routes in the Sicilian onshore section have been studied, taking into consideration economical requirements and technical rules and standards, as well as fully respecting the existing national and territorial restrictions (basic laws, environmental laws, town planning) . The studied pipeline routes and the relevant plants locations are shown, as an overview, in the attached aerial photo (Enclosure 8), where the connection between the Italian gas system ( in correspondence of the landing point of the so called “ Green Stream “ pipeline ) and the one for Malta can be seen. In the most significant solution, the connection is made by a DN 16” pipeline, about 1 km long (plus one metering station and a trap station).
FINAL REPORT.DOC 16
6.2.1.2. Offshore Pipeline Section
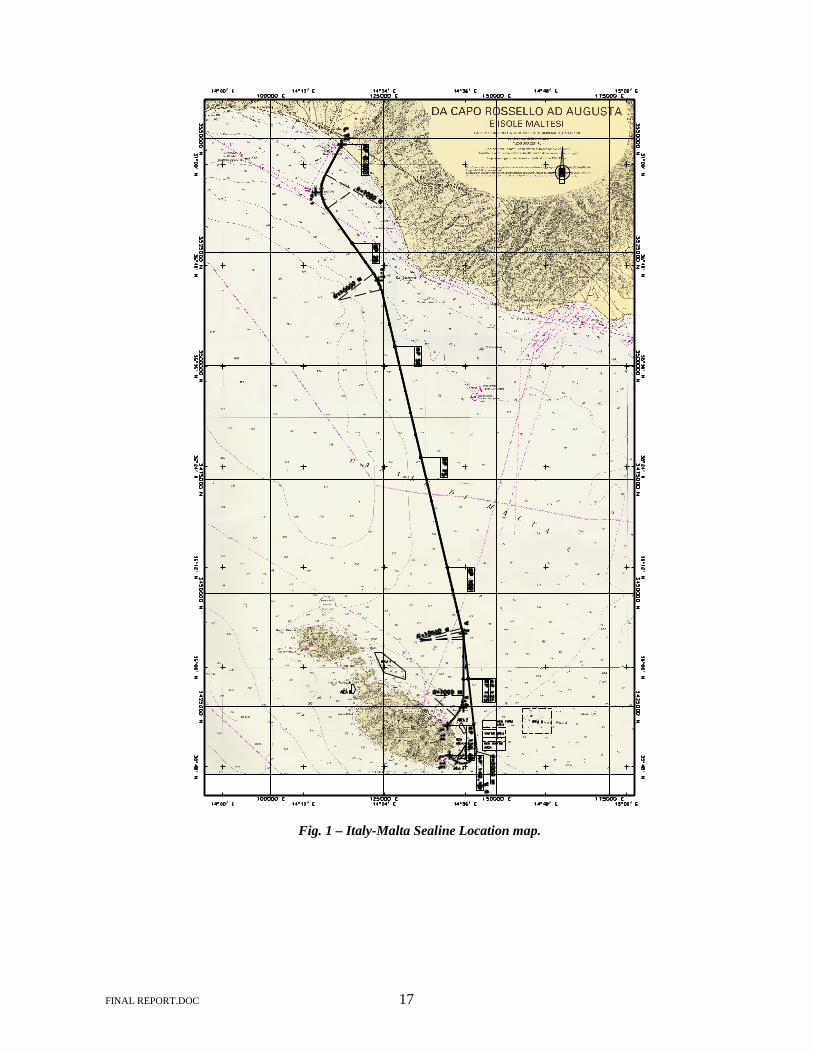
Three alternative routes have been identified for the offshore pipeline, corresponding to three possible landfalls in Malta, (Figures 1 and 2):
• Alternative 1: From Gela to Kalanka Tal Gidien on the eastern coast of the Malta Island. The total length of this alternative is about 149 km.
• Alternative 2: From Gela to Sala Rock in the northern coast of the Malta Island. The total length of this alternative is about 136 km.
• Alternative 3: From Gela to Delimara Power Station in the Marsaxlokk bay. The total length of this alternative is about 153 km.
The routes have been defined after having executed a bathymetric survey which has permitted to obtain detailed information about geomorphologic and litho-logical features of the seabed and to collect the basic data for the evaluation of the pipeline feasibility and for the identification of the most promising route. The three alternatives follow a common route from KP 0 to approx. KP 114, where the alternative 2 (northern route) detaches from the other ones. The alternatives 1 and 3 (southern routes) are coincident also from kp 114 to kp 140. The pipeline routes have been optimised on the basis of the information collected during the bathymetric survey. Details of bathy-morphological and geo-technical results, maritime boundaries and human activities and installations are reported in section 4 of Snamprogetti’s study (Enclosure 7.1). The optimised pipeline routes present the major problems mainly in the Maltese shore approach areas as explained in detail in the Feasibility Study. Human activities in the Maltese approach areas have been considered in the route optimisation. Considering:
- the geo-morphological characteristics of each shore approach; - the human activities ( such as fishing, anchoring, ships waiting/bunkering) in the shore
approaches areas; - the available information about restricted areas;
and taking into account:
- the ships traffic; - the envisaged authority requirements during the pipeline installation phase:
the Alternative 2 route, approaching Sala Rock landfall, appears to be the most attractive among the ones inspected.
FINAL REPORT.DOC 17
Fig. 1 – Italy-Malta Sealine Location map.