Embed Size (px)
Citation preview
Male dominance rarely skews the frequencydistribution of Y chromosome haplotypesin human populationsJ. Stephen Lansing*†, Joseph C. Watkins‡§, Brian Hallmark*, Murray P. Cox†¶, Tatiana M. Karafet¶, Herawati Sudoyo�,and Michael F. Hammer¶
Departments of *Anthropology and ‡Mathematics, and ¶Division of Biotechnology, Biological Sciences West, University of Arizona, Tucson, AZ 85721;†Santa Fe Institute, Santa Fe, NM 87521; and �The Eijkman Institute for Molecular Biology, Diponegoro 69, Jakarta 10430, Indonesia
Edited by Simon A. Levin, Princeton University, Princeton, NJ, and approved June 3, 2008 (received for review October 25, 2007)
A central tenet of evolutionary social science holds that behaviors,such as those associated with social dominance, produce fitnesseffects that are subject to cultural selection. However, evidence forsuch selection is inconclusive because it is based on short-termstatistical associations between behavior and fertility. Here, weshow that the evolutionary effects of dominance at the populationlevel can be detected using noncoding regions of DNA. Highlyvariable polymorphisms on the nonrecombining portion of the Ychromosome can be used to trace lines of descent from a commonmale ancestor. Thus, it is possible to test for the persistence ofdifferential fertility among patrilines. We examine haplotype dis-tributions defined by 12 short tandem repeats in a sample of 1269men from 41 Indonesian communities and test for departures fromneutral mutation-drift equilibrium based on the Ewens samplingformula. Our tests reject the neutral model in only 5 communities.Analysis and simulations show that we have sufficient power todetect such departures under varying demographic conditions,including founder effects, bottlenecks, and migration, and atvarying levels of social dominance. We conclude that patrilinesseldom are dominant for more than a few generations, and thustraits or behaviors that are strictly paternally inherited are unlikelyto be under strong cultural selection.
cultural evolution � Indonesia � neutral theory � selection � Red Queen
Evolutionary social scientists analyze the fitness consequencesof behavior, where the currency of fitness is reproductive
success. Many studies have argued that reproductive skew biasedtoward dominant or high-ranking men is very common in humancommunities: ‘‘In more than one hundred well studied societies,clear formal reproductive rewards for men are associated withstatus: high-ranking men have the right to more wives’’ (1).Demographic statistics collected over short time scales supportthese claims (2). Although variation in male fitness is known tooccur, an important unanswered question is whether such dif-ferences are heritable and persist long enough to have evolu-tionary consequences at the population level. In this report weshow that it is possible to use genetic markers to test for thesignature of heritable reproductive skew within populationgroups.
Several authors have modeled the effects of reproductive skewin different contexts (3, 4). Fig. 1 contrasts two models: thestandard Wright-Fisher model in which all individuals produceoffspring with equal probability (i.e., no reproductive skew) anda model of male dominance in which individuals whose parentshad many offspring are more likely to have more childrenthemselves. Investigations of genetic variation on the nonrecom-bining portion of the Y chromosome provide an opportunity toask which of these models better characterizes a given popula-tion. Here, we genotype 12 short tandem repeats (Y-STRs) anda battery of SNPs on the Y chromosomes of 1269 men from 41Indonesian communities. We then construct Y-chromosomehaplotypes for each sample [supporting information (SI) Table
S1]. Unlike human genetic studies that sample unrelated indi-viduals from a broad geographical watershed and thus fail tocapture community-level processes, we sample male residents ofseveral indigenous and relatively isolated communities. Thesepopulations include neolocal Borneo hunter-gatherers and Cen-tral Javanese rice farmers, matrilocal horticulturalists on Flores,patrilocal Balinese wet-rice farmers, and patrilocal horticulturalclans on Sumba, Nias, and Flores.
To detect evidence of heritable reproductive skew, we usestatistical procedures that are based on the Ewens samplingformula (5). In particular, we apply Slatkin’s exact test ofneutrality, which is based on the haplotype frequency distribu-tion (6, 7). Communities experiencing reproductive skew amongpatrilines will tend to have haplotype frequency distributionsthat, over time, become unlikely under the neutral model,skewed toward an excess of common haplotypes (patrilines).Such skewed distributions would provide evidence for culturalselection, defined as the heritable nongenetic transmission of anykind of behavior that affects reproductive success (see ref. 8).
ResultsStrikingly, we find that only 5 of 41 communities (12%) havehaplotype frequency distributions that are unlikely under theneutral model (i.e., rejected the null hypothesis of neutrality).Fig. 2 shows the haplotype frequency distributions of 1 of these5 communities (Fig. 2B), and a neutral deme (Fig. 2 A). All 5
Author contributions: J.S.L. designed research; J.S.L., J.C.W., B.H., M.P.C., T.M.K., and H.S.performed research; J.S.L., J.C.W., B.H., M.P.C., T.M.K., H.S., and M.F.H. analyzed data; andJ.S.L., J.C.W., B.H., M.P.C., T.M.K., and M.F.H. wrote the paper.
The authors declare no conflict of interest.
This article is a PNAS Direct Submission.
§To whom correspondence should be addressed. E-mail: [email protected].
This article contains supporting information online at www.pnas.org/cgi/content/full/0710158105/DCSupplemental.
© 2008 by The National Academy of Sciences of the USA
Fig. 1. Population models. Colored dots represent individuals who havedescendants in the final generation. Red dots represent dominant individualswho are more likely to reproduce. Pink dots represent nondominant individ-uals having a dominant ancestor. Blue dots represent nondominant individ-uals having no dominant ancestor. Dominant individuals in 1 generation arechosen at random from the offspring of dominant individuals in the previousgeneration. (See SI Text Population Models for more details.)
www.pnas.org�cgi�doi�10.1073�pnas.0710158105 PNAS � August 19, 2008 � vol. 105 � no. 33 � 11645–11650
AN
THRO
POLO
GY

cases that rejected neutrality show a similar pattern: 1 or morecommon haplotype(s) (i.e., a high-frequency patriline) pairedwith a large number of low-frequency haplotypes (Fig. S1). Thiscontrasts with patterns produced under the neutral model withdifferent population sizes. Observed haplotype frequency dis-tributions typical of large communities (i.e., in which the geneticdiversity of the sampled population is high) are characterized bymany unique haplotypes and a few high-frequency lineages.Smaller communities with reduced neutral diversity tend to havefewer low-frequency haplotypes and fewer common patrilines.
Dominance Model and Power of the Exact Test. Given these findings,we wanted to know how often the Ewens exact test fails to rejectneutrality when male dominance is in fact occurring. The Ewenstest is nonparametric and is not based on any specific model. Itis independent of both village effective population size andY-STR mutation rate. We constructed an analytical model todetermine the ability of this test to detect departures fromneutral equilibrium as a result of heritable reproductive skewcaused by social dominance. In this model, dominant malescomprise a fraction � of the total population and have a selectiveadvantage � over the nondominant males. Offspring in the nextgeneration are chosen according to a haploid Wright-Fishermodel with competition between the 2 classes, dominant andnondominant. To maintain the fraction of dominant males at �for each subsequent generation, a proportion of sons of thedominant males is chosen at random to be dominant for the nextiteration of the model. Thus, for this 2-parameter model, either� � 0 or � � 0 yields neutral populations (see SI Text PopulationModels for additional details).
To calculate the power of the Ewens exact test under thismodel, we simulate nonneutral populations, sample them, andapply the exact test to observe departures from the expectationunder neutrality. To condition the simulations on our Indonesiandata, we simulate populations taking (i) samples of size 20 fromsmaller villages having effective population size 100 using 10Y-STRs, and (ii) samples of size 35 from larger villages havingeffective population size 300 using 12 Y-STRs. Tables S2 and S3show the results of these analyses for all parameters. Forexample, for a village of size 300 with only 4% of the menproducing twice as many offspring (� � 1), the power of our testis 0.39. Assuming this level of dominance, the probability that 5
(or fewer) of 41 villages rejects neutrality is �0.02%. Thus, evenweak dominance would be detectable in a sample of 41 villages.Fig. 3 gives this probability for the power calculated from anymodel of selection.
Demographic Effects. Departures from neutrality can arise fromboth selective and demographic causes (e.g., changes in popu-lation size and structure). Consequently, inferring whether ob-served cases result from reproductive skew or from other factorsis not straightforward. There are 2 possibilities. First, demo-graphic processes might mask the effects of male dominance andmake villages appear neutral when in fact they are experiencingheritable reproductive skew, leading to false negatives. Alter-natively demographic processes might cause neutral populationsto appear nonneutral (i.e., leading to false positives). In thissection we discuss the effects of 2 classes of demographic processon the Ewens test: reductions in population size (includingfounder effects and bottlenecks) and migration.
In general, bottlenecks (or founder events) reduce genetic
Fig. 2. Example haplotype distributions. The height of column i is the number of individuals whose haplotype is represented i times in the sample (normalizedby sample size). (A) An example of a community haplotype distribution that does not show evidence of departure from neutrality based on the exact test:Sumba/Mamboro. (B) An example of a community showing departure from neutrality based on the exact test: Sumba/Wanokaka. Although nonneutral casesoften appear to have mass shifted to the right, it generally is not possible to determine the outcome of the exact test by inspection. Colors indicate Y chromosomehaplogroup membership (C, F, K, M, O, or S). All 41 distributions and the color key are given in Fig. S1. Additional haplogroup information is in Table S5.
Fig. 3. Probability of seeing 5 or fewer (of 41) nonneutral villages for a givenpower of the individual tests to detect departure from neutrality. If the powerof the individual tests is 0.2, the probability of observing �5 is �0.2. If thepower of the individual tests is � 0.3, then this probability is vanishingly small.
11646 � www.pnas.org�cgi�doi�10.1073�pnas.0710158105 Lansing et al.

variation (Fig. S2) by leading to the rapid loss of rare lineages.Eventually, if the bottleneck remains strong, more commonlineages will be lost also. In the phase of population recoveryafter a bottleneck, new mutations tend to occur on different Ychromosomes. Thus, during the bottleneck phase we expect tofind a reduction in the frequency of rare haplotypes, whereas inthe recovery phase we expect to see an excess of rare haplotypescompared with the expectation for a population in neutralequilibrium. For false positives, the most extreme case is aneutral population undergoing a bottleneck in which all indi-viduals possess the same haplotype. This is conceivable, forexample, in the case of a founding event by a small kin group.Thus, neutral populations may test as nonneutral in the periodimmediately following a strong bottleneck (Fig. S3A) (see Ma-terials and Methods).
In a population experiencing reproductive skew as a result ofmale dominance, a bottleneck will reduce genetic variationfurther. Because a reduction in haplotype diversity reduces thepower of the exact test, dominance will be more difficult to detectduring the recovery phase. Simulations indicate that populationsreturn to the nonneutral condition in �20 generations as long asdominance remains constant (Fig. S3B). This raises the questionof whether we are underestimating the importance of maledominance as a result of low power to reject neutrality after abottleneck. We believe this to be unlikely for several reasons.First, the mean village size, at 280 male household heads, issufficiently large to indicate that frequent bottlenecks occurringin the past few generations are very unlikely (Table S4). Second,haplogroup diversity (i.e., the number and relative abundance of
Y-chromosome lineages as defined by SNPs) is relatively high(Table S5). Finally, reductions in effective population size thatone expects to accompany a bottleneck are not seen. Thebottlenecks simulated here are quite extreme, with reductions inpopulation size of 90% for 10 generations. Moreover, if bottle-necks do occur, they also independently will reduce the demo-graphic effects of male dominance. For example, if a populationis reduced from size 300 to 35 for 10 generations, then the chancethat any individual has a descendant in a recovering populationis � 2% (this becomes � 1% if the bottleneck lasts for 20generations) (Fig. S2). Thus, it is unlikely that Y-chromosomelineages of dominant males would survive a severe populationbottleneck.
Migration is another factor that affects patterns of diversitywithin populations. Increasing the number of new alleles enter-ing the population each generation by migration is functionallyequivalent to increasing the mutation rate, �, in a Wright-Fishermodel. Consequently, migration will not cause false positivesbecause the exact test is not dependent on the mutation rateunder this model. However, for villages experiencing reproduc-tive skew, high migration reduces the power of the Ewens exacttest. In our sample, the highest migration rates are expected inBalinese villages because they often are adjoining and speak thesame language. We simulated an Isolation with Migration modelto estimate migration rates (see SI Text Estimation of BalineseMigration Rates). To determine whether this could impact thepower of our tests significantly, we simulated moderate and highmigration (m � 0.01, 0.03/gen) as part of our power analyses(Tables S2 and S3). Even when sample sizes are small and
Fig. 4. Effects of adding nonheritable reproductive skew to a simulated population of size n � 300. The first column shows simulation results for � � 0.02, thesecond column for � � 0.06. (A) Reduction of power. As p increases, the power to detect skew is reduced. However, the length of time lineages are dominantalso decreases, nullifying any long-term evolutionary advantage of dominance. (B) Ne reduction. Effective population size remains depressed for all values ofp, providing an additional way to assess the strength of both heritable and nonheritable skew. Estimates eventually exceed the actual population size becausethe estimator is biased upwards.
Lansing et al. PNAS � August 19, 2008 � vol. 105 � no. 33 � 11647
AN
THRO
POLO
GY

dominance is weak, the reduction in power with these levels ofmigration is minimal, amounting to only a few percent. Forexample, with 4% dominant males producing 3 times as manychildren as nondominant males, high migration reduces thepower from 32% to 26% in small village simulations (Table S2).
Nonheritable Reproductive Skew. We also consider another modelof reproductive skew in which the composition of the dominantgroup varies. The distinction between the heritable and nonhe-ritable cases is important: any basis for cultural selection mustinvolve some heritable behavior or trait that confers a repro-ductive advantage. In the context of social dominance, thisdistinguishes between situations in which, over multiple gener-ations, males persistently pass dominance to their sons versussituations in which the membership of reproductively dominantgroups is transient. To consider this case, we add a parameter pto the model of dominance. This parameter gives the fraction ofthe dominant class that enters from the nondominant class in agiven generation. Consequently, for example, if p � 0.05, then adominant lineage will span, on average, 20 � 1/0.05 generations.If p � 1, then reproductive skew is uncorrelated betweengenerations. In that limiting case, dominant individuals producesignificantly more offspring than nondominants, but this ten-dency is attained randomly in each generation. Values of psignificantly �0 could result in a ‘‘Red Queen’’ effect, in whicheven acute competition between patrilines does not translateinto lasting dominance (8). The power analysis for this modelshows a small reduction in power for the case p � 0.05. For p �0.15, dominant lines persist on average only 6 or 7 generations,and, not surprisingly, we find a clear reduction in power for thiscase. The power of selection to structure the genetic compositionof the community also is reduced as p increases and thecomposition of the dominant group becomes more fluid (Fig.4A). Concomitant with this result, we also find in our simulationsa clear reduction in the village effective population size, Ne, forsmall values of p and some reduction for all values (Fig. 4B). Tolook for reductions in Ne, we estimated the effective populationsizes of sampled communities based on the number of haplo-types and compared these values with best-estimate demo-graphic data made available by village records or the localIndonesian government. For the communities in which theneutrality test was not rejected, effective size estimates (com-pensating for migration) are similar to census demographicvalues (Table S4). In contrast, the nonneutral communities haveNe estimates that are much smaller than the number of maleheads of households, in some cases dramatically smaller. Be-cause we do not see a marked reduction in Ne for the villages thattest neutral, and these villages maintain high levels of haplo-group diversity (Table S5), it appears that values of p �� 0 areuncommon for the communities in our sample. This arguesagainst significant reproductive skew, which would reduce bothNe and diversity quickly in small communities.
Cases That Depart from Neutral Expectations. Finally, we investigatepossible explanations for departures from neutrality for each ofthe 5 nonneutral communities. Three communities come fromSumba, a remote island in which residence is patrilocal, descentis traced through the patriline, marriage is polygamous, andcompetition for status and resources among clans is endemic (9).Given these circumstances, it perhaps is remarkable that theremaining 5 Sumbanese communities we sampled failed to showstatistically significant evidence of heritable reproductive skew.In Bali, where residence is patrilocal and there is competitionamong patrilineal descent groups, the only nonneutral commu-nity is South Batur. This village was part of the larger village ofBatur, which fragmented in 1948 after a period of rivalrybetween factions that often were associated with descent groups.A very recent process of village fissioning led to resettlement of
some households based on lineage affiliation (10). The remain-ing nonneutral community is a patrilineal and patrilocal com-munity in central Flores. It once was the site of a minorprincedom that became an administrative center during theDutch colonial era and now serves as a district capital (‘‘keca-matan’’). Our sample includes a large proportion of civil servantsborn elsewhere, probably accounting for its diverse haplotypedistribution.
In sum, most of the sampled populations do not show evidenceof a departure from neutral stochastic equilibrium with respectto male lineages. If reproductive skew inherited between gen-erations were a pervasive and ongoing process, we would expectto observe frequent rejections of the Ewens exact test ofneutrality. We do not observe such rejection in 88% of ourIndonesian communities. Even our nonneutral Indonesian com-munities may not necessarily reflect the action of male repro-ductive skew but rather the signature of a very recent ornonneutral founding group. For the reasons discussed earlier,recent bottlenecks are unlikely to be masking significant skew.We conclude that male reproductive skew is at best weak in mostof our sampled population groups, despite their varied subsis-tence strategies and kinship practices.
DiscussionThe implications of our results extend beyond the Indonesiancases described here to the broader question of the relationshipbetween reproductive skew and the genetic structure of humancommunities. The genetic or cultural-evolutionary effects ofdominance become apparent only by extending analyses fromthe inclusive fitness of individuals to population-level conse-quences over the course of multiple generations. Here, we takea population-genetic approach to infer selection by detectingdepartures from neutral drift-mutation equilibrium at the pop-ulation level rather than from variation in the reproductivesuccess of individuals (11–13). Our results indicate that domi-nance effects generally do not persist over multiple generations.The lack of evidence of reproductive skew in these communitiesmeans that heritable traits or behaviors that are passed pater-nally, be they genetic or cultural, are unlikely to be under strongselection.
The discovery that neutral processes can explain most haplo-type frequency distributions in these communities parallelsearlier results from the development of neutral theory in geneticsand ecology. As Kimura (14) observed in his original article, theprevalent opinion in the 1960s held that almost all mutations areunder selection. This opinion was slow to change. More recently,ecologists similarly have suggested that a neutral model, in whichspecies in the same trophic level are functionally equivalent orneutral with respect to each other, might adequately explainspecies-abundance distributions in ecological communities(15–17). In anthropology, the recent availability of appropri-ately sampled community-level polymorphism data now enablesus to distinguish both genetic and cultural selection from neu-tral demographic processes with surprising precision. In theseIndonesian communities, male dominance seldom translatesinto increased fertility among descendents over evolutionarytimescales.
Materials and MethodsEwens Sampling Formula. Our statistical methods are based on the appropri-ateness of the Ewens sampling formula (5) as a null model for the processunder study. This sampling formula applies to closed populations in situationsthat meet the following criteria for samples, genetic data, infinite alleles, andequilibrium:
1. Samples: The sample size n is small compared with the constant haploidpopulation size, N.
2. Genetic Data: Each mutation is selectively neutral, taking place from 1generation to the next with probability �.
11648 � www.pnas.org�cgi�doi�10.1073�pnas.0710158105 Lansing et al.
3. Infinite Alleles: Each mutation gives rise to a novel haplotype.4. The population is in equilibrium.
The sampling formula gives the distribution of a sample taken from theassumed equilibrium frequency distribution or configuration of the popula-tion. A configuration is denoted by b � (b1,b2,. . . ) where bi is the number ofhaplotypes represented i times in a sample of n individuals. Thus, possiblesampling configurations satisfy �iibi � n. The Ewens sampling formula statesthat this configuration has probability
P�configuration b� �n!
��� � 1� . . .�� � n � 1��
i
� �
i�bi 1
bi!.
The choice of � generally is approximately equal to 2Ne� where Ne is theeffective population size.
We now examine the assumptions individually. Then we show how theEwens sampling formula forms the basis for a test of neutrality and anestimator of � based on the number of haplotypes. We apply the test and theestimator to the sample sites. Finally, we introduce a 2-parameter model toassess the impact of these departures from neutrality and the power of the testand compare our method with another approach.1. Samples. In total, 1269 Y chromosomes were collected from 41 communitieson 6 islands (Bali, Borneo, Flores, Java, Nias, Sumba) in Indonesia (Fig. S4).Sample sizes range from 16 to 54 individuals. All samples were collected fromvolunteer donors with written informed consent and appropriate permitsfrom the Indonesian Government via the Eijkman Institute for MolecularBiology. The University of Arizona Human Subject Committee approved sam-pling protocols. In all cases, care was taken to exclude individuals relatedwithin the last 3 generations, as determined by detailed personal genealogies.This aspect of the sampling procedure effectively eliminates the effects ofrecent demographic events.
Samples were designed to be a small proportion of the village. The numberof samples n in each community is given in Table S1. The assumption ofconstant population is a part of our null hypotheses. Departures from theconstant population assumption will be considered in our power analysis.2. Genetic data. The polymorphic sites from the nonrecombining part of humanY chromosome included a set of 74 previously published binary markers (18)and 4 additional polymorphisms: M208, M210, M346, and M356 (19–22).Binary markers were analyzed with a hierarchical strategy (23, 24) whenadditional sample genotyping was restricted to the appropriate downstreammutations along the haplogroup tree.
For the microsatellite analysis, 10 STRs (DYS19, DYS388, DYS389I, DYS389II,DYS390, DYS391, DYS392, DYS393, DYS426, and DYS439) were typed asdescribed by Redd et al. (25). Some sites also were scored for DYS438 andDYS457 loci. Table S1 indicates the total number of STRs typed for eachsampling location.
A haplotype is defined by its sequence of repeat numbers. Consequently, ahaplotype mutates if at least 1 STR mutates. If we let M denote the number ofSTRs, and let i denote the mutation rate for the ith Y-STR, then we cancalculate the mutation rate for Y-STR haplotypes as
� � P�at least one STR mutates� � 1 � P�no STR mutates�
� 1 � �i
P� ith STR does not mutate�
� 1 � �i
�1 � i�
� 1 � � 1 �1M� i� M
.
Consequently, � depends only on the average mutation rate, not its variabil-ity. Using the average STR mutation rate of 0.0021 per generation (26, 27) forthe average above, we calculate:
10 STRs: � � 1 � �1 � 0.0021�10 � 0.0208,
12 STRs: � � 1 � �1 � 0.0021�12 � 0.0249.
3. Infinite alleles. Y-STRs mutate by either increasing or decreasing their repeatnumber. The measure of the failure of the infinite alleles assumption is themean frequency of STR mutations that do not result in a novel haplotype. This
possibility of 2 individuals being identical in state but not identical by descentis called ‘‘homoplasy.’’
A variety of STR mutation models have been studied (28–30). Mutationmodels that permit multiple repeat changes are less likely to mutate to anexisting haplotype than mutation models that permit only a mutation chang-ing the repeat number by1. In addition, as we shall see, homoplasy affects testsfor neutrality and estimates for � only if it reduces the number of haplotypesin the sample. Irrespective of the model, the impact of homoplasy is to reducethe number of haplotypes and to increase the fraction of individuals thatbelong to common haplotypes.4. The population is in equilibrium. Neutral models for the evolution of theconfiguration of individuals are Markov chains. For Markov chains that modelthis evolution, the distribution of the configuration of haplotypes convergesto its equilibrium. The questions arise: What is the time needed for thisconvergence, and what is the nature of the convergence? Analytical resultsand simulations (data not shown here) confirm that these Markov chainspossess a cutoff phenomenon. The cutoff occurs at approximately Ne (log�)/�generations. Here, we take a generation to be 31 years (31).
The analysis also shows that a neutrally evolving population has reachedequilibrium if each individual in the population has experienced at least 1mutation along the line of descent connecting that individual to a foundingmember of the population. If a community is neutrally evolving but thegenetic data have not yet reached equilibrium, then the current populationwill have some signature of the founding population. Fig. S3A shows thisphenomenon for a single neutral population that began with all individualssharing the same haplotype.
Statistical Procedures. The Ewens sampling formula is a 1-parameter proba-bility distribution function. It can be expressed as the product of two terms
n!��� � 1�· · ·�� � n � 1�
�i
��
i�bi 1
bi!
� n! �i
�1i�
bi 1bi!
��K
��� � 1�· · ·�� � n � 1�.
For a fixed value of K, the first term gives the likelihood for a given configu-ration b. The second shows that the number of haplotypes K � i bi is asufficient statistic for the parameter �. Note that the form of this productshows that, given the number of haplotypes, the distribution of haplotypesdoes not depend on the parameter � and consequently does not depend oneither the population size or the mutation rate.
Test for Neutrality. Based on the first term in the product of the Ewenssampling formula, Slatkin (6, 7) developed an exact test for significant depar-tures from the neutral hypothesis. The exact test calculates the probability ofall configurations with fixed sample size, n, and fixed haplotype number, K,and sums the probabilities of the configurations that are less likely than theobserved configuration. That value, PE, is reported in Table S1. The test is2-tailed: values of PE � 0.025 indicate a departure from neutrality in thedirection of a distribution that is ‘‘too even,’’ often taken to indicate thepresence of balancing selection. Values of PE � 0.975 indicate departure inthe direction of an ‘‘overly uneven’’ distribution, which can indicate either thepresence of positive selection or demographic history. Table S1 shows thevalues of PE for all of the sampled villages. Highlighted departures fromneutrality have PE � 0.975.
Power Analysis. To determine the power of the test to detect neutrality underthe dominance model, populations were simulated under a range of param-eters values for � and � under 2 choices for village population size and 2 levelsof migration (Tables S2 and S3). For each set of parameters, 10,000 sampleswere simulated, the exact test was applied, and the number testing as non-neutral was counted. The estimated power of the test is the fraction testing asnonneutral. See SI Text for further details of the analysis
Estimate of �. The maximum likelihood estimator of � is found by solving (32):
K � �j�0
n1�
� � j,
Lansing et al. PNAS � August 19, 2008 � vol. 105 � no. 33 � 11649
AN
THRO
POLO
GY

where n is the sample size. Using value of � given earlier, we are able toestimate effective population size, Ne, using K. The values for K and theestimated values for � for each community are given in Table S1. We comparethese estimates with the number of male household heads known from censusdata in Table S4. Estimates for � are biased upwards.
ACKNOWLEDGMENTS. We thank these individuals for their analysis of thegenetic data at the Hammer Laboratory of the University of Arizona: Mery-anne Tumonggor, Yuliana Ling, Daniel Teberg, Megan Dragony, EmilyLandeen, Fernando Mendez, and Rachel Stewart. We also thank John Schoen-felder, who provided the sampling locations map, Jennifer Dunne, John
Pepper, and two anonymous reviewers for comments, and the 1269 Indone-sian men who made this study possible. Genetic samples were obtained by JSLand HS and by Golfiani Malik, Wuryantari Setiadi, Loa Helena Suryadi, andMeryanne Tumonggor of the Eijkman Institute, with the assistance of Indo-nesian Public Health clinic staff, following protocols for the protection ofhuman subjects established by both the Eijkman Institute and the Universityof Arizona Institutional Review Boards. This work was supported by theNational Science Foundation, the James McDonnell Foundation Robustnessprogram at the Santa Fe Institute, and the Eijkman Institute for MolecularBiology, Jakarta, Indonesia. Permission to conduct research in Indonesia wasgranted by the Indonesian Institute of Sciences.
1. Clarke AL, Low BS (2001) Testing evolutionary hypotheses with demographic data.Popul Dev Rev 27:633–660.
2. Winterhalder B, Smith E (2000) Analyzing adaptive strategies: Human behavioralecology at twenty-five. Evol Anthropol 9:51–72.
3. Cannings C (1974) The latent roots of certain Markov chains arising in genetics: A newapproach, I. Haploid models. Adv Appl Probab 6:260–290.
4. Sibert A, Austerlitz F, Heyer E (2002) Wright-Fisher revisited: The case of fertilitycorrelation. Theor Popul Biol 62:181–197.
5. Ewens WJ (1972) The sampling theory of selectively neutral alleles. Theor Popul Biol3:87–112.
6. Slatkin M (1996) A correction to the exact test based on the Ewens sampling distribu-tion. Genet Res 68:259–260.
7. Heyer E, Sibert A, Austerlitz F (2005) Cultural transmission of fitness: Genes take the fastlane. Trends Genet 21(4):234–239.
8. Van Valen L (1973) A new evolutionary law. Evol Theor 1:1–30.9. Lansing JS, et al. (2007) Coevolution of languages and genes on the island of Sumba,
eastern Indonesia. Proc Natl Acad Sci USA 104:16022–16026.10. Lansing JS (2006) Perfect Order: Recognizing Complexity in Bali (Princeton Univ Press,
Princeton, New Jersey).11. Fisher RA (1930) The Genetical Theory of Natural Selection (Clarendon Press, Oxford,
UK).12. Hofbauer J, Sigmund K (1991) The Theory of Evolution and Dynamical Systems
(Cambridge Univ Press, Cambridge, UK).13. Nowak, M. A (2006) Evolutionary Dynamics: Exploring the Equations of Life (Harvard
Univ Press, Cambridge, Massachusetts).14. Kimura M (1968) Evolutionary rate at the molecular level. Nature 217:624–626.15. Hubbell SP (2001) The Unified Neutral Theory of Biodiversity and Biogeography
(Princeton Univ Press, Princeton, New Jersey).16. Hu X-S, He F, Hubbell SP (2006) Neutral theory in macroecology and population
genetics. Oikos 113:548–556.17. Alonso D, Etienne R, McKane A (2006) The merits of neutral theory. Trends Ecol Evol
21:451–457.
18. Karafet TM, et al. (2005) Balinese Y-chromosome perspective on the peopling ofIndonesia: Genetic contributions from pre-Neolithic hunter-gatherers, Austronesianfarmers, and Indian traders. Hum Biol 77:93–114.
19. Kayser M, et al. (2003) Reduced Y-chromosome, but not mitochondrial DNA, diversityin human populations from West New Guinea. Am J Hum Genet 72:281–302.
20. Kayser M, et al. (2006) Melanesian and Asian origins of Polynesians: MtDNA andY-chromosome gradients across the Pacific. Mol Biol Evol 23:2234–2244.
21. Hudjashov G, et al. (2007) Revealing the prehistoric settlement of Australia by Ychromosome and mtDNA analysis. Proc Natl Acad Sci USA 104:8726–8730.
22. Sengupta S, et al. (2005) Polarity and temporality of high-resolution Y-chromosomedistributions in India identify both indigenous and exogenous expansions and revealminor genetic influence of Central Asian Pastoralists. Am J Hum Genet 78:202–221.
23. Underhill PA, et al. (2000) Y chromosome sequence variation and the history of humanpopulations. Nat Genet 26:358–361.
24. Hammer MF, et al. (2001) Hierarchical patterns of global human Y-chromosomediversity. Mol Biol Evol 18:1189–1203.
25. Redd AJ, et al. (2002) Forensic value of 14 novel STRs on the human Y chromosome.Forensic Sci Int 130:97–111.
26. Dupuy BM, Stenersen M, Egeland T, Olaisen B (2004) Y-chromosomal microsatellite mutationrates: Differences in mutation rate between and within loci. Hum Mutat 23:117–124.
27. Gusmao L, et al. (2005) Mutation rates at Y chromosome specific microsatellites. HumMutat 26:520–528.
28. Di Rienzo A, et al. (1994) Mutational processes of simple-sequence repeat loci in humanpopulations. Proc Natl Acad Sci USA 91:3166–3170.
29. Sainudiin R, Durrett RT, Aquadro CF, Nielsen R (2004) Microsatellite mutation models:Insights from a comparison of humans and chimpanzees. Genetics 168:383–395.
30. Watkins JC (2007) Microsatellite evolution: Markov transition functions for a suite ofmodels. Theor Popul Biol 71:147–159.
31. Fenner JN (2005) Cross-cultural estimation of the human generation interval for use ingenetics-based population divergence studies. Am J Phys Anthropol 128:415–423.
32. Tavare, S., Zeitouni, O (2004) Lectures on Probability Theory and Statistics. Ecole d’Etesde Probabilite de Saint-Flour XXXI (Springer-Verlag, New York).
11650 � www.pnas.org�cgi�doi�10.1073�pnas.0710158105 Lansing et al.
Supporting InformationLansing et al. 10.1073/pnas.0710158105SI TextPopulation Models. We take as our neutral model the standardhaploid Wright-Fisher model with constant population size, N,and discrete generations (1). In each generation, the N sonschoose their fathers from the previous generation with equalprobability 1/N and inherit the label of their father. This isequivalent to choosing sons according to a multinomialMulti(N;(1/N,. . . .,1/N)) distribution.
With reproductive skew, some subset of the population is morelikely to reproduce. In the Wright-Fisher model this correspondsto non-uniform probabilities of individuals being chosen asfathers. For each of the N individuals, let �i, 1 � i � 1, �i�i �1, be the probability that the ith individual is chosen as a father.This defines the ‘‘propensity to reproduce’’ vector:
� � ��1, . . .,�N�
For the neutral case this is simply:
� � � 1N
,. . .,1N�.
To investigate the power of the test, we must set an alternativeto neutrality. For this purpose, we introduce a 3-parametermodel that captures the central concept of a dominant groupreproducing more on average. Let � denote the fraction ofdominant individuals, � denote the selective advantage for thedominant individuals, and p denote the fraction of the dominantclass that enters from the non-dominant class in a givengeneration.
Write
� � �1 � �,1 � �,. . .,1 � �,1,1,. . .1�/�N�1 � ���� ,
where N� entries take the value 1 � � and the remaining N(1 ��) entries are 1. Equivalently, in this model, sons are chosenaccording to a Multi(N; 1 � �,. . . ,1 � �,1,. . . ,1)/(N(1 � ��))distribution.
To include migration into these models, a fraction m of themen are replaced with migrants. These migrants are modeled asmales having a new haplotype.
N� males are chosen to become the dominant males in the nextgeneration. For our model of heritable reproductive skew (p �0), the dominant males in 1 generation are chosen at randomfrom the offspring of dominant males in the previous generation.For the model of non-heritable reproductive skew, these malesare chosen at random from the entire population. For p � 0, eachindividual in the dominant group is removed from this groupwith probability p and replaced with a previously non-dominantindividual who now becomes dominant. Thus, under thesemodels of reproductive skew, the fraction of the dominant groupremains fixed at �.
Robustness and Power Analysis. All of the communities that rejectneutrality do so by having too few haplotypes and by havingcommon haplotypes too commonly represented. This coincideswith the concerns about homoplasy affecting the infinite allelesassumption and too recent a founding of communities affectingthe assumption of equilibrium. This makes the rejection ofneutrality more likely and leads us to conclude that the claims ofneutrality are conservative based on the assumptions needed touse the Ewens sampling formula.
The power of the Ewens exact test depends on the parameters
�, �, p, and � � 2Ne(� � m). Values for � have been determinedin the Materials and Methods section. We now look to establishrepresentative values for the migration rate, m and the effectivepopulation size, Ne.
Estimation of Balinese Migration Rates from Y-Chromosome Micro-satellites. Migration rates were estimated for 6 population pairslocated in the central Mount Batur region of Bali. Gene flow wasinferred under a generalized, non-equilibrium demographicmodel, isolation-with-migration (IM). This model describes aconstant-sized ancestral population that splits into 2 daughterpopulations linked by ongoing migration (2). Current implemen-tations allow these daughter populations to grow or contract (3).Unlike traditional equilibrium models (e.g., island and diver-gence models), the IM model allows migration rates to beinferred against a backdrop of shared polymorphism derivedthrough common ancestry.
The computer software IM (http://lifesci.rutgers.edu/�heylab/HeylabSoftware.htm#IM; version 16/8/07), imple-ments the IM model using Markov chain Monte Carlo and aBayesian approach to parameter estimation. Uniform priordistributions are established for 7 parameters of interest: theeffective sizes of the ancestral deme and its 2 daughter demes,the proportion of the ancestral population that founded the firstdaughter deme, the time at which the ancestral population split,and unidirectional migration rates between the 2 descendentdemes. Only marginal posterior densities for the migration rateparameters are of immediate interest here.
Analyses were undertaken on completely linked Y-chromosome STRs under a single-step mutation model ofmicrosatellite evolution. Three independent runs with multiplegeometrically heated Markov chains ensured complete chainmixing via Metropolis-Hastings coupling, thereby leading toconvergence of the posterior density to its true stationarydistribution.
Averaged across the 6 population pairs, unidirectional migra-tion rates (i.e., considering only the men entering a community)approach m � 0.036 per generation. Note that these valuesprobably are toward the high end for migration rates betweenIndonesian populations. These particular communities are lo-cated only a few kilometers apart, usually on the same riversystem, and were chosen specifically because they are close bothgeographically and culturally. For instance, 1 community in eachpopulation pair probably budded from the other within the last30 generations, and all communities speak the same language,Balinese. These conditions are not representative of most of oursamples. We conclude that the migration rates inferred above forcentral Balinese communities provide upper limits on migrationrates between small human communities in Indonesia.
Village Size. For each of the 41 villages, the number of householdswas determined. These values and the source of the informationis given in Table S4. In addition, estimates of effective populationsize Ne are based on the maximum likelihood estimate of �assuming no migration. Consequently, villages experiencinghistorically significant migration will have increased estimatesfor Ne. This is particularly noticeable for villages in Bali, assuggested by the analysis of migration rates given previously.
Power Analysis. Based on the information on migration andvillage size, we shall consider 2 circumstances for the poweranalysis:
Lansing et al. www.pnas.org/cgi/content/short/0710158105 1 of 18

1. Villages population n � 100, samples of size n � 20, andmutation rate � � 0.0208.
2. Villages population n � 300, samples of size n � 35, andmutation rate � � 0.0249.
To compute an empirical power function, we fix a value for �and � and simulate a non-neutral population of size N until itreaches equilibrium and then draw at random a sample of sizen for the next 10,000 generations. At each generation, computethe statistics PE from Slatkin’s exact text. Under the neutralmodel, PE is uniformly distributed from 0 to 1 independent of thevalue of K, the number of haplotypes.
To estimate the power for a 5%-level test, we take the 2-sidedrejection region consisting of values of PE either below 0.025 orabove 0.975 and tabulate the fraction of instances in which thetest is rejected. This fraction is the estimate of the power of thetest.
Impact of Non-Heritable Reproductive Skew. The impact of non-heritable reproductive skew is assessed by inclusion of theparameter p described previously. Simulations to determinepower, displayed in Fig. 4A, are calculated in the same way asthose in Tables S2 and S3 for � and �. Values for the effectivepopulation size (Fig. 4B) were determined by taking the maxi-mum likelihood estimate for � and dividing by twice the mutationrate (� � 2Ne�).
The case p � 1 falls under the general exchangeable modelsof Cannings (ref. 3 in text). Thus, samples under equilibrium will,under the same assumptions as before, satisfy the Ewens sam-pling formula and appear neutral under the Ewens exact test. Inthis case, however, the inbreeding effective population size isreduced by a factor (�� � 1)2/((� � 1)2� � 1 � �).
Comparison with Another Approach. As described in the text, Sibertet al. (4) present a classification for the cultural inheritance offitness. Their inferential techniques are based on statistics thatmeasure the imbalance of genealogical trees. In Blum, et al. (5),these techniques are applied to examine mtDNA data and makeinferences concerning maternal fertility inheritance. They applytheir techniques to compare fertility inheritance between food-producing populations and hunter-gatherer populations.
Direct comparison of methods is difficult. Their studies usepublicly available mtDNA data. In this study, we collect Y-chromosome data under a sampling strategy designed to inves-tigate the history of communities. In addition, we choose a modelfor departure from neutrality that is more suitable for our study.The exact test has an advantage over the tree imbalance testbecause it is non-parametric.
All simulations were performed in MATLAB, and copies ofthe code are available on request.
1. Tavare S, Zeitouni O (2004) Lectures on Probability Theory and Statistics. Ecole d’Etesde Probabilite de Saint-Flour XXXI (Springer-Verlag, New York).
2. Nielsen R, Wakeley J (2001) Distinguishing migration from isolation: a Markov chainMonte Carlo approach. Genetics 158:885–896.
3. Hey J (2005) On the number of New World founders: a population genetic portrait ofthe peopling of the Americas. PLoS Biol 3:e193.
4. Sibert A, Austerlitz F, Heyer E (2002) Wright-Fisher revisited: The case of fertilitycorrelation. Theor Popul Biol 62:181–197.
5. Blum MGB, Heyer E, Francois O, Austerlitz F (2006) Matrilineal fertility inheritancedetected in hunter-gatherer populations using the imbalance of gene genealogies.PLoS Genet 2:1138–1146.
Lansing et al. www.pnas.org/cgi/content/short/0710158105 2 of 18
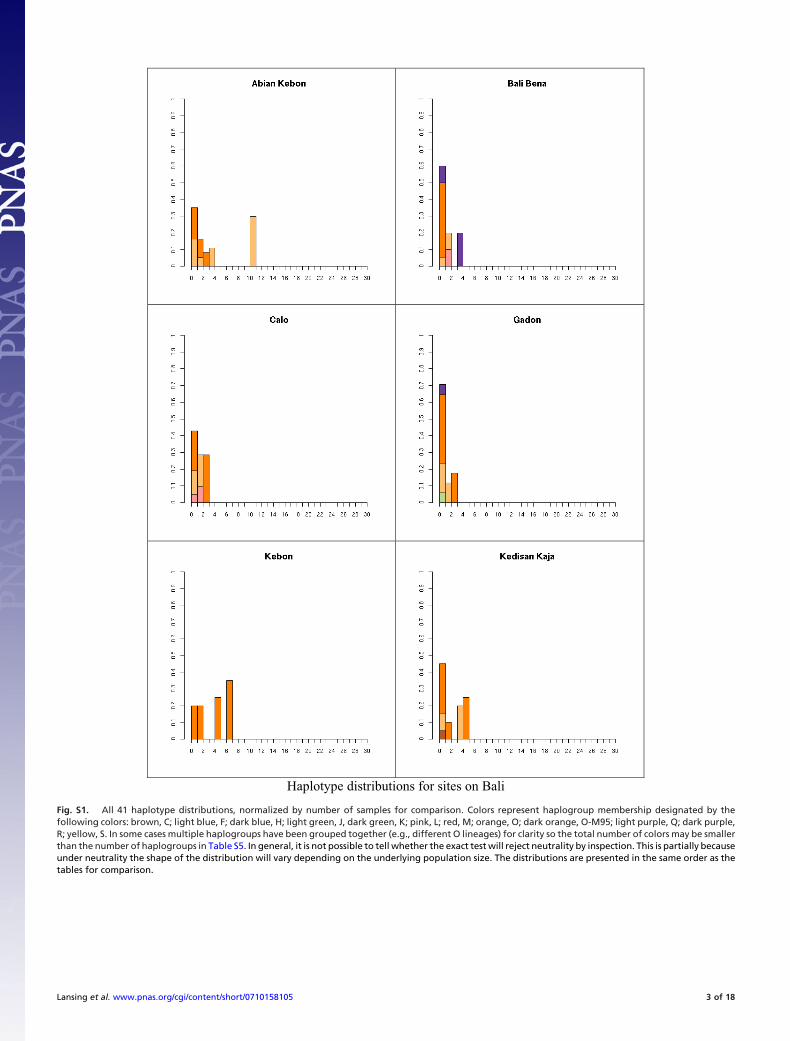
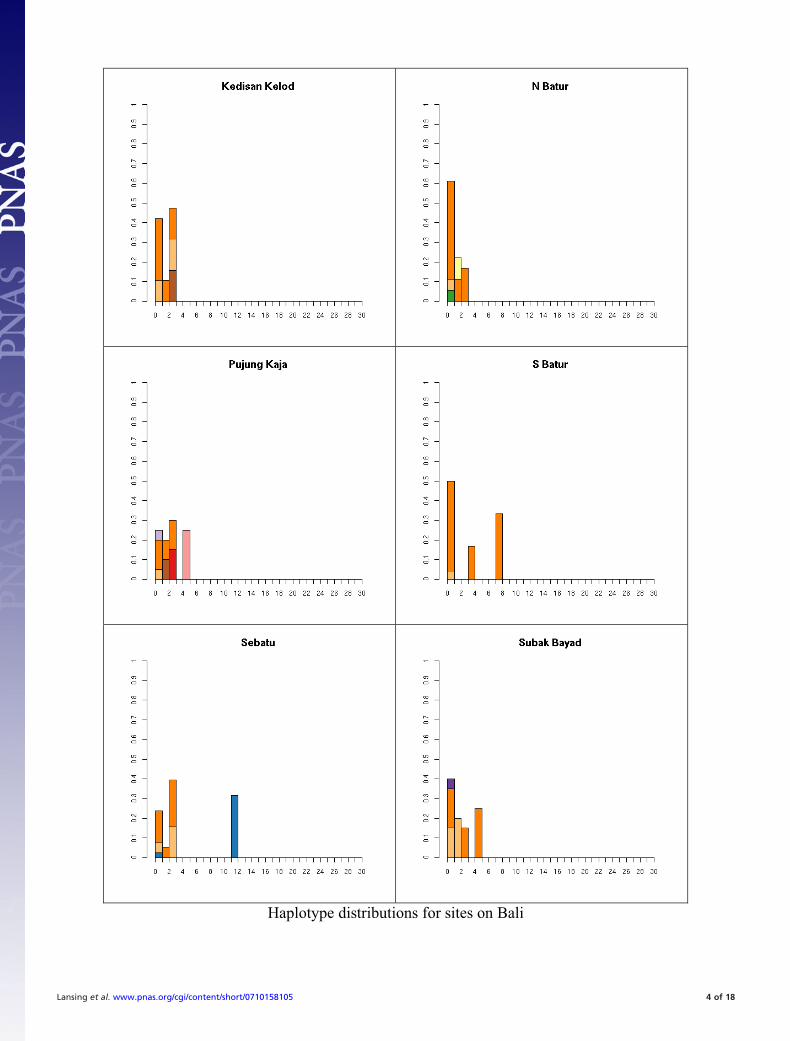
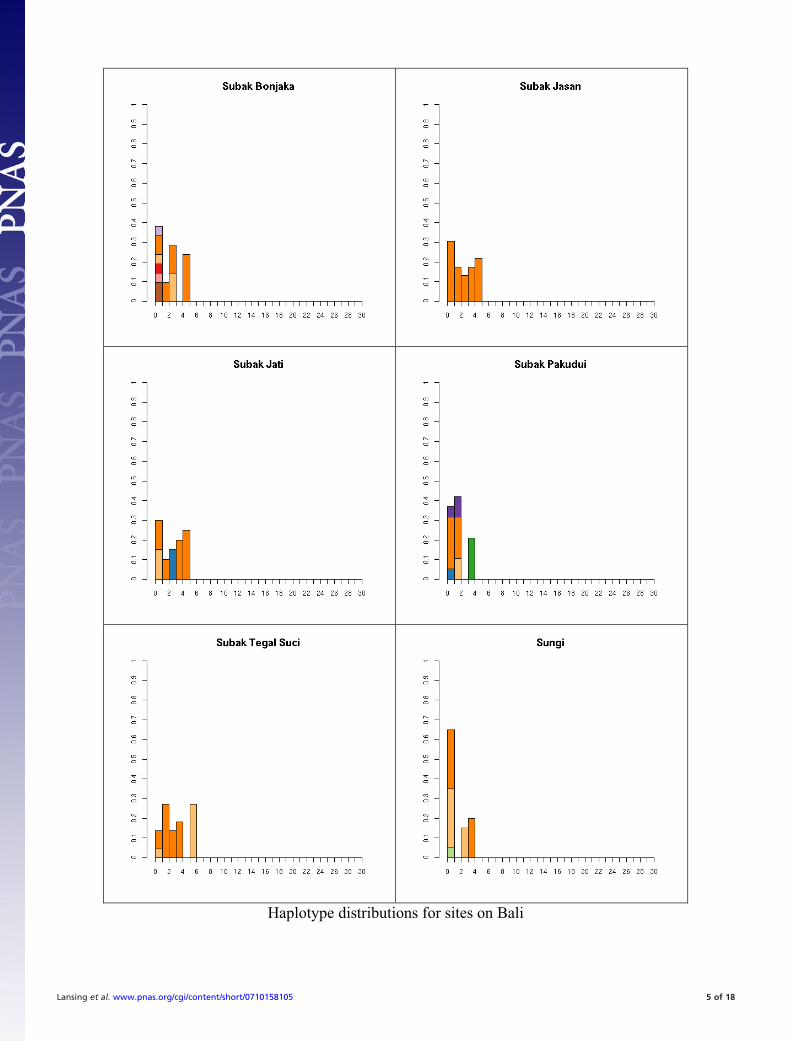
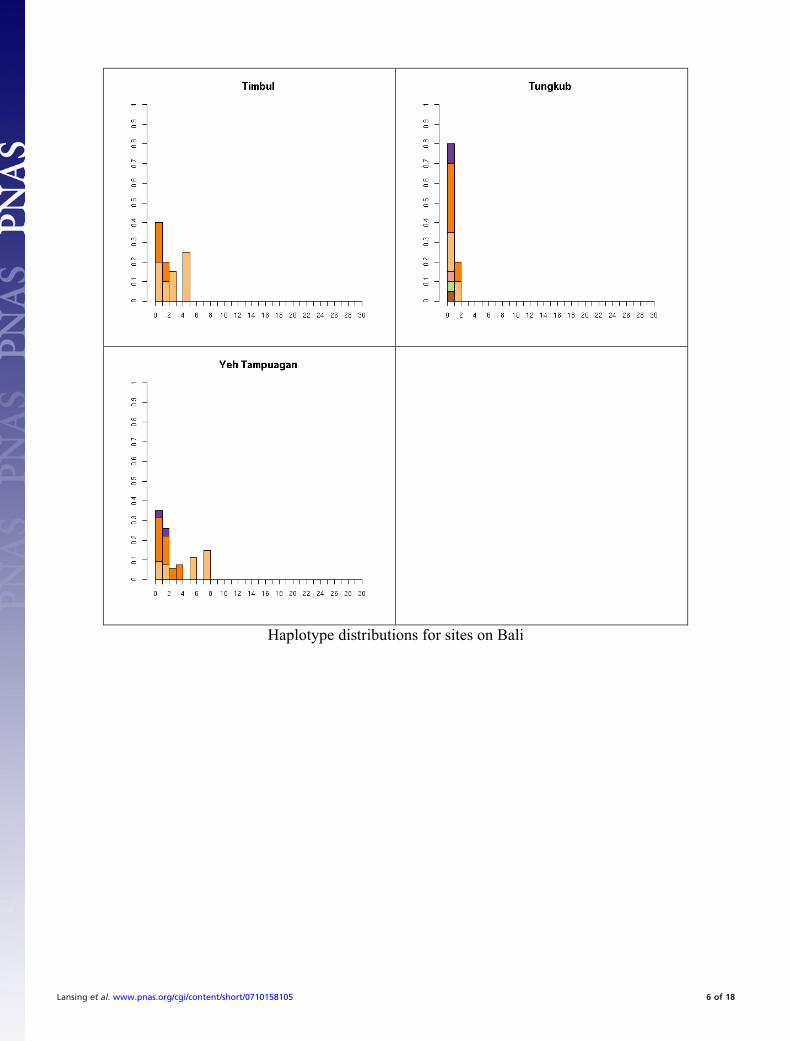
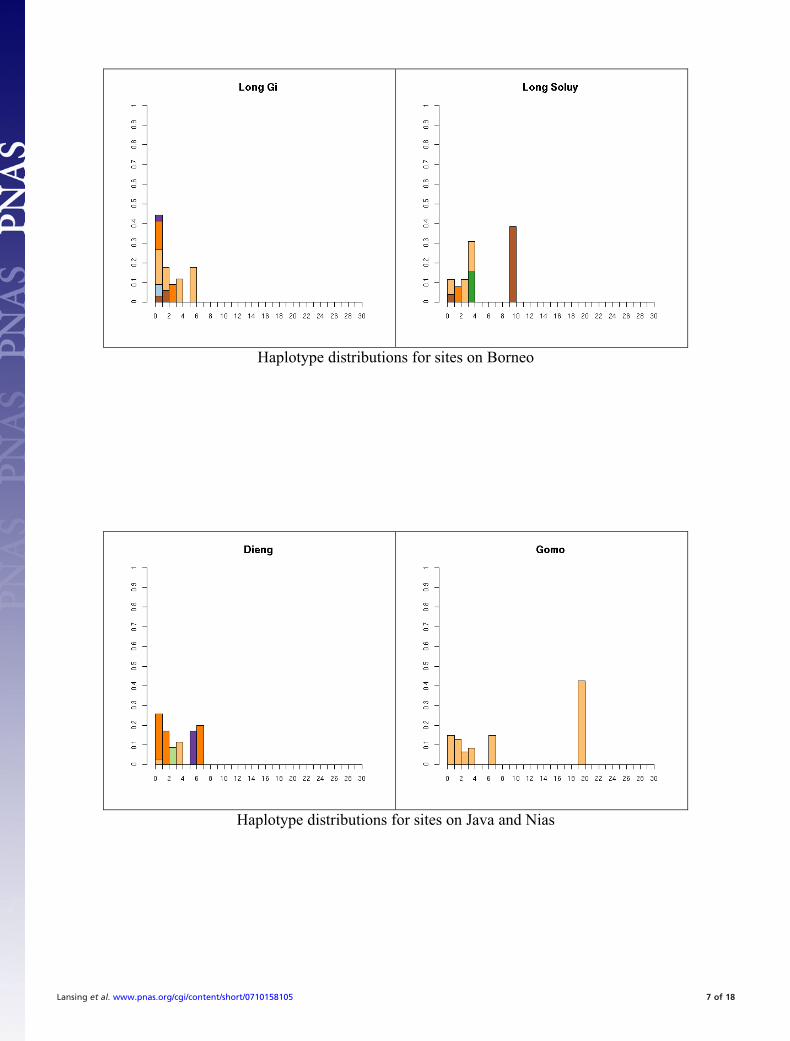
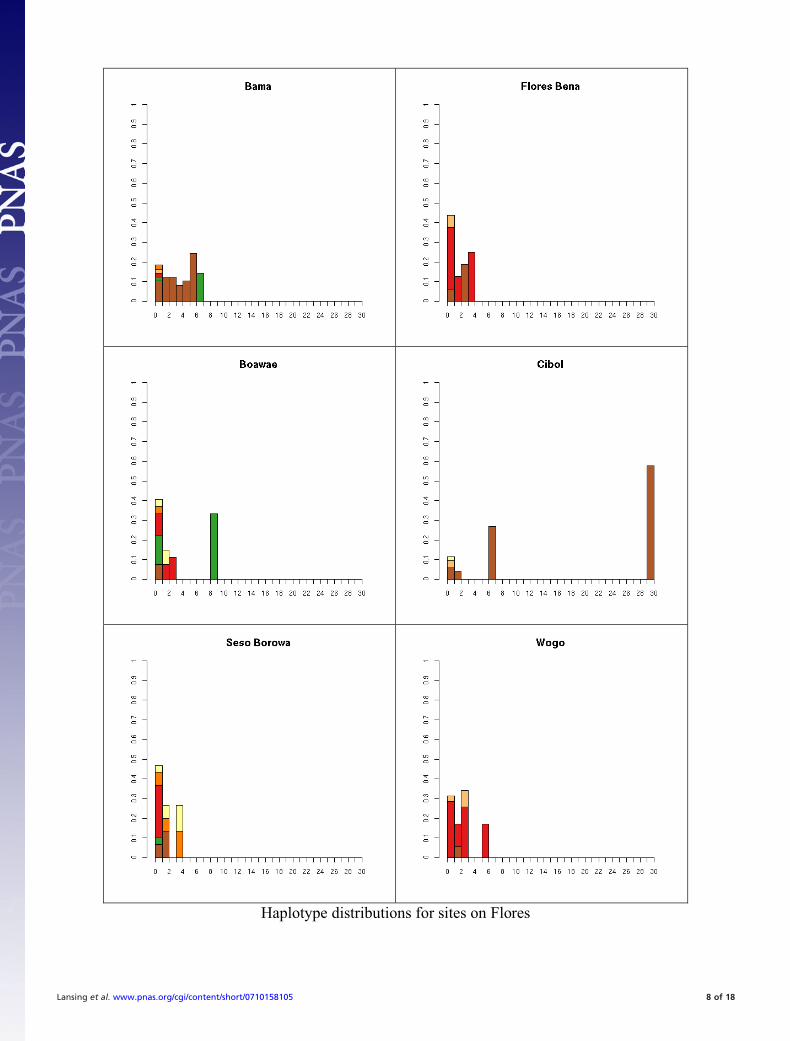
Haplotype distributions for sites on Bali
Fig. S1. All 41 haplotype distributions, normalized by number of samples for comparison. Colors represent haplogroup membership designated by thefollowing colors: brown, C; light blue, F; dark blue, H; light green, J, dark green, K; pink, L; red, M; orange, O; dark orange, O-M95; light purple, Q; dark purple,R; yellow, S. In some cases multiple haplogroups have been grouped together (e.g., different O lineages) for clarity so the total number of colors may be smallerthan the number of haplogroups in Table S5. In general, it is not possible to tell whether the exact test will reject neutrality by inspection. This is partially becauseunder neutrality the shape of the distribution will vary depending on the underlying population size. The distributions are presented in the same order as thetables for comparison.
Lansing et al. www.pnas.org/cgi/content/short/0710158105 3 of 18
Haplotype distributions for sites on Bali
Lansing et al. www.pnas.org/cgi/content/short/0710158105 4 of 18
Haplotype distributions for sites on Bali
Lansing et al. www.pnas.org/cgi/content/short/0710158105 5 of 18
Haplotype distributions for sites on Bali
Lansing et al. www.pnas.org/cgi/content/short/0710158105 6 of 18
Haplotype distributions for sites on Borneo
Haplotype distributions for sites on Java and Nias
Lansing et al. www.pnas.org/cgi/content/short/0710158105 7 of 18
Haplotype distributions for sites on Flores
Lansing et al. www.pnas.org/cgi/content/short/0710158105 8 of 18

Haplotype distributions for sites on Flores
Haplotype distributions for sites on Sumba
Lansing et al. www.pnas.org/cgi/content/short/0710158105 9 of 18
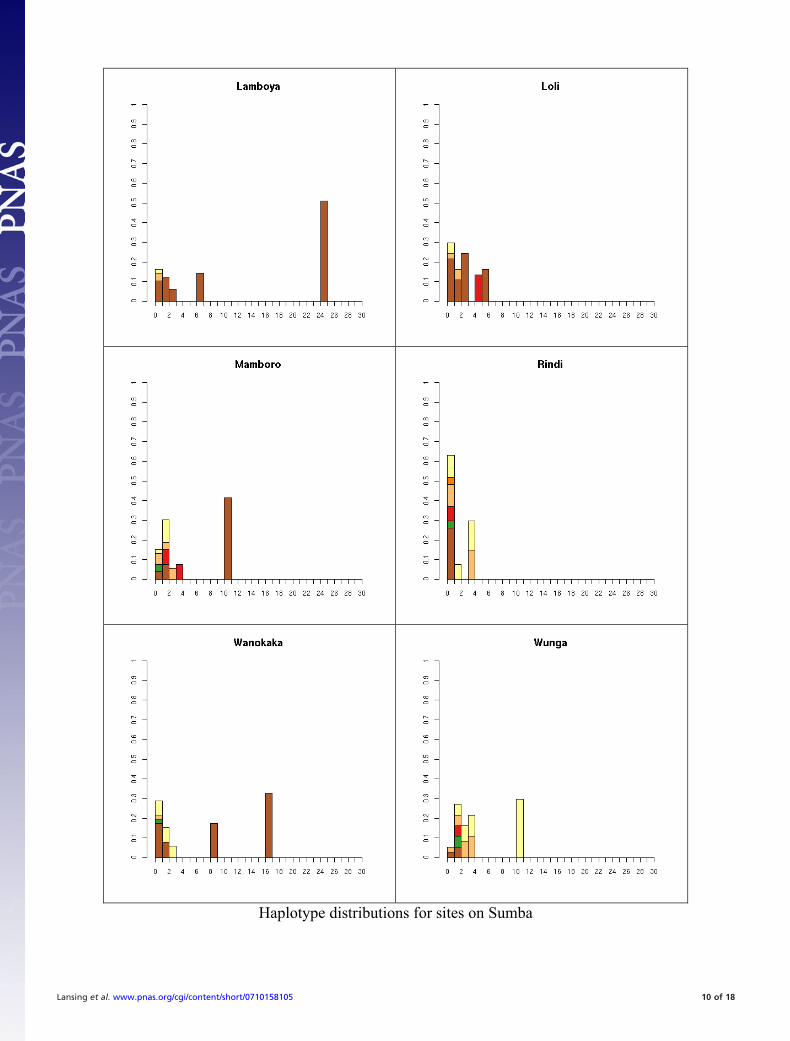
Haplotype distributions for sites on Sumba
Lansing et al. www.pnas.org/cgi/content/short/0710158105 10 of 18

2 4 6 8 10 12 14 16 18 200
5
10
15
20
25
30
35
Generation
Num
ber
of L
inea
ges
No dominanceDominance
Fig. S2. Reduction of the number of lineages during a bottleneck of size 35. The graph shows the average number of lineages each generation for 5000simulated populations. For the dominance case, the parameters are � � 0.06 and � � 2.
Lansing et al. www.pnas.org/cgi/content/short/0710158105 11 of 18

Fig. S3. Examples of performance of exact test after recovery from bottleneck/founder effect. In both simulations the initial population size is 35 and thepopulation grows to a final size of 300 over 25 generations (750 years). The graphs show the value of PE from the exact test for each generation. (A) Neutralpopulation. The initial state is all individuals sharing a single haplotype, the case yielding the most false positives for the exact test. (B) Non-neutral populationwith � � 0.05 and � � 2 with the initial state a sample of 35 from a non-neutral population of size 300 with the same dominance parameters. This choice of initialstate is more likely to yield false negatives than starting the reduced haplotype diversity expected to emerge from a bottleneck. This indicates that bottlenecksare more likely to produce false positive results rather than to mask dominance. For this simulation, 0.54 samples tested as non-neutral, similar the rate expectedbased on the power of the test with constant population size (Tables S2 and S3).
Lansing et al. www.pnas.org/cgi/content/short/0710158105 12 of 18

Fig. S4. Map showing community sampling locations (red) in Indonesia. Sampled islands (west to east) are Nias, Java, Bali, Borneo, Sumba and Flores.
Lansing et al. www.pnas.org/cgi/content/short/0710158105 13 of 18
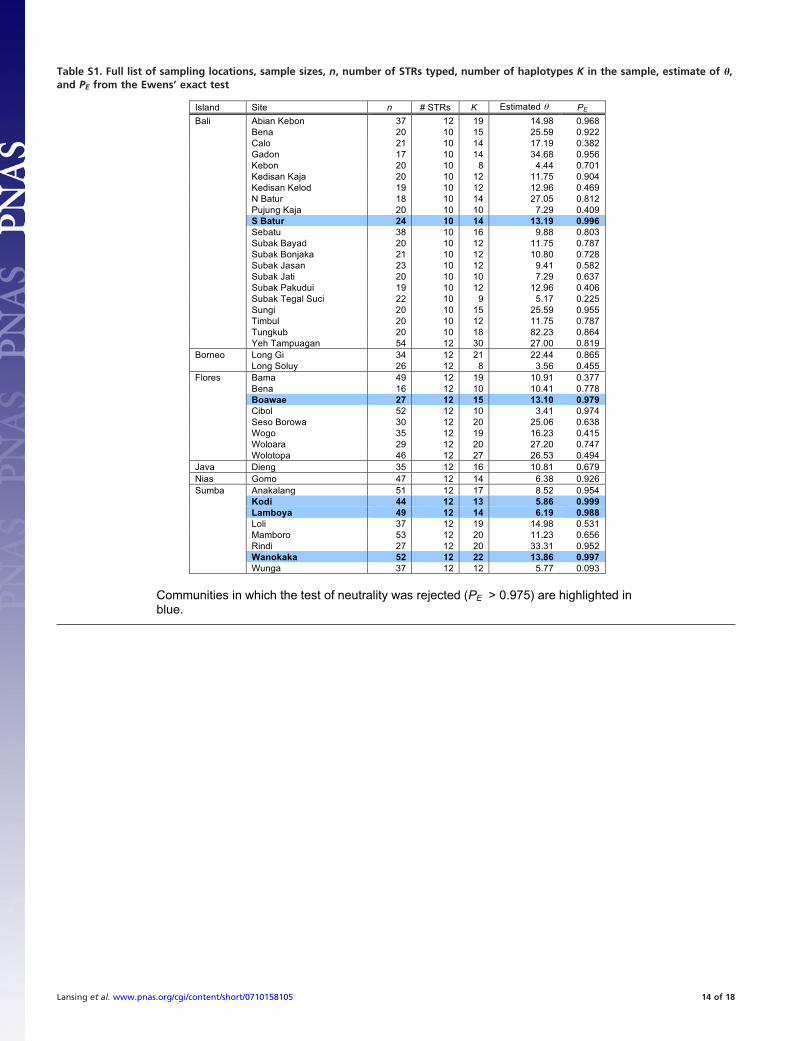
Table S1. Full list of sampling locations, sample sizes, n, number of STRs typed, number of haplotypes K in the sample, estimate of �,and PE from the Ewens’ exact test
Island Site n # STRs K Estimated PE
Bali Abian Kebon 37 12 19 14.98 0.968Bena 20 10 15 25.59 0.922Calo 21 10 14 17.19 0.382Gadon 17 10 14 34.68 0.956Kebon 20 10 8 4.44 0.701Kedisan Kaja 20 10 12 11.75 0.904Kedisan Kelod 19 10 12 12.96 0.469N Batur 18 10 14 27.05 0.812Pujung Kaja 20 10 10 7.29 0.409S Batur 24 10 14 13.19 0.996Sebatu 38 10 16 9.88 0.803Subak Bayad 20 10 12 11.75 0.787Subak Bonjaka 21 10 12 10.80 0.728Subak Jasan 23 10 12 9.41 0.582Subak Jati 20 10 10 7.29 0.637Subak Pakudui 19 10 12 12.96 0.406Subak Tegal Suci 22 10 9 5.17 0.225Sungi 20 10 15 25.59 0.955Timbul 20 10 12 11.75 0.787Tungkub 20 10 18 82.23 0.864Yeh Tampuagan 54 12 30 27.00 0.819
Borneo Long Gi 34 12 21 22.44 0.865Long Soluy 26 12 8 3.56 0.455
Flores Bama 49 12 19 10.91 0.377Bena 16 12 10 10.41 0.778Boawae 27 12 15 13.10 0.979Cibol 52 12 10 3.41 0.974Seso Borowa 30 12 20 25.06 0.638Wogo 35 12 19 16.23 0.415Woloara 29 12 20 27.20 0.747Wolotopa 46 12 27 26.53 0.494
Java Dieng 35 12 16 10.81 0.679Nias Gomo 47 12 14 6.38 0.926Sumba Anakalang 51 12 17 8.52 0.954
Kodi 44 12 13 5.86 0.999Lamboya 49 12 14 6.19 0.988Loli 37 12 19 14.98 0.531Mamboro 53 12 20 11.23 0.656Rindi 27 12 20 33.31 0.952Wanokaka 52 12 22 13.86 0.997Wunga 37 12 12 5.77 0.093
Communities in which the test of neutrality was rejected (PE > 0.975) are highlighted in blue.
Lansing et al. www.pnas.org/cgi/content/short/0710158105 14 of 18

Table S2. Power of exact test under different model parameters*
Power for different parameters
N = 100 n = 20 m = 0.0208 10000 samples
m = 0% dom s = 1 s = 2 s = 3 s = 4
0 0.06 0.06 0.05 0.062 0.05 0.06 0.13 0.354 0.05 0.32 0.43 0.476 0.18 0.37 0.42 0.438 0.27 0.35 0.40 0.45
10 0.28 0.36 0.36 0.39
m = 0.010 0.05 0.05 0.05 0.052 0.05 0.05 0.17 0.084 0.09 0.29 0.35 0.416 0.07 0.32 0.36 0.408 0.24 0.32 0.32 0.36
10 0.22 0.30 0.28 0.31
m = 0.030 0.05 0.05 0.05 0.042 0.04 0.04 0.11 0.164 0.04 0.26 0.34 0.396 0.06 0.27 0.34 0.358 0.10 0.29 0.30 0.29
10 0.23 0.26 0.26 0.24
Power Cutoff Prob 5/410.19 0.200.22 0.100.24 0.050.29 0.01
The population and samples sizes were chosen to correspond with samples from Bali, where in general there were fewer samples and the villages are smaller. Power of the test with moderate and high migration is indicated by the values under the headings m =0.01 and m = 0.03. The orange colors correspond to the cutoff values for different levels of power needed to make seeing 5/41 or fewer non-neutral villages unlikely at different levels (Figure 3).
Lansing et al. www.pnas.org/cgi/content/short/0710158105 15 of 18

Table S3. Power of exact test under different model parameters
Power for different parameters
N = 300 n = 35 m = 0.0249 10000 samples
m = 0% dom s = 1 s = 2 s = 3 s = 4
0 0.04 0.04 0.05 0.042 0.23 0.51 0.61 0.644 0.39 0.52 0.54 0.526 0.41 0.42 0.40 0.378 0.40 0.38 0.28 0.25
10 0.33 0.28 0.23 0.19
m = 0.010 0.03 0.04 0.04 0.042 0.21 0.47 0.64 0.654 0.36 0.54 0.52 0.546 0.41 0.47 0.42 0.378 0.35 0.40 0.32 0.28
10 0.30 0.32 0.24 0.18
m = 0.030 0.04 0.03 0.04 0.042 0.17 0.40 0.54 0.614 0.28 0.50 0.56 0.576 0.30 0.44 0.41 0.408 0.30 0.35 0.31 0.30
10 0.27 0.28 0.25 0.22
Power Cutoff Prob 5/410.19 0.200.22 0.100.24 0.050.29 0.01
The population and samples sizes were chosen to correspond with the samples where in general we have more samples and the villages are larger. Power of the test with moderate and high migration is indicated by the values under the headings m = 0.01 and m = 0.03. The orange colors correspond to the cutoff values for different levels of power needed to make seeing 5/41 or fewer non-neutral villages unlikely at different levels (Figure 3).
Lansing et al. www.pnas.org/cgi/content/short/0710158105 16 of 18

Table S4. Sites, sample size n, estimates of Ne, number of households and source of data for household numbers
Island Site n Estimated Ne # of households Source Bali Abian Kebon 37 300.87 223 1 Bena 20 615.24 190 1 Calo 21 413.16 68 1 Gadon 17 833.69 545 1 Kebon 20 106.73 70 1 Kedisan Kaja 20 282.38 93 1 Kedisan Kelod 19 311.50 89 1 N Batur 18 650.34 431 1 Pujung Kaja 20 175.24 140 1 S Batur 24 317.02 2027 1 Sebatu 38 237.58 216 1 Subak Bayad 20 282.38 80 1 Subak Bonjaka 21 259.61 70 1 Subak Jasan 23 226.19 158 1 Subak Jati 20 175.24 53 1 Subak Pakudui 19 311.50 65 1 Subak Tegal Suci 22 124.32 69 1 Sungi 20 615.24 230 1 Timbul 20 282.38 210 1 Tungkub 20 1976.62 617 1 Yeh Tampuagan 54 542.23 256 1 Borneo Long Gi 34 450.51 NA Long Soluy 26 71.52 NA Flores Bama 49 219.13 169 1 Bena 16 208.96 NA Boawae 27 263.14 734 1 Cibol 52 68.47 75 1 Seso Borowa 30 503.12 299 1 Wogo 35 325.82 400 2 Woloara 29 546.24 240 3 Wolotopa 46 532.64 227 1 Java Dieng 35 217.09 170 1 Nias Gomo 47 128.02 NA Sumba Anakalang 51 171.08 NA Kodi 44 117.64 450 2 Lamboya 49 124.30 352 Loli 37 300.87 143 1 Mamboro 53 225.42 320 1 Rindi 27 668.91 237 4 Wanokaka 52 278.27 NA Wunga 37 115.78 93 2
Orange indicates sampling locations where Ne < # households. Bold sites tested as non-neutral. Key: 1, village records (male household heads); 2, village informant estimate; 3, regression fit; 4, Government Statistics Office, East Sumba 2003. The regression fit estimated the number of household heads from the number of males in the population based on the regression line for other sites that had both pieces of information.
2
Lansing et al. www.pnas.org/cgi/content/short/0710158105 17 of 18

Table S5. Haplogroup counts for all sites
Lansing et al. www.pnas.org/cgi/content/short/0710158105 18 of 18