Embed Size (px)
Citation preview

Bru
ker
Dal
toni
cs is
con
tinua
lly im
prov
ing
its p
rodu
cts
and
rese
rves
the
rig
ht
to c
hang
e sp
ecifi
catio
ns w
ithou
t no
tice.
© B
DA
L 07
-201
3, 1
8218
23
Innovation with IntegrityMass Spectrometry
Direct Imaging of proteins, peptides, lipids, metabolites and drugs in tissues
MALDI Imaging – Mass Spectrometric Imaging
MALDI Imaging Instrumentation and Software
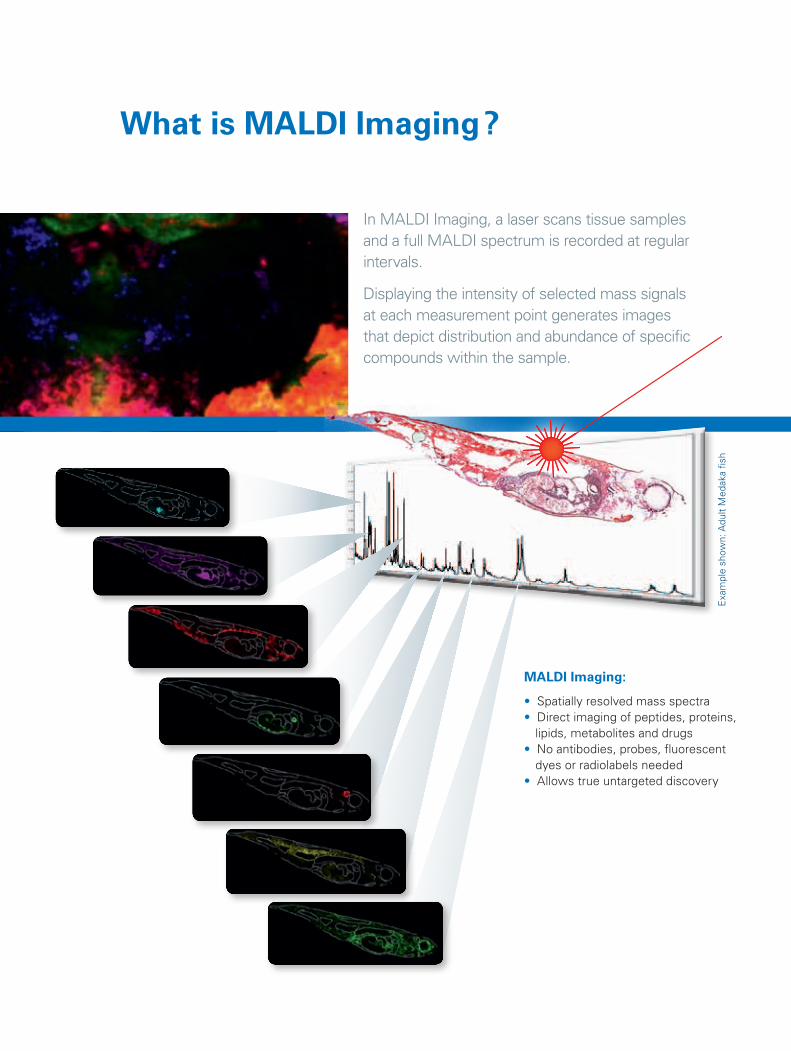
What is MALDI Imaging?
In MALDI Imaging, a laser scans tissue samples and a full MALDI spectrum is recorded at regular intervals.
Displaying the intensity of selected mass signals at each measurement point generates images that depict distribution and abundance of specific compounds within the sample.
Exa
mpl
e sh
own:
Adu
lt M
edak
a fis
h
MALDI Imaging:
• Spatially resolved mass spectra• Direct imaging of peptides, proteins, lipids, metabolites and drugs• No antibodies, probes, fluorescent dyes or radiolabels needed• Allows true untargeted discovery
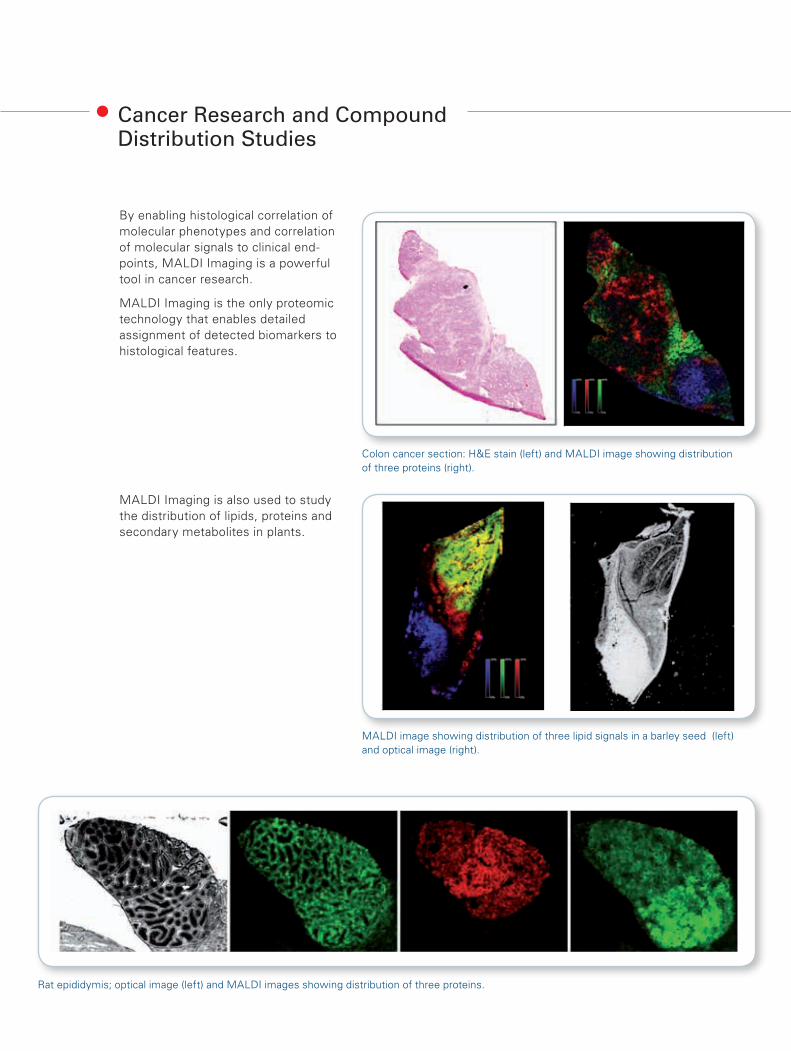
By enabling histological correlation of molecular phenotypes and correlation of molecular signals to clinical end-points, MALDI Imaging is a powerful tool in cancer research.
MALDI Imaging is the only proteomic technology that enables detailed assignment of detected biomarkers to histological features.
MALDI Imaging is also used to study the distribution of lipids, proteins and secondary metabolites in plants.
Cancer Research and Compound Distribution Studies
Colon cancer section: H&E stain (left) and MALDI image showing distribution of three proteins (right).
MALDI image showing distribution of three lipid signals in a barley seed (left) and optical image (right).
Rat epididymis; optical image (left) and MALDI images showing distribution of three proteins.

A Clinical Discovery Workflow
MALDI Imaging is perfectly suited to analyze biomarkers in tissue samples
Inflammation
Tumor
Connective Tissue
Patient Samples
Histology MALDI Images
Annotation
Statistical Analysis
Group 1
Group 2
Group 1 Group 2
Biomarker
Bruker software supports the entire workflow, including statistical analysis
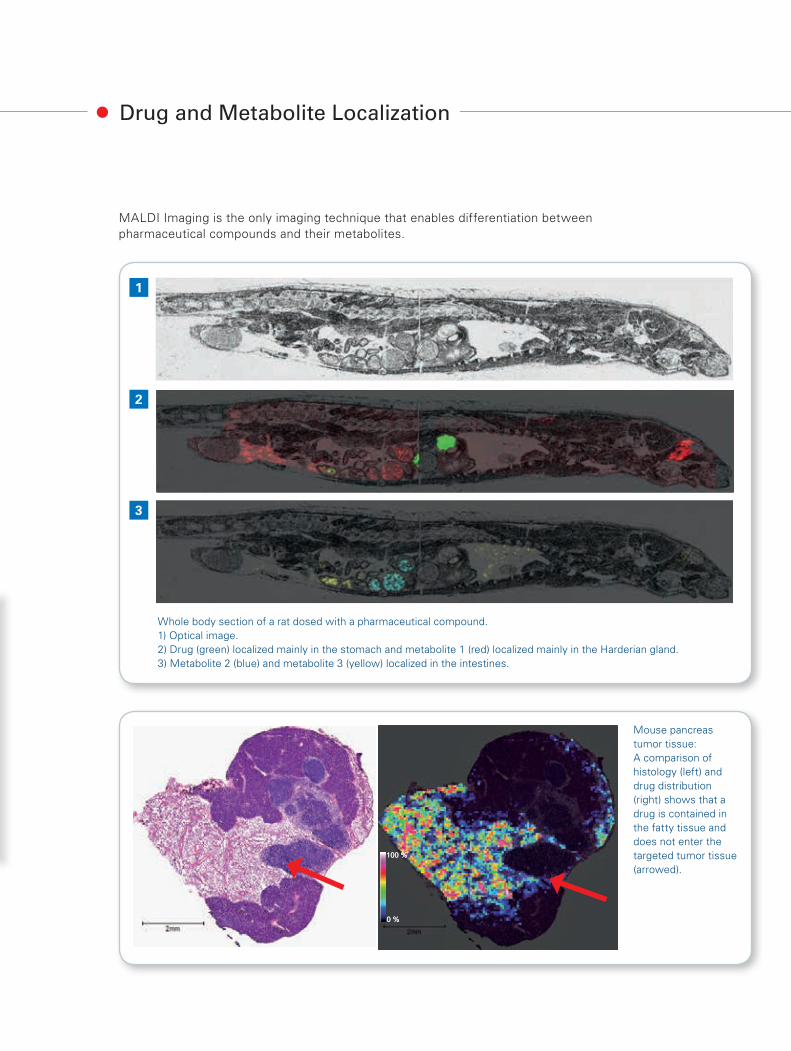
MALDI Imaging is the only imaging technique that enables differentiation between pharmaceutical compounds and their metabolites.
Drug and Metabolite Localization
1
2
3
Whole body section of a rat dosed with a pharmaceutical compound.1) Optical image.2) Drug (green) localized mainly in the stomach and metabolite 1 (red) localized mainly in the Harderian gland.3) Metabolite 2 (blue) and metabolite 3 (yellow) localized in the intestines.
0 %
100 %
0 %
100 %
m/z 393 394 395 396 397 398 399
rela
tive
inte
nsity
m/z 394
0 %
100 %
0 %
100 %
m/z 393 394 395 396 397 398 399
rela
tive
inte
nsity
m/z 394Mouse pancreas tumor tissue: A comparison of histology (left) and drug distribution (right) shows that a drug is contained in the fatty tissue and does not enter the targeted tumor tissue (arrowed).

While MALDI Imaging is usually not performed at cellular or sub-cellular resolution, the nature of the underlying tissue can only be determined by detailed microscopic analysis. For instance, the shape of cells and nuclei can be used to differentiate between cancerous and epithelial cells.
Bruker has integrated the use of digital slides with flexImaging software, giving instant access to full microscopic resolution and allowing true untargeted molecular histology.
Integrating Virtual Microscopy –Gaining Biological Insights
Molecular histology with MALDI Imaging
MALDI Imaging and histology are fully compatible – tissue sections can be stained after MALDI measurement. Bruker flexImaging software allows direct overlay of MALDI Imaging data onto high-resolution virtual slides, providing full access to molecular and histological information.
See a video demonstration at:
http://www.youtube.com/watch?v=YV2wzVXEvqg
Rat testis at 20 µm spatial resolution
Virtual microscopy
MALDI image of rat testisat 20 μm spatial resolution.Two molecular signalsthat highlight different features are selected.
Bruker flexImaging software allows cross-fading between the MALDI image and the superimposed virtual slide.
At higher resolution,histological features becomevisible in the virtual slideimage.
Full resolution reveals (1) a capillary vessel and (2) nuclei of mature spermatids and demonstrates correlation of histological features and molecular signals.
1
2
Digital microscopy enables detailed evaluation of high-resolution histological images on a computer screen.

Wizard driven user-friendly set up of new imaging experiments Explore datasets interactively by
selecting masses in spectrum view Direct access to single spectra Superimpose digital slides and optical
images Smart data compression for FTMS
spectra Advanced normalization options Easy comparison of spectra in different
regions of interest Comparison of different datasets True 64-bit application supports large
datasets Batch acquisition capabilities
Explore datasets by integrated hierarchical clustering
Hierarchical clustering groups the mass spectra (molecular phenotypes) according to similarity Interactive dendrograms allow a simple
and concise segmentation and annotation of complex datasets Additional feature extraction methods
such as principal component analysis (PCA) and probablistic semantic analysis (pLSA) are available through integration with statistical software (e.g. SCiLS Lab, ClinProTools or ProfileAnalysis)
Cluster analysis of a rat testis sample with ~50k pixels. The interactive dendrogram allows a detailed and interactive segmentation into functional regions.
flexImaging – Leading Software for Acquisition and Visualization
SCiLS Lab – Statistical Analysis Software
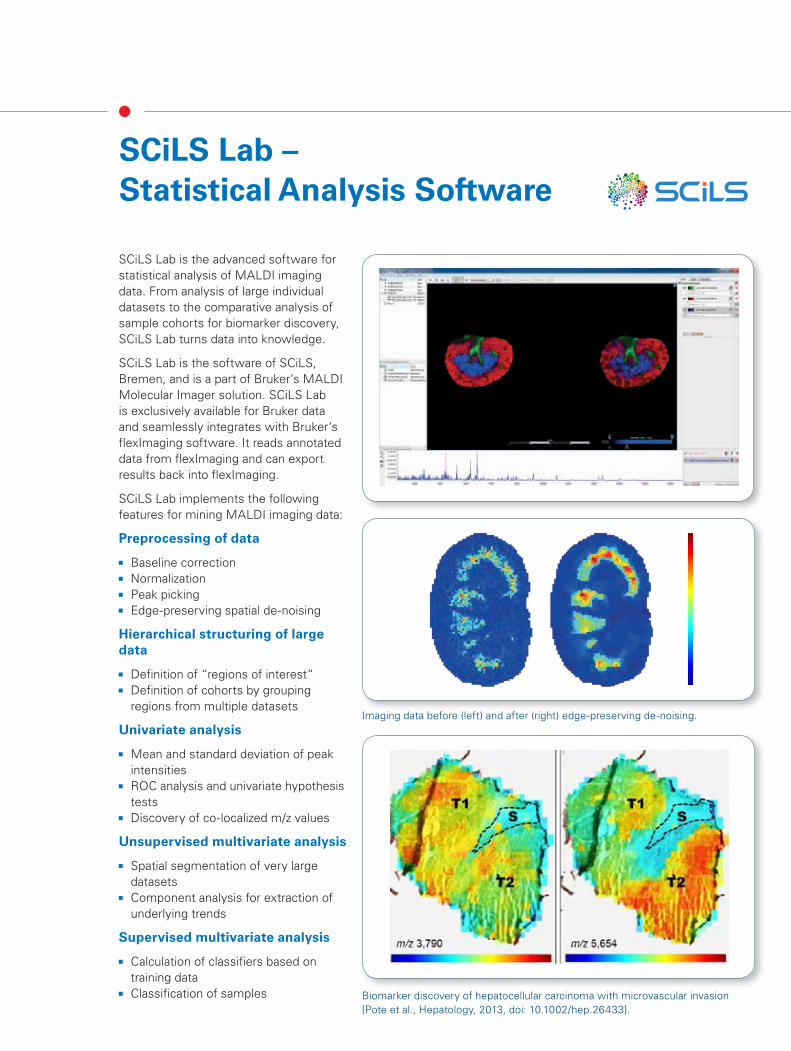
SCiLS Lab is the advanced software for statistical analysis of MALDI imaging data. From analysis of large individual datasets to the comparative analysis of sample cohorts for biomarker discovery, SCiLS Lab turns data into knowledge.
SCiLS Lab is the software of SCiLS, Bremen, and is a part of Bruker’s MALDI Molecular Imager solution. SCiLS Lab is exclusively available for Bruker data and seamlessly integrates with Bruker‘s flexImaging software. It reads annotated data from flexImaging and can export results back into flexImaging.
SCiLS Lab implements the following features for mining MALDI imaging data:
Preprocessing of data
Baseline correction Normalization Peak picking Edge-preserving spatial de-noising
Hierarchical structuring of large data
Definition of “regions of interest“ Definition of cohorts by grouping
regions from multiple datasets
Univariate analysis
Mean and standard deviation of peak intensities ROC analysis and univariate hypothesis
tests Discovery of co-localized m/z values
Unsupervised multivariate analysis
Spatial segmentation of very large datasets Component analysis for extraction of
underlying trends
Supervised multivariate analysis
Calculation of classifiers based on training data Classification of samples
Imaging data before (left) and after (right) edge-preserving de-noising.
Biomarker discovery of hepatocellular carcinoma with microvascular invasion [Pote et al., Hepatology, 2013, doi: 10.1002/hep.26433].
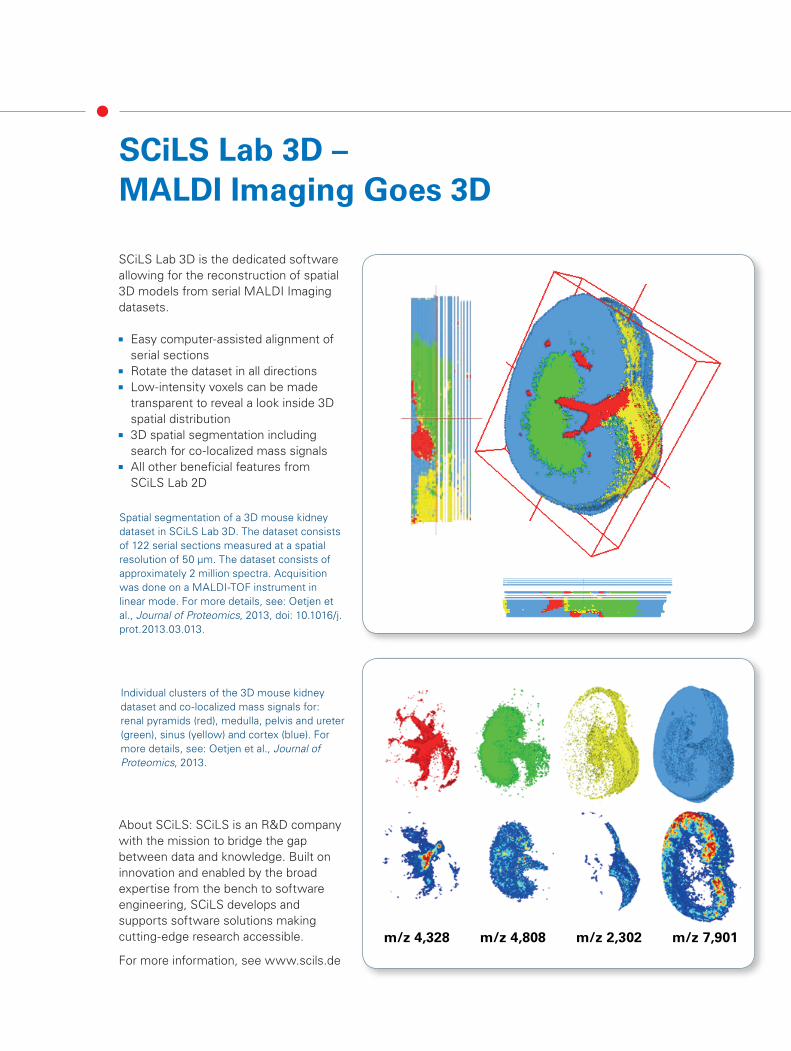
SCiLS Lab 3D is the dedicated software allowing for the reconstruction of spatial 3D models from serial MALDI Imaging datasets.
Easy computer-assisted alignment of serial sections Rotate the dataset in all directions Low-intensity voxels can be made
transparent to reveal a look inside 3D spatial distribution 3D spatial segmentation including
search for co-localized mass signals All other beneficial features from
SCiLS Lab 2D
About SCiLS: SCiLS is an R&D company with the mission to bridge the gap between data and knowledge. Built on innovation and enabled by the broad expertise from the bench to software engineering, SCiLS develops and supports software solutions making cutting-edge research accessible.
For more information, see www.scils.de
SCiLS Lab 3D – MALDI Imaging Goes 3D
Spatial segmentation of a 3D mouse kidney dataset in SCiLS Lab 3D. The dataset consists of 122 serial sections measured at a spatial resolution of 50 µm. The dataset consists of approximately 2 million spectra. Acquisition was done on a MALDI-TOF instrument in linear mode. For more details, see: Oetjen et al., Journal of Proteomics, 2013, doi: 10.1016/j.prot.2013.03.013.
Individual clusters of the 3D mouse kidney dataset and co-localized mass signals for: renal pyramids (red), medulla, pelvis and ureter (green), sinus (yellow) and cortex (blue). For more details, see: Oetjen et al., Journal of Proteomics, 2013.
m/z 4,328 m/z 4,808 m/z 2,302 m/z 7,901

Quantinetix™ is a Quantitative Imaging Mass Spectrometry Software that provides quantitation of target com-pounds (taking into account the ion suppression effect) following Mass spectrometry imaging experiments.
Quantinetix is developed by ImaBiotech, a leading service provider for MALDI Imaging.
Quantinetix™ supports Bruker MALDI-TOF and FTMS data. It normalizes and quantifies molecules in several ways:
On-tissue dilution (Nilsson et al., PLoS One, 2010) Isotopic labeling compound (Stoeckli et
al., Int. J Mass Spectrom, 2007) Ion suppression calculation (Hamm et
al., ImaBiotech, Journal of proteomics Sept 2012)
Quantinetix – Dedicated Software for Drug Quantification
Dedicated to research, Quantinetix™ is a user-friendly imaging program that offers “quantitative images” and quantitation of your target compounds in over 25 organs in Whole body distribution, as well as in smaller organs such as the eye or brain via the calculation of normalized ion suppression.
About ImaBiotech: ImaBiotech is a biotechnology company specialized in molecular analysis (identification and quantification).
Founded by a team of experts in MALDI Imaging Mass Spectrometry, ImaBiotech offers services and products in the healthcare field in order to acce-lerate the launch of medications on the market, and to strengthen the precision and applications for new medical applications.
For additional information see:www.imabiotech.com
Example: Quantifica-tion of a drug compound in rabbit eye.
Brain
Eye
Salivary gland
Lung
StomachSpleen
Intestine
Liver
Kidney
1.75 cm

Overview of the imageID workflow for the comprehensive identification of tryptic peptides from tissue.
Formalin Fixed Tissue – ImageID
Formalin fixation leads to crosslinking of the proteins in the tissue. To analyze such samples an antigen retrieval step followed by a spatially resolved tryptic digest is necessary. This digest releases tryptic peptides that can be measured by MALDI Imaging. This tryptic digestion can be done with Brukers ImagePrep™ device.
Highly abundant tryptic peptides can be identified by MS/MS directly off tissue, but the identification results will always be superior after an LC-separation.
Brukers imageID workflow combines direct MALDI Imaging with LC-MS identification. It allows the software assisted correlation of LC-MS and MALDI Imaging data for the comprehensive identification of tryptic peptides.
Left: H&E staining and MALDI Image of a Formalin fixed Paraffin embedded lung cancer section. Different tryptic peptides are displayed in the MALDI Images. They highlight distinct areas in agreement with the histomorphological examination.
Right: Kongo red staining and MALDI Image of a serum amyloid peptide in an Formalin fixed paraffin embedded amyloidosis sample. Areas with high amyloid density are marked on the stained section.
Tumor
Non- tumorInflammation

Sample Preparation
High-quality sample preparation is key to successful MALDI Imaging
The Bruker ImagePrep provides automatic and reproducible samplepreparation in an automated push-buttonprocedure.
An intuitive user interface allows conveni-ent adjustment of key parameters: matrix thickness, incubation time and wetness.
The matrix aerosol is generated by vibrational vaporization. Soft gravitatio-nal deposition of microdroplets delivers maximum spatial resolution.
ImagePrep can also be used to performspatially resolved tryptic digests of tissue sections, which facilitates the study and identification of large proteins and FFPE tissue. See Application Note MT-98 for more details.
Patented optical sensor monitors wetness, drying rate and matrix build-up for maximum quality sample preparation.
time
scat
tere
d li
ght in
tensi
ty
Peerless Ion Source Design
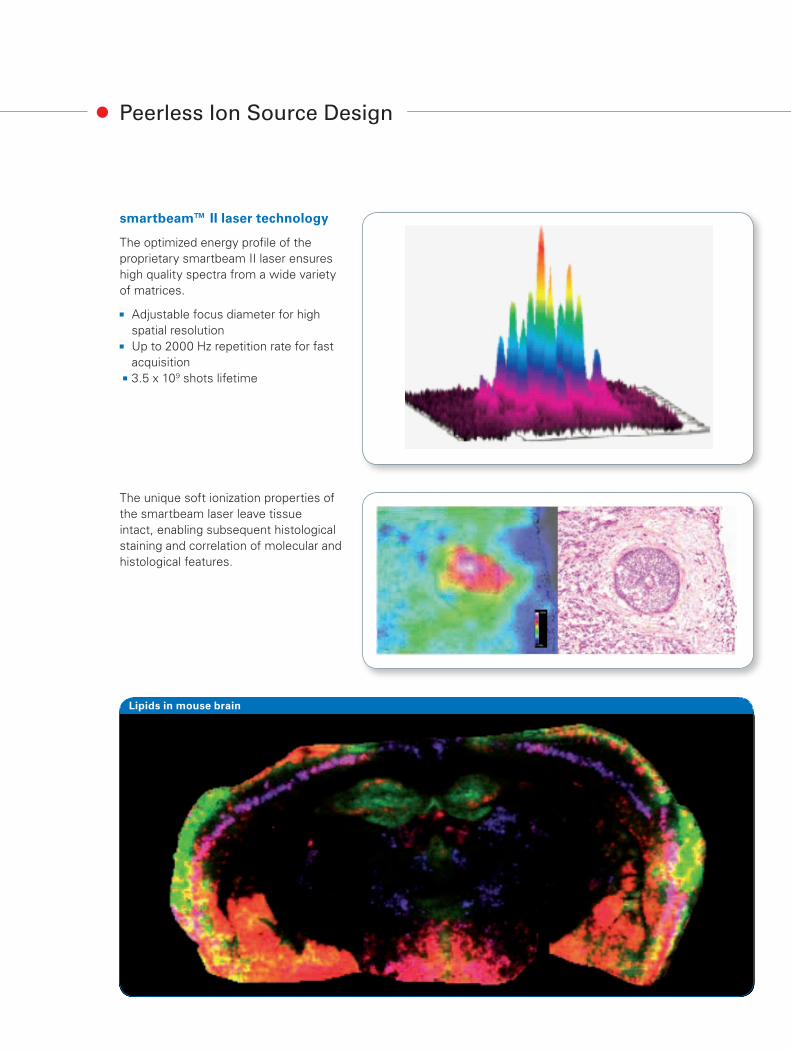
smartbeam™ II laser technology
The optimized energy profile of the proprietary smartbeam II laser ensureshigh quality spectra from a wide varietyof matrices.
Adjustable focus diameter for high spatial resolution Up to 2000 Hz repetition rate for fast
acquisition 3.5 x 10⁹ shots lifetime
The unique soft ionization properties ofthe smartbeam laser leave tissueintact, enabling subsequent histologicalstaining and correlation of molecular and histological features.
Lipids in mouse brain

autoflex speed and ultrafleXtreme
High-end MALDI-TOF and TOF/TOF instruments Fast smartbeam II laser for fast
high-quality MALDI Imaging (2 kHz with ultrafleXtreme, 1 kHz with autoflex speed) Linear mode for detection of intact
proteins Reflectron mode for the detection of
peptides, lipids and small molecules FAST-SRM mode for convenient
targeted analysis of small molecules and drugs Perpetual Ion Source for automated
source cleaning
Lipids in pig retina measured at 10 µm pixel size show the different layers (right: H&E stain). Scale bar 100 µm.
A: Proteins in bladder cancer section; B: Lipids in rat cerebellum at 10 µm pixel size. Individual Purkinje cells are resolved (green channel); C: Proteins in rat testis
A B C

solariX XR
Extreme mass resolution in excess of 10 million Smartbeam II laser for high spatial
resolution Unparalleled performance for small
molecule measurements Perfectly suited for metabolomics and
drug applications
CASI™ mode: Continuous accu- mulation of selected ions for maximum sensitivity Isotopic fine structure allows direct
readout of molecular formulas of unknown compunds Dual source for MALDI and
electrospray
In this rat testis dataset, the two displayed lipid signals have a mass difference of only 3 mDa. The signal shown in green is found in the seminiferous tubules, the one in red is seen in the interstitial space. At a resolution of 470k the signals are clearly resolved.
Lipids in rat cerebellum at 15µm pixel size (left) and 10µm pixel size (right). Individual purkinje cells cann be seen at 10µm pixel size (purple channel, one Purkinje cell is indicated by the arrow).

Bru
ker
Dal
toni
cs is
con
tinua
lly im
prov
ing
its p
rodu
cts
and
rese
rves
the
rig
ht
to c
hang
e sp
ecifi
catio
ns w
ithou
t no
tice.
© B
DA
L 07
-201
3, 1
8218
23
For research use only. Not for use in diagnostic procedures.
Bruker Daltonik GmbH
Bremen · GermanyPhone +49 (0)421-2205-0 Fax +49 (0)421-2205-103 [email protected]
Bruker Daltonics Inc.
Billerica, MA · USA Fremont, CA · USAPhone +1 (978) 663-3660 Phone +1 (510) 683-4300 Fax +1 (978) 667-5993 Fax +1 (510) 687-1217 [email protected] [email protected]
www.bruker.com
MALDI Imaging Instrumentation and Software
Mass spectrometry and sample preparation systems ImagePrep provides high-quality,
easy-to-use sample preparation and enables high-sensitivity imaging experiments. autoflex MALDI-TOF and
ultrafleXtreme MALDI-TOF instru-ments are equipped with the smart-beam laser for high-quality mass spectra and images.
solariX XR FTMS provides highest resolution MALDI Imaging of small molecules, peptides and lipids.
Integrated software solutions
flexImaging dedicated molecular histology software controls data acquisition, data visualization and image generation from tissue samples. Sophisticated biostatistical software
enables tissue-related biomarker candi-date searches and tissue class profiling using pattern profiling algorithms.
“MALDI Imaging gives us for the first time the possibility to generate molecular images without the need for molecular probes. These mole-cular phenotypes can give us additional insight where the histological phenotype is not sufficient.”
Dr. Axel Walch, Pathologist,Helmholtz-Centre Munich, Germany
“In mass spectrometry, technology achievements can also be measured by the involvements of manufactur-ers. Imaging mass spectrometry is no exception. In this regard, in partnership with academia, Bruker Daltonics has been instrumental in proposing a complete, compre-hensive and convivial imaging solution.”
Dr. Pierre Chaurand, Associate Professor, Université de Montréal, Canada
“ImaBiotech purchased several Bruker instruments because their devices’ high performance fit perfectly with our MALDI Imaging technology platform to provide superior services to the pharmaceutical and bio-medical industries. Our extensive research made possible by integrating Bruker into our repertoire is proof of the unparalleled quality and robustness of Bruker technology.“
Dr. Jonathan Stauber, CEO ImaBiotech, France
“MALDI-MS Imaging fills an analytical void by permitting us to discretely examine the distribution
of parent drug and metabolites in tissues. We have been able to achieve the spatial and spectral resolution required to examine sub-compartment tissue distributions and correlate them with histology in the precli-nical setting. This ability to link chemistry and biology is permitting us to more closely examine the basis of drug toxicity and phar-macology as well as refine our understanding of pharmacokinetics and drug transport.”
Stephen Castellino, PhD; Director US SID, US TKB, GlaxoSmithKline, USA