Embed Size (px)
Citation preview
20th AsiaConstruct Conference
Hong Kong 13 & 14 November 2014
Country Report
MALAYSIA
Jointly prepared by
Sariah Abd. Karib Noridah Shaffii
Che Saliza Che Soh Nur Ima Zainol Abidin
Business Division, Corporate and Business Sector
Construction Industry Development Board (CIDB) Malaysia Level 34, Menara Dato’ Onn
Putra World Trade Centre (PWTC) No. 45, Jalan Tun Ismail
50480 Kuala Lumpur Malaysia
September 2014

20th AsiaConstruct Conference, Hong Kong
Malaysia Country Report 2
CONTENT
EXECUTIVE SUMMARY
MACROECONOMIC REVIEW
Overview of the National Economy
OVERVIEW OF THE CONSTRUCTION INDUSTRY IN 2013
Construction Project Review
Construction Cost
Export and Import of Construction Works
CONSTRUCTION INDUSTRY OUTLOOK IN 2014

20th AsiaConstruct Conference, Hong Kong
Malaysia Country Report 3
EXECUTIVE SUMMARY
The Malaysian economy expanded by 4.7% in 2013. The construction sector
expanded strongly at 10.9% in 2013 (2012: 18.1%), owing to robust activity in the
residential and civil engineering sub-sectors. The private sector continued its
domination, obtaining projects awarded in 2013 worth RM98.0 billion (USD29.9
billion) or 81.5% of the total value of projects for the year. The public sector took a
back seat with only RM22.3 billion (USD6.8 billion) or 18.5% of construction projects
awarded for the same period. The main building material prices in 2013 increased
marginally compared to 2012. Wages of construction personnel too were showing
the same upward trend. The number of registered construction workers, as in
previous years, increased. Malaysian economy is expected to grow moderately in
2014 by 4.5% - 5.5%. CIDB estimated that the value of construction projects
awarded may reach RM120.0 billion (USD36.6 billion) in 2014 and RM136.0 billion in
2015 (USD41.4 billion).
MACROECONOMIC REVIEW
Overview of the National Economy
Overview of the Malaysian Economy in 2013
The Malaysia economy expanded by 4.7% (2012: 5.6%). The growth was driven by
the continued strong growth in domestic market by 7.6% (2012: 10.6%). The
domestic market remained resilient led by the robust private consumption and
investment. Private consumption registered a firm growth of 7.6% in 2013 (2012:
7.7%) underpinned by favourable employment condition and wage growth. Private
investment continued to register a double-digit growth rate of 13.6% (2012: 21.9%)
driven by capital spending by both the domestic and foreign investors in the mining,
services and manufacturing sector. In the public sector, public consumption recorded
a higher growth of 6.3% (2012: 5.1%) due mainly to higher expenditure in supplies
and services, while public investment recorded a small positive growth of 0.7%
(2012: 17.1%) following the decline in the Federal Government’s development
expenditure.
On the supply side, all economic sectors continued to expand in 2013. The
construction sector growth remained strong by 10.9% (2012: 18.1%) benefited from
the strong expansion in investment activity especially in the residential and civil
engineering sub-sectors. The service sector expand by 5.9% (2012:6.4%),
manufacturing sector at 3.4% (2012: 4.8%), agriculture sector at 2.1% (2012: 1.0%)
and the mining sector at 0.5% (2012: 1.4%).

20th AsiaConstruct Conference, Hong Kong
Malaysia Country Report 4
Expansion in Malaysia economic activity across all sector in 2013 supported the
demand for labour. Employment recorded a strong growth with an addition of 4.8%
(2012: 3.6%) with a net addition of 613,000 jobs. The employment rate remained low
at 3.1% (2012: 3.0%).
The inflation rate remained modest at 2.1% 2013 (2012: 1.6%). The main contributor
to inflation were food and non-alcoholic beverages; transport; house, water,
electricity gas and other fuel categories. The Monetary Policy Committee (MPC)
maintained the Overnight Policy Rate (OPR) at 3.0% throughout 2013 and base
lending rate (BLR) of commercial banks remained at 6.5%. The Ringgit ended the
year at RM3.28 against the US Dollar, depreciated by 6.8%. Ringgit depreciated
amid increased global financial market volatility
Table 2.1 Malaysian Macroeconomic Overview
2011 2012 2013
GDP growth by economic activity at 2005 chained price (RM million)
Agriculture 54,253 54,782 55,913
Mining 62,565 63,432 63,767
Manufacturing 178,237 186,748 193,006
Construction 22,464 26,531 29,422
Services 385,179 409,976 433,998
Real GDP 711,351 751,471 786,696
GDP growth by economic activity at 2005 chained price (%)
Agriculture 5.8 1.0 2.1
Mining -5.5 1.4 0.5
Manufacturing 4.7 4.8 3.4
Construction 4.7 18.1 10.9
Services 7.0 6.4 5.9
Real GDP Growth 5.1 5.6 4.7
Demographic Indicator
Population (million persons) 29.1 29.5 29.9
Labour force (million persons) 12.7 13.1 13.8
Unemployment rate (%) 3.1 3.0 3.1
Financial Indicator
Inflation rate (%) 3.2 1.6 2.1
Short term interest rate 2.99 2.97 3.97
- 3 months (%)
Long term interest rate 3.22 3.15 4.15
- 12 months (%)
Exchange rate at end of period (RM against USD) RM3.18 RM3.06 RM3.28
Source: Central Bank of Malaysia Annual Report 2013.

20th AsiaConstruct Conference, Hong Kong
Malaysia Country Report 5
Review of the Malaysian Economy in the First Half of 2014
The Malaysian economy grow stronger by 6.3% in the first half of 2014 (1Q 2014:
6.2%; 2Q 2014: 6.4%). Overall, growth was supported by higher exports and
continued strength in private domestic demand. On the supply side, growth for
major economic sectors remained strong. The construction sectors growth strong at
14.3% in the first half of 2014 after the exceptionally strong growth in the first quarter
at 18.9% (2Q 2014: 9.9%). The services sector registered a growth of 6.3% in the
first half of 2014 (1Q 2014: 6.6%; 2Q 2014: 6.0%), the manufacturing sector
expanded at 7.1% (1Q 2014: 6.8%; 2Q 2014: 7.3%), the agriculture sector grow at
4.6% (1Q 2014: 2.3%; 2Q 2014: 7.1%) and the mining sector grow slightly at 0.6%
(1Q 2014: -0.8%; 2Q 2014: 2.1%).
OVERVIEW OF THE CONSTRUCTION INDUSTRY
Construction Project Review in 2013
The Construction Industry Development Board (CIDB) Malaysia recorded 7,621
projects worth RM120.4 billion (USD36.7 billion) (2012: 7,781 projects; RM125.2
billion, USD40.9 billion) of new construction projects awarded in 2013. This figure is
likely to increase as more projects awarded in 2013 gets reported to CIDB. The
private and public sectors contribution of 81.5% and 18.5% respectively from the
total value. Private sector projects value showed a decrease by 8.1% to RM98.0
billion (USD29.9 billion) and the public sector projects showed rose by 20.6% to
RM22.3 billion (USD6.8 billion). As the economy continued to grow, more private
investment activities took place and developers embarked on new construction
projects. This is in line with the government’s aim to push the private sector as the
main driver of the economy. In terms of numbers, private sector secured 5,795
projects compared to 1,826 public sector’s projects.
Major contribution to Malaysian construction projects came from the implementation
of 4 mega non-residential and infrastructure projects each costing more than RM1.0
billion amounting to RM11.4 billion as follows:
1. Liquefied natural gas (LNG) plant in Sarawak worth RM5.7 billion (USD1.7
billion)
Award date : 7 March 2013; Expected completion date : 7 December 2015
2. Onshore Gas Terminal in Terengganu worth RM2.3 billion (USD698 million)
Award date : 15 January 2013; Expected completion date: 31 July 2016

20th AsiaConstruct Conference, Hong Kong
Malaysia Country Report 6
3. 1071.43MW Gas Fired Independent Power Plant in Pulau Pinang worth
RM2.2 billion (USD686 million)
Award date : 3 April 2013; Expected completion date: 1 January 2016
4. Duta Ulu Kelang Expressway (DUKE) Phase 2 in Kuala Lumpur worth
RM1.4 billion (USD427 million)
Award date : 14 May 2013; Expected completion date : 15 May 2016
In 2013, non-residential projects registered a value of RM50.4 billion (USD165.4
billion), followed by residential projects at RM35.9 billion (USD11.0 billion),
infrastructure projects at RM25.1 billion (USD82.4 billion), and social amenity
projects at RM8.9 billion (USD2.7 billion). The project value had clearly been
boosted by the non-residential projects (41.9%) and led by the private sector with
a share of 39.1% due to the high-value projects awarded under the sub-category
of industrial and commercial. Meanwhile, infrastructure projects tendered
decreased by 43.3% in 2013, mainly because of reduction in infrastructure
projects by the private sector.
20th AsiaConstruct Conference, Hong Kong
Malaysia Country Report 7
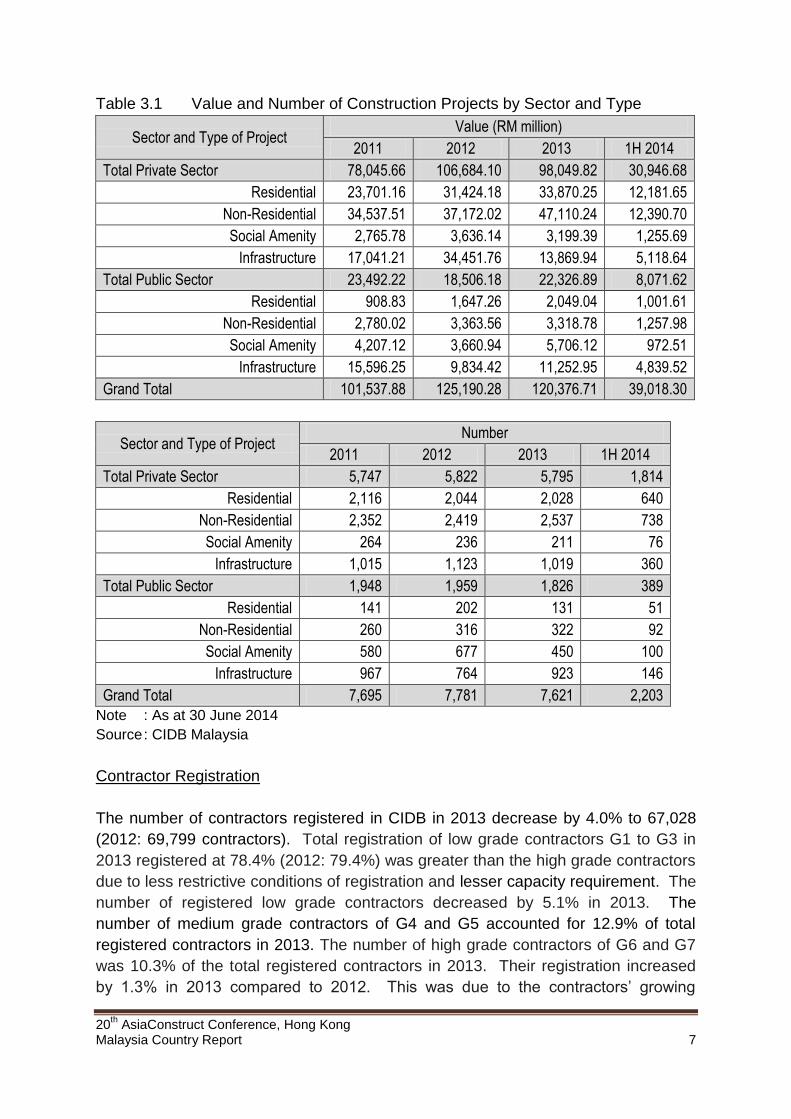
Table 3.1 Value and Number of Construction Projects by Sector and Type
Sector and Type of Project Value (RM million)
2011 2012 2013 1H 2014
Total Private Sector 78,045.66 106,684.10 98,049.82 30,946.68
Residential 23,701.16 31,424.18 33,870.25 12,181.65
Non-Residential 34,537.51 37,172.02 47,110.24 12,390.70
Social Amenity 2,765.78 3,636.14 3,199.39 1,255.69
Infrastructure 17,041.21 34,451.76 13,869.94 5,118.64
Total Public Sector 23,492.22 18,506.18 22,326.89 8,071.62
Residential 908.83 1,647.26 2,049.04 1,001.61
Non-Residential 2,780.02 3,363.56 3,318.78 1,257.98
Social Amenity 4,207.12 3,660.94 5,706.12 972.51
Infrastructure 15,596.25 9,834.42 11,252.95 4,839.52
Grand Total 101,537.88 125,190.28 120,376.71 39,018.30
Sector and Type of Project Number
2011 2012 2013 1H 2014
Total Private Sector 5,747 5,822 5,795 1,814
Residential 2,116 2,044 2,028 640
Non-Residential 2,352 2,419 2,537 738
Social Amenity 264 236 211 76
Infrastructure 1,015 1,123 1,019 360
Total Public Sector 1,948 1,959 1,826 389
Residential 141 202 131 51
Non-Residential 260 316 322 92
Social Amenity 580 677 450 100
Infrastructure 967 764 923 146
Grand Total 7,695 7,781 7,621 2,203
Note : As at 30 June 2014
Source : CIDB Malaysia
Contractor Registration
The number of contractors registered in CIDB in 2013 decrease by 4.0% to 67,028
(2012: 69,799 contractors). Total registration of low grade contractors G1 to G3 in
2013 registered at 78.4% (2012: 79.4%) was greater than the high grade contractors
due to less restrictive conditions of registration and lesser capacity requirement. The
number of registered low grade contractors decreased by 5.1% in 2013. The
number of medium grade contractors of G4 and G5 accounted for 12.9% of total
registered contractors in 2013. The number of high grade contractors of G6 and G7
was 10.3% of the total registered contractors in 2013. Their registration increased
by 1.3% in 2013 compared to 2012. This was due to the contractors’ growing
20th AsiaConstruct Conference, Hong Kong
Malaysia Country Report 8
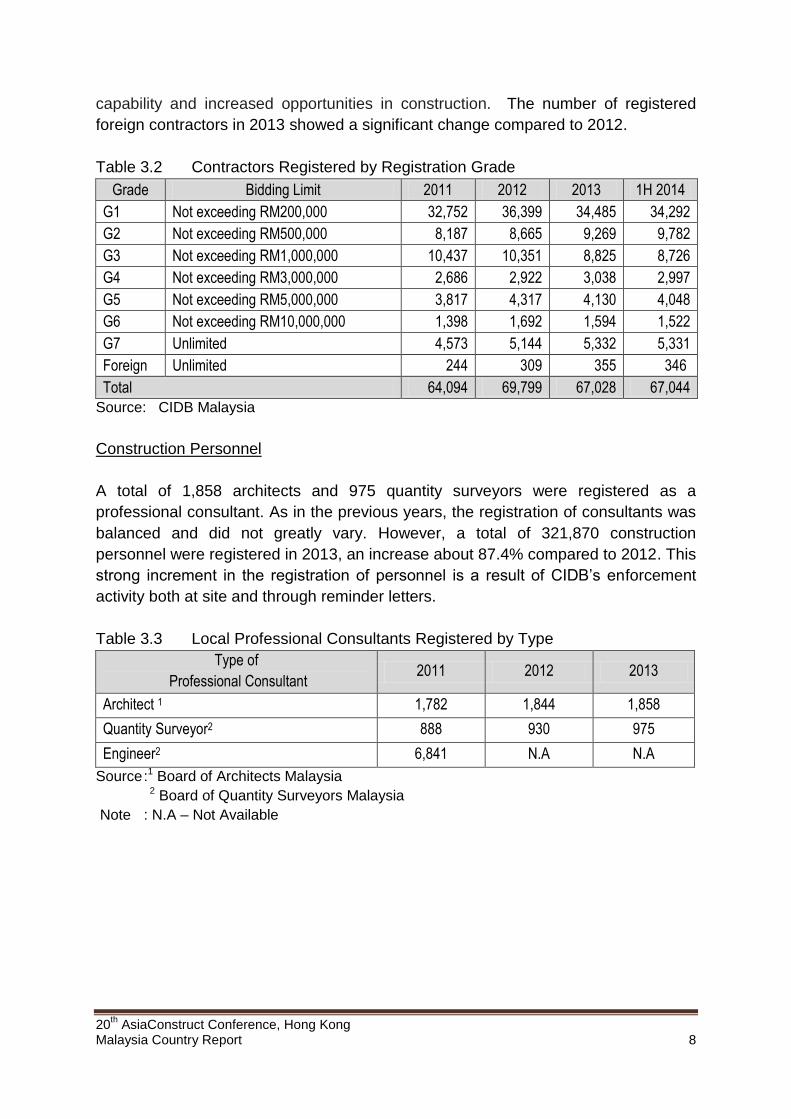
capability and increased opportunities in construction. The number of registered
foreign contractors in 2013 showed a significant change compared to 2012.
Table 3.2 Contractors Registered by Registration Grade
Grade Bidding Limit 2011 2012 2013 1H 2014
G1 Not exceeding RM200,000 32,752 36,399 34,485 34,292
G2 Not exceeding RM500,000 8,187 8,665 9,269 9,782
G3 Not exceeding RM1,000,000 10,437 10,351 8,825 8,726
G4 Not exceeding RM3,000,000 2,686 2,922 3,038 2,997
G5 Not exceeding RM5,000,000 3,817 4,317 4,130 4,048
G6 Not exceeding RM10,000,000 1,398 1,692 1,594 1,522
G7 Unlimited 4,573 5,144 5,332 5,331
Foreign Unlimited 244 309 355 346
Total 64,094 69,799 67,028 67,044
Source: CIDB Malaysia
Construction Personnel
A total of 1,858 architects and 975 quantity surveyors were registered as a
professional consultant. As in the previous years, the registration of consultants was
balanced and did not greatly vary. However, a total of 321,870 construction
personnel were registered in 2013, an increase about 87.4% compared to 2012. This
strong increment in the registration of personnel is a result of CIDB’s enforcement
activity both at site and through reminder letters.
Table 3.3 Local Professional Consultants Registered by Type
Type of
Professional Consultant 2011 2012 2013
Architect 1 1,782 1,844 1,858
Quantity Surveyor2 888 930 975
Engineer2 6,841 N.A N.A
Source :1 Board of Architects Malaysia 2 Board of Quantity Surveyors Malaysia
Note : N.A – Not Available

20th AsiaConstruct Conference, Hong Kong
Malaysia Country Report 9
Table 3.4 Registered Construction Personnel by Type
Category of Worker 2012 2013
Local Foreign Local Foreign
General worker 59,614 29,390 76,354 71,607
Construction worker 26,960 1,356 53,611 4,050
Skilled construction worker 13,685 566 18,857 426
Manager and site assistant manager 14,083 484 19,509 838
Construction supervisor 16,424 304 21,547 178
Administrative personnel 38,141 791 53,788 1,105
Total 168,907 32,891 243,666 78,204
Source : CIDB Malaysia
Construction Productivity
Value-added per employee in the construction sector rose by 2.5% (2012: 15.0%) to
RM23,373.00 per worker in 2013. The decline in productivity growth compared to
2012 indicates that some on-site construction practices and tasks still require a
high degree of labour input and that the sector has been relatively slow at
adopting mechanisation, automation and other advanced methods of
construction.
Table 3.5 Value-Added Per Employee
2011 2012 2013
Construction Sector Value- Added
(RM million) 22,464 26,531 29,422
Construction Sector Employee
(‘000 persons) 1,133.6 1,163.7 1,258.8
Value-Added Per Employee (RM) 19,817 22,799 23,373
Source : Central Bank of Malaysia Annual Report 2013
Construction Cost
Tender Price Index
Building construction tender price indices showed an overall increase compared to
the base year in 1980. In 1H 2013, tender price index showed a decrease of 3.3%
compared to 2H 2012 (429.3 point). In 2H 2013, the index added 22.1 points to
make the tender price index rose to 437.4 points. The tender price index will
continue to rise in line with the rising prices of building materials.

20th AsiaConstruct Conference, Hong Kong
Malaysia Country Report 10
Table 3.6 Building Construction Tender Price Indices (1980 = 100)
Period Tender Price Indices
2011 1H 408.49
2H 411.36
2012 1H 420.49
2H 429.32
2013 1H 415.24
2H 437.35
Source : Average Cost per Square Meter for Building Works by Public Works Department
Average Price of Major Construction Material
Overall, the average price for major building materials in 2013 slightly increase
compared to 2012 prices. The price of cement, aggregate, sand and brick increase
of about 0.3% to 3.3%. In contrast, prices for other building materials such steel bars
(mild steel round bars and high tensile deformed bars), ready mixed concrete and
BRC 10A declines by 4.8% to 1.1% compared to year 2012.
Table 3.7 Average Prices of Major Construction Materials (RM)
Category of Material Unit 2011 2012 2013
Cement 5 kg Bag 16.46 16.75 17.19
Aggregate Tonne 36.65 37.71 39.14
Sand Tonne 26.83 28.55 28.79
Steel Bar Tonne 2,579.14 2,572.18 2,549.13
Ready Mixed Concrete m³ 268.86 268.61 252.27
BRC A10 m² 19.51 18.45 17.57
Brick Unit 0.36 0.35 0.37
Source : CIDB Malaysia
Construction Industry Wage Rates
Construction General Worker Wage Rates
Average daily wage rates for all categories of local skilled construction workers
increases ranging from 0.1% to 16.0%. The highest wage rate earn by local skilled
worker who works as a plumber-reticulation (RM126.33 per day, USD38.52 per day),
carpenter – joinery (RM121.17 per day, USD39.74 per day) and roofer (RM1,117.75
per day, USD386.22 per day). Average daily wage rates for most categories of
foreign skilled construction workers increases ranging from 0.1% to 9.4%. The

20th AsiaConstruct Conference, Hong Kong
Malaysia Country Report 11
highest wage rate earn by foreign skilled worker who works as a plumber-reticulation
(RM109.67 per day, USD33.44 per day), steel structure fabricator (RM107.75 per
day, USD32.85 per day) and general welder (RM105.06 per day, USD32.03 per
day).
Table 3.8 Average Daily Wage Rate for Construction Worker (RM per day)
Category of Worker
Minimum /
Maximum
Wage
Local Worker Foreign Worker
Skilled Semi-Skilled Skilled Semi-Skilled
2012 2013 2012 2013 2012 2013 2012 2013
General Construction
Worker - Building
Minimum 42.23 46.00 - - 36.38 39.80 - -
Maximum 71.39 73.53 - - 59.75 61.97 - -
Concreter Minimum 64.28 72.65 61.75 59.28 58.87 61.20 48.38 51.55
Maximum 95.80 107.10 97.30 88.02 92.43 94.15 75.00 76.89
Barbender Minimum 71.31 79.81 64.57 60.18 60.95 64.56 46.05 49.39
Maximum 95.36 106.75 93.72 85.28 85.61 89.33 71.19 74.58
Carpenter-Formwork Minimum 71.91 82.69 72.03 65.46 66.10 69.12 56.13 59.71
Maximum 101.28 112.67 100.06 91.61 91.89 94.86 81.19 84.42
Bricklayer Minimum 67.20 74.14 54.89 53.89 56.49 56.78 42.62 44.82
Maximum 93.69 105.41 88.78 83.83 85.57 88.03 66.46 70.09
Roofer Minimum 76.51 83.84 71.93 68.77 69.89 71.62 53.85 55.60
Maximum 107.78 117.75 100.19 91.92 98.08 100.89 80.56 82.11
Carpenter - Joinery Minimum 80.25 88.19 76.32 70.99 73.59 74.25 56.91 59.24
Maximum 111.61 121.17 108.31 100.11 103.72 105.53 87.14 89.44
Steel Structure Fabricator Minimum 74.33 86.24 78.12 73.37 73.07 77.32 58.52 61.69
Maximum 110.78 120.31 107.78 101.00 106.11 107.75 85.93 88.49
General Welder Minimum 68.81 78.85 74.28 68.46 69.37 72.69 57.38 59.66
Maximum 104.81 116.28 106.01 96.82 104.17 105.06 85.76 88.44
Plumber - Building &
Sanitary
Minimum 72.11 81.51 67.04 63.91 64.53 66.86 49.09 51.89
Maximum 103.25 116.64 98.44 92.67 95.22 99.94 78.86 81.92
Plumber - Reticulation Minimum 75.54 84.86 77.56 74.88 70.51 74.66 60.35 63.54
Maximum 113.36 126.33 116.92 107.31 108.58 109.67 91.81 92.95
Building Wiring Installer Minimum - - 82.16 83.74 - - 69.23 72.01
Maximum - - 115.75 114.22 - - 105.97 107.28
Electrical Wireman PW2
(RM Monthly)
Minimum 1,797.06 1,836.89 - - 1,343.63 1,370.13 - -
Maximum 3,005.73 3,009.62 - - 2,432.39 2,433.78 - -
Electrical Wireman PW4
(RM Monthly)
Minimum 2,441.89 2,487.56 - - 1,759.71 1,843.71 - -
Maximum 3,609.61 3,619.33 - - 2,909.74 2,948.63 - -
Scaffolder - Prefabricated Minimum 71.88 80.51 65.12 61.37 62.38 65.31 51.68 54.07
Maximum 101.03 109.50 101.73 92.53 97.34 97.31 83.97 85.36
Scaffolder - Tubular Minimum 68.06 78.91 64.57 63.66 63.72 67.27 50.88 52.69
Maximum 94.92 109.11 95.58 88.31 95.53 95.50 78.47 78.61
Plasterer Minimum 70.88 80.84 66.72 62.33 58.83 64.13 44.55 47.99
Maximum 98.16 108.13 97.47 91.28 91.89 91.75 80.86 82.92
Tiller Minimum 76.66 87.81 69.42 65.24 67.42 70.56 50.83 54.10
Maximum 106.42 117.73 104.06 94.69 96.97 99.86 84.11 84.67
Painter - Building Minimum 65.91 73.30 60.82 57.40 59.39 60.67 46.43 48.57
Maximum 97.54 106.76 93.31 85.44 89.56 90.78 72.08 74.31

20th AsiaConstruct Conference, Hong Kong
Malaysia Country Report 12
Category of Worker
Minimum /
Maximum
Wage
Local Worker Foreign Worker
Skilled Semi-Skilled Skilled Semi-Skilled
2012 2013 2012 2013 2012 2013 2012 2013
General Construction
Worker - Civil
Minimum 52.03 57.52 - - 44.97 47.86 - -
Maximum 80.11 84.56 - - 71.06 71.78 - -
Source : CIDB Malaysia
Construction Machine Operator Wage Rates
Average daily wage rates for most categories of local skilled machine operator
increases ranging from 0.3% to 5.7%. The highest wage rate earn by local machine
operator who operates tower crane (RM141.05 per day, USD43.00 per day), mobile
crane (RM127.24 per day, USD38.79 per day) and crawler crane (RM126.50 per
day, USD38.57 per day). Average daily wage rates for most categories of foreign
skilled machine operator increases ranging from 0.2% to 6.0%. The highest wage
rate earn by foreign machine operator who operates tower crane (RM114.46 per
day, USD34.90 per day), mobile crane (RM106.42 per day, USD32.45 per day) and
crawler crane (RM104.56 per day, USD31.88 per day).

20th AsiaConstruct Conference, Hong Kong
Malaysia Country Report 13
Table 3.10 Average Daily Wage Rates for Construction Machinery Operator (RM
per day)
Category of Operator
Minimum /
Maximum
Wage
Local Worker Foreign Worker
Skilled Semi-Skilled Skilled Semi-Skilled
2012 2013 2012 2013 2012 2013 2012 2013
Excavator Minimum 72.22 72.67 - - 53.03 55.17 - -
Maximum 106.94 110.25 - - 90.56 92.69 - -
Pile Rigger Minimum 67.93 70.82 49.81 52.06 54.65 56.71 42.16 43.43
Maximum 103.31 104.11 81.44 82.92 87.07 91.62 69.58 71.75
Off Road Truck Minimum 65.88 68.47 49.44 50.86 53.35 55.60 40.13 42.48
Maximum 97.72 98.00 77.03 82.00 83.16 86.63 67.36 71.92
Backhoe Loader Minimum 66.36 68.00 - - 50.39 51.36 - -
Maximum 100.13 103.44 - - 81.53 86.42 - -
Roller Minimum 59.90 61.65 48.72 50.14 51.56 53.65 38.43 44.11
Maximum 104.39 105.36 76.94 77.92 85.25 85.39 65.91 73.46
Roller / Compactor Minimum 64.58 65.55 48.34 51.42 53.01 55.32 40.60 46.65
Maximum 102.07 102.52 79.31 81.44 86.42 89.72 70.77 76.69
Scraper
Minimum 68.02 69.36 50.92 55.81 57.67 59.50 44.20 49.64
Maximum 101.81 101.78 78.25 81.33 87.06 88.11 73.89 79.25
Motor Grader Minimum 66.39 68.12 - - 52.87 54.93 - -
Maximum 104.31 107.94 - - 90.30 90.77 - -
Wheel Loader Minimum 62.84 64.72 48.11 51.00 53.36 55.67 41.53 43.89
Maximum 106.64 107.28 82.11 83.14 87.82 91.67 70.62 71.93
Paver Minimum 68.04 70.98 53.39 55.13 58.27 59.74 43.63 46.16
Maximum 105.42 106.39 81.10 84.94 87.65 91.33 72.11 75.75
Mobile Crane Minimum 84.12 86.87 61.52 65.23 71.05 72.27 50.55 52.69
Maximum 128.68 127.24 96.47 98.03 104.70 106.42 78.61 79.75
Crawler Crane Minimum 84.53 89.31 63.44 64.57 69.85 73.22 52.02 53.33
Maximum 125.20 126.50 90.83 94.92 101.50 104.56 78.25 80.33
Tower Crane Minimum 88.97 91.36 67.56 68.95 72.99 74.83 52.96 54.63
Maximum 140.66 141.05 101.03 102.67 113.48 114.46 84.03 87.17
Forklift Minimum 66.47 68.22 48.99 50.21 52.08 53.47 38.94 41.08
Maximum 94.65 96.79 75.17 75.97 80.55 82.14 64.64 66.19
Slinger / Dogger Minimum 61.53 64.08 47.61 48.61 50.81 52.22 37.95 41.84
Maximum 100.50 99.63 76.22 77.36 82.06 84.61 66.92 69.14
Source : CIDB Malaysia
IBS Installer Wage Rates

20th AsiaConstruct Conference, Hong Kong
Malaysia Country Report 14
IBS installer in Malaysia comprises of only local workers. In 2013, average daily
wage rates for most categories of IBS installer decrease ranging from 4.1% to 0.2%.
The highest wage rate earn by skilled worker who install IBS precast concrete
(RM150.67 per day) and IBS lightweight panel (RM137.00 per day, 41.77 per day).
Average daily wage rates for most categories of semi-skilled IBS installer increases
ranging from 0.8% to 14.1%. The highest wage rate earn by semi-skilled worker
who install IBS lightweight panel (RM110.00 per day, USD33.54 per day) and IBS
precast concrete (RM109.67 per day, USD33.45 per day).
Table 3.9 Average Daily Wage Rate for Local IBS Installer (RM per day)
Category of IBS Installer
Minimum /
Maximum
Wage
Skilled Semi-Skilled
2012 2013 2012 2013
IBS Precast Concrete Minimum 85.17 81.67 65.17 65.67
Maximum 151.17 150.67 100.50 109.67
IBS Lightweight Panel Minimum 80.33 78.33 63.33 64.00
Maximum 130.67 137.00 97.67 110.00
Lightweight Block wall Minimum 71.00 69.67 55.00 57.33
Maximum 98.17 111.67 74.50 85.00
System Formwork Minimum 68.50 67.33 54.33 54.00
Maximum 107.83 113.33 87.33 94.00
Roof Truss (Timber) Minimum 69.33 66.67 54.33 55.00
Maximum 97.33 107.33 76.67 82.00
Roof Truss
(Light Gauge Steel)
Minimum 69.17 69.00 53.17 54.67
Maximum 105.67 115.33 76.67 87.33
Source : CIDB Malaysia
Export and Import of Construction Work
In 2013, Malaysian contractors managed to secure 16 foreign projects worth RM2.7
billion (USD823 million) and most of the projects came from Middle East countries.
The largest construction projects undertaken by Malaysian companies in foreign
countries were the Bahrain Affordable Housing Project (RM1.2 billion, USD380.0
million) and Submarine Mains (Stage 4 Phase 2) and Submarine Pipelines in Hong
Kong (RM848.8 million, USD265.8 million).
Comparatively, a total of 66 foreign contractors from 16 countries secured 124
construction projects in Malaysia worth RM14.8 billion (USD4.5 billion). Contractors
from Singapore (16 contractors, 33 projects) and Japan (12 contractors, 27 projects)
are the most involved. Among the largest construction projects awarded to foreign
contractors in 2013 are The Liquefied Natural Gas (LNG) Plant in Sarawak (RM5.7

20th AsiaConstruct Conference, Hong Kong
Malaysia Country Report 15
billion, USD1.7 billion) awarded to Japanese contractor and Onshore Gas Terminal
in Terengganu (RM2.3 billion, USD701 million) awarded to Korean contractor.
Table 3.11 Value and Number of Export of Construction Services
Value (RM million)
Sector and Type of Project 2011 2012 2013 1H 2014
Total Private Sector 8,536.2 5,529.2 2,744.1 200.1
Residential 86.5 1,213.0
Non-Residential 438.1 592.3
Social Amenity
Infrastructure 8,449.7 5,091.1 938.7 200.1
Number
Sector and Type of Project 2011 2012 2013 1H 2014
Total Private Sector 9 14 16 5
Residential 2 1
Non-Residential 6 10
Social Amenity
Infrastructure 7 8 5 5
Note : As at 30 June 2014
Source : CIDB Malaysia
Table 3.12 Value and Number of Import of Construction Services
Value (RM million)
Sector and Type of Project 2011 2012 2013 1H 2014
Total Private Sector 16,446.3 15,070.6 14,769.8 2,363.9
Residential 701.6 524.1 279.4 343.8
Non-Residential 7,759.4 5,814.2 11,674.4 1,439.2
Social Amenity 9.3 26.9 178.4 4.2
Infrastructure 7,976.1 8,705.4 2,637.6 576.7
Total Public Sector 1,610.7 144.9 0.0 306.7
Residential
Non-Residential 144.9 306.7
Social Amenity
Infrastructure 1,610.7
Grand Total 18,057.1 15,215.4 14,769.8 2,670.6

20th AsiaConstruct Conference, Hong Kong
Malaysia Country Report 16
Number
Sector and Type of Project 2011 2012 2013 1H 2014
Total Private Sector 118 148 124 31
Residential 7 12 15 5
Non-Residential 88 103 77 21
Social Amenity 3 5 2 1
Infrastructure 20 28 30 4
Total Public Sector 6 1 0 1
Residential
Non-Residential 1 1
Social Amenity
Infrastructure 6
Grand Total 124 149 124 32
Note : As at 30 June 2014
Source : CIDB Malaysia
Table 3.13 5 Major Project Secured by Malaysian Contractors in Foreign Market in
2013
Country Type of Project Value (RM million)
1. Bahrain Residential 1,213.0
2. Hong Kong Infrastructure 848.9
3. UAE Non-Residential 325.0
4. Sri Lanka Infrastructure 56.9
5. Singapore Non-Residential 49.6
Note : As at 30 June 2014
Source : CIDB Malaysia
Table 3.14 5 Major Projects Secured by Foreign Contractors in Malaysia in 2013
Country Type of Project Value (RM million)
1. Japan Non-Residential 5,739.9
2. Korea Non-Residential 2,291.2
3. China Non-Residential 880.3
4. China Infrastructure 739.4
5. Korea Non-Residential 399.0
Note : As at 30 June 2014
Source : CIDB Malaysia

20th AsiaConstruct Conference, Hong Kong
Malaysia Country Report 17
CONSTRUCTION INDUSTRY OUTLOOK FOR 2014
In 2014, the Malaysia economy is expected to remain on a steady growth by 4.5% to
5.5% and the construction sector at 10.0%. Construction sector will continue to
benefit from the development of sustainable economy and high physical projects in
preparation to achieve Vision 2020, which left about 6 years. Malaysia has a strong
economic fundamentals and political stability aims to become the center of business,
investment, tourism and location of the world's major livable cities. To achieve this,
Malaysia needs more quality economic infrastructure development. Implementation
of Entry Point Project (EPP), 10MP and the development of economic corridors
provinces will be more vibrant and revitalise the real estate market. Development of
government projects will be driven by the implementation of communications
services, utilities and high value of transportation projects. Thus, value for new
construction projects for 2014 is expected to be at RM120.0 billion (USD36.6 billion)
and in 2015, the value will reach RM136.0 billion (USD41.5 billion).