Embed Size (px)
Citation preview

MALAYSIA NATIONAL HEALTH ACCOUNTS
Health Expenditure Report Revised Time Series (1997-2008) & Health Expenditure Report (2009)
MALAYSIA NATIONAL HEALTH ACCOUNTS UNITPLANNING & DEVELOPMENT DIVISION MINISTRY OF HEALTH MALAYSIA 2011

Published byMalaysia National Health Accounts (MNHA) UnitPlanning & Development DivisionMinistry of HealthLevel 6-9, Block E6, Parcel E,Precint 1, Federal GovernmentAdministrative Center,62590 Putrajaya, MalaysiaWebsite: www.moh.gov.my
ISSN 1985-711
© MOH 2011. All rights reserved.First published 2011
Enquiries concerning reproduction or interpretation of the contents of this publication should be directed to the Malaysia National Health Accounts Unit, Planning & development DIvision, Ministry of Health Malaysia.
Printed in Malaysia

iHEALTH EXPENDITURE REPORT Revised Time Series (1997-2008) & Health Expenditure Report (2009)
Information on national health expenditure becomes more important as Malaysia moves towards attaining a developed nation status by the year 2020. Malaysia aims to achieve this in the most efficient and effective manner. Thus policy makers often refer to National Health Accounts data as part of the tangible macro-level evidence in planning as well as monitoring and evaluation of progress and outcomes of almost every activity involving financial resources.
Many countries, both developed and developing nations, are already tracking and reporting their national health expenditure using the World Health Organization (WHO) accepted National Health Accounts (NHA) methodology called the System of Health Accounts (SHA). Malaysia too uses this framework with slight modifications to suit local needs of policy makers.
The Malaysia National Health Accounts (MNHA) Unit under the Planning and Development Division of the Ministry of Health (MOH) is able to produce regular national level expenditure data. The MNHA data 1997-2009 after endorsement by the MNHA Steering Committee has been discussed during the MNHA Policy Dialogue to provide meaningful inputs for policy decisions. This has come timely as Malaysia moves towards health care delivery and financial reforms in tandem with other activities to achieve the ultimate goal of a developed nation.
I would like to take this opportunity to thank the multiple agencies and data sources for their continued support in providing the required data for the production of MNHA. Your continued support undoubtedly contributes towards the destined national achievements.
Thank you.
Datuk Kamarul Zaman Bin Md IsaSecretary General,Ministry of Health, Malaysia.
Message by theSecretary GeneralMinistry of Health Malaysia

MALAYSIA NATIONAL HEALTH ACCOUNTSii
National progress and productivity is very much dependent on the health of the people. The Malaysia National Health Accounts (MNHA) data provides vital information on the use of financial resources in ensuring affordable, equitable and accessible health care system in the country to ensure good health of the people. Health expenditure information from both the public as well as the private sector will assist policy makers in making informed decisions related to health care financing reforms.
In the past, the MNHA Unit has produced 3 reports on national health accounts spanning from 1997 to 2008. It is even more encouraging to note that the mandate given to this unit is taken seriously by further improvements in data quality. The previous data and the MNHA 2009 data is now produced using internationally accepted standardized methods for comparable time series expenditure data. The data is reported using both MNHA and SHA framework for both local and international comparisons.
This revised data now shows increasing health expenditure over the time period with public sector higher than the private sector expenditure at an average of 55:45 per cent share of total health expenditure. In the public sector, the Ministry of Health (MOH) has remained the largest funder of health services & products at an average of 80 per cent share whereas in the private sector the out-of-pocket (OOP) has remained at 30-40 per cent share of total expenditure. These are useful information in the review and planning of health care financing mechanism for the country. I congratulate the MNHA Unit upon the successful completion of the challenging task of producing comparable NHA data. I also urge continuous support from all stakeholders to assist the MNHA Unit along the pathway towards further developments and achievements.
Thank you.
Dato’ Sri Dr. Hasan Bin Abdul RahmanDirector General of Health, Ministry of Health, Malaysia.
Message by theDirector General of Health,Malaysia

iiiHEALTH EXPENDITURE REPORT Revised Time Series (1997-2008) & Health Expenditure Report (2009)
Over the last ten years, since the inception of NHA in 2001 as a government project under the Ministry of Health, the importance of MNHA has risen to a higher level. This is mainly due to the demand for expenditure data by policy makers especially those involved in health care financing. The need for expenditure trend analysis compelled the MNHA Unit to review all previous data as well as produce additional related data. As a result, the outputs of the revised time series MNHA 1997-2008 and the MNHA 2009, as well as two new sub-accounts, the OOP sub-account and the MOH sub-account will further support the data requirements. In addition, the unit is also for the first time reporting state disaggregation of MNHA. Furthermore, this time the NHA data is produced using both the MNHA framework as well as the SHA framework.
In spite of several challenges, the MNHA Unit has been able to complete all these tasks in two years and this is certainly quite a commendable achievement. Malaysia has set an example for other countries on the potential progress and possible refinements through institutionalization of NHA. However, none of these achievements is possible without strong support from all our stakeholders especially from those who diligently continue to submit the necessary data. Also, the senior management in the MOH constantly provides the strength to strive for the highest quality in the MNHA data.
It is hoped that the spirit and enthusiasm within the MNHA unit will spur further developments and data support to those who require it. The unit hopes to continue providing reliable and timely macro-level expenditure data to all our stakeholders.
Dr. Jameela ZainuddinHead of MNHA Unit,Planning & Development,Ministry of Health, Malaysia.
PREFACE

MALAYSIA NATIONAL HEALTH ACCOUNTSiv
The revision of the previous MNHA time series data (1997-2008) and the production of the new MNHA 2009 data under a standardized internationally accepted methodology have been possible with support from several agencies and individuals.
The funding to engage consultancy came from the generosity of the regional World Health Organization (WHO) team with support from the Western Pacific Regional Office (WPRO) in Manila. This task would not have materialized without the financial aid.
Dr. Ravidran P Rannan-Eliya is a well-known name not only in the MNHA Unit, but also in the Western Pacific Region (WPR), WHO, OECD, World Bank and several international agencies as the technical expert in National Health Accounts. He is often referred to as the “father of NHA” in the WPR and his immeasurable support towards MNHA Unit is beyond words. He was involved in the initial MNHA Project and again this time he was engaged as the consultant for the various tasks conducted by the MNHA Unit over the last two years. The MNHA Unit has been very fortunate for Dr. Ravi to spend his valuable time in provision of the necessary advice and guidance to ensure the production of quality data for policy makers. His patience in teaching, training and further assistance through arrangements for his expert staff to provide hands-on training to the MNHA Unit staff demonstrates his sincerity to further institutionalize NHA in Malaysia.
Gratitude is also extended to the staffs of Institute of Health Policy (IHP) in Sri Lanka especially to Mr. Sanil De Alwis, Chamara Anuranga, Tharanga Fernando and Anna Glynn-Robinson who have all spent their valuable time in earnestly teaching and guiding the MNHA Unit staff on the technical know-how and also the unwritten rules on producing reliable NHA.
There were several formal and informal discussions with Dr. Rozita Halina Tun Hussein who was the local consultant during the MNHA Project. Unreserved appreciation is extended for her technical guidance and constant encouragement. A special thanks is forwarded to the Deputy Director General of the MOH, Dato’ Dr. Maimunah Abdul Hamid, for her sincere support in ensuring quality outputs and the sustainability of MNHA Unit. She has always been available with her constant reassurance when confronted with challenges. Appreciation is also extended to the head of the Planning & Development Unit, Dato’ Dr. Hj. Abd. Rahim Hj. Mohamad and his senior deputy, Dr. Rahimah Mohd Ariffin to see to the completion of the difficult tasks.
Warm thanks is extended to all the stakeholders who have diligently submitted the necessary data and are not mentioned here because of the lengthy list. The MNHA Steering Committee is acknowledged for the endorsement of the MNHA data.
The production of this report would not have been possible if not for the endeavoring determination of the current and past MNHA Unit staff and their persistence to further develop the necessary technical expertise.
Thank You All!
AKNOWLEDGEMENT

vHEALTH EXPENDITURE REPORT Revised Time Series (1997-2008) & Health Expenditure Report (2009)
CONTENTS
Message by the Secretary-General, Ministry of Health, MalaysiaMessage by the Director-General of Health, MalaysiaPrefaceAknowledgementContentsList of FiguresList of TablesList of Appendix TablesList of AbbreviationsReport information
i
ii
iii
iv
v
vi
vii
ix
x
xii
1 Background 1
2 Malaysia National Health Accounts (MNHA): Summary of Framework
2
3 Methodology of Data Collection & AnalysisSummary of Methodology Summary of Data Processing
4
4
5
4 Total Health Expenditure 8
5 Total Health Expenditure by Sources of Financing 11
6 Total Health Expenditure by Providers of Health Services 43
7 Total Health Expenditure by Function of Health Services 57
8 State Expenditure 68
9 International comparison 72
Appendix TablesList of Committees and Members
75
86

MALAYSIA NATIONAL HEALTH ACCOUNTSvi
F4.1 Trend for Total Health Expenditure, 1997-2009 (RM Million & Per cent GDP) 9
F4.2 Per Capita Spending on Health, 1997-2009 (RM, Ringgit Malaysia) 10
F5.1 Total Health Expenditure by Source of Financing (Public Vs. Private), 1997- 2009 12
F5.2 Total Expenditure by Sources of Financing, 2009 14
F5.3 Total Health Expenditure by the Public Sector Sources of Financing, 2009 18
F5.4 Public Sector Expenditure by Providers of Health Services, 2009 22
F5.5 Public Sector Expenditure by Functions of Health Services, 2009 26
F5.6 Total Health Expenditure by Private Sector Sources of Financing, 2009 30
F5.7 Private Sector Expenditure by Providers of Health Services, 2009 33
F5.8 Private Sector Expenditure by Functions of Health Services, 2009 37
F5.9 Private Household Out-of-Pocket Expenditure by Providers of Health Services, 2009 41
F6.1 Total Expenditure on Health by Providers of Health Services, 2009 44
F6.2 Hospital Expenditure by Sources of Financing, 2009 48
F6.3 MOH Hospital Expenditure by Curative Care Functions of Health Services, 2009 52
F6.4 Ambulatory Care Provider (Non-Hospital Setting) Expenditure by Source of Financing 2009
55
F7.1 Total Expenditure on Health by Function of Health Services, 2009 58
F7.2 Curative Care Expenditure by Source of Financing, 2009 62
F7.3 Preventive and Promotive Public Health Programmers by Sources of Financing, 2009 64
F7.4 Education and Health Training Expenditure by Sources of Financing, 2009 66
F8.1 Total expenditure by State, 2009 69
F8.2 State Polulation and Per Capita Health Spending, 2009 70
F8.3 State Per Capita Health Spending by Public and Private Sector, 2009 71
F9.1 International Comparison of Total Health Expenditure as Per Cent GDP, 2008 73
F9.2 International Comparison of Per Capita spending on Health, 2008 73
F9.3 International Comparison of Public and Private share of Total Health Expenditure, 2008 74
F9.4 OOP as share Private sector spending Vs Private Share of Total Health Expenditure, 2008
74
FIGURES

viiHEALTH EXPENDITURE REPORT Revised Time Series (1997-2008) & Health Expenditure Report (2009)
T4.1 Total Health Expenditure, 1997-2009 (RM Million & Per cent GDP) 9
T4.2 Per Capita Spending on Health, 1997-2009 (RM & USD) 10
T5.1 Total Health Expenditure by Source of Financing (Public & Private Sectors), 1997-2009 12
T5.2a Total Health Expenditure by Sources of Funding, 2009 14
T5.2b Total Health Expenditure by Sources of Financing, 1997 - 2009 (RM Million) 15
T5.2c Total Health Expenditure by Sources of Financing, 1997 - 2009 (Per cent) 16
T5.3a Total Health Expenditure by Public Sector Sources of Funding, 2009 18
T5.3b Total Health Expenditure by Public Sector Sources of Financing, 1997 - 2009 (RM Million)
19
T5.3c Total Health Expenditure by Public Sector Sources of Financing, 1997–2009 (Per cent) 20
T5.4a Public Sector Expenditure by Providers of Health Services, 2009 22
T5.4b Public Sector Expenditure by Provider of Health Services, 1997-2009 (RM Million) 23
T5.4c Public Sector Expenditure by Provider of Health Services, 1997-2009 (Per cent) 24
T5.5a Public Sector Expenditure by Function of Health Services, 2009 26
T5.5b Public Sector Expenditure by Function of Health Services, 1997-2009 (RM Million) 27
T5.5c Public Sector Expenditure by Function of Health Services, 1997-2009 (Per cent) 28
T5.6a Total Health Expenditure by Private Sector Sources of Financing, 2009 30
T5.6b Total Health Expenditure by Private Sector Sources of Financing, 1997 – 2009 (RM Million)
31
T5.6c Total Health Expenditure by Private Sector Sources of Financing, 1997 – 2009 (Per cent)
31
T5.7a Private Sector Expenditure by Providers of Health Services, 2009 33
T5.7b Private Sector Expenditure by Providesr of Health Services, 1997 - 2009 (RM Million) 34
T5.7c Private Sector Expenditure by Provider of Health Services, 1997 - 2009 (Per cent) 35
T5.8a Private Sector Expenditure by Function of Health Services, 2009 37
T5.8b Private Sector Expenditure by Function of Health Services, 1997-2009 (RM Million) 38
T5.8c Private Sector Expenditure by Function of Health Services, 1997-2009 (Per cent) 39
TABLES

MALAYSIA NATIONAL HEALTH ACCOUNTSviii
T5.9a Private Household Out-of-Pocket Expenditure by Provider of Health Services, 2009 41
T5.9b Private Household Out-of-Pocket Expenditure by Provider of Health Services, 1997-2009
42
T5.9c Private Household Out-of-Pocket Expenditure by Provider of Health Services, 1997-2009 (Per cent)
42
T6.1a Total Health Expenditure by Providers of Health Services, 2009 44
T6.1b Total HealthExpenditure by Provider of Health Services, 1997-2009 (RM Million) 45
T6.1c Total Health Expenditure by Provider of Health Services, 1997-2009 (Per cent) 46
T6.2a Hospital Expenditure by Sources of Financing, 2009 48
T6.2b Hospital Expenditure by Sources of Financing, 1997-2009 (RM Million) 49
T6.2c Hospital Expenditure by Source of Financing, 1997-2009 (Per cent) 50
T6.3a MOH Hospital Expenditure by Curative Care Function of Health Services, 2009 52
T6.3b MOH Hospital Expenditure by Curative Care Function of Health Services, 1997-2009 (RM Million)
53
T6.3c MOH Hospital Expenditure by Curative Care Function of Health Services, 1997-2009 (Per cent)
53
T6.4a Ambulatory Care (non-hospital) Expenditure by Source of Financing, 2009 55
T6.4b Ambulatory Care (non-hospital) Expenditure by Source of Financing, 1997-2009 (RM Million)
56
T6.4c Ambulatory Care (non-hospital) Expenditure by Source of Financing, 1997-2009 (Per cent)
56
T7.1a Total Expenditure on Health by Function of Health Services, 2009 58
T7.1b Total Expenditure on Health by Function of Health Services, 1997-2009 (RM Million) 59
T7.1c Total Expenditure on Health by Function of Health Services, 1997-2009 (Per cent) 60
T7.2 Curative Care Expenditure by Source of Financing, 1997- 2009 (RM Million) 63
T7.3 Preventive and Promotive Public Health Expenditure by Source of Financing, 1997 -2009 (RM Million)
65
T7.4a Education and Training Expenditure by Source of Financing, 1997 – 2009 (RM Million) 67
T7.4b Education and Training Expenditure by Source of Financing, 1997 - 2009 (Per cent) 67
T8.1 State Population and Health Expenditure, 2009 69
T8.2 State Polulation and Per Capita Health Spending, 2009 70
T8.3 State Per Capita Health Spending by Public and Private Sector, 2009(RM, Ringgit Malaysia)
71

ixHEALTH EXPENDITURE REPORT Revised Time Series (1997-2008) & Health Expenditure Report (2009)
A1 Sources of Data 75
A2 Comparison of MNHA to SHA Framework (OECD 2000) with SHA Tables 78
A2.1a Classification of Total Expenditure on Health by Source of Financing 78
A2.1b Classification of Total Expenditure on Health by Providers of Health Services 79
A2.1c Classification of Total Expenditure on Health by Function of health Services 80
A3 Current Expenditure on Health by Function of Care, Provider Industry and Source of Funding, 2009 (RM Million)
81
A4 Current Expenditure on Health by Function of Care and Provider Industry, 2009 (RM Million)
82
A5 Total Health Expenditure by Provider Industry and Financing Agent, 2009 (RM Million)
83
A6 Current Health Expenditure by Provider Industry and Financing Agent, 2009 (RM Million)
84
A7 Total Expenditure on Health, Including Health-Related Functions, 2009 (RM Million)
85
APPENDIX TABLE

MALAYSIA NATIONAL HEALTH ACCOUNTSx
AADK Agensi Anti Dadah Kebangsaan (National Anti-Drug Agency)
AG Accountant-General
APHM Association of Private Hospital Malaysia
BNM Bank Negara Malaysia (Central Bank of Malaysia)
DOS Department of Statistics
DOSH Department of Occupational Safety and Health
DOSM Department of Statistics Malaysia
EPF Employees Provident Fund
EPU Economic Planning Unit
FOMEMA Foreign Worker’s Medical Examination Monitoring Agency
GDP Gross Domestic Product
HC ICHA code for function of health services
HF ICHA code for sources of funding for health services
HP ICHA code for providers of health services
HQ Headquarters
ICHA International Classification for Health Accounts
IHP Institute of Health Policy
IMS Intercontinental Medical Supply
LA Local Authorities
LIAM Life Insurance Association of Malaysia
LMIC Low and Middle Income Countries
MARA Malaysia Amanah Rakyat (Council of Trust for Indigenous People)
MCO Managed Care Organization
MDC Malaysian Dental Council
MF MNHA Code for Functions of Health Service
MMC Malaysia Medical Council
MNHA Malaysia National Health Accounts
MOD Ministry of Defence
MOF Ministry of Finance
MOH Ministry of Health
ABBREVIATIONS

xiHEALTH EXPENDITURE REPORT Revised Time Series (1997-2008) & Health Expenditure Report (2009)
MOHE Ministry of Higher Education
MOSTI Ministry of Science Technology and Innovation
MP MNHA Code for Providers of Health Services
MR MNHA Code for Health-Related Functions
MS MNHA Code for Sources of Financing
NGO Non-Government Organization
NHA National Health Accounts
NHHES National Household Health Expenditure Survey
NIAM National Insurance Association of Malaysia
NIOSH National Institute of Occupational Safety and Health
OECD Organization for Economic Co-operation and Development
OOP Out-of-Pocket
PCDOM Primary Care Doctor’s Organization Malaysia
PIAM Persatuan Insurans Am Malaysia (General Insurance Association of Malaysia)
PSD Public Service Department
RM Ringgit Malaysia (Malaysia Currency)
ROW Rest of The World
SHA System of Health Accounts
SOCSO Social Security Organization
TCM Traditional Complementary Medicines
TEH Total Expenditure on Health
UK United Kingdom
UMMC University Malaya Medical Centre
UNDP United Nations Development Programme
USD US Dollar
Vs Versus
WHO World Health Organization
WP Wilayah Persekutuan (Federal Territories)
WPR Western Pacific Region
WPRO Western Pacific Regional Office

MALAYSIA NATIONAL HEALTH ACCOUNTSxii
This fourth publication on the Malaysia National Health Accounts (MNHA) has two sets of data, the reviewed past year time series data (1997-2008) and the new 2009 MNHA data. Together, these thirteen years data from 1997 to 2009 are the result of revised standardized methodology. The present sets of data are comparable between the years and can be used for future projections. They were produced under the technical guidance from Dr. Ravindra P Rannan-Eliya and his team. Internationally acceptable National Health Accounts (NHA) methodology was used to produce these new data.
It was very challenging for the MNHA team, under multiple constraints, to reconstruct and re-compile the raw data and then carry out the necessary analysis. Although the analysis was conducted based on the MNHA framework, constant references were made to the SHA Manual, Guide to Producing NHA in Low and Middle Income Countries (LMIC), OECD Private Expenditure Guideline, WHO document on estimating OOP spending for NHA and several other NHA technical guides for definitions and methodology.
The reporting format follows closely the MNHA framework and is kept similar to previous reporting format. The “Malaysia National Health Accounts: Health Expenditure Report Revised Time Series 1997-2008 and Health Expenditure Report 2009” has a total of nine chapters. Chapter 1 gives the background to the report followed by Chapter 2 on the summary of the MNHA framework and Chapter 3 on the methodology that was used. Chapters 4 to 7 provide details of the health expenditure based on the MNHA framework. Chapter 8 shows state disaggregation of health expenditure and Chapter 9 contains some international comparisons.
Most of the data for 2009 are exhibited in diagrammatic and table formats followed by tables on the 1997-2009 time series data. All data are in nominal values and reported in Ringgit Malaysia (RM) unless stated otherwise. However, it should be noted that the best method for annual comparisons is based on data that has been adjusted for inflation, preferably using the Gross Domestic Product (GDP) deflator.
Chapter 4 contains the Total Health Expenditure (TEH) trends from the year 1997 to 2009, as a percentage of gross domestic products (GDP), and the per capita expenditures for the same period. Chapter 5 is lengthy and contains data on the major categories of the sources of financing, namely the public sector and the private sector. It also contains expenditure of the various agencies under these two sectors. Both sector data is then separately cross-tabulated with the dimensions of providers and functions. Every set of data is also accompanied by a similar time series data.
REPORT INFORMATION

xiiiHEALTH EXPENDITURE REPORT Revised Time Series (1997-2008) & Health Expenditure Report (2009)
Chapter 6 and 7 provides data on the total health expenditures by providers and functions of health services. In addition, Chapter 6 also shows data on separate cross-tabulations between Ministry of Health (MOH) hospital expenditure with functions of health services. Similarly, Chapter 7 provides data on separate cross-tabulations of curative care, expenditures for preventive and promotive public health programmes and expenditures for education and training by sources of financing. Chapter 8 shows state disaggregation of health expenditure and Chapter 9 contains some international comparisons of MNHA data with NHA data from neighboring and regional countries as well as some developed country.
The appendix tables at the end of the report shows examples of data source and a very brief comparison of MNHA and SHA framework. Some data are also produced using SHA classification and displayed as SHA Tables.
It is important to note that the data shown in this report is based on the methodology stated under Chapter 3. Tables and figures are used to display the NHA data. Some of the figures on propotions have been adjusted to total up to 100 per cent. Components on tables may not add to total of 100 per cent due to rounding up.
As is the case in all reported NHA data from any country, refinements in internationally accepted methodology and inputs from new additional data source may lead to future changes in the figures. Therefore, it is advisable to refer to the most recent published MNHA data for policy decisions and research purposes.

MALAYSIA NATIONAL HEALTH ACCOUNTS1
Malaysia National Health Accounts (MNHA) started as a project by the Ministry of Health (MOH) with strong support from the Economic Planning Unit (EPU) of the Prime Minister’s Department. This Malaysia National Health Accounts Project (2001-2005) was funded mainly by the United Nations Development Programme (UNDP) and resulted in the production of the Malaysia National Health Accounts Project, Report on The MNHA Classification System (MNHA Framework) and the first MNHA report, Malaysia National Health Accounts Project, Health Expenditure Report (1997–2002). The outputs of this project were instrumental in the establishment of the Malaysia National Health Accounts (MNHA) Unit under the Planning & Development Division of MOH. Subsequently the MNHA Unit produced two other reports, MNHA Health Expenditure Report (1997-2006) and MNHA Health Expenditure Report (2007 & 2008). Together the three reports provided MNHA data spanning from 1997-2008.
The MNHA data provides a wealth of useful macro-level health expenditure information especially for policy makers. The importance of these data was elevated with the renewed need and interest in health financing reform for the country. When data from the three published reports were merged to produce various expenditure trending, some fluctuations were noted in the data. This had to be addressed before the production of the 2009 annual MNHA data. The consultant who was involved in the initial MNHA Project, Dr. Ravindra P Rannan Eliya, was re-engaged as the consultant to assist in the production of comparable annual time series expenditure data as well as the expected 2009 MNHA data. This time the Regional World Health Organization (WHO) in Malaysia stepped in to assist with the funding for the consultancy.
The consultancy has resulted in this publication containing comparable annual data of high quality produced by using internationally accepted NHA methodology. The data is presented in much the same manner as in the previous publications to ease understanding and permit comparisons. The chapters in this publication covers some general expenditure overviews followed by expenditure reports using the standard NHA framework, which is, expenditures by sources of funding, expenditures by providers of health services & products, and expenditures by functions of health services & products. Additional state expenditure disaggregation was carried out for the first time and reported in this publication. Tables and figures are used to display the NHA data. Some of the figures on proportions have been adjusted to total up to 100 per cent. Components on tables may not add to total of 100 per cent due to rounding up. For those who require references to trends over time periods, whenever possible, the revised 1997 to 2009 time series data is inserted between the detailed 2009 cross-sectional data. It is reminded that most of the data are in nominal Ringgit Malaysia (RM) values unless indicated otherwise.
Background
CHAPTER 1

2HEALTH EXPENDITURE REPORT Revised Time Series (1997-2008) & Health Expenditure Report (2009)
Malaysia National Health Accounts (MNHA): Summary Of Framework
National Health Accounts are basically standard sets of tables containing comprehensive, consistent, comparable, compatible and timely national health expenditure over a specified period. The System of Health Accounts SHA (OECD, 2000 Version 1.0) has been adopted by the World Health Organization (WHO) as a basis for international data collection and comparison. It proposes an integrated system of comprehensive and international comparable accounts and provides a uniform framework basic accounting rules and asset of tables for reporting health expenditures data. It also provides a more complete picture of the performance of the nation’s health system and the needs of government, private sector analysts and policy makers for health planning purposes.
The SHA (OECD 2000 Version 1.0) also proposes an International Classification for Health Accounts (ICHA) in three dimensions namely, health care sources of funding including public and private, health care service providers and health care functions. The MNHA framework was based on the SHA (OECD 2000 Version 1.0) classification with some modification to local suit need.
2.1. TOTAL EXPENDITURE ON HEALTH (TEH)
The OECD SHA defines the concept of total expenditure on health (TEH) as a standardized definition of which areas of health spending are to be measured and reported in national totals. In the MNHA framework, TEH comprises the expenditures from both the public and private sectors.
2.2. THE MNHA CLASSIFICATION
The SHA (OECD, 2000 Version 1.0) classifies all health system spending using a tri-axial-system, known as the International Classification for Health Accounts (ICHA), which categorizes health expenditure by:
• source of financing• provider of health services• function of health services
The MNHA framework is based on the SHA (OECD, 2000 Version 1.0) classification with some minor modifications to suit local needs (Appendix Tables A2, A2.1a, A2.1b, and A2.1c). Similar to the SHA classification, the MNHA classifies all expenditures into three main entities:
• source of financing (MS)• provider of health services (MP) • function of health services (MF)
CHAPTER 2

MALAYSIA NATIONAL HEALTH ACCOUNTS3
Source of financing is defined as entities that directly incur the expenditure and hence control and finance the amount of such expenditure. It includes the public sector spending inclusive of the federal government, state government, local authorities, and social security funds, and the private sector consisting of private health insurance, managed care organizations, out-of-pocket expenditure, non-profit institutions, and corporations.
Provider of health services is defined as entities that produce and provide health care goods and services. It is categorized as hospitals, nursing and residential care facility providers, ambulatory care providers, retail sale and medical goods providers, public health program providers and general health administration.
Functions of health services include core functions of health care (e.g. curative care, rehabilitative care, long term nursing care, ancillary services, outpatient medical goods, public health services, and health administration and health insurance) and health related functions (e.g. education and training of health personnel, and research and development).
This information is then processed by statistical software Stata (Version 11). The Stata allows tracking of results and compilation of estimated data based on the identified classifications to generate meaningful data.

4HEALTH EXPENDITURE REPORT Revised Time Series (1997-2008) & Health Expenditure Report (2009)
Methodology Of Data Collection And Analysis
3.1. SUMMARY OF METHODOLOGY
The method of data collection and analysis followed closely the method used in the first cycle of data collection whereby detailed definitions of what constitute health expenditure, institutional entities, and types of disaggregating were drawn up based on inputs from several documents, committee meetings, and consultative advice from sources within and outside the MOH. The result of such consultations included the production of a manual, Malaysia National Health Accounts Project: Methodology of Data Collection and Analysis that became the main reference material in this cycle of data collection for 1997-2009 national health expenditures.
Both primary and secondary data were used in this analysis. Primary data were obtained through studies, through states visit data retrieval and other primary datasets. The secondary data were retrieved through various data sources (Appendix Table A1). All these data were then coded according to the MNHA classification adapted from the SHA (OECD, 2000 Version 1.0) classification (Appendix Tables A2.1a, A2.1b, and A2.1c). Data were entered as federal and state-level data.
The sets of data from each source were processed differently depending on the availability and completeness of data. Data classification was carried out based on the tri-axial MNHA entities of sources, providers and functions. The MNHA framework enables health expenditure disaggregates to the lowest possible level under the three entities of sources, providers and functions. Cross-tabulations of the entities and their important subcomponents results in more detailed analysis of health expenditures.
The processes of data entry and analysis were carried out using Microsoft Excel Program and statistical software Stata (Version 11). The initial MNHA data preparation, analysis, and coding were done in Microsoft Excel spreadsheets and the output data files were uploaded into the Stata after data cleaning and program verification to produce the final tables and figures. Although Stata allows detailed analysis of the MNHA, these report only highlights the important findings, which will be of use in future health policy development and health planning of the country.
CHAPTER 3

MALAYSIA NATIONAL HEALTH ACCOUNTS5
3.2. SUMMARY OF DATA PROCESSING
The methods used for data processing varied according to the availability, completion and sources of data as follows:
3.2.1 Public Sector
(i) Ministry of Health (MOH)Health expenditure data of the MOH (1997-2009) were obtained from the Accountant-General Office, Ministry of Finance (MOF). This expenditure was assigned the provider and function codes based on the MNHA framework.
(ii) Ministry of Higher Education (MOHE)The function of the university hospitals under the MOHE includes provision of health care services, health related training and research. Health expenditures of these institutions were mainly for curative care services. Other than these institutions, data (1997-2009) on the cost of training health professionals were obtained from various training colleges, Public Services Department (PSD), and other agencies.
(iii) Other Federal Agencies (including statutory bodies)The agencies under “Other Federal Agencies” currently consists of seventeen public agencies inclusive of National Anti-Drug Agency, Prison Department, Civil Defense Department, Salary and Allowances and Pension Department of Public Services Department National Heart Institute of Malaysia, Social Welfare Department of Malaysia, Department of Orang Asli Affairs, National Population and Family Development Board Malaysia, National Institute of Occupational Safety and Health Malaysia (NIOSH), Department of Occupational Safety and Health Malaysia (DOSH), National Sports Institute Of Malaysia, Ministry of Science Technology and Innovation (MOSTI), Pilgrims Fund Board and Pusat Pungutan Zakat. The Other Federal Agencies expenditure was mainly for curative care, retail sales and medical goods and research.
(iv) Local Authorities Most local authorities provide preventive care services such as disease control and food quality control. However, in addition to these, City Councils such as Kuala Lumpur City Hall (Dewan Bandaraya Kuala Lumpur), Penang City Hall, Kuching City Hall and Ipoh City Council also provide curative care service.
(v) (General) State GovernmentThis consists of health expenditure by all thirteen state governments. Three geographical areas of the country come under the Federal Territories and include Kuala Lumpur, Putrajaya and Labuan. Most of the state expenditure was mainly for curative care, ancillary services and environmental health such as for water treatment.

6HEALTH EXPENDITURE REPORT Revised Time Series (1997-2008) & Health Expenditure Report (2009)
(vi) Ministry of Defense (MOD)The Ministry of Defense provides health services through its army hospitals and Armed Forces Medical and Dental Centre (Rumah Sakit Angkatan Tentera and Pusat Pergigian Angkatan Tentera). The total health expenditure of this ministry (1997-2009) was captured from these sources, together with a study to estimate the proportions of this expenditure for disaggregation to providers and functions of health care services. The MOD expenditure was mainly for curative care services.
(vii) Social Security Funds There are two major organizations providing social security funds – the Employees Provident Fund (EPF) and the Social Security Organization (SOCSO), both of which are mandated by the government. In both, samplings of the medical bill claims were done to obtain health expenditures disaggregation to providers and functions and health care services.
(viii) Other State Agencies (including statutory bodies)The data (1997-2009) on the number of employees and the health expenditure for state statutory bodies were collected from various sources. In addition, the MNHA Survey of state agencies including the statutory bodies provided data on per capita spending as well as expenditure disaggregation to provider and function of health care services.
3.2.2 Private Sector
(i) Household Out-of-Pocket (OOP) ExpenditureThe private household OOP expenditure estimation is complex and challenging. MNHA framework uses the Integrative Approach of consumption, provision and financing perspectives with necessary adjustments to avoid double counting of expenditures. Expenditure data is summated from both production and consumption side sources, with deductions of the reimbursable and others already included under other sources of funding. The approach includes the capture of the gross revenues from various sources such as the user charges of MOH hospital, university hospitals, National Heart Institute, revenues of private hospital, private medical clinic and private dental clinic, sales of pharmaceutical and other medical supplies, ancillary services, sales of traditional medicine and revenues of traditional treatment providers.
The summation of all these revenues is considered as the gross spending (OOP expenditure and non-OOP expenditure). In order to obtain the net OOP spending, all the refundable payments by insurance, private corporation, SOCSO, EPF, Statutory bodies, FOMEMA or other parties exclusive of direct OOP payment are subtracted. The balance is assumed as the estimated private OOP expenditure.

MALAYSIA NATIONAL HEALTH ACCOUNTS7
(ii) Private Corporations/Private Companies About one fifth of the population works in the private sector and gain medical benefits through the private employer benefit scheme. The average per capita health expenditure was calculated based on the survey conducted by Department of Statistic Malaysia (DOSM) on various types of industries. The proportions of providers and functions estimated based on analysis and via MNHA questionnaires sent to the selected private companies.
(iii) Private Health InsuranceThe health expenditure of private health insurance is calculated based on the Medical Health Insurance data from the Central Bank of Malaysia. The proportion for providers and functions of health services is obtained via the MNHA Survey of sampled insurance companies.
(iv) Non-Governmental Organization (NGO)Besides social activities, the non-governmental organizations (NGOs) are also involved in health related activities. Health expenditure incurred by the NGOs is obtained through the MNHA Survey of these organizations which enables the expenditure disaggregation to providers and functions of health care services.
(v) Managed Care Organization (MCO)Under the provisions of the existing law, only insurance companies are allowed to undertake ‘health risk’. In Malaysia most of the organizations considered as MCOs are third party payers. The data obtained from these third party payers were data mainly related to health administration of health insurance.

8HEALTH EXPENDITURE REPORT Revised Time Series (1997-2008) & Health Expenditure Report (2009)
Total Health Expenditure
The total health expenditure (TEH) for Malaysia during 1997-2009 ranged from RM8,045 million in 1997 to RM33,691million in 2009 (Figure 4.1 and Table 4.1). The health spending as a share of Gross Domestic Product (GDP) for the same period ranged from 2.85 per cent to 4.96 per cent of GDP. Overall, the per capita spending on health ranged from RM370 (USD119) in 1997 to RM1208 (USD387) in 2009 (Figure 4.2 and Table 4.2).
CHAPTER 4

MALAYSIA NATIONAL HEALTH ACCOUNTS9
Table 4.1: Total Health Expenditure, 1997-2009 (RM Million & Per cent GDP)
Spending Total Health Expenditure, Nominal
(RM Million)
Total Health Expenditure,
Constant (RM Million)
Total Expenditure as % GDP
Total GDP, Nominal (RM Million)* Year
1997 8,045 13,232 2.85 281,795
1998 8,751 13,267 3.09 283,243
1999 9,711 14,716 3.23 300,764
2000 11,635 16,414 3.26 356,401
2001 13,182 18,896 3.74 352,579
2002 14,588 20,277 3.81 383,213
2003 18,399 24,757 4.39 418,769
2004 19,912 25,274 4.20 474,048
2005 20,131 24,421 3.85 522,445
2006 24,227 28,294 4.22 574,441
2007 26,389 29,382 4.11 642,049
2008 30,601 30,876 4.12 742,470
2009 33,691 33,691 4.96 679,938
Source: *Department of Statistics Malaysia
FIGURE 4.1: Trend for Total Health Expenditure, 1997 - 2009 (RM Million & Per cent GDP)
2.85
8,045 8,7519,711
11,63513,182
14,588
18,39919,912 20,131
24,227
3.09 3.23 3.26
3.74 3.81
4.39
3.854.22 4.114.20
(RM
bill
ion)
-
-
-
-
-
-
-
-
-1997 1998 1999 2000 2001 2002 2003 2004 2005 2006 2007 2008 2009
5,000
0
10,000
15,000
20,000
25,000
30,000
35,000
40,000
1.00
2.00
3.00
4.00
5.00
(% G
DP
)
30,60133,6914.12
4.96
26,389
Total Expenditure on Health (RM MIllion) Total Expenditure as % GDP

10HEALTH EXPENDITURE REPORT Revised Time Series (1997-2008) & Health Expenditure Report (2009)
FIGURE 4.2: Per Capita Spending on Health, 1997 - 2009 ( Ringgit Malaysia, RM )
RM
370 392424
495446
590
727769 760
903
971
1,111
1,208
1997 1998 1999 2000 2001 2002 2003 2004 2005 2006 2007 2008 2009
200
400
600
800
1,000
1,200
1,200
Table 4.2: Per Capita Spending on Health, 1997-2009 (RM & USD)
Spending / Population Total Health
Expenditure, Nominal
(RM Million)
Total Health Expenditure,
Constant (RM Million)
Per Capita Spending,
Nominal (RM)
Per Capita Spending,
Constant (RM)
Per Capita Spending, Nominal (USD)**
Total Population*
Year
1997 8,045 13,232 370 608 119 21,769,300
1998 8,751 13,267 392 594 126 22,333,500
1999 9,711 14,716 424 642 136 22,909,500
2000 11,635 16,414 495 699 159 23,494,900
2001 13,182 18,896 546 783 175 24,123,400
2002 14,588 20,277 590 820 189 24,727,100
2003 18,399 24,757 727 978 233 25,320,000
2004 19,912 25,274 769 976 247 25,905,100
2005 20,131 24,421 760 922 244 26,476,900
2006 24,227 28,294 903 1,055 290 26,831,500
2007 26,389 29,382 971 1,081 311 27,186,000
2008 30,601 30,876 1,111 1,121 356 27,540,500
2009 33,691 33,691 1,208 1,208 387 27,895,300
Source: * Department of StatisticsNote: ** Exchange rate at RM3.1175=USD1 (BNM website in Sept 2011)

MALAYSIA NATIONAL HEALTH ACCOUNTS11
Total Health Expenditure by Sources of Financing
The various sources of financing for health care services and products include multiple agencies in the public as well as the private sector. In the public sector these sources of financing include federal government, state government, local authorities and social security funds. In the private sector these sources of financing include private insurance enterprises, managed care organizations, private household OOP, not-for-profit institutions, and private corporations (Appendix Table A2.1a).The share of both these two sectors to the total health spending can be identified for each year.
In 2009, the health spending of the public and private sector was RM18,401 million and RM15,291 million respectively (Figure 5.1 and Table 5.1). This translates to a public:private share of 55:45 and a similar pattern is noted throughout the time series from 1997 to 2009. During this period, both the public sector and private sector spending shows an upward trend but the public share of health spending remained higher than the private share except that in the year 2005 when there was a slight drop in public spending and as a share of total health expenditure.
CHAPTER 5

12HEALTH EXPENDITURE REPORT Revised Time Series (1997-2008) & Health Expenditure Report (2009)
Public Sector Private Sector
FIGURE 5.1: Total Health Expenditure by Source of Financing (Public vs. Private), 1997-2009
RM
Mill
ion
3,504 3,873 4,288
5,156 5,5136,278
7,543
8,820
9,904
11,012
12,291
14,077
15,291
18,401
16,524
14,098
13,216
10,22711,09210,856
8,3107,669
6,479
5,4244,8794,540
1997 1998 1999 2000 2001 2002 2003 2004 2005 2006 2007 2008 2009
2,000
0
4,000
6,000
8,000
10,000
12,000
14,000
16,000
18,000
20,000
TABLE 5.1 : Total Health Expenditure by Source of financing By Public & Private Sectors, 1997-2009
Year
Sources of Financing
Public Sector Private Sector Total
RM Million Per cent RM Million Per cent RM Million
1997 4,540 56.44 3,504 43.56 8,045
1998 4,879 55.75 3,873 44.25 8,751
1999 5,424 55.85 4,288 44.15 9,711
2000 6,479 55.69 5,156 44.31 11,635
2001 7,669 58.18 5,513 41.82 13,182
2002 8,310 56.96 6,278 43.04 14,588
2003 10,856 59.00 7,543 41.00 18,399
2004 11,092 55.70 8,820 44.30 19,912
2005 10,227 50.80 9,904 49.20 20,131
2006 13,216 54.55 11,012 45.45 24,227
2007 14,098 53.42 12,291 46.58 26,389
2008 16,524 54.00 14,077 46.00 30,601
2009 18,401 54.62 15,291 45.38 33,691

MALAYSIA NATIONAL HEALTH ACCOUNTS13
Sources of Financing
In 2009, among the various agencies under the sources of financing, the Ministry of Health (MOH) had the highest expenditure amounting to RM14,713 million or 44 per cent share of total health expenditure (Figure 5.2 and Table 5.2a). This was followed by private household out-of-pocket (OOP) spending of RM11,986 million or 36 per cent share of total health expenditure. After MOH and OOP expenditure, the next highest spending was by Ministry of Higher Education (MOHE) at RM2,328 million and private insurance at RM1,968 million occupying a share of 7 and 6 per cent respectively. The federal agencies including federal statutory bodies spent RM929 million whereas corporations (excluding their corporate health insurance) spent RM899 million contributing to about 3 per cent each of the total share of all national health expenditure. All the remaining sources of financing spent less than RM500 million per agency or under 1 per cent of the total health expenditure.
The 1997 to 2009 time series expenditure of all sources of financing shows MOH as the highest financier followed by OOP and MOHE (Table 5.2b and Table 5.2c). The time series data trend shows that prior to 2002, after MOH, OOP, and MOHE, the fourth highest source of financing was by corporations (excluding their corporate health insurance) followed by health insurance. This trend reversed after 2002 with private insurance expenditure occupying the fourth and the corporations (excluding their corporate health insurance) occupying the fifth highest share of total health expenditure.

14HEALTH EXPENDITURE REPORT Revised Time Series (1997-2008) & Health Expenditure Report (2009)
FIGURE 5.2: Total Health Expenditure by Sources of Financing, 2009
44%
36%
7% 7%6%
MOH Private household
OOP
Private insurance
All Other agencies
MOHE
0%
5%
10%
15%
20%
25%
30%
35%
40%
45%
50%
Per
cen
t of T
EH
TABLE 5.2a: Total Health Expenditure by Sources of Funding, 2009
MNHA code Sources of Financing, 2009 RM Million Per cent
MS1.1.1.1 Ministry of Health (MOH) 14,713 43.67
MS2.4 Private household out-of-pocket expenditures (OOP) 11,986 35.58
MS1.1.1.2 Ministry of Higher Education (MOHE) 2,328 6.91
MS2.2 Private insurance enterprises (other than social insurance) 1,968 5.84
MS1.1.1.9 Other federal agencies (including statutory bodies) 929 2.76
MS2.6 All Corporations (other than health insurance) 899 2.67
MS2.5 Non-profit organizations serving households (NGO) 367 1.09
MS1.1.3 Local Authorities 131 0.39
MS1.2.2 Social Security Organization (SOCSO) 93 0.28
MS1.1.2.1 (General) State Government 84 0.25
MS2.3 Private MCOs and other similar entities 66 0.20
MS1.1.1.3 Ministry of Defence (MOD) 57 0.17
MS1.2.1 Employee Provident Funds (EPF) 40 0.12
MS1.1.2.2 Other state agencies (including statutory bodies) 26 0.08
MS9 Rest of the world 4 0.01
Total 33,691 100.00

MALAYSIA NATIONAL HEALTH ACCOUNTS15
TAB
LE 5
.2b
: To
tal H
ealt
h E
xpen
dit
ure
by
So
urce
s o
f Fi
nanc
ing
, 199
7 -
2009
(RM
Mill
ion)
MN
HA
co
de
So
urce
of
fina
ncin
g19
9719
9819
9920
0020
0120
0220
0320
0420
0520
0620
0720
0820
09
MS
1.1.
1.1
Min
istr
y of
Hea
lth (M
OH
)3,
707
4,03
3 4,
450
5,36
7 6,
251
6,67
0 9,
013
8,91
7 8,
060
10,8
38
11,2
43
13,0
36
14,7
13
MS
1.1.
1.2
Min
istr
y of
Hig
her
Edu
catio
n (M
OH
E)
525
517
612
706
890
1,01
8 1,
133
1,22
9 1,
301
1,43
0 1,
681
1,97
9 2,
328
MS
1.1.
1.3
Min
istr
y of
Def
ence
(MO
D)
15
7 10
12
22
36
20
24
25
26
58
10
8 57
MS
1.1.
1.9
Oth
er fe
dera
l age
ncie
s (in
clud
ing
stat
utor
y bo
dies
)20
1 21
6 23
5 26
2 34
8 40
2 47
9 68
5 60
6 65
7 80
8 1,
059
929
MS
1.1.
2.1
(Gen
eral
) Sta
te G
over
nmen
t32
36
31
33
37
41
44
50
57
65
81
85
84
MS
1.1.
2.2
Oth
er s
tate
age
ncie
s (in
clud
ing
stat
utor
y bo
dies
)5
5 10
9
10
11
11
13
15
15
16
17
26
MS
1.1.
3Lo
cal A
utho
ritie
s36
37
40
46
50
65
75
77
82
89
10
2 11
5 13
1
MS
1.2.
1E
mpl
oyee
Pro
vide
nt F
unds
(EP
F)7
15
20
24
32
36
43
56
61
46
52
49
40
MS
1.2.
2S
ocia
l Sec
urity
Org
aniz
atio
n (S
OC
SO
)12
13
15
20
28
30
39
39
20
48
57
76
93
MS
2.2
Priv
ate
Insu
ranc
e en
terp
rises
(oth
er th
an s
ocia
l ins
uran
ce)
295
365
421
516
599
718
964
1,12
4 1,
084
1,24
6 1,
413
1,70
9 1,
968
MS
2.3
Priv
ate
MC
Os
and
othe
r si
mila
r en
titie
s48
50
52
55
58
61
64
72
81
91
79
69
66
MS
2.4
Priv
ate
hous
ehol
d ou
t-of
-poc
ket e
xpen
ditu
res
(OO
P)
2,57
6 2,
835
3,15
5 3,
864
4,05
6 4,
655
5,62
9 6,
719
7,66
7 8,
582
9,55
4 11
,050
11
,986
MS
2.5
Non
-pro
fit o
rgan
izat
ions
ser
ving
hou
seho
lds
(NG
O)
99
108
111
136
144
163
186
207
236
259
294
338
367
MS
2.6
All
Cor
pora
tions
(oth
er th
an h
ealth
insu
ranc
e)48
6 51
5 54
9 58
1 65
6 68
1 70
0 69
8 83
6 83
4 95
0 91
0 89
9
MS
9R
est o
f the
wor
ld0
0 0
5 0
0 0
0 0
0 1
1 4
Tota
l8,
045
8,75
1 9,
711
11,6
35
13,1
82
14,5
88
18,3
99
19,9
12
20,1
31
24,2
27
26,3
89
30,6
01
33,6
91

16HEALTH EXPENDITURE REPORT Revised Time Series (1997-2008) & Health Expenditure Report (2009)
TAB
LE 5
.2c
: To
tal H
ealt
h E
xpen
dit
ure
by
So
urce
s o
f Fi
nanc
ing
, 199
7 -
2009
(Per
cen
t, %
)
MN
HA
co
de
So
urce
of
fina
ncin
g19
9719
9819
9920
0020
0120
0220
0320
0420
0520
0620
0720
0820
09
MS
1.1.
1.1
Min
istr
y of
Hea
lth (M
OH
)46
.08
46.0
8 45
.82
46.1
3 47
.42
45.7
2 48
.99
44.7
8 40
.04
44.7
4 42
.60
42.6
0 43
.67
MS
1.1.
1.2
Min
istr
y of
Hig
her
Edu
catio
n (M
OH
E)
6.53
5.
91
6.30
6.
07
6.76
6.
98
6.16
6.
17
6.46
5.
90
6.37
6.
47
6.91
MS
1.1.
1.3
Min
istr
y of
Def
ence
(MO
D)
0.19
0.
08
0.10
0.
10
0.17
0.
25
0.11
0.
12
0.12
0.
11
0.22
0.
35
0.17
MS
1.1.
1.9
Oth
er fe
dera
l age
ncie
s (in
clud
ing
stat
utor
y bo
dies
)2.
50
2.47
2.
42
2.26
2.
64
2.76
2.
60
3.44
3.
01
2.71
3.
06
3.46
2.
76
MS
1.1.
2.1
(Gen
eral
) Sta
te G
over
nmen
t0.
39
0.41
0.
32
0.28
0.
28
0.28
0.
24
0.25
0.
28
0.27
0.
31
0.28
0.
25
MS
1.1.
2.2
Oth
er s
tate
age
ncie
s (in
clud
ing
stat
utor
y bo
dies
)0.
06
0.06
0.
10
0.08
0.
08
0.08
0.
06
0.06
0.
07
0.06
0.
06
0.06
0.
08
MS
1.1.
3Lo
cal A
utho
ritie
s0.
45
0.42
0.
41
0.39
0.
38
0.45
0.
41
0.39
0.
41
0.37
0.
39
0.38
0.
39
MS
1.2.
1E
mpl
oyee
Pro
vide
nt F
unds
(EP
F)0.
09
0.17
0.
21
0.20
0.
24
0.25
0.
23
0.28
0.
30
0.19
0.
20
0.16
0.
12
MS
1.2.
2S
ocia
l Sec
urity
Org
aniz
atio
n (S
OC
SO
)0.
15
0.15
0.
16
0.17
0.
21
0.21
0.
21
0.20
0.
10
0.20
0.
22
0.25
0.
28
MS
2.2
Priv
ate
insu
ranc
e en
terp
rises
(oth
er th
an s
ocia
l ins
uran
ce)
3.66
4.
17
4.33
4.
43
4.54
4.
92
5.24
5.
65
5.39
5.
14
5.35
5.
58
5.84
MS
2.3
Priv
ate
MC
Os
and
othe
r si
mila
r en
titie
s0.
60
0.57
0.
54
0.47
0.
44
0.42
0.
35
0.36
0.
40
0.38
0.
30
0.22
0.
20
MS
2.4
Priv
ate
hous
ehol
d ou
t-of
-poc
ket e
xpen
ditu
res
(OO
P)
32.0
2 32
.39
32.4
9 33
.21
30.7
7 31
.91
30.5
9 33
.74
38.0
9 35
.42
36.2
0 36
.11
35.5
8
MS
2.5
Non
-pro
fit o
rgan
izat
ions
ser
ving
hou
seho
lds
(NG
O)
1.24
1.
23
1.14
1.
17
1.10
1.
12
1.01
1.
04
1.17
1.
07
1.11
1.
11
1.09
MS
2.6
All
Cor
pora
tions
(oth
er th
an h
ealth
insu
ranc
e)6.
05
5.88
5.
65
4.99
4.
97
4.67
3.
81
3.51
4.
15
3.44
3.
60
2.98
2.
67
MS
9R
est o
f the
wor
ld0.
00
0.00
0.
00
0.04
0.
00
0.00
0.
00
0.00
0.
00
0.00
0.
00
0.00
0.
01
Tota
l10
0.00
10
0.00
10
0.00
10
0.00
10
0.00
10
0.00
10
0.00
10
0.00
10
0.00
10
0.00
10
0.00
10
0.00
10
0.00

MALAYSIA NATIONAL HEALTH ACCOUNTS17
Public Sector Sources of Financing
In 2009, analysis of the public sector sources of financing shows that the MOH spent RM14,713 million (80 per cent), making it the largest financier in this sector. This is followed by MOHE RM2,328 million (13 per cent), other federal agencies (including statutory bodies) RM929 million (5 per cent), Local Authorities RM131 million (1 per cent), and other public sector agencies with each agency spending less than RM100 million but in total amounting to RM301 million (1 per cent) (Figure 5.3 and Table 5.3a).
The public sector time series expenditure data shows a similar trend throughout the 1997-2008 period with MOH spending progressively increasing from RM3,707 million in 1997 to RM13,036 million in 2008 (Table 5.3b). This amounts to between 79 to 83 per cent share of public spending (Table 5.3c). MOH expenditure was followed by MOHE starting at RM525 million in 1997 and dropping slightly to RM517 million in 1998 and from then on progressively increasing to RM1,979 million in 2008, occupying a share of 10 to 13 per cent of public sector spending. After MOH and MOHE, other federal agencies including the federal statutory bodies expenditure started at RM201 million in 1997 and increased to RM1,059 million in 2008 occupying a share of 4 to 6 per cent of public sector expenditure. The remaining public sector agencies inclusive of MOD, state government, state agencies including state statutory bodies, LA, EPF and SOCSO each spent less than RM100 million per year (except for MOD spending RM108 million in 2008 and LA spending more than RM100 million for the last 3 years). These sources of financing contributed to a share of less than 1 per cent of the total public sector expenditure per agency per year.

18HEALTH EXPENDITURE REPORT Revised Time Series (1997-2008) & Health Expenditure Report (2009)
TABLE 5.3a: Total Health Expenditure by Public Sector Sources of Funding, 2009
MNHA code Sources of Financing, 2009 RM Million Per cent
MS1.1.1.1 Ministry of Health (MOH) 14,713 79.96
MS1.1.1.2 Ministry of Higher Education (MOHE) 2,328 12.65
MS1.1.1.9 Other federal agencies (including statutory bodies) 929 5.05
MS1.1.3 Local authorities 131 0.71
MS1.2.2 Social Security Organization (SOCSO) 93 0.51
MS1.1.2.1 (General) State Government 84 0.45
MS1.1.1.3 Ministry of Defence (MOD) 57 0.31
MS1.2.1 Employee Provident Funds (EPF) 40 0.22
MS1.1.2.2 Other state agencies (including statutory bodies) 26 0.14
Total 18,401 100.00
FIGURE 5.3: Total Health Expenditure by Public Sector Sources of Financing, 2009
MOH MOHE LAOther Federal agencies
All Other agencies
90%
80%
70%
60%
50%
40%
30%
20%
10%
0%
1%1%5%
13%
80%
Per
cen
t of
Pub
lic S
ecto
r

MALAYSIA NATIONAL HEALTH ACCOUNTS19
TAB
LE 5
.3b
: To
tal H
ealt
h E
xpen
dit
ure
by
Pub
lic S
ecto
r S
our
ces
of
Fina
ncin
g, 1
997
- 20
09 (R
M M
illio
n)
MN
HA
co
de
So
urce
of
fina
ncin
g19
9719
9819
9920
0020
0120
0220
0320
0420
0520
0620
0720
0820
09
MS
1.1.
1.1
Min
istr
y of
Hea
lth (M
OH
)3,
707
4,03
3 4,
450
5,36
7 6,
251
6,67
0 9,
013
8,91
7 8,
060
10,8
38
11,2
43
13,0
36
14,7
13
MS
1.1.
1.2
Min
istr
y of
Hig
her
Edu
catio
n (M
OH
E)
525
517
612
706
890
1,01
8 1,
133
1,22
9 1,
301
1,43
0 1,
681
1,97
9 2,
328
MS
1.1.
1.3
Min
istr
y of
Def
ence
(MO
D)
15
7 10
12
22
36
20
24
25
26
58
10
8 57
MS
1.1.
1.9
Oth
er fe
dera
l age
ncie
s (in
clud
ing
stat
utor
y bo
dies
)20
1 21
6 23
5 26
2 34
8 40
2 47
9 68
5 60
6 65
7 80
8 1,
059
929
MS
1.1.
2.1
(Gen
eral
) Sta
te G
over
nmen
t32
36
31
33
37
41
44
50
57
65
81
85
84
MS
1.1.
2.2
Oth
er s
tate
age
ncie
s (in
clud
ing
stat
utor
y bo
dies
)5
5 10
9
10
11
11
13
15
15
16
17
26
MS
1.1.
3Lo
cal A
utho
ritie
s36
37
40
46
50
65
75
77
82
89
10
2 11
5 13
1
MS
1.2.
1E
mpl
oyee
Pro
vide
nt F
unds
(EP
F)7
15
20
24
32
36
43
56
61
46
52
49
40
MS
1.2.
2S
ocia
l Sec
urity
Org
aniz
atio
n (S
OC
SO
)12
13
15
20
28
30
39
39
20
48
57
76
93
Tota
l4,
540
4,87
9 5,
424
6,47
9 7,
669
8,31
0 10
,856
11
,092
10
,227
13
,216
14
,098
16
,524
18
,401

20HEALTH EXPENDITURE REPORT Revised Time Series (1997-2008) & Health Expenditure Report (2009)
TAB
LE 5
.3c
: To
tal H
ealt
h E
xpen
dit
ure
by
Pub
lic S
ecto
r S
our
ces
of
Fina
ncin
g, 1
997
- 20
09 (P
er c
ent,
%)
MN
HA
co
de
So
urce
of
fina
ncin
g19
9719
9819
9920
0020
0120
0220
0320
0420
0520
0620
0720
0820
09
MS
1.1.
1.1
Min
istr
y of
Hea
lth (M
OH
)81
.65
82.6
6 82
.05
82.8
3 81
.50
80.2
6 83
.02
80.4
0 78
.81
82.0
1 79
.75
78.8
9 79
.96
MS
1.1.
1.2
Min
istr
y of
Hig
her
Edu
catio
n (M
OH
E)
11.5
7 10
.60
11.2
8 10
.90
11.6
1 12
.25
10.4
4 11
.08
12.7
2 10
.82
11.9
3 11
.98
12.6
5
MS
1.1.
1.3
Min
istr
y of
Def
ence
(MO
D)
0.34
0.
15
0.18
0.
19
0.29
0.
44
0.18
0.
22
0.25
0.
20
0.41
0.
65
0.31
MS
1.1.
1.9
Oth
er fe
dera
l age
ncie
s (in
clud
ing
stat
utor
y bo
dies
)4.
44
4.42
4.
33
4.05
4.
54
4.84
4.
41
6.18
5.
92
4.97
5.
73
6.41
5.
05
MS
1.1.
2.1
(Gen
eral
) Sta
te G
over
nmen
t0.
70
0.73
0.
58
0.50
0.
48
0.49
0.
40
0.45
0.
56
0.49
0.
57
0.51
0.
45
MS
1.1.
2.2
Oth
er s
tate
age
ncie
s (in
clud
ing
stat
utor
y bo
dies
)0.
10
0.11
0.
18
0.14
0.
14
0.14
0.
10
0.12
0.
14
0.12
0.
12
0.10
0.
14
MS
1.1.
3Lo
cal A
utho
ritie
s0.
79
0.76
0.
74
0.71
0.
65
0.79
0.
69
0.70
0.
80
0.68
0.
72
0.70
0.
71
MS
1.2.
1E
mpl
oyee
Pro
vide
nt F
unds
(EP
F)0.
15
0.31
0.
37
0.36
0.
42
0.44
0.
39
0.51
0.
60
0.35
0.
37
0.30
0.
22
MS
1.2.
2S
ocia
l Sec
urity
Org
aniz
atio
n (S
OC
SO
)0.
27
0.26
0.
28
0.31
0.
37
0.36
0.
36
0.35
0.
20
0.37
0.
40
0.46
0.
51
Tota
l10
0.00
10
0.00
10
0.00
10
0.00
10
0.00
10
0.00
10
0.00
10
0.00
10
0.00
10
0.00
10
0.00
10
0.00
10
0.00

MALAYSIA NATIONAL HEALTH ACCOUNTS21
Public Sector Sources by Providers Cross-tabulations
Cross-tabulations of public sector sources of funding and providers of health care services and products respond to the question as to where this public source of fund is spent or who provides the services and products with the money.
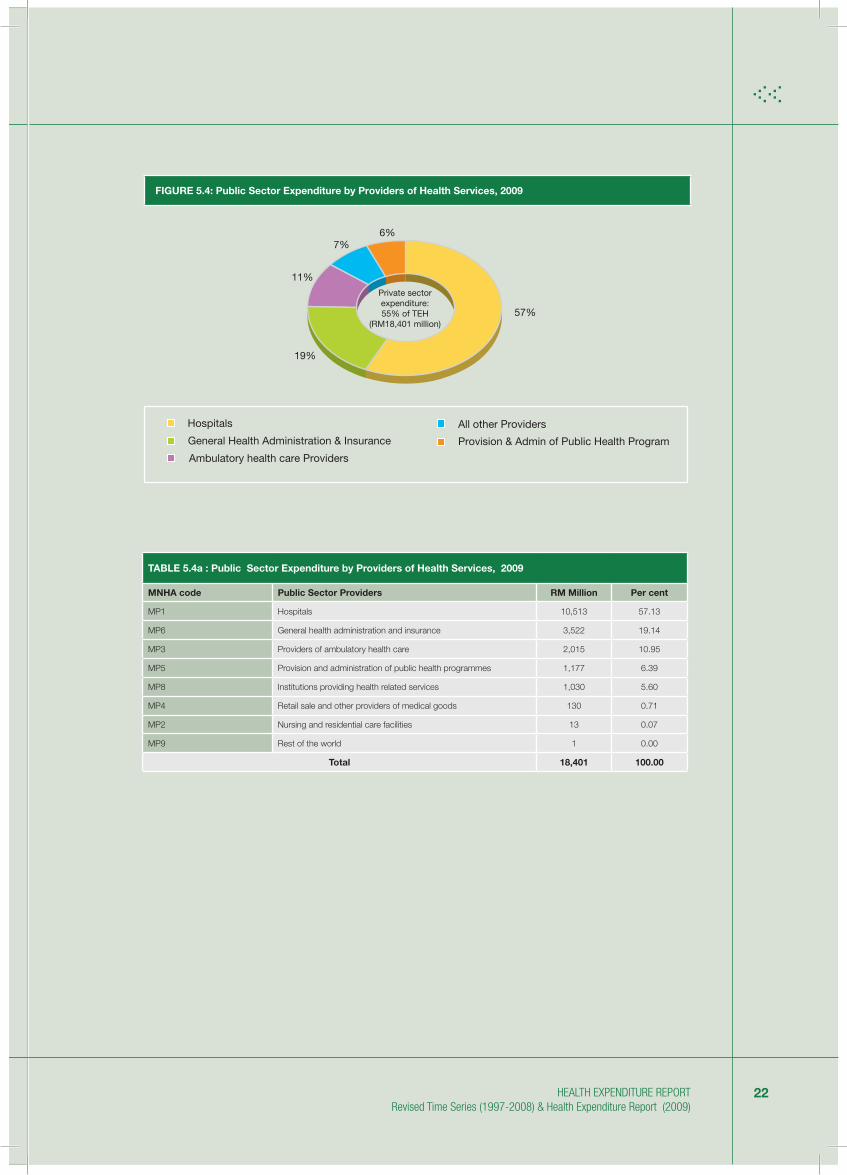
In 2009, hospitals consumed RM10,513 million or 57 per cent, followed by general health administration and insurance at RM3,522 million or 19 per cent, providers of ambulatory care at RM2,015 million or 11 per cent, provision and administration of public health programmes at RM1,177 million or 6 per cent and the remaining providers at RM1,175 million or 6 per cent (Figure 5.4 and Table 5.4a).
The 1997 to 2009 time series data shows a similar pattern in the share of the various providers in the public sector with all providers showing a steady rise over the time period (Table 5.4b and Table5.4c). However, over the last five years (2005-2009) the rate of increase in the expenditure at hospitals, providers of general health administration and insurance, and the providers of ambulatory care were much higher when compared to other providers. Also the rate of increase in expenditure of these 3 providers individually was higher in the last five years compared to their respective increase over the previous years. Over the time period although the expenditure for provision and administration of public health programmes in the public sector shows an increase in nominal amounts, the share of this expenditure compared to all other providers has been on a downward trend decreasing from 9.7 per cent in 1997 to 6.4 per cent in 2009.
22HEALTH EXPENDITURE REPORT Revised Time Series (1997-2008) & Health Expenditure Report (2009)
FIGURE 5.4: Public Sector Expenditure by Providers of Health Services, 2009
Hospitals
Ambulatory health care Providers
All other Providers
Provision & Admin of Public Health ProgramGeneral Health Administration & Insurance
57%
6%7%
11%
19%
Private sectorexpenditure:55% of TEH
(RM18,401 million)
TABLE 5.4a : Public Sector Expenditure by Providers of Health Services, 2009
MNHA code Public Sector Providers RM Million Per cent
MP1 Hospitals 10,513 57.13
MP6 General health administration and insurance 3,522 19.14
MP3 Providers of ambulatory health care 2,015 10.95
MP5 Provision and administration of public health programmes 1,177 6.39
MP8 Institutions providing health related services 1,030 5.60
MP4 Retail sale and other providers of medical goods 130 0.71
MP2 Nursing and residential care facilities 13 0.07
MP9 Rest of the world 1 0.00
Total 18,401 100.00

MALAYSIA NATIONAL HEALTH ACCOUNTS23
TAB
LE 5
.4b
: P
ublic
Sec
tor
Exp
end
itur
e b
y P
rovi
der
of
Hea
lth
Ser
vice
s, 1
997
- 20
09 (R
M M
illio
n)
MN
HA
co
de
Pub
lic S
ecto
r P
rovi
der
s19
9719
9819
9920
0020
0120
0220
0320
0420
0520
0620
0720
0820
09
MP
1H
ospi
tals
2,86
7 2,
974
3,27
6 3,
662
4,27
8 4,
552
5,36
8 5,
938
6,16
6 7,
944
8,58
4 9,
969
10,5
13
MP
2N
ursi
ng a
nd re
side
ntia
l car
e fa
cilit
ies
5 5
6 6
7 8
8 9
9 10
11
12
13
MP
3P
rovi
ders
of a
mbu
lato
ry h
ealth
car
e32
1 33
3 38
6 45
9 57
3 68
4 93
3 1,
057
1,11
1 1,
544
1,58
9 1,
902
2,01
5
MP
4R
etai
l sal
e an
d ot
her
prov
ider
s of
med
ical
goo
ds26
26
30
31
47
53
52
58
60
67
98
12
4 13
0
MP
5P
rovi
sion
and
adm
inis
trat
ion
of p
ublic
hea
lth p
rogr
amm
es44
1 42
0 45
5 49
6 59
1 70
1 66
8 67
7 66
7 84
8 89
5 99
9 1,
177
MP
6G
ener
al h
ealth
adm
inis
trat
ion
and
insu
ranc
e71
9 94
8 1,
056
1,57
5 1,
821
1,88
9 3,
319
2,80
3 1,
682
2,11
9 2,
144
2,49
8 3,
522
MP
7O
ther
indu
strie
s (re
st o
f the
Mal
aysi
an e
cono
my)
0 0
0 0
0 0
0 0
0 0
0 0
0
MP
8In
stitu
tions
pro
vidi
ng h
ealth
rela
ted
serv
ices
161
173
215
249
352
422
509
548
531
681
778
1,02
0 1,
030
MP
9R
est o
f the
wor
ld0
0 0
0 0
0 0
1 0
1 1
1 1
Tota
l4,
540
4,87
9 5,
424
6,47
9 7,
669
8,31
0 10
,856
11
,092
10
,227
13
,216
14
,098
16
,524
18
,401

24HEALTH EXPENDITURE REPORT Revised Time Series (1997-2008) & Health Expenditure Report (2009)
TAB
LE 5
.4c
:Pub
lic S
ecto
r E
xpen
dit
ure
by
Pro
vid
er o
f H
ealt
h S
ervi
ces,
199
7 -
2009
(Per
cen
t, %
)
MN
HA
co
de
Pub
lic S
ecto
r P
rovi
der
s19
9719
9819
9920
0020
0120
0220
0320
0420
0520
0620
0720
0820
09
MP
1H
ospi
tals
63.1
460
.95
60.3
956
.53
55.7
954
.78
49.4
453
.54
60.3
060
.11
60.8
860
.33
57.1
3
MP
2N
ursi
ng a
nd re
side
ntia
l car
e fa
cilit
ies
0.11
0.11
0.11
0.10
0.09
0.09
0.07
0.08
0.09
0.08
0.08
0.07
0.07
MP
3P
rovi
ders
of a
mbu
lato
ry h
ealth
car
e7.
076.
837.
127.
097.
478.
248.
599.
5310
.86
11.6
911
.27
11.5
110
.95
MP
4R
etai
l sal
e an
d ot
her
prov
ider
s of
med
ical
goo
ds0.
580.
530.
560.
480.
610.
640.
480.
530.
590.
510.
690.
750.
71
MP
5P
rovi
sion
and
adm
inis
trat
ion
of p
ublic
hea
lth p
rogr
amm
es9.
728.
608.
387.
667.
708.
446.
156.
106.
526.
426.
346.
046.
39
MP
6G
ener
al h
ealth
adm
inis
trat
ion
and
insu
ranc
e15
.84
19.4
319
.48
24.3
023
.75
22.7
330
.57
25.2
716
.45
16.0
415
.21
15.1
219
.14
MP
7O
ther
indu
strie
s (re
st o
f the
Mal
aysi
an e
cono
my)
0.00
0.00
0.00
0.00
0.00
0.00
0.00
0.00
0.00
0.00
0.00
0.00
0.00
MP
8In
stitu
tions
pro
vidi
ng h
ealth
rela
ted
serv
ices
3.54
3.54
3.95
3.85
4.59
5.08
4.69
4.94
5.19
5.16
5.52
6.17
5.60
MP
9R
est o
f the
wor
ld0.
000.
000.
000.
000.
000.
010.
000.
010.
000.
010.
000.
010.
00
Tota
l10
0.00
100.
0010
0.00
100.
0010
0.00
100.
0010
0.00
100.
0010
0.00
100.
0010
0.00
100.
0010
0.00

MALAYSIA NATIONAL HEALTH ACCOUNTS25
Public Sector Sources by Functions Cross-tabulations
Cross-tabulations of public sector sources of funding and functions of health care services and products respond to the question as to what is purchased or the type of services and products consumed with this source of financing.
In 2009, the public sector source of funds was spent the most for curative care consuming RM10,069 million or 55 per cent, followed by capital formation consuming RM2,754 million or 15 per cent and RM2,379 million or 13 per cent for health program administration and insurance. In the same year, RM1,577 million or under 9 per cent of this sector expenditure was spent for prevention and provision of public health services. The expenditure for all other functions of health care services and products was less than RM1,000 million each (Figure 5.5 and Table 5.5a).
The time series data shows a similar pattern with curative care, capital formation, and health administration and insurance occupying the three largest share of the public sector expenditure by function. However, the highest growth in the expenditure using public sector funding was in ancillary services to health care increasing from RM7 million in 1997 to RM250 million in 2009 but which remained to occupy less than 1 per cent share of the public sector spending. The expenditure for medical goods dispensed to out-patient and for research and development increased by nearly ten folds over the time period, but continued to occupy less than 5 per cent share of the public sector spending (Table 5.5b and Table 5.5c).

26HEALTH EXPENDITURE REPORT Revised Time Series (1997-2008) & Health Expenditure Report (2009)
FIGURE 5.5: Public Sector Expenditure by Functions of Health Services, 2009
Curative Care
Admin HQ & Health Insurance
Prevention & Public Health
All Other FunctionsCapital Formation
55%
13%
9%
8%
15%
Private sectorexpenditure:55% of TEH
(RM18,401 million)
TABLE 5.5a: Public Sector Expenditure by Function of Health Services, 2009
MNHA code Function of Health services RM Million Per cent
MF1 Services of curative care 10,069 54.72
MR1 Capital formation of health care provider institutions 2,754 14.97
MF7 Health program administration and health insurance 2,379 12.93
MF6 Prevention and public health services 1,577 8.57
MR2 Education and training of health personnel 884 4.81
MF5 Medical goods dispensed to out-patients 419 2.28
MF4 Ancillary services to health care 250 1.36
MR3 Research & Development in Health 46 0.25
MF3 Services of long-term nursing care 13 0.07
MF2 Services of rehabilitative care 9 0.05
Total 18,401 100.00

MALAYSIA NATIONAL HEALTH ACCOUNTS27
TAB
LE 5
.5b
: Pub
lic S
ecto
r E
xpen
dit
ure
by
Func
tio
n o
f H
ealt
h S
ervi
ces,
199
7 -
2009
(RM
Mill
ion)
MN
HA
co
de
Func
tio
n o
f H
ealt
h se
rvic
es19
9719
9819
9920
0020
0120
0220
0320
0420
0520
0620
0720
0820
09
MF1
Ser
vice
s of
cur
ativ
e ca
re2,
828
2,89
6 3,
169
3,54
6 4,
093
4,44
8 5,
075
5,63
7 5,
794
7,44
6 8,
044
9,45
9 10
,069
MF2
Ser
vice
s of
reha
bilit
ativ
e ca
re3
2 3
2 3
2 9
9 11
12
10
5
9
MF3
Ser
vice
s of
long
-ter
m n
ursi
ng c
are
5 5
6 6
7 8
8 9
9 10
11
12
13
MF4
Anc
illary
ser
vice
s to
hea
lth c
are
7 7
8 19
63
75
95
12
6 12
3 19
4 18
1 24
6 25
0
MF5
Med
ical
goo
ds d
ispe
nsed
to o
ut-p
atie
nts
44
52
69
77
134
158
175
214
204
214
360
417
419
MF6
Pre
vent
ion
and
publ
ic h
ealth
ser
vice
s30
3 30
5 34
1 40
4 41
3 43
7 78
4 84
2 91
9 1,
559
1,36
1 1,
522
1,57
7
MF7
Hea
lth p
rogr
am a
dmin
istr
atio
n an
d he
alth
insu
ranc
e67
2 66
0 70
8 82
2 93
1 1,
134
1,40
8 1,
441
1,42
2 1,
836
1,91
3 2,
224
2,37
9
MR
1C
apita
l for
mat
ion
of h
ealth
car
e pr
ovid
er in
stitu
tions
519
782
912
1,35
6 1,
677
1,63
3 2,
809
2,32
4 1,
263
1,35
6 1,
533
1,72
3 2,
754
MR
2E
duca
tion
and
trai
ning
of h
ealth
per
sonn
el99
11
6 16
1 20
8 27
4 33
9 41
8 43
1 46
1 55
4 63
4 77
2 88
4
MR
3R
esea
rch
& D
evel
opm
ent i
n H
ealth
61
53
48
38
74
77
74
61
21
34
50
145
46
Tota
l4,
540
4,87
9 5,
424
6,47
9 7,
669
8,31
0 10
,856
11
,092
10
,227
13
,216
14
,098
16
,524
18
,401

28HEALTH EXPENDITURE REPORT Revised Time Series (1997-2008) & Health Expenditure Report (2009)
TAB
LE 5
.5c:
Pub
lic S
ecto
r E
xpen
dit
ure
by
Func
tio
n o
f H
ealt
h S
ervi
ces,
199
7 -
2009
(Per
cen
t, %
)
MN
HA
co
de
Func
tio
n o
f H
ealt
h se
rvic
es19
9719
9819
9920
0020
0120
0220
0320
0420
0520
0620
0720
0820
09
MF1
Ser
vice
s of
cur
ativ
e ca
re62
.28
59.3
6 58
.43
54.7
2 53
.37
53.5
2 46
.75
50.8
2 56
.65
56.3
4 57
.05
57.2
4 54
.72
MF2
Ser
vice
s of
reha
bilit
ativ
e ca
re0.
06
0.04
0.
05
0.03
0.
04
0.03
0.
08
0.08
0.
10
0.09
0.
07
0.03
0.
05
MF3
Ser
vice
s of
long
-ter
m n
ursi
ng c
are
0.11
0.
11
0.11
0.
10
0.09
0.
09
0.07
0.
08
0.09
0.
08
0.08
0.
07
0.07
MF4
Anc
illary
ser
vice
s to
hea
lth c
are
0.15
0.
14
0.14
0.
30
0.82
0.
90
0.87
1.
13
1.20
1.
47
1.29
1.
49
1.36
MF5
Med
ical
goo
ds d
ispe
nsed
to o
ut-p
atie
nts
0.98
1.
07
1.27
1.
19
1.75
1.
91
1.61
1.
93
2.00
1.
62
2.56
2.
52
2.28
MF6
Pre
vent
ion
and
publ
ic h
ealth
ser
vice
s6.
67
6.25
6.
29
6.24
5.
39
5.25
7.
23
7.59
8.
99
11.8
0 9.
66
9.21
8.
57
MF7
Hea
lth p
rogr
am a
dmin
istr
atio
n an
d he
alth
insu
ranc
e14
.80
13.5
3 13
.04
12.6
9 12
.14
13.6
4 12
.97
12.9
9 13
.90
13.9
0 13
.57
13.4
6 12
.93
MR
1C
apita
l for
mat
ion
of h
ealth
car
e pr
ovid
er in
stitu
tions
11.4
4 16
.03
16.8
2 20
.93
21.8
6 19
.65
25.8
8 20
.95
12.3
5 10
.26
10.8
7 10
.43
14.9
7
MR
2E
duca
tion
and
trai
ning
of h
ealth
per
sonn
el2.
18
2.38
2.
97
3.22
3.
58
4.08
3.
85
3.88
4.
51
4.19
4.
50
4.67
4.
81
MR
3R
esea
rch
& D
evel
opm
ent i
n H
ealth
1.34
1.
09
0.88
0.
58
0.97
0.
93
0.68
0.
55
0.21
0.
26
0.36
0.
87
0.25
Tota
l10
0.00
10
0.00
10
0.00
10
0.00
10
0.00
10
0.00
10
0.00
10
0.00
10
0.00
10
0.00
10
0.00
10
0.00
10
0.00

MALAYSIA NATIONAL HEALTH ACCOUNTS29
Private Sector Sources of Financing
In 2009, analysis of the expenditure data shows that the highest source of financing in the private sector is household OOP spending amounting to RM11,986 million or 78 per cent of this sector expenditure (Figure 5.6 and Table 5.6a). The OOP spending excludes the purchases of individual health insurance. After OOP spending the next highest spending is by all private insurance agencies from personal, family or company insurance policies at RM1,968 million or 13 per cent of private sector spending. In the same year, corporations contributed to RM899 million or 6 per cent of private sector expenditure. This corporations expenditure is exclusive of group or company purchases of insurance which is reported under insurance agency expenditure. The other agencies under private sector which includes managed care organizations (MCO), non-profit organizations (NGO) serving households and rest of the world (ROW) or international agencies, in total contributed to RM437 million or below 3 per cent of the expenditure in this sector.
The private sector expenditure data for 1997-2009 time series shows that OOP expenditure throughout the time period remained the largest proportion and gradually increased from 73 to 79 per cent share of private spending (Table 5.6b and Table 5.6c). During this time period, private insurance enterprise expenditure also increased from 8 to 13 per cent share of private expenditure. However, corporation expenditure share of the private sector spending on health decreased from 14 to 6 per cent share of this sector.

30HEALTH EXPENDITURE REPORT Revised Time Series (1997-2008) & Health Expenditure Report (2009)
FIGURE 5.6: Total Health Expenditure by Private Sector Sources of Financing, 2009
Private Household
OOP
Private Insurance
NGOAll Corporations
All Other agencies
90%
80%
70%
60%
50%
40%
30%
20%
10%
0%
1%2%6%
13%
78%
Priv
ate
Sec
tor
Sou
rces
of F
inan
cing
TABLE 5.6a: Total Health Expenditure by Private Sector Sources of Financing, 2009
MNHA code Source of financing RM Million Per cent
MS2.4 Private household out-of-pocket expenditures 11,986 78.39
MS2.2 Private insurance enterprises (other than social insurance) 1,968 12.87
MS2.6 All Corporations (other than health insurance) 899 5.88
MS2.5 Non-profit organisations serving households 367 2.40
MS2.3 Private MCOs and other similar entities 66 0.43
MS9 Rest of the world 4 0.02
Total 15,291 100.00

MALAYSIA NATIONAL HEALTH ACCOUNTS31
TAB
LE 5
.6b
: To
tal H
ealt
h E
xpen
dit
ure
by
Pri
vate
Sec
tor
So
urce
s o
f Fi
nanc
ing
, 199
7 -
2009
(RM
Mill
ion)
MN
HA
co
de
So
urce
of
fina
ncin
g19
9719
9819
9920
0020
0120
0220
0320
0420
0520
0620
0720
0820
09
MS
2.2
Priv
ate
insu
ranc
e en
terp
rises
(oth
er th
an s
ocia
l ins
uran
ce)
295
365
421
516
599
718
964
1,12
4 1,
084
1,24
6 1,
413
1,70
9 1,
968
MS
2.3
Priv
ate
MC
Os
and
othe
r si
mila
r en
titie
s48
50
52
55
58
61
64
72
81
91
79
69
66
MS
2.4
Priv
ate
hous
ehol
d ou
t-of
-poc
ket e
xpen
ditu
res
2,57
6 2,
835
3,15
5 3,
864
4,05
6 4,
655
5,62
9 6,
719
7,66
7 8,
582
9,55
4 11
,050
11
,986
MS
2.5
Non
-pro
fit o
rgan
izat
ions
ser
ving
hou
seho
lds
(NG
O)
99
108
111
136
144
163
186
207
236
259
294
338
367
MS
2.6
All
Cor
pora
tions
(oth
er th
an h
ealth
insu
ranc
e)48
6 51
5 54
9 58
1 65
6 68
1 70
0 69
8 83
6 83
4 95
0 91
0 89
9
MS
9R
est o
f the
wor
ld (R
OW
)0
0 0
5 0
0 0
0 0
0 1
1 4
Tota
l3,
504
3,87
3 4,
288
5,15
6 5,
513
6,27
8 7,
543
8,82
0 9,
904
11,0
12
12,2
91
14,0
77
15,2
91
TAB
LE 5
.6c
: To
tal H
ealt
h E
xpen
dit
ure
by
Pri
vate
Sec
tor
So
urce
s o
f Fi
nanc
ing
, 199
7 -
2009
(Per
cen
t, %
)
MN
HA
co
de
So
urce
of
fina
ncin
g19
9719
9819
9920
0020
0120
0220
0320
0420
0520
0620
0720
0820
09
MS
2.2
Priv
ate
insu
ranc
e en
terp
rises
(oth
er th
an s
ocia
l ins
uran
ce)
8.40
9.
42
9.82
10
.00
10.8
6 11
.44
12.7
8 12
.75
10.9
5 11
.31
11.5
0 12
.14
12.8
7
MS
2.3
Priv
ate
MC
Os
and
othe
r si
mila
r en
titie
s1.
38
1.29
1.
22
1.07
1.
05
0.97
0.
84
0.81
0.
82
0.83
0.
64
0.49
0.
43
MS
2.4
Priv
ate
hous
ehol
d ou
t-of
-poc
ket e
xpen
ditu
res
73.5
0 73
.21
73.5
8 74
.94
73.5
8 74
.15
74.6
2 76
.18
77.4
1 77
.93
77.7
3 78
.50
78.3
9
MS
2.5
Non
-pro
fit o
rgan
izat
ions
ser
ving
hou
seho
lds
2.84
2.
79
2.58
2.
63
2.62
2.
60
2.47
2.
35
2.38
2.
35
2.39
2.
40
2.40
MS
2.6
All
Cor
pora
tions
(oth
er th
an h
ealth
insu
ranc
e)13
.88
13.2
9 12
.80
11.2
7 11
.89
10.8
4 9.
28
7.91
8.
44
7.57
7.
73
6.47
5.
88
MS
9R
est o
f the
wor
ld0.
00
0.00
0.
00
0.09
0.
00
0.00
0.
00
0.00
0.
00
0.00
0.
01
0.01
0.
02
Tota
l10
0.00
10
0.00
10
0.00
10
0.00
10
0.00
10
0.00
10
0.00
10
0.00
10
0.00
10
0.00
10
0.00
10
0.00
10
0.00

32HEALTH EXPENDITURE REPORT Revised Time Series (1997-2008) & Health Expenditure Report (2009)
Private Sector Sources by Providers Cross-tabulations
Just as in the public sector, the cross-tabulations of private sector sources of funding with providers of health care services & products, respond to the question as to where the private source of fund is spent or who provides the services & products with this money.
In 2009, hospitals consumed RM6,378 million or 42 per cent, followed by providers of ambulatory care at RM5,096 million or 33 per cent. The providers of retail sales & other providers of medical goods consumed RM2,251 million or 15 per cent whereas the providers of general administration and insurance consumed RM1,059 million or 7 per cent (Figure 5.7 and Table 5.7a). The remaining private source of funding amounting to a total of RM507 million or 3 per cent were spent at institutions providing health-related services, by providers & administrators of public health programmes, non-resident or ROW providers, and by providers of nursing & residential care facilities.
The 1997 to 2009 time series data shows that throughout this period, more than 70 per cent of the private source of financing has been at hospitals and providers of ambulatory care (Table 5.7b and Table 5.7c). Hospital expenditures increased from RM1,231 million in 1997 to RM6,378 million in 2009 whereas expenditures at ambulatory care providers increased from RM1,321 million in 1997 to RM5,096 million in 2009. The data also shows that although spending at institutions providing health-related services, which mainly comprises of the teaching & training institutions, has remained below 3 per cent of the spending, this expenditure at the expense of private source of funding has increased by nearly 8-fold from RM58 million in 1997 to RM459 million in 2009.

MALAYSIA NATIONAL HEALTH ACCOUNTS33
FIGURE 5.7: Private Sector Expenditure by Providers of Health Services, 2009
Hospitals
Retail sale & Medical goods Providers
General health admin & insurance
All Other ProvidersAmbulatory health care Providers
42%
15%
7%3%
33%
Private sectorexpenditure:45% of TEH
(RM15,291 million)
TABLE 5.7a: Private Sector Expenditure by Providers of Health Services, 2009
MNHA code Providers of Health Services RM Million Per cent
MP1 Hospitals 6,378 41.71
MP3 Providers of ambulatory health care 5,096 33.33
MP4 Retail sale and other providers of medical goods 2,251 14.72
MP6 General health administration and insurance 1,059 6.92
MP8 Institutions providing health related services 459 3.00
MP5 Provision and administration of public health programmes 22 0.14
MP9 Rest of the world (ROW) 15 0.10
MP2 Nursing and residential care facilities 11 0.07
Total 15,291 100.00
*Private sector- include MS9

34HEALTH EXPENDITURE REPORT Revised Time Series (1997-2008) & Health Expenditure Report (2009)
TAB
LE 5
.7b
: Pri
vate
Sec
tor
Exp
end
itur
e b
y P
rovi
der
s o
f H
ealt
h S
ervi
ces,
199
7 -
2009
(RM
Mill
ion)
*
MN
HA
co
de
Pro
vid
ers
of
Hel
ath
Ser
vice
s19
9719
9819
9920
0020
0120
0220
0320
0420
0520
0620
0720
0820
09
MP
1H
ospi
tals
1,23
1 1,
404
1,59
9 1,
815
2,07
8 2,
401
2,94
4 3,
385
3,69
3 4,
241
4,80
6 5,
564
6,37
8
MP
2N
ursi
ng a
nd re
side
ntia
l car
e fa
cilit
ies
3 3
3 4
5 8
12
13
15
16
17
10
11
MP
3P
rovi
ders
of a
mbu
lato
ry h
ealth
car
e1,
321
1,41
3 1,
546
1,87
0 1,
974
2,21
1 2,
509
2,95
1 3,
552
3,87
8 4,
245
4,84
1 5,
096
MP
4R
etai
l sal
e an
d ot
her
prov
ider
s of
med
ical
goo
ds50
3 54
2 59
4 81
8 78
8 92
6 1,
130
1,43
4 1,
588
1,72
9 1,
972
2,22
7 2,
251
MP
5P
rovi
sion
and
adm
inis
trat
ion
of p
ublic
hea
lth p
rogr
amm
es8
8 10
11
12
13
15
16
21
22
26
35
22
MP
6G
ener
al h
ealth
adm
inis
trat
ion
and
insu
ranc
e37
9 42
8 45
2 53
4 54
7 58
8 76
9 83
7 82
5 88
1 91
7 1,
008
1,05
9
MP
8In
stitu
tions
pro
vidi
ng h
ealth
rela
ted
serv
ices
58
73
82
101
105
127
158
177
203
236
298
379
459
MP
9R
est o
f the
wor
ld1
2 2
3 4
5 6
7 7
8 10
13
15
Tota
l3,
504
3,87
3 4,
288
5,15
6 5,
513
6,27
8 7,
543
8,82
0 9,
904
11,0
12
12,2
91
14,0
77
15,2
91
*Priv
ate
sect
or-
incl
ude
MS
9

MALAYSIA NATIONAL HEALTH ACCOUNTS35
TAB
LE 5
.7c:
Pri
vate
Sec
tor
Exp
end
itur
e b
y P
rovi
der
s o
f H
ealt
h S
ervi
ces,
199
7 -
2009
(Per
cen
t, %
)*
MN
HA
co
de
Pro
vid
ers
of
Hea
lth
Ser
vice
s19
9719
9819
9920
0020
0120
0220
0320
0420
0520
0620
0720
0820
09
MP
1H
ospi
tals
35.1
4 36
.25
37.2
9 35
.20
37.7
0 38
.25
39.0
3 38
.38
37.2
9 38
.52
39.1
0 39
.53
41.7
1
MP
2N
ursi
ng a
nd re
side
ntia
l car
e fa
cilit
ies
0.07
0.
08
0.08
0.
09
0.08
0.
12
0.16
0.
15
0.15
0.
14
0.14
0.
07
0.07
MP
3P
rovi
ders
of a
mbu
lato
ry h
ealth
car
e37
.70
36.4
8 36
.07
36.2
6 35
.80
35.2
2 33
.27
33.4
5 35
.87
35.2
2 34
.54
34.3
9 33
.33
MP
4R
etai
l sal
e an
d ot
her
prov
ider
s of
med
ical
goo
ds14
.36
14.0
0 13
.84
15.8
7 14
.30
14.7
4 14
.99
16.2
6 16
.03
15.7
0 16
.04
15.8
2 14
.72
MP
5P
rovi
sion
and
adm
inis
trat
ion
of p
ublic
hea
lth p
rogr
amm
es0.
22
0.21
0.
23
0.21
0.
21
0.21
0.
20
0.18
0.
21
0.20
0.
21
0.25
0.
14
MP
6G
ener
al h
ealth
adm
inis
trat
ion
and
insu
ranc
e10
.81
11.0
4 10
.53
10.3
5 9.
93
9.36
10
.19
9.49
8.
33
8.00
7.
46
7.16
6.
92
MP
8In
stitu
tions
pro
vidi
ng h
ealth
rela
ted
serv
ices
1.66
1.
90
1.91
1.
96
1.91
2.
02
2.10
2.
01
2.05
2.
14
2.42
2.
69
3.00
MP
9R
est o
f the
wor
ld0.
04
0.04
0.
05
0.05
0.
07
0.07
0.
07
0.08
0.
07
0.08
0.
08
0.09
0.
10
Tota
l10
0.00
10
0.00
10
0.00
10
0.00
10
0.00
10
0.00
10
0.00
10
0.00
10
0.00
10
0.00
10
0.00
10
0.00
10
0.00
*Priv
ate
sect
or-
incl
ude
MS
9

36HEALTH EXPENDITURE REPORT Revised Time Series (1997-2008) & Health Expenditure Report (2009)
Private Sector Sources by Functions Cross-tabulations
Cross-tabulations of private sector sources of funding and functions of health care services and products respond to the question as to what is purchased or the type of services and products consumed with this source of financing.
In 2009, the public sector source of funds was spent the most for curative care consuming RM9,009 million or 59 per cent, followed by medical goods dispensed to out-patient at RM3,730 million or 24 per cent. In the same year, RM1,075 million or 7 per cent of this sector expenditure was spent for health program administration and health insurance (Figure 5.8 and Table 5.8a).
The time series data shows a similar pattern with expenditures for curative care and medical goods dispensed to out-patient totaling to 78 to 83 per cent of the sector spending (Table 5.8b and Table 5.8c). As noted in the earlier section, although education and training expenditure over this time period has remained below 3 percent share of this spending, it has increased by nearly 8-fold from RM55 million in 1997 to RM463 million in 2009.

MALAYSIA NATIONAL HEALTH ACCOUNTS37
FIGURE 5.8: Private Sector Expenditure By Functions of Health Services, 2009
Curative care
Health Program Admin & Health insurance
All Other functions
Ancillary ServicesMedical Goods
59%
7%
6% 4%
24%
Private sectorexpenditure:45% of TEH
(RM15,291 million)
TABLE 5.8a: Private Sector Expenditure by Function of Health Services, 2009
MNHA code Function of Health services RM Million Per cent
MF1 Services of curative care 9,009 58.92
MF5 Medical goods dispensed to out-patients 3,730 24.39
MF7 Health program administration and health insurance 1,075 7.03
MF4 Ancillary services to health care 618 4.04
MR2 Education and training of health personnel 463 3.03
MF6 Prevention and public health services 181 1.19
MF3 Services of long-term nursing care 133 0.87
MF2 Services of rehabilitative care 75 0.49
MR3 Research & Development in Health 3 0.02
MR1 Capital formation of health care provider institutions 3 0.02
Total 15,291 100.00

38HEALTH EXPENDITURE REPORT Revised Time Series (1997-2008) & Health Expenditure Report (2009)
TAB
LE 5
.8b
: Pri
vate
Sec
tor
Exp
end
itur
e b
y Fu
ncti
on
of
Hea
lth
Ser
vice
s, 1
997
- 20
09 (R
M M
illio
n)
MN
HA
co
de
Func
tio
n o
f H
ealt
h se
rvic
es19
9719
9819
9920
0020
0120
0220
0320
0420
0520
0620
0720
0820
09
MF1
Ser
vice
s of
cur
ativ
e ca
re1,
764
1,98
8 2,
249
2,60
2 2,
912
3,33
8 3,
974
4,67
9 5,
369
6,06
8 6,
765
7,86
6 9,
009
MF2
Ser
vice
s of
reha
bilit
ativ
e ca
re15
17
20
22
25
28
36
39
45
52
61
62
75
MF3
Ser
vice
s of
long
-ter
m n
ursi
ng c
are
27
31
35
40
45
53
67
103
89
101
111
115
133
MF4
Anc
illary
ser
vice
s to
hea
lth c
are
179
192
209
254
282
317
370
411
495
526
587
635
618
MF5
Med
ical
goo
ds d
ispe
nsed
to o
ut-p
atie
nts
985
1,04
0 1,
129
1,48
3 1,
463
1,68
5 2,
019
2,42
0 2,
694
2,96
0 3,
340
3,79
0 3,
730
MF6
Pre
vent
ion
and
publ
ic h
ealth
ser
vice
s94
99
10
7 11
4 12
8 13
5 14
2 14
5 17
5 17
8 20
0 20
9 18
1
MF7
Hea
lth p
rogr
am a
dmin
istr
atio
n an
d he
alth
insu
ranc
e38
5 43
4 45
9 54
1 55
2 59
5 77
7 84
7 83
4 89
2 92
9 1,
021
1,07
5
MR
1C
apita
l for
mat
ion
of h
ealth
car
e pr
ovid
er in
stitu
tions
1 1
1 1
1 1
1 1
2 2
2 2
3
MR
2E
duca
tion
and
trai
ning
of h
ealth
per
sonn
el55
70
78
93
10
5 12
5 15
5 17
3 20
0 23
2 29
5 37
6 46
3
MR
3R
esea
rch
& D
evel
opm
ent i
n H
ealth
0 0
0 5
1 1
1 1
1 1
1 1
3
Tota
l3,
504
3,87
3 4,
288
5,15
6 5,
513
6,27
8 7,
543
8,82
0 9,
904
11,0
12
12,2
91
14,0
77
15,2
91

MALAYSIA NATIONAL HEALTH ACCOUNTS39
TAB
LE 5
.8c:
Pri
vate
Sec
tor
Exp
end
itur
e b
y Fu
ncti
ons
of
Hea
lth
Ser
vice
s, 1
997
- 20
09 (P
er c
ent,
%)
MN
HA
co
de
Func
tio
n o
f H
ealt
h se
rvic
es19
9719
9819
9920
0020
0120
0220
0320
0420
0520
0620
0720
0820
09
MF1
Ser
vice
s of
cur
ativ
e ca
re50
.33
51.3
3 52
.45
50.4
7 52
.83
53.1
7 52
.69
53.0
5 54
.20
55.1
0 55
.04
55.8
8 58
.92
MF2
Ser
vice
s of
reha
bilit
ativ
e ca
re0.
43
0.45
0.
46
0.43
0.
45
0.45
0.
48
0.44
0.
46
0.48
0.
50
0.44
0.
49
MF3
Ser
vice
s of
long
-ter
m n
ursi
ng c
are
0.77
0.
80
0.82
0.
79
0.81
0.
85
0.88
1.
17
0.90
0.
92
0.90
0.
82
0.87
MF4
Anc
illary
ser
vice
s to
hea
lth c
are
5.10
4.
97
4.88
4.
92
5.11
5.
05
4.91
4.
66
5.00
4.
77
4.78
4.
51
4.04
MF5
Med
ical
goo
ds d
ispe
nsed
to o
ut-p
atie
nts
28.1
1 26
.85
26.3
4 28
.76
26.5
3 26
.85
26.7
7 27
.44
27.2
0 26
.88
27.1
7 26
.93
24.3
9
MF6
Pre
vent
ion
and
publ
ic h
ealth
ser
vice
s2.
68
2.57
2.
50
2.22
2.
32
2.14
1.
88
1.65
1.
77
1.62
1.
62
1.48
1.
19
MF7
Hea
lth p
rogr
am a
dmin
istr
atio
n an
d he
alth
insu
ranc
e10
.98
11.2
1 10
.70
10.4
9 10
.02
9.48
10
.30
9.60
8.
42
8.10
7.
56
7.25
7.
03
MR
1C
apita
l for
mat
ion
of h
ealth
car
e pr
ovid
er in
stitu
tions
0.02
0.
02
0.02
0.
02
0.02
0.
02
0.02
0.
02
0.02
0.
02
0.02
0.
02
0.02
MR
2E
duca
tion
and
trai
ning
of h
ealth
per
sonn
el1.
57
1.81
1.
83
1.80
1.
90
1.98
2.
05
1.96
2.
02
2.11
2.
40
2.67
3.
03
MR
3R
esea
rch
& D
evel
opm
ent i
n H
ealth
0.01
0.
01
0.01
0.
10
0.01
0.
01
0.01
0.
01
0.01
0.
01
0.01
0.
01
0.02
Tota
l10
0.00
10
0.00
10
0.00
10
0.00
10
0.00
10
0.00
10
0.00
10
0.00
10
0.00
10
0.00
10
0.00
10
0.00
10
0.00

40HEALTH EXPENDITURE REPORT Revised Time Series (1997-2008) & Health Expenditure Report (2009)
OOP by Providers Cross-tabulations
In 2009, OOP expenditure by the top three providers of health services and products show a similar pattern to the total private sector expenditures by providers (refer Figure 5.7). In the same year, RM4,989 million or 42 per cent of OOP was spent at hospitals followed by RM4,446 million or 37 per cent at providers of ambulatory health care and RM2,194 million or 18 per cent at providers of retail sale and other providers of medical goods (Figure 5.9 and Table 5.9a).
The 1997-2009 time series data shows a similar pattern with expenditures at hospitals, providers of ambulatory care and providers of retail sale and other medical goods with each increasing progressively by more than 4-folds in absolute ringgit value over the time period (Table 5.9b and Table 5.9c). However, the individual share of the private expenditure of these three providers remained the same throughout the time period. Similarly OOP expenditure at institutions providing health related services increased by nearly 9-fold from RM40 million in 1997 to RM357 million in 2009.

MALAYSIA NATIONAL HEALTH ACCOUNTS41
FIGURE 5.9: Private Household OOP Expenditure By Providers of Health Services, 2009
Hospitals Retail sale & Other Medical Goods Providers
Institutions providing health related servicesAmbulatory Care Providers
42%
18%
3%
37%
OOP : 78%of Private Sector
Expenditure(RM11,986 million)
TABLE 5.9a: Private Household Out-of-Pocket Expenditure by Provider of Health Services, 2009
MNHA code Provider of Health services RM Million Per cent
MP1 Hospitals 4,989 41.62
MP3 Providers of ambulatory health care 4,446 37.10
MP4 Retail sale and other providers of medical goods 2,194 18.30
MP8 Institutions providing health related services 357 2.98
Total 11,986 100.00

42HEALTH EXPENDITURE REPORT Revised Time Series (1997-2008) & Health Expenditure Report (2009)
TAB
LE 5
.9b
: Pri
vate
Ho
useh
old
Out
-of-
Po
cket
Exp
end
itur
e b
y P
rovi
der
of
Hea
lth
Ser
vice
s, 1
997
- 20
09 (R
M M
illio
n)
MN
HA
co
de
Pro
vid
er o
f H
ealt
h se
rvic
es19
9719
9819
9920
0020
0120
0220
0320
0420
0520
0620
0720
0820
09
MP
1H
ospi
tals
1,08
6 1,
227
1,38
1 1,
555
1,72
4 1,
955
2,42
2 2,
754
3,03
1 3,
452
3,85
6 4,
404
4,98
9
MP
3P
rovi
ders
of a
mbu
lato
ry h
ealth
car
e96
3 1,
036
1,14
7 1,
448
1,49
7 1,
715
1,99
6 2,
438
2,94
2 3,
268
3,56
0 4,
180
4,44
6
MP
4R
etai
l sal
e an
d ot
her
prov
ider
s of
med
ical
goo
ds48
7 52
1 56
8 79
2 75
7 89
2 1,
093
1,39
5 1,
540
1,68
1 1,
909
2,17
1 2,
194
MP
8In
stitu
tions
pro
vidi
ng h
ealth
rela
ted
serv
ices
40
52
58
69
78
94
118
132
154
180
229
294
357
Tota
l2,
576
2,83
5 3,
155
3,86
4 4,
056
4,65
5 5,
629
6,71
9 7,
667
8,58
2 9,
554
11,0
50
11,9
86
TAB
LE 5
.9c:
Pri
vate
Ho
useh
old
Out
-of-
Po
cket
Exp
end
itur
e b
y P
rovi
der
of
Hea
lth
Ser
vice
s, 1
997
- 20
09 (P
er c
ent,
%)
MN
HA
co
de
Pro
vid
er o
f H
ealt
h se
rvic
es19
9719
9819
9920
0020
0120
0220
0320
0420
0520
0620
0720
0820
09
MP
1H
ospi
tals
42.1
6 43
.27
43.7
9 40
.25
42.5
0 41
.99
43.0
2 40
.98
39.5
3 40
.23
40.3
6 39
.86
41.6
2
MP
3P
rovi
ders
of a
mbu
lato
ry h
ealth
car
e37
.37
36.5
4 36
.36
37.4
7 36
.92
36.8
3 35
.46
36.2
9 38
.38
38.0
8 37
.26
37.8
3 37
.10
MP
4R
etai
l sal
e an
d ot
her
prov
ider
s of
med
ical
goo
ds18
.92
18.3
7 18
.01
20.4
9 18
.65
19.1
7 19
.41
20.7
6 20
.09
19.5
9 19
.98
19.6
5 18
.30
MP
8In
stitu
tions
pro
vidi
ng h
ealth
rela
ted
serv
ices
1.55
1.
82
1.84
1.
79
1.93
2.
01
2.10
1.
97
2.01
2.
09
2.39
2.
66
2.98
Tota
l10
0.00
10
0.00
10
0.00
10
0.00
10
0.00
10
0.00
10
0.00
10
0.00
10
0.00
10
0.00
10
0.00
10
0.00
10
0.00

MALAYSIA NATIONAL HEALTH ACCOUNTS43
Total Health Expenditure by Providers of Health Services
The providers of health care services & products include hospitals, nursing and residential care facility providers, ambulatory care providers, retail sale and medical goods providers and public health programme providers (Appendix Table A2.1b).
In 2009 analysis of providers of health services shows that the hospitals consumed RM16,891 million or 50 per cent of total health expenditure (Figure 6.1 and Table 6.1a). This was followed by providers of ambulatory health care at RM7,111 million or 21 per cent and general health administration at RM2,381 million or 7 per cent. All other remaining providers of health care services and products consumed RM2,728 million or 8 per cent of the total health expenditure.
The 1997 to 2009 time series data also shows a similar pattern with the same top four providers as in 2009 contributing to an average of 92 per cent share of total health expenditure per year (Table 6.1b and Table 6.1c). The expenditures of the same top four providers increased in absolute ringgit value of about 4-fold over the same time period.
CHAPTER 6
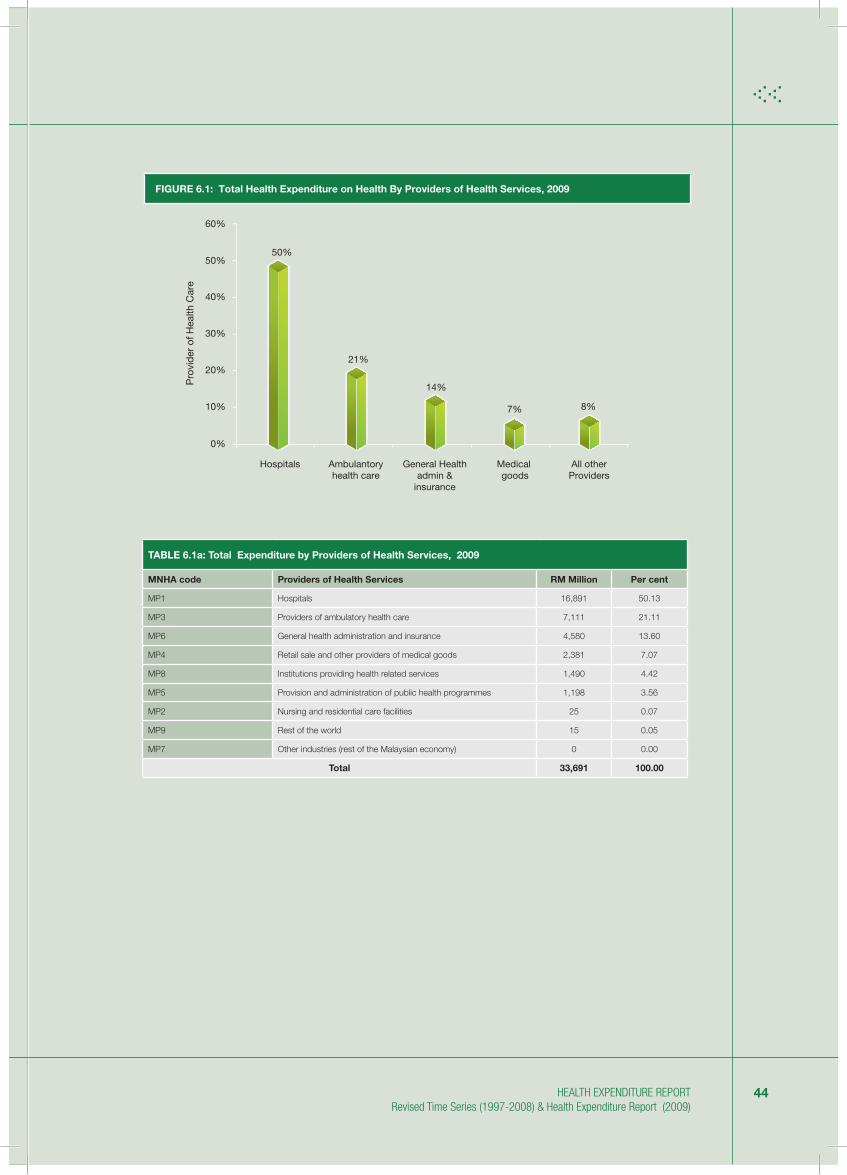
44HEALTH EXPENDITURE REPORT Revised Time Series (1997-2008) & Health Expenditure Report (2009)
FIGURE 6.1: Total Health Expenditure on Health By Providers of Health Services, 2009
Hospitals Medical goods
All otherProviders
Ambulantoryhealth care
General Healthadmin &
insurance
60%
50%
40%
30%
20%
10%
0%
50%
21%
14%
7% 8%
Pro
vid
er o
f Hea
lth C
are
TABLE 6.1a: Total Expenditure by Providers of Health Services, 2009
MNHA code Providers of Health Services RM Million Per cent
MP1 Hospitals 16,891 50.13
MP3 Providers of ambulatory health care 7,111 21.11
MP6 General health administration and insurance 4,580 13.60
MP4 Retail sale and other providers of medical goods 2,381 7.07
MP8 Institutions providing health related services 1,490 4.42
MP5 Provision and administration of public health programmes 1,198 3.56
MP2 Nursing and residential care facilities 25 0.07
MP9 Rest of the world 15 0.05
MP7 Other industries (rest of the Malaysian economy) 0 0.00
Total 33,691 100.00

MALAYSIA NATIONAL HEALTH ACCOUNTS45
TAB
LE 6
.1b
: To
tal
Exp
end
itur
e b
y P
rovi
der
s o
f H
ealt
h S
ervi
ces,
199
7 -
2009
(RM
Mill
ion)
MN
HA
co
de
Pro
vid
ers
of
Hea
lth
Ser
vice
s19
9719
9819
9920
0020
0120
0220
0320
0420
0520
0620
0720
0820
09
MP
1H
ospi
tals
4
,098
4,8
74
4
,874
5,4
77
6
,357
6,9
53
8
,311
9,3
24
9
,860
1
2,18
5 1
3,39
0 1
5,53
3 1
6,89
1
MP
2N
ursi
ng a
nd re
side
ntia
l car
e fa
cilit
ies
8
9
9
11
11
15
20
22
24
26
28
22
25
MP
3P
rovi
ders
of a
mbu
lato
ry h
ealth
car
e
1,6
42
1
,932
1,9
32
2
,329
2,5
46
2
,896
3,4
42
4
,008
4,6
63
5
,423
5,8
34
6
,743
7,1
11
MP
4R
etai
l sal
e an
d ot
her
prov
ider
s of
med
ical
goo
ds
5
29
624
6
24
849
8
35
979
1,1
82
1
,493
1,6
48
1
,796
2,0
69
2
,351
2,3
81
MP
5P
rovi
sion
and
adm
inis
trat
ion
of p
ublic
hea
lth p
rogr
amm
es
4
49
465
4
65
507
6
03
715
6
83
692
6
88
870
9
20
1
,034
1,1
98
MP
6G
ener
al h
ealth
adm
inis
trat
ion
and
insu
ranc
e
1,0
98
1
,508
1,5
08
2
,108
2,3
69
2
,477
4,0
88
3
,640
2,5
06
3
,001
3,0
61
3
,507
4,5
80
MP
7O
ther
indu
strie
s (re
st o
f the
Mal
aysi
an e
cono
my)
0
0
0
0
0
0
0
0
0
0
0
0
0
MP
8In
stitu
tions
pro
vidi
ng h
ealth
rela
ted
serv
ices
219
2
97
297
3
50
458
5
49
667
7
26
734
9
17
1
,076
1,3
98
1
,490
MP
9R
est o
f the
wor
ld
2
2
2
3
4
5
6
8
7
9
11
13
15
Tota
l8,
045
9,71
19,
711
11,6
3513
,182
14,5
8818
,399
19,9
1220
,131
24,2
2726
,389
30,6
0133
,691

46HEALTH EXPENDITURE REPORT Revised Time Series (1997-2008) & Health Expenditure Report (2009)
TAB
LE 6
.1c:
To
tal
Exp
end
itur
e b
y P
rovi
der
s o
f H
ealt
h S
ervi
ces,
199
7 -
2009
(Per
cen
t, %
)
MN
HA
co
de
Pro
vid
ers
of
Hea
lth
Ser
vice
s19
9719
9819
9920
0020
0120
0220
0320
0420
0520
0620
0720
0820
09
MP
1H
ospi
tals
5
0.94
50.
19
5
0.19
47.
08
4
8.22
47.
66
4
5.17
46.
82
4
8.98
50.
30
5
0.74
50.
76
5
0.13
MP
2N
ursi
ng a
nd re
side
ntia
l car
e fa
cilit
ies
0.09
0.
10
0.10
0.
09
0.09
0.
10
0.11
0.
11
0.12
0.
11
0.11
0.
07
0.07
MP
3P
rovi
ders
of a
mbu
lato
ry h
ealth
car
e
20.
41
1
9.90
19.
90
2
0.02
19.
32
1
9.85
18.
71
2
0.13
23.
17
2
2.38
22.
11
2
2.03
21.
11
MP
4R
etai
l sal
e an
d ot
her
prov
ider
s of
med
ical
goo
ds
6.
58
6.43
6.
43
7.30
6.
33
6.71
6.
42
7.50
8.
19
7.41
7.
84
7.68
7.
07
MP
5P
rovi
sion
and
adm
inis
trat
ion
of p
ublic
hea
lth p
rogr
amm
es
5.
58
4.78
4.
78
4.36
4.
57
4.90
3.
71
3.48
3.
42
3.59
3.
49
3.38
3.
56
MP
6G
ener
al h
ealth
adm
inis
trat
ion
and
insu
ranc
e
13.
65
1
5.53
15.
53
1
8.12
17.
97
1
6.98
22.
22
1
8.28
12.
45
1
2.38
11.
60
1
1.46
13.
60
MP
7O
ther
indu
strie
s (re
st o
f the
Mal
aysi
an e
cono
my)
0.00
0.
00
0.00
0.
00
0.00
0.
00
0.00
0.
00
0.00
0.
00
0.00
0.
00
0.00
MP
8In
stitu
tions
pro
vidi
ng h
ealth
rela
ted
serv
ices
2.72
3.
05
3.05
3.
01
3.47
3.
76
3.62
3.
64
3.65
3.
79
4.08
4.
57
4.42
MP
9R
est o
f the
wor
ld
0.
02
0.02
0.
02
0.02
0.
03
0.04
0.
03
0.04
0.
04
0.04
0.
04
0.04
0.
05
Tota
l10
0.00
100.
0010
0.00
100.
0010
0.00
100.
0010
0.00
100.
0010
0.00
100.
0010
0.00
100.
0010
0.00

MALAYSIA NATIONAL HEALTH ACCOUNTS47
Hospital by Sources of Financing Cross-tabulations
Further cross-tabulations of the two largest providers, hospitals and providers of ambulatory care services are noted further. The cross-tabulations of hospitals and sources of financing responds to the question as to who or which agencies finances health care services provided at all hospitals in the country.
In 2009 the highest spending for hospital services was incurred by the MOH at RM7,903 million or 47 per cent followed by private household OOP at RM4,989 million or 30 per cent, Ministry of Higher Education (MOHE) at RM1,774 million or 11 per cent and private insurance enterprises at RM1,220 million or 7 per cent (Figure 6.2 and Table 6.2a). The remaining hospital expenditure at RM 1,005 million or 6 per cent came from multiple other sources of financing each spending below RM1,000 million.
The 1997 to 2009 time series data also shows a similar pattern with the same top four sources of financing to hospital providers as in 2009 (Table 6.2b and Table 6.2c). However, the growth of expenditure in absolute value from 1997 to 2009 is seen highest in NGO followed by SOCSO and private insurance enterprise. In 1997, each of these sources contributed to less than 2 per cent of the expenditure to all hospitals for that year.

48HEALTH EXPENDITURE REPORT Revised Time Series (1997-2008) & Health Expenditure Report (2009)
FIGURE 6.2: Hospital Expenditure By Sources of Financing, 2009
MOH
MOHE
Private insurance
All other sourcesHousehold OOP
59%
7%
6% 4%
24%
Hospitalexpenditure:50% of TEH
(RM16,891 million)
TABLE 6.2a : Hospital Expenditure by Sources of Financing, 2009
MNHA code Source of financing RM Million Per cent
MS1.1.1.1 Ministry of Health (MOH) 7,903 46.79
MS2.4 Private household out-of-pocket expenditures (OOP) 4,989 29.54
MS1.1.1.2 Ministry of Higher Education (MOHE) 1,774 10.50
MS2.2 Private insurance enterprises (other than social insurance) 1,220 7.22
MS1.1.1.9 Other federal agencies (including statutory bodies) 700 4.15
MS2.6 All Corporations (other than health insurance) 137 0.81
MS1.2.2 Social Security Organization (SOCSO) 42 0.25
MS1.2.1 Employee Provident Funds (EPF) 33 0.19
MS2.5 Non-profit organisations serving households (NGO) 31 0.18
MS1.1.1.3 Ministry of Defence (MOD) 29 0.17
MS1.1.3 Local authorities 17 0.10
MS1.1.2.1 (General) State Government 12 0.07
MS1.1.2.2 Other state agencies (including statutory bodies) 4 0.02
Total 16,891 100.00

MALAYSIA NATIONAL HEALTH ACCOUNTS49
TAB
LE 6
.2b
: H
osp
ital
Exp
end
itur
e b
y S
our
ces
of
Fina
ncin
g, 1
997
- 20
09 (R
M M
illio
n)
MN
HA
co
de
So
urce
of
fina
ncin
g19
9719
9819
9920
0020
0120
0220
0320
0420
0520
0620
0720
0820
09
MS
1.1.
1.1
Min
istr
y of
Hea
lth (M
OH
)2,
248
2,36
1 2,
552
2,82
9 3,
216
3,32
3 3,
993
4,30
6 4,
542
6,18
4 6,
532
7,53
1 7,
903
MS
1.1.
1.2
Min
istr
y of
Hig
her
Edu
catio
n (M
OH
E)
462
435
520
597
766
870
947
1,02
2 1,
060
1,15
0 1,
326
1,52
2 1,
774
MS
1.1.
1.3
Min
istr
y of
Def
ence
(MO
D)
8 4
5 6
11
18
10
12
13
13
29
54
29
MS
1.1.
1.9
Oth
er fe
dera
l age
ncie
s (in
clud
ing
stat
utor
y bo
dies
)13
6 15
3 17
2 19
6 23
9 28
9 35
5 52
1 47
5 50
8 60
4 76
1 70
0
MS
1.1.
2.1
(Gen
eral
) Sta
te G
over
nmen
t4
4 5
6 6
7 7
7 8
9 13
12
12
MS
1.1.
2.2
Oth
er s
tate
age
ncie
s (in
clud
ing
stat
utor
y bo
dies
)1
1 2
2 2
2 2
3 3
3 3
4 4
MS
1.1.
3Lo
cal a
utho
ritie
s2
2 3
3 4
5 6
7 8
10
12
16
17
MS
1.2.
1E
mpl
oyee
Pro
vide
nt F
unds
(EP
F)6
13
16
19
26
30
30
45
54
41
42
40
33
MS
1.2.
2S
ocia
l Sec
urity
Org
aniz
atio
n (S
OC
SO
)1
1 2
4 7
9 17
16
2
25
21
29
42
MS
2.2
Priv
ate
insu
ranc
e en
terp
rises
(oth
er th
an s
ocia
l ins
uran
ce)
64
91
126
164
246
332
408
519
527
655
797
1,00
7 1,
220
MS
2.4
Priv
ate
hous
ehol
d ou
t-of
-poc
ket e
xpen
ditu
res
(OO
P)
1,08
6 1,
227
1,38
1 1,
555
1,72
4 1,
955
2,42
2 2,
754
3,03
1 3,
452
3,85
6 4,
404
4,98
9
MS
2.5
Non
-pro
fit o
rgan
izat
ions
ser
ving
hou
seho
lds
(NG
O)
1 1
1 1
1 3
1 1
1 1
2 11
31
MS
2.6
All
Cor
pora
tions
(oth
er th
an h
ealth
insu
ranc
e)81
85
90
95
10
8 11
1 11
3 11
2 13
5 13
3 15
1 14
1 13
7
To
tal
4,09
8 4,
378
4,87
4 5,
477
6,35
7 6,
953
8,31
1 9,
324
9,86
0 12
,185
13
,390
15
,533
16
,891

50HEALTH EXPENDITURE REPORT Revised Time Series (1997-2008) & Health Expenditure Report (2009)
TAB
LE 6
.2c
: Ho
spit
al E
xpen
dit
ure
by
So
urce
s o
f Fi
nanc
ing
, 199
7 -
2009
(Per
cen
t, %
)
MN
HA
co
de
So
urce
of
fina
ncin
g19
9719
9819
9920
0020
0120
0220
0320
0420
0520
0620
0720
0820
09
MS
1.1.
1.1
Min
istr
y of
Hea
lth (M
OH
)
54.8
4
53.9
3
52.3
5
51.6
6
50.6
0
47.7
9
48.0
4
46.1
8
46.0
7
50.7
5
48.7
9
48.4
8
46.7
9
MS
1.1.
1.2
Min
istr
y of
Hig
her
Edu
catio
n (M
OH
E)
11
.27
9
.94
10
.66
10
.89
12
.06
12
.51
11
.40
10
.96
10
.75
9
.44
9
.90
9
.80
10
.50
MS
1.1.
1.3
Min
istr
y of
Def
ence
(MO
D)
0
.19
0
.09
0
.10
0
.11
0
.18
0
.26
0
.12
0
.13
0
.13
0
.11
0
.22
0
.35
0
.17
MS
1.1.
1.9
Oth
er fe
dera
l age
ncie
s (in
clud
ing
stat
utor
y bo
dies
)
3.3
1
3.4
8
3.5
2
3.5
8
3.7
6
4.1
5
4.2
8
5.5
9
4.8
2
4.1
7
4.5
1
4.9
0
4.1
5
MS
1.1.
2.1
(Gen
eral
) Sta
te G
over
nmen
t
0.1
0
0.1
0
0.1
0
0.1
0
0.0
9
0.0
9
0.0
8
0.0
8
0.0
8
0.0
8
0.1
0
0.0
8
0.0
7
MS
1.1.
2.2
Oth
er s
tate
age
ncie
s (in
clud
ing
stat
utor
y bo
dies
)
0.0
3
0.0
3
0.0
3
0.0
3
0.0
3
0.0
3
0.0
3
0.0
3
0.0
3
0.0
2
0.0
2
0.0
2
0.0
2
MS
1.1.
3Lo
cal A
utho
ritie
s (L
A)
0
.05
0
.05
0
.06
0
.06
0
.06
0
.07
0
.07
0
.07
0
.09
0
.08
0
.09
0
.10
0
.10
MS
1.2.
1E
mpl
oyee
Pro
vide
nt F
unds
(EP
F)
0.1
4
0.2
9
0.3
4
0.3
6
0.4
1
0.4
3
0.3
6
0.4
8
0.5
5
0.3
4
0.3
2
0.2
6
0.1
9
MS
1.2.
2S
ocia
l Sec
urity
Org
aniz
atio
n (S
OC
SO
)
0.0
2
0.0
2
0.0
4
0.0
8
0.1
1
0.1
3
0.2
0
0.1
7
0.0
2
0.2
1
0.1
6
0.1
9
0.2
5
MS
2.2
Priv
ate
insu
ranc
e en
terp
rises
(oth
er th
an s
ocia
l ins
uran
ce)
1
.56
2
.09
2
.59
2
.99
3
.87
4
.77
4
.91
5
.56
5
.34
5
.37
5
.95
6
.48
7
.22
MS
2.4
Priv
ate
hous
ehol
d ou
t-of
-poc
ket e
xpen
ditu
res
(OO
P)
26
.50
28
.02
28
.34
28
.39
27
.12
28
.11
29
.14
29
.53
30
.74
28
.33
28
.80
28
.36
29
.54
MS
2.5
Non
-pro
fit o
rgan
izat
ions
ser
ving
hou
seho
lds
(NG
O)
0
.01
0
.01
0
.01
0
.01
0
.01
0
.05
0
.01
0
.01
0
.01
0
.01
0
.01
0
.07
0
.18
MS
2.6
All
Cor
pora
tions
(oth
er th
an h
ealth
insu
ranc
e)
1.9
8
1.9
5
1.8
5
1.7
4
1.6
9
1.6
0
1.3
6
1.2
0
1.3
7
1.0
9
1.1
3
0.9
1
0.8
1
To
tal
100
.00
100
.00
100
.00
100
.00
100
.00
100
.00
100
.00
100
.00
100
.00
100
.00
100
.00
100
.00
100
.00

MALAYSIA NATIONAL HEALTH ACCOUNTS51
MOH Hospital by Curative care Cross-tabulations
MOH is the largest single financier of all the sources of financing for hospital services. Most of this expenditure is spent for curative care whereby curative care services provided by hospitals include inpatient, outpatient, day care services with minimal home care services. Under the MNHA framework, these types of services would be inclusive of both allopathic and traditional and complementary care services.
In 2009, RM7,781 million or 98 per cent of the RM7,903 million spent at MOH hospitals were for curative care services (Figure 6.3 and Table 6.3a). In the same year RM5,176 million or 67 per cent of the hospital curative care expenditure was for inpatient care services followed by RM2,450 million or 31 per cent for patient care services and RM154 million or 2 per cent for day care services.
The 1997 to 2009 time series data shows that in absolute ringgit value the MOH hospital inpatient and outpatient expenditure has increased by nearly 4-fold but remains at the same pattern as a share of the total curative care expenditure (Table 6.3b and Table 6.3c).

52HEALTH EXPENDITURE REPORT Revised Time Series (1997-2008) & Health Expenditure Report (2009)
FIGURE 6.3: MOH Hospital Expenditure By Curative Care Functions of Health Services, 2009
In-patient Out-patient Day care
67%
2%
31%
Curative care:98% of total
Hospital Expenditure**(RM7,781 million)
TABLE 6.3a: MOH Hospital Expenditure by Curative Care Function of Health Services, 2009**
MNHA code Function of Health services RM Million Per cent
MF1.1 In-patient curative care 5,176 66.53
MF1.3* Out-patient curative care 2,450 31.49
MF1.2 Day cases of curative care 154 1.98
Total 7,781 100.00
Note: *Data includes home careNote: ** Excludes MOH development expenditure to hospitals
Note : ** Excludes MOH development expenditure to hospitals

MALAYSIA NATIONAL HEALTH ACCOUNTS53
TAB
LE 6
.3b
: MO
H H
osp
ital
Exp
end
itur
e b
y C
urat
ive
Car
e Fu
ncti
on
of
Hea
lth
Ser
vice
s, 1
997
- 20
09 (
RM
Mill
ion)
**
MN
HA
co
de
Func
tio
n o
f H
ealt
h se
rvic
es19
9719
9819
9920
0020
0120
0220
0320
0420
0520
0620
0720
0820
09
MF1
.1In
-pat
ient
cur
ativ
e ca
re
1,
470
1,53
2
1,
641
1,83
5
2,
048
2,16
0
2,
570
2,75
6
2,
852
3,99
4
4,
196
4,93
6
5,
176
MF1
.2D
ay c
ases
of c
urat
ive
care
46
48
51
57
63
66
79
84
87
12
0
125
14
7
154
MF1
.3*
Out
-pat
ient
cur
ativ
e ca
re
700
72
8
782
87
5
975
1,02
9
1,
224
1,31
0
1,
356
1,89
4
1,
997
2,34
4
2,
450
Tota
l
2,
215
2,30
8
2,
474
2,76
6
3,
086
3,25
5
3,
872
4,15
1
4,
295
6,00
8
6,
318
7,42
7
7,
781
TAB
LE 6
.3c:
MO
H H
osp
ital
Exp
end
itur
e b
y C
urat
ive
Car
e Fu
ncti
on
of
Hea
lth
Ser
vice
s, 1
997
- 20
09 (P
er c
ent,
%)*
*
MN
HA
co
de
Func
tio
n o
f H
ealt
h se
rvic
es19
9719
9819
9920
0020
0120
0220
0320
0420
0520
0620
0720
0820
09
MF1
.1In
-pat
ient
cur
ativ
e ca
re
66
.34
66
.37
66
.33
66
.34
66
.37
66
.36
66
.36
66
.40
66
.40
66
.47
66
.41
66
.46
66
.53
MF1
.2D
ay c
ases
of c
urat
ive
care
2.
07
2.
08
2.
06
2.
04
2.
05
2.
03
2.
03
2.
03
2.
02
2.
00
1.
98
1.
97
1.
98
MF1
.3*
Out
-pat
ient
cur
ativ
e ca
re
31.5
9
31.5
5
31.6
1
31.6
1
31.5
8
31.6
0
31.6
1
31.5
6
31.5
7
31.5
2
31.6
0
31.5
7
31.4
9
Tota
l
10
0.00
10
0.00
10
0.00
10
0.00
10
0.00
10
0.00
10
0.00
10
0.00
10
0.00
10
0.00
10
0.00
10
0.00
10
0.00
Not
e:*
Dat
a in
clud
e ho
me
care
Not
e: *
* A
ll M
OH
dat
a ex
clud
es d
evel
opm
ent e
xpen
ditu
re

54HEALTH EXPENDITURE REPORT Revised Time Series (1997-2008) & Health Expenditure Report (2009)
TAB
LE 6
.3c:
MO
H H
osp
ital
Exp
end
itur
e b
y C
urat
ive
Car
e Fu
ncti
on
of
Hea
lth
Ser
vice
s, 1
997
- 20
09 (P
er c
ent,
%)*
*
MN
HA
co
de
Func
tio
n o
f H
ealt
h se
rvic
es19
9719
9819
9920
0020
0120
0220
0320
0420
0520
0620
0720
0820
09
MF1
.1In
-pat
ient
cur
ativ
e ca
re
66
.34
66
.37
66
.33
66
.34
66
.37
66
.36
66
.36
66
.40
66
.40
66
.47
66
.41
66
.46
66
.53
MF1
.2D
ay c
ases
of c
urat
ive
care
2.
07
2.
08
2.
06
2.
04
2.
05
2.
03
2.
03
2.
03
2.
02
2.
00
1.
98
1.
97
1.
98
MF1
.3*
Out
-pat
ient
cur
ativ
e ca
re
31.5
9
31.5
5
31.6
1
31.6
1
31.5
8
31.6
0
31.6
1
31.5
6
31.5
7
31.5
2
31.6
0
31.5
7
31.4
9
Tota
l
10
0.00
10
0.00
10
0.00
10
0.00
10
0.00
10
0.00
10
0.00
10
0.00
10
0.00
10
0.00
10
0.00
10
0.00
10
0.00
Ambulatory Care providers by Sources of Financing Cross-tabulations
After hospitals the next largest provider of health care services are the providers of ambulatory care services. The MNHA framework adopts the SHA framework definition of providers of ambulatory care and includes providers of medical clinics, dental clinics, family planning centers, substance abuse centers, dialysis centers, medical and diagnostic centers, ambulance providers and many other outpatient providers who do provide inpatient services. The MNHA framework, unlike the SHA framework, includes providers of Traditional and Complementary medicines under this category.
In 2009, ambulatory care providers consumed RM7,111 million or 21 per cent of total health expenditure (Figure 6.4 and Table 6.4a). Of this amount, RM5,096 million or 72 per cent was funded by private sector source of financing and the remaining RM2,015 million or 28 per cent by public sector financing.
The 1997 to 2009 time series data shows that the expenditure for ambulatory care services has increased by 4-fold in absolute ringgit value (Table 6.4b and Table 6.4c). A higher rate of increase of the private source of financing compared to public source of funding is noted. However, over the same time period the trend of share of private to public source of financing shows a decreasing trend in the private source and an increasing trend in the public source of financing for ambulatory care services.

MALAYSIA NATIONAL HEALTH ACCOUNTS55
FIGURE 6.4: Expenditure At Ambulatory care Providers (non-hospital setting) by Sources of Financing, 2009
Private sector Public sector
72%
28%
Ambulatory Care :
21%of TEH(RM7,111 million)
TABLE 6.4a: Expenditure at Ambulatory Care Providers by source of financing, 2009
MNHA code Function of Health services RM Million Per cent
MS2 Private sector 5,096 72
MS1 Public Sector 2,015 28
Total 7,111 100

56HEALTH EXPENDITURE REPORT Revised Time Series (1997-2008) & Health Expenditure Report (2009)
TAB
LE 6
.4b
: Exp
end
itur
e at
Am
bul
ato
ry C
are
Pro
vid
ers
by
sour
ce o
f fi
nanc
ing
, 19
97 -
200
9 (R
M M
illio
n)
MN
HA
co
de
Func
tio
n o
f H
ealt
h se
rvic
es19
9719
9819
9920
0020
0120
0220
0320
0420
0520
0620
0720
0820
09
MS
2P
rivat
e se
ctor
1,32
1
1,
413
1,54
6
1,
870
1,97
4
2,
211
2,50
9
2,
951
3,55
2
3,
878
4,24
5
4,
841
5,0
96
MS
1P
ublic
Sec
tor
32
1
333
38
6
459
57
3
684
93
3
1,
057
1,11
1
1,
544
1,58
9
1,
902
2,0
15
Tota
l
1,
642
1,74
6
1,
932
2,32
9
2,
546
2,89
6
3,
442
4,00
8
4,
663
5,42
3
5,
834
6,74
3 7
,111
TAB
LE 6
.4c:
Exp
end
itur
e at
Am
bul
ato
ry C
are
Pro
vid
ers
by
sour
ce o
f fi
nanc
ing
, 19
97 -
200
9 (P
er c
ent,
%)
MN
HA
co
de
Func
tio
n o
f H
ealt
h se
rvic
es19
9719
9819
9920
0020
0120
0220
0320
0420
0520
0620
0720
0820
09
MS
2P
rivat
e se
ctor
80.4
680
.92
80.0
280
.28
77.5
176
.36
72.9
173
.62
76.1
771
.52
72.7
771
.79
71.6
6
MS
1P
ublic
Sec
tor
19.5
419
.08
19.9
819
.72
22.4
923
.64
27.0
926
.38
23.8
328
.48
27.2
328
.21
28.3
4
Tota
l10
0.00
100.
0010
0.00
100.
0010
0.00
100.
0010
0.00
100.
0010
0.00
100.
0010
0.00
100.
0010
0.00

MALAYSIA NATIONAL HEALTH ACCOUNTS57
Total Health Expenditure by Function of Health Services
This dimension of health expenditure responds to the question on the type of services purchased with the financial resources.
In 2009 the expenditure for curative care services amounted to RM19,079 million or 57 per cent of total health expenditure (Figure 7.1 and Table 7.1a). This was followed by expenditure of RM4,148 million or 12 per cent for medical goods dispensed to out-patient, RM3,454 million or 10 per cent for health programme and health insurance administration, RM2,757 million or 8 per cent for capital formation. The remaining RM4,253 million or 13 per cent of expenditure was spent on prevention and public health services, education and training, ancillary services and other functions.
The 1997 to 2009 time series data (Table 7.1b and Table 7.1c) shows similar pattern to 2009 with the highest expenditures for the same four functions with increase in absolute ringgit value over the time period. However as a share of the total expenditure, curative care expenditure trend shows a V-shaped pattern with 2003 expenditure as the lowest expenditure. Health programme and health insurance administration expenditure dropped by 3 per cent as a share of total expenditure over the time period.
CHAPTER 7

58HEALTH EXPENDITURE REPORT Revised Time Series (1997-2008) & Health Expenditure Report (2009)
FIGURE 7.1: Total Expenditure on Health by Function of Health Services, 2009
Curative care
Capitalformation
All otherfunctions
Medical Goods
Admin HealthProgram &insurance
60% 57%
12%10%
8%
13%
50%
40%
30%
20%
10%
0%
Func
tion
of H
ealth
Ser
vice
s
TABLE 7.1a: Total Expenditure On Health by Function of Health Services, 2009
MNHA code Function of Health services RM Million Per cent
MF1 Services of curative care 19,079 56.63
MF5 Medical goods dispensed to out-patients 4,148 12.31
MF7 Health program administration and health insurance 3,454 10.25
MR1 Capital formation of health care provider institutions 2,757 8.18
MF6 Prevention and public health services 1,758 5.22
MR2 Education and training of health personnel 1,347 4.00
MF4 Ancillary services to health care 868 2.58
MF3 Services of long-term nursing care 147 0.43
MF2 Services of rehabilitative care 84 0.25
MR3 Research & Development in Health 50 0.15
Total 33,691 100.00

MALAYSIA NATIONAL HEALTH ACCOUNTS59
TAB
LE 7
.1b
: To
tal e
xpen
dit
ure
on
Hea
lth
by
Func
tio
n o
f H
ealt
h S
ervi
ces,
199
7 -
2009
(RM
Mill
ion)
MN
HA
co
de
Func
tio
n o
f H
ealt
h se
rvic
es19
9719
9819
9920
0020
0120
0220
0320
0420
0520
0620
0720
0820
09
MF1
Ser
vice
s of
cur
ativ
e ca
re4,
592
4,88
45,
418
6,14
87,
006
7,78
69,
050
10,3
1611
,162
13,5
1314
,809
17,3
2419
,079
MF2
Ser
vice
s of
reha
bilit
ativ
e ca
re18
1922
2428
3146
4856
6471
6784
MF3
Ser
vice
s of
long
-ter
m n
ursi
ng c
are
3236
4147
5261
7511
298
111
122
127
147
MF4
Anc
illary
ser
vice
s to
hea
lth c
are
186
199
217
273
345
392
465
537
618
720
769
881
868
MF5
Med
ical
goo
ds d
ispe
nsed
to o
ut-p
atie
nts
1,02
91,
092
1,19
81,
560
1,59
71,
844
2,19
42,
634
2,89
83,
174
3,70
04,
207
4,14
8
MF6
Pre
vent
ion
and
publ
ic h
ealth
ser
vice
s39
740
444
851
954
157
192
698
71,
094
1,73
71,
561
1,73
11,
758
MF7
Hea
lth p
rogr
am a
dmin
istr
atio
n an
d he
alth
insu
ranc
e1,
057
1,09
41,
166
1,36
31,
483
1,72
92,
185
2,28
82,
256
2,72
82,
842
3,24
53,
454
MR
1C
apita
l for
mat
ion
of h
ealth
car
e pr
ovid
er in
stitu
tions
520
783
913
1,35
71,
678
1,63
42,
811
2,32
61,
265
1,35
81,
535
1,72
52,
757
MR
2E
duca
tion
and
trai
ning
of h
ealth
per
sonn
el15
418
623
930
137
946
357
360
466
178
692
91,
148
1,34
7
MR
3R
esea
rch
& D
evel
opm
ent i
n H
ealth
6153
4843
7578
7462
2235
5114
650
Tota
l8,
045
8,75
19,
711
11,6
3513
,182
14,5
8818
,399
19,9
1220
,131
24,2
2726
,389
30,6
0133
,691

60HEALTH EXPENDITURE REPORT Revised Time Series (1997-2008) & Health Expenditure Report (2009)
TAB
LE 7
.1c:
To
tal e
xpen
dit
ure
on
Hea
lth
by
Func
tio
n o
f H
ealt
h S
ervi
ces,
199
7 -
2009
(Per
cen
t,%
)
MN
HA
co
de
Func
tio
n o
f H
ealt
h se
rvic
es19
9719
9819
9920
0020
0120
0220
0320
0420
0520
0620
0720
0820
09
MF1
Ser
vice
s of
cur
ativ
e ca
re57
.08
55.8
155
.79
52.8
453
.14
53.3
749
.19
51.8
155
.45
55.7
856
.12
56.6
156
.63
MF2
Ser
vice
s of
reha
bilit
ativ
e ca
re0.
220.
220.
230.
210.
210.
210.
250.
240.
280.
260.
270.
220.
25
MF3
Ser
vice
s of
long
-ter
m n
ursi
ng c
are
0.40
0.42
0.42
0.40
0.39
0.42
0.41
0.56
0.49
0.46
0.46
0.41
0.43
MF4
Anc
illary
ser
vice
s to
hea
lth c
are
2.31
2.28
2.23
2.35
2.62
2.68
2.53
2.69
3.07
2.97
2.91
2.88
2.58
MF5
Med
ical
goo
ds d
ispe
nsed
to o
ut-p
atie
nts
12.8
012
.48
12.3
413
.41
12.1
112
.64
11.9
313
.23
14.4
013
.10
14.0
213
.75
12.3
1
MF6
Pre
vent
ion
and
publ
ic h
ealth
ser
vice
s4.
934.
624.
624.
464.
113.
925.
034.
965.
447.
175.
925.
665.
22
MF7
Hea
lth p
rogr
am a
dmin
istr
atio
n an
d he
alth
insu
ranc
e13
.13
12.5
012
.01
11.7
211
.25
11.8
511
.87
11.4
911
.21
11.2
610
.77
10.6
010
.25
MR
1C
apita
l for
mat
ion
of h
ealth
car
e pr
ovid
er in
stitu
tions
6.46
8.94
9.40
11.6
612
.73
11.2
015
.28
11.6
86.
285.
615.
825.
648.
18
MR
2E
duca
tion
and
trai
ning
of h
ealth
per
sonn
el1.
912.
132.
462.
592.
873.
183.
113.
033.
283.
243.
523.
754.
00
MR
3R
esea
rch
& D
evel
opm
ent i
n H
ealth
0.76
0.61
0.49
0.37
0.57
0.53
0.40
0.31
0.11
0.15
0.19
0.48
0.15
Tota
l10
0.00
100.
0010
0.00
100.
0010
0.00
100.
0010
0.00
100.
0010
0.00
100.
0010
0.00
100.
0010
0.00

MALAYSIA NATIONAL HEALTH ACCOUNTS61
Curative care expenditure by Sources of Financing Cross-tabulation
Curative care services include medical, paramedical, and allied health services inclusive of dental services which could be either allopathic or TCM services. It could be rendered either in hospital or non-hospital settings. The non-hospital setting is inclusive of medical or dental clinics but excludes other services provided at standalone allied health or rehabilitative facilities, standalone pharmacies and radiological service facilities and many other non-hospital facilities.
In 2009 a total of RM19,079 million or 57 per cent of total health expenditure was for curative care services (Figure 7.2). The source of financing for curative care services was RM10,069 million or 53 per cent from the public sector and the remaining RM9,009 or 47 per cent from the private sector. In the public sector 92 per cent and in the private sector 61 per cent of the curative care expenditure was spent at hospitals and the remaining in both sectors were spent at non-hospital curative care providers.
The 1997 to 2009 time series data shows a similar pattern in absolute ringgit value (Table 7.2). However, as a share of public to private source of funding for curative care services, the public share shows a downward trend and the private share shows an upward trend with the public sector financing higher than the private sector source of financing.

62HEALTH EXPENDITURE REPORT Revised Time Series (1997-2008) & Health Expenditure Report (2009)
SOURCE:G
OVERNMENT
53%
(RM
10,
069
Mill
ion)
HOSPIT
ALS
92%
NON-H
OSPIT
ALS
8%(R
M 8
35 M
illio
n)(R
M 9
,234
Mill
ion)
SOURCE:P
RIV
ATE
47%
(RM
9,00
9 M
illio
n)
HOSPIT
ALS
61%
(RM
5,4
61 M
illio
n)
NON-H
OSPIT
ALS
39%
(RM
3,5
48 M
illio
n)
CURATIV
E C
ARE E
XPENDIT
URE, 2009
57%
OF
TOTA
L H
EALT
H E
XPEN
DIT
URE
(RM
19,
079
MIL
LIO
N)
FIG
UR
E 7
.2: C
urat
ive
Car
e E
xpen
dit
ure
By
So
urce
of
Fina
ncin
g 2
009

MALAYSIA NATIONAL HEALTH ACCOUNTS63
TAB
LE 7
.2:
Cur
ativ
e C
are
Exp
end
itur
e B
y S
our
ces
of
Fina
ncin
g, 1
997-
2009
(RM
Mill
ion)
So
urce
Pro
vid
er19
9719
9819
9920
0020
0120
0220
0320
0420
0520
0620
0720
0820
09
Pub
lic S
ecto
r
Hos
pita
l
2,60
32,
664
2,89
53,
266
3,70
63,
971
4,70
25,
184
5,34
57,
160
7,49
78,
732
9,23
4
Non
-Hos
pita
l22
423
227
428
038
747
737
345
344
928
654
772
783
5
Sub
-To
tal
2,82
82,
896
3,16
93,
546
4,09
34,
448
5,07
55,
637
5,79
47,
446
8,04
49,
459
10,0
69
Priv
ate
Sec
tor
Hos
pita
l
1,03
11,
176
1,34
01,
521
1,75
12,
028
2,46
62,
817
3,07
83,
542
4,03
94,
695
5,46
1
Non
-Hos
pita
l73
381
290
91,
081
1,16
21,
310
1,50
91,
862
2,29
12,
526
2,72
63,
170
3,54
8
Sub
-To
tal
1,76
41,
988
2,24
92,
602
2,91
23,
338
3,97
44,
679
5,36
96,
068
6,76
57,
866
9,00
9
To
tal
4,59
24,
884
5,41
86,
148
7,00
67,
786
9,05
010
,316
11,1
6213
,513
14,8
0917
,324
19,0
79

64HEALTH EXPENDITURE REPORT Revised Time Series (1997-2008) & Health Expenditure Report (2009)
Preventive & Promotive expenditure by Sources of Financing
This refers to expenditure for services designed to enhance the health status of the population, usually in the form of structured public health services including preventive and promotive programmes, and excludes the expenditure of similar services delivered on individual basis which is captured as part of curative services.
In 2009 a total of RM1,758 million or 5 per cent of total health expenditure was spent on public health programmes including preventive and promotive services of which RM1,577 million or 90 per cent was by the public sector source of financing (Figure 7.3). In the public sector, MOH spent 87 per cent of this amount.
The 1997 to 2009 time series data also shows MOH as the largest source of financing for this function of health care services with a six-fold increase in absolute ringgit value over the time period (Table 7.3).
FIGURE 7.3: Preventive and Promotive Public Health Programme Expenditure by Sources of Financing, 2009
RM
Mill
ion
200
Public Sector Private Sector
400
600
800
1,000
1,200
1,400
1,600RM 1,577 Million
RM 181 Million
Non-MOH13%
MOH87%
1,800

MALAYSIA NATIONAL HEALTH ACCOUNTS65
TAB
LE 7
.3 :
Pre
vent
ive
& P
rom
oti
ve P
ublic
Hea
lth
Exp
end
itur
e b
y S
our
ces
of
Fina
ncin
g, 1
997
- 20
09 (R
M M
illio
n)
MN
HA
co
de
So
urce
of
fina
ncin
g19
9719
9819
9920
0020
0120
0220
0320
0420
0520
0620
0720
0820
09
MS
1.1.
1.1
Min
istr
y of
Hea
lth (M
OH
)22
722
425
931
531
732
366
170
777
51,
403
1,18
01,
331
1,36
8
MS
1.1.
1.2
Min
istr
y of
Edu
catio
n (M
OE
)0
00
-0
10
10
00
10
MS
1.1.
1.3
Min
istr
y of
Def
ence
(MO
D)
00
00
00
00
00
00
0
MS
1.1.
1.9
Oth
er fe
dera
l age
ncie
s (in
clud
ing
stat
utor
y bo
dies
)24
2426
3030
3336
4145
4954
5862
MS
1.1.
2.1
(Gen
eral
) Sta
te G
over
nmen
t23
2722
2226
2830
3641
4759
6157
MS
1.1.
2.2
Oth
er s
tate
age
ncie
s (in
clud
ing
stat
utor
y bo
dies
)1
26
56
65
67
88
816
MS
1.1.
3Lo
cal a
utho
ritie
s25
2628
3132
4449
4949
5158
6372
MS
1.2.
2S
ocia
l Sec
urity
Org
aniz
atio
n (S
OC
SO
)2
22
22
22
22
11
12
MS
2.4
Priv
ate
hous
ehol
d ou
t-of
-poc
ket e
xpen
ditu
res
78
910
1113
1620
2326
2636
26
MS
2.5
Non
-pro
fit o
rgan
izat
ions
ser
ving
hou
seho
lds
88
89
910
1111
1514
1827
14
MS
2.6
All
Cor
pora
tions
(oth
er th
an h
ealth
insu
ranc
e)79
8390
9610
811
211
511
413
813
815
414
614
1
MS
9R
est o
f the
wor
ld-
--
--
--
--
-1
0-
Tota
l39
740
444
851
954
157
192
698
71,
094
1,73
71,
561
1,73
11,
758

66HEALTH EXPENDITURE REPORT Revised Time Series (1997-2008) & Health Expenditure Report (2009)
FIGURE 7.4: Expenditure for Education and Training by Sources of Financing, 2009
RM
Mill
ion
100
Public Sector Private Sector
200
300
400
500
600
700
800
900
1000
RM 884 Million
Non-MOH,63%
MOH,37%
RM 463 Million
Expenditure for Education and Training by Sources of Financing
This includes expenditure for all health and health-related education and training of personnel. Although MNHA framework includes this expenditure under the total health expenditure, the SHA framework excludes this because of the shortfall in the assumptions and difficulties in the capture of this expenditure. Furthermore, personnel who undergo health and health-related education and training may not continue to provide services in the health sector.
In 2009 a total of RM1,347 million or under 3 per cent of total health expenditure was spent on health related education and training. A total of RM884 million or 66 per cent of this amount was funded by public sector source of financing with MOH spending 37 per cent and non-MOH spending the balance (Figure 7.4).
The 1997 to 2009 time series data shows that although both the public and private source of financing shows an increasing trend in expenditure for this function of health care service,the public source spending remains almost twice that of private source in absolute ringgit value (Table 7.4a and Table 7.4b). Similarly, in the public source of financing, the non-MOH spending is about twice that of MOH expenditure for education and training.

MALAYSIA NATIONAL HEALTH ACCOUNTS67
TAB
LE 7
.4a
: Exp
end
itur
e fo
r E
duc
atio
n an
d H
ealt
h Tr
aini
ng b
y S
our
ces
of
Fina
ncin
g, 1
997
- 20
09 (R
M M
illio
n)
MN
HA
co
de
So
urce
of
fina
ncin
g19
9719
9819
9920
0020
0120
0220
0320
0420
0520
0620
0720
0820
09
MS
1.1.
1.1
Pub
lic S
ecto
r (M
OH
)35
3368
9614
718
623
122
221
827
027
531
032
5
MS
1.1.
1.2
- M
S1.
1.1.
9P
ublic
Sec
tor
(Non
- M
OH
)64
8393
112
127
153
187
209
243
284
359
462
559
MS
2P
rivat
e se
ctor
*55
7078
9310
512
515
517
320
023
229
537
646
3
Tota
l15
418
623
930
137
946
357
360
466
178
692
91,
148
1,34
7
TAB
LE 7
.4b
: E
xpen
dit
ure
for
Ed
ucat
ion
and
Hea
lth
Trai
ning
Exp
end
itur
e b
y S
our
ce o
f Fi
nanc
ing
, 199
7 -
2009
(Per
cen
t)
MN
HA
co
de
So
urce
of
fina
ncin
g19
9719
9819
9920
0020
0120
0220
0320
0420
0520
0620
0720
0820
09
MS
1.1.
1.1
Pub
lic S
ecto
r (M
OH
)22
.66
17.7
628
.34
31.9
538
.83
40.1
240
.39
36.7
133
.01
34.3
929
.59
27.0
324
.12
MS
1.1.
1.2
- M
S1.
1.1.
9P
ublic
Sec
tor
(Non
- M
OH
)41
.67
44.6
038
.91
37.2
033
.52
33.0
032
.58
34.6
236
.72
36.1
038
.62
40.2
141
.53
MS
2P
rivat
e se
ctor
*35
.67
37.6
432
.75
30.8
527
.64
26.8
827
.03
28.6
830
.27
29.5
131
.85
32.7
634
.35
Tota
l10
0.00
100.
0010
0.00
100.
0010
0.00
100.
0010
0.00
100.
0010
0.00
100.
0010
0.00
100.
0010
0.00
Not
e: D
ata
incl
udes
exp
endi
ture
und
er R
est o
f the
Wor
ld

68HEALTH EXPENDITURE REPORT Revised Time Series (1997-2008) & Health Expenditure Report (2009)
State Expenditure
The state disaggregation of health expenditure is reported for the first time under MNHA. The state allocation was carried out based on the facility where the source of financing was used to purchase the various types of health care services and products. This state allocation was done for the smallest possible disaggregated source of financing and then rolled up to produce the total state expenditure. Further improvements and refinements in the methodology are expected in the future. The arrangements of the state in the Figures and Tables below are based on the state population size in the year 2009 as the reference year.
There are a total of thirteen states and three additional Federal Territories, namely Kuala Lumpur, Labuan and Putrajaya. The expenditure for Putrajaya is included under the state of Selangor to follow the state population census as reported under the Department of Statistics Malaysia.
In 2009, Selangor had the highest population of 5,034 thousand people but WP Kuala Lumpur had the highest expenditure of RM5,468 million (Figure 8.1 and Table 8.1). There appears to be a wider gap between the per capita spending and population in the highest and lowest populated states except for WP Kuala Lumpur (Figure 8.2 and Table 8.2).
The comparisons of per capita spending by the public and private sector source of funding can be made for the time series state disaggregated data. In 2009 show that the median public sector source of spending in all states excluding WP Kuala Lumpur was RM479 per capita (Figure 8.3 & Table 8.3). The median private sector source of spending in all states excluding WP Kuala Lumpur, the East Coast states of Kelantan and Terengganu and West Malaysia states of Sabah, Sarawak and Labuan was RM382 per capita. A total of RM5,484 million or 16 per cent of the total expenditure was expenditure at federal level and was excluded in the state disaggregation.
CHAPTER 8

MALAYSIA NATIONAL HEALTH ACCOUNTS69
FIGURE 8.1: Total Expenditure by State, 2009
4,972
2,908
1,6021,837
2,191
1,410
5,468
1,431
2,377
1,134
654918 930
230 146
(RM
Mill
ion)
1,000
2,000
3,000
4,000
5,000
6,000S
elan
gor
Joho
r
Sab
ah
Sar
awak
Per
ak
Ked
ah
WP
KL
Kel
anta
n
P.P
inan
g
Pah
ang
Tere
ngga
nu
N.S
emb
ilan
Mel
aka
Per
lis
WP
Lab
uan
TABLE 8.1: State Population and Health Expenditure, 2009
State Population (Thousand)** Expenditure (RM Million)
Selangor* 5,034 4,972
Johore 3,269 2,908
Sabah 3,184 1,602
Sarawak 2,471 1,837
Perak 2,428 2,191
Kedah 1,943 1,410
WP KL 1,703 5,468
Kelantan 1,639 1,431
P. Pinang 1,580 2,377
Pahang 1,517 1,134
Terengganu 1,036 654
N. Sembilan 1,000 918
Malacca 762 930
Perlis 237 230
WP Labuan 94 146
Federal 5,484
Total 27,895 33,691
Note: *This includes WP Putrajaya
** Source: Department of Statistics Malaysia

70HEALTH EXPENDITURE REPORT Revised Time Series (1997-2008) & Health Expenditure Report (2009)
Percapita (RM) State Population (Thousand)
FIGURE 8.2: State Population and Per Capita Health Spending, 2009
Per
Cap
ita S
pend
ing
(RM
)
Pop
ulat
ion
(Tho
usan
d)
3500
3,000
2,500
2,000
1,500
1,000
1,000
2,000
3,000
4,000
5,000
6,000
500
0 0
Sel
ango
r
Joho
re
Sab
ah
Sar
awak
Per
ak
Ked
ah
WP
KL
Kel
anta
n
P.P
inan
g
Pah
ang
Tere
ngga
nu
N.S
emb
ilan
Mel
aka
Per
lis
WP
Lab
uan
TABLE 8.2: State Population and Per Capita Health Spending, 2009
State Per Capita (RM) State Population (Thousands)
Selangor 988 5,034
Johore 890 3,269
Sabah 503 3,184
Sarawak 743 2,471
Perak 902 2,428
Kedah 726 1,943
WP KL 3,211 1,703
Kelantan 873 1,639
P. Pinang 1,504 1,580
Pahang 748 1,517
Terengganu 631 1,036
N. Sembilan 918 1,000
Malacca 1,221 762
Perlis 970 237
WP Labuan 1,553 94
Total Population 27,895
Note: *This includes WP Putrajaya

MALAYSIA NATIONAL HEALTH ACCOUNTS71
Public Sector Private Sector
FIGURE 8.3: State Per Capita Health Spending by Public and Private Sector, 2009P
er C
apita
Spe
ndin
g (R
M)
1,000
1,200
1,400
1,600
1,800
2,000
400
600
800
200
0
Sel
ango
r
Joho
re
Sab
ah
Sar
awak
Per
ak
Ked
ah
WP
KL
Kel
anta
n
P.P
inan
g
Pah
ang
Tere
ngga
nu
N.S
emb
ilan
Mel
aka
Per
lis
WP
Lab
uan
TABLE 8.3: State Per Capita Health Spending by Public and Private Sector, 2009 (Ringgit Malaysia, RM)
State Public Sector Private Sector
Selangor 406 582
Johore 376 513
Sabah 381 122
Sarawak 476 268
Perak 483 419
Kedah 404 322
WP KL 1,757 1,454
Kelantan 651 222
P. Pinang 524 980
Pahang 472 275
Terengganu 474 157
N. Sembilan 572 345
Malacca 516 705
Perlis 695 275
WP Labuan 487 1,067
Note: *This includes WP Putrajaya

72HEALTH EXPENDITURE REPORT Revised Time Series (1997-2008) & Health Expenditure Report (2009)
International Comparison
In this section some health expenditure comparisons are made with 2008 base reference year as the latest internationally available NHA data reported by WHO. Selected developed and regional country health expenditure data are compared to the same year Malaysian data. There is some variation in the total health expenditure as a percentage of GDP varies reported under MNHA framework and SHA framework.
In 2008, the MNHA framework shows total health expenditure of 4.1 per cent whereas the SHA framework shows it to be 3.8 per cent of GDP (Figure 9.1). This higher reporting under the MNHA framework is due to the extended boundaries of total health expenditure in this framework. If the MNHA value of total health expenditure is used for international comparison, it is noted that the expenditure in Malaysia is similar to most regional countries like China, India, Sri Lanka, and Thailand that spend slightly above 4 percent GDP for health. In the same year, Malaysia spent higher than Bangladesh and Indonesia but lower than other more developed Asian countries such as Korea and Japan. In comparison with two OECD countries, Australia and UK, both spent more than 8 per cent GDP which was around the average annual OECD country expenditure.
The rest of the data comparison shows the same value under MNHA and SHA framework. The US Dollar (USD) per capita spending in Australia, UK and Japan was more than USD3,000 per country whereas Singapore and Korea per capita spending was above USD1,000 (Figure 9.2). All other countries spent less than USD500 per capita. Malaysia spent USD356 per capita which equates to about twice than spent in Thailand and China. Sri Lanka, Indonesia, India and Bangladesh all spend below 100USD per capita.
Comparison of public and private share of health spending show that the developed countries such as Australia, UK and Japan has a much higher public sector share compared to the less developed countries such as India, Sri Lanka and Bangladesh (Figure 9.3). Malaysia’s public expenditure share was 54 per cent similar to Korea and Indonesia. The countries with a smaller share of private sector spending such as Australia, UK and Japan have a larger OOP share of the private sector expenditure (Figure 9.4). The public private share and the OOP share of private spending in Thailand are similar to developed countries. The trend in Malaysia is near similar to Korea and Indonesia with a rather high private spending and high OOP share of private spending.
CHAPTER 9

MALAYSIA NATIONAL HEALTH ACCOUNTS73
FIGURE 9.1: International Comparison of Total Health Expenditure as Per cent GDP, 2008To
tal H
ealth
Exp
endi
ture
as
% G
DP
0
1
2
3
4
5
6
7
8
9 8.7 8.5 8.3
6.5
4.3 4.2 4.1 4.1 4.1 3.83.3 3.3
2.3
10U
nite
d K
ingd
om
Aus
tral
ia
Jap
an
Rep
ublic
of K
orea
Chi
na
Ind
ia
Sri
Lank
a
Thai
land
Mal
aysi
a*
Mal
aysi
a**
Ban
glad
esh
Sin
gap
ore
Ind
ones
ia
Note: *MNHA Framework International Source : World Health Statistics 2011
** SHA Framework
Note: *Both MNHA & SHA Framework International Source : World Health Statistics 2011
FIGURE 9.2: International Comparison Per Capita Health Expenditure, 2008
Uni
ted
Kin
gdom
Aus
tral
ia
Jap
an
Rep
ublic
of K
orea
Chi
na
Ind
ia
Sri
Lank
a
Thai
land
Mal
aysi
a*
Ban
glad
esh
Sin
gap
ore
Ind
ones
ia
4,180
3,771
3,190
1,4041,245
356164 146 83 51 45 17
US
D P
er C
apita
500
1,000
1,500
2,000
2,500
3,000
3,500
4,000
4,500

74HEALTH EXPENDITURE REPORT Revised Time Series (1997-2008) & Health Expenditure Report (2009)
FIGURE 9.3: International Comparison Public-Private Share of Total Health Expenditure, 2008
Public Share Private Share
Uni
ted
Kin
gdom
Aus
tral
ia
Jap
an
Rep
ublic
of K
orea
Chi
na
Ind
ia
Sri
Lank
a
Thai
land
Mal
aysi
a*
Ban
glad
esh
Sin
gap
ore
Ind
ones
ia
0
20 83
17
81
20
74
26
65
29
54
46
54
46
54
46
47
53
44
56
34
66
32
68
31
69
40
60
80
100
120
Per
Cen
t Sha
re
Note: *Both MNHA & SHA Framework International Source : World Health Statistics 2011
Note: *Both MNHA & SHA Framework International Source : World Health Statistics 2011
FIGURE 9.4: OOP as Share of Private Sector Spending Vs Private Share of TEH, 2008
OOP% TEHOOP % Private
Uni
ted
Kin
gdom
Aus
tral
ia
Jap
an
Rep
ublic
of K
orea
Chi
na
Ind
ia
Sri
Lank
a
Thai
land
Mal
aysi
a*
Ban
glad
esh
Sin
gap
ore
Ind
ones
ia
0
20 17 2026 29
46 46 4653 56
66 68 6964
81
6862
7079
8783
8794
74
97
40
60
80
100
120
Per
cen
t sha
re

MALAYSIA NATIONAL HEALTH ACCOUNTS75
TABLE A1: Sources of Data
Samples of data sources from public sector used for estimation of MNHA.
PUBLIC SECTOR
Main Agencies Specific Organization
MOH Ministry of Health
Other Ministries Ministry of Home Affairs
Ministry of Defence
Ministry of Higher Education
Ministry of Science Technology and Innovation
Government Departments Accountant-General’s Department
Department of Statistics (DOS)
Public Service Department
Civil Defence Department
Prison Department of Malaysia
Social Welfare Department
Occupational Safety And Health Department
National Anti-Drug Agency (AADK)
Pilgrims Fund Board
University Hospitals University Malaya Medical Centre (UMMC)
University Kebangsaan Malaysia Hospital
University of Science Malaysia Hospital
University/Colleges University Malaya Student Health Clinic
University Malaya Student Counseling
University Technology MARA
International Islamic University Malaysia
University Kebangsaan Malaysia
University Putra Malaysia
University Malaysia Sarawak
APPENDIX TABLES

76HEALTH EXPENDITURE REPORT Revised Time Series (1997-2008) & Health Expenditure Report (2009)
PUBLIC SECTOR
Main Agencies Specific Organization
Other Public Sector National Population and Family Development
Health Department City Hall Kuala Lumpur
Local Authorities
Aborigines Hospitals and Clinics
The Council of Trust For The Indigenous People
Central Bank of Malaysia
Employee Provident Fund
Social Security Organization
National Heart Institute
Statutory Bodies (Federal/State)
Public Water Supply Department
National Sports Institute of Malaysia
Zakat Collection Centre
Conducted By Surveys/Studies
MOH National Health Morbidity Survey I,II & III
DOSHousehold Expenditure Survey 1998/1999
(Department of Statistic)
DOSNational Household Health Expenditure Survey
(NHHES)
DOS National Income Accounts
DOS Professional & Non-Professional Industry Surveys
Note : This list is non-comprehensive

MALAYSIA NATIONAL HEALTH ACCOUNTS77
TABLE A1: Sources of Data (cont.)
Samples of data sources from private sector used for estimation of MNHA.
PRIVATE SECTOR
Main Agencies Specific Organization
Associations Association of Private Hospitals of Malaysia (APHM)
Other private hospitals not members of APHM
Primary Care Doctor’s Organization Malaysia (PCDOM)
Insurance agencies Life Insurance Association of Malaysia (LIAM)
Private Insurance of Malaysia (PIAM)
National Insurance Association of Malaysia (NIAM)
Councils Malaysian Medical Council (MMC)
Malaysian Dental Council (MDC)
University/Colleges Private Medical & Nursing Schools
Other agencies Private Corporations Limited and Private Limited
No-Governmental Organization (NGO)
Intercontinental Medical Supply (IMS)
Managed Care Organization (MCO)
Foreign Medical Examination Monitoring Agencies (FOMEMA)
WHO, UNDP
Private Water Supply Department

78HEALTH EXPENDITURE REPORT Revised Time Series (1997-2008) & Health Expenditure Report (2009)
TABLE A2: Comparison of MNHA to SHA Framework (OECD 2000) with SHA Tables
The data in this document is reported using the MNHA framework. However, the revised data analysis was produced under dual coding and a set of tables showing the comparison of MNHA codes mapped to ICHA codes are shown for reference (Table A2.1a to Table A2.1c).This is followed by five SHA Tables (Table A3 to Table A7).
TABLE A2.1a : Classification of Total Expenditure on Health by Source of Financing
MNHA code ICHA code Sources of Funding Description
MS1 HF.1 Public Sector Refers to MS1.1 to MS1.2
MS1.1 HF.1.1 Public sector excluding social security fundsRefer to Federal Government, state government &
Local Authorities
MS1.2 HF.1.2 Social security funds SOCSO & EPF
MS2 HF.2 Private sector Refers to MS2
MS2.1 HF.2.1 Private social insurance Currently does not exits in Malaysia
MS2.2 HF.2.2Private insurance enterprises (other than social
insurance)Private Health Insurance
MS2.3 HF.2.2 Private MCOs and other similar entitiesRegistered MCO other than Private Health
Insurance
MS2.4 HF.2.3 Private household out-of-pocket expenditures Individual OOP spending on Health
MS2.5 HF.2.4 Non-profit organizations serving households Health - related - NGOs
MS2.6 HF.2.5 All Corporations (other than health insurance) Private Employer
MS9 HF.3 Rest of the world Rest Of the World

MALAYSIA NATIONAL HEALTH ACCOUNTS79
TABLE A2.1b : Classification of Total Expenditure on Health by Providers of Health Services
MNHA code ICHA code Providers of Health Services Description
MP1 HP.1 Hospitals Public & private hospitals
MP2 HP.2 Nursing and residential care facilitiesNursing care facilities including psychiatric care
facilities, residential for mental health, etc
MP3 HP.3 Providers of ambulatory health care
Establishments providing ambulatory health care
services directly to non-hospital setting, e.g.
medical practitioner clinics, dental clinics, etc
MP4 HP.4 Retail sale and other providers of medical goodsPharmacies & retail sale/suppliers of vision
products, hearing aids, medical appliances
MP5 HP.5Provision and administration of public health
programmes
Health prevention & promotion services (public &
private)
MP6 HP.6 General health administration and insurance
Overall administration of health (public & private)
& health insurance administration. (note: For MOH
it includes administration of HQ exclude public
health programs) State Health Dept., admin. cost
for hospitals management
MP7 HP.7 Other industries (rest of the Malaysian economy) Private occupational health care & home care etc.
MP8 HP.7.9 Institutions providing health related services Health training institutions (public & private)
MP9 HP.9 Rest of the worldnon - resident providers providing health care for
the final use residents of Malaysia

80HEALTH EXPENDITURE REPORT Revised Time Series (1997-2008) & Health Expenditure Report (2009)
TABLE A2.1c : Classification of Total Expenditure on health by Function of Health Services
MNHA code ICHA code Functions of Health Services Description
MF1 HC.1 Services of curative careCurative care provider at inpatient, outpatient,
daycare & homecare services
MF2 HC.2 Services of rehabilitative careRehabilitative care provider at inpatient, outpatient,
daycare & homecare services
MF3 HC.3 Services of long-term nursing careLong term nursing care provider at inpatient,
outpatient, daycare & homecare services
MF4 HC.4 Ancillary services to health careStand-alone laboratory, diagnostic imaging,
transport & emergency rescue, etc.
MF5 HC.5 Medical goods dispensed to out-patientsPharmaceuticals, appliances, western medicines,
TCM, etc
MF6 HC.6 Prevention and public health servicesHealth promotion, prevention, family planning,
school health services, etc
MF7 HC.7Health program administration and health
insurance
Administration at HQ, State health dept, local
authorities, SOCSO, EPF, private insurance, etc
MR1 HC.R.1Capital formation of health care provider
institutions
Administration at HQ, State health dept, local
authorities, SOCSO, EPF, private insurance, etc
MR2 HC.R.2 Education and training of health personnelGov & private provision of education and training
of health personnel, including admin, etc
MR3 HC.R.3 Research and development in health Research and development in health
MR9 HC.R.6 All other health-related expendituresCategory to capture all other expenditures that not
classified elsewhere in MNHA

MALAYSIA NATIONAL HEALTH ACCOUNTS81
TAB
LE A
3 ;-
Cur
rent
hea
lth
exp
end
itur
e b
y fu
ncti
on
of
care
, p
rovi
der
ind
ustr
y an
d S
our
ce o
f Fu
ndin
g, 2
009
(RM
Mill
ion)
Exp
endi
ture
cat
egor
y IC
HA
-HC
(Fun
ctio
n of
he
alth
car
e)
ICH
A-H
P (P
rovi
der
indu
stry
)
Total current expenditure on health
ICH
A -
HF
sour
ce o
f fun
ding
HF.
1 H
F.1.
1 H
F.1.
2 H
F.2
HF.
2.1
+ H
F.2.
2 H
F.2.
3 H
F.2.
4 H
F.2.
5 H
F.3
General government
General government (excl.social security )
Social security funds
Private sector
Private insurance
HF.
2.1
HF.
2.2
Private household out-of-pocket expenditure
Non-profit organizations serving households (Other than social insurance)
Corporation (other than health insurance)
Rest of the word
Private social insurance
Other private insurance
In-p
atie
nt c
are
incl
udin
g da
y ca
ses
A
ll in
dust
ries
Cur
ativ
e an
d re
habi
litat
ive
care
H
C.1
.1 ;
1.2
; 2.1
; 2.
2
10,
470
6
,738
6,63
9
98
3,73
3
1,18
7
1,1
87
2
,450
2
3
7
2
-
Gen
eral
hos
pita
ls
H
P.1.
1
9,7
79
6
,091
6,01
8
73
3,68
7
1,16
6
1,1
66
2
,450
0
71
Spe
cial
ity h
ospi
tals
HP.
1.2
+ 1
.3
539
5
35
535
4
4
4
Nur
sing
and
resi
dent
ial c
are
faci
litie
s
H
P.2
0
0
0
-
-
All
othe
r pr
ovid
ers
A
ll ot
her
152
1
12
86
2
6
41
17
1
7
23
1
Long
term
nur
sing
car
e H
C.3
.1 ;
3.2
All
indu
strie
s
1
18
13
0
1
3
105
1
1
104
0
-
-
Gen
eral
hos
pita
ls
H
P.1.
1
1
04
-
104
-
104
Spe
cial
ity h
ospi
tals
HP.
1.2
+ 1
.3
13
13
-
-
Nur
sing
and
resi
dent
ial c
are
faci
litie
s
H
P.2
14
13
0
13
1
1
1
0
All
othe
r pr
ovid
ers
A
ll ot
her
-
-
-
Out
-pat
ient
cur
ativ
e an
d re
habi
litat
ive
care
H
C.1
.3 ;
2.3
All
indu
strie
s
8,6
85
3
,341
3,33
5
6
5,
344
69
-
69
4
,918
4
3
315
-
Hos
pita
ls
H
P.1
4
,453
2,6
17
2,
615
2
1,83
6
5
0
50
1
,689
3
1
6
6
Offi
ces
of p
hysi
cian
s
HP.
3.1
3
,061
56
52
4
3,00
5
1
7
17
2
,733
1
1
243
Offi
ces
of d
entis
t
HP.
3.2
386
52
52
334
0
0
328
-
6
Offi
ces
of o
ther
hea
lth p
ract
ition
ers
H
P.3.
3
1
67
-
167
-
-
-
167
-
-
-
Out
-pat
ient
car
e ce
nter
s
HP.
3.4
616
6
16
616
0
-
-
-
-
-
-
-
-
Med
ical
and
dia
gnos
tic la
bora
torie
s
HP.
3.5
-
-
-
-
-
-
-
-
-
-
-
-
Oth
er p
rovi
ders
of a
mbu
lato
ry h
ealth
car
e
HP.
3.9
1
-
-
-
1
-
-
-
-
1
-
-
All
othe
r pr
ovid
ers
A
ll ot
her
1
0
0
0
1
1
-
1
-
-
-
-
Hom
e he
alth
car
e H
C.1
.4 ;
2.4
; 3.3
A
ll in
dust
ries
36
0
0
3
6
-
-
-
26
10
-
-
Anc
illary
ser
vice
s to
hea
lth c
are
HC
.4
All
indu
strie
s
8
68
250
25
0
0
618
0
0
408
9
2
01
Med
ical
goo
ds d
ispe
nsed
to o
ut-p
atie
nts
HC
.5
All
indu
strie
s
4,1
48
419
41
0
9
3,
730
0
-
0
3,6
72
43
15
-
Pha
rmac
eutic
als,
oth
er m
ed.n
on-d
urab
les
HC
.5.1
3
,155
3
71
371
0
2,78
4
0
-
0
2
,732
3
8
1
5
-
Pre
scrib
ed m
edic
ines
H
C.5
.1.1
1
,298
2
92
2
92
0
1,00
6
0
0
9
91
0
1
4
Ove
r th
e co
unte
r m
edic
ines
H
C.5
.1.2
1
,647
79
79
1,
569
-
1
,532
3
7
0
Oth
er m
edic
al n
on-d
urab
les
HC
.5.1
.3
2
10
0
0
-
20
9
-
2
09
Ther
apeu
tical
app
l.; o
ther
med
ical
dur
able
s H
C.5
.2
9
93
47
3
8
9
946
-
-
-
941
5
-
-
Gla
sses
and
oth
er v
isio
n pr
oduc
ts
HC
.5.2
.1
7
47
1
1
0
74
6
-
-
-
7
46
0
-
-
Ort
hope
dic
appl
ianc
es ;
othe
r pr
osth
etic
s H
C.5
.2.2
26
25
20
5
1
-
-
-
-
1
-
-
All
othe
r m
isc.
dura
ble
med
ical
goo
ds
HC
.5.2
.3 -
5.2
.9
2
20
21
1
7
4
199
-
-
-
195
5
-
-
Pre
vent
ion
and
publ
ic h
ealth
ser
vice
s H
C.6
A
ll in
dust
ries
1
,652
1,4
78
1,
476
2
17
4
-
-
26
1
4
134
-
Hea
lth a
dmin
istr
atio
ns a
nd h
ealth
insu
ranc
e H
C.7
A
ll in
dust
ries
3
,455
2,3
79
2,
374
5
1,07
5
77
7
7
77
8
22
3
6
7
0
Tota
l Cur
rent
exp
end
itur
e o
n H
ealt
h ca
re
HC
.1-H
C.7
A
ll in
dus
trie
s 2
9,43
2 1
4,61
7
1
4,48
4
134
1
4,81
5
2,03
4
-
2
,034
1
1,61
2
36
5
804
0

82HEALTH EXPENDITURE REPORT Revised Time Series (1997-2008) & Health Expenditure Report (2009)
TAB
LE A
3 ;-
Cur
rent
hea
lth
exp
end
itur
e b
y fu
ncti
on
of
care
, p
rovi
der
ind
ustr
y an
d S
our
ce o
f Fu
ndin
g, 2
009
(RM
Mill
ion)
Exp
endi
ture
cat
egor
y IC
HA
-HC
(Fun
ctio
n of
he
alth
car
e)
ICH
A-H
P (P
rovi
der
indu
stry
)
Total current expenditure on health
ICH
A -
HF
sour
ce o
f fun
ding
HF.
1 H
F.1.
1 H
F.1.
2 H
F.2
HF.
2.1
+ H
F.2.
2 H
F.2.
3 H
F.2.
4 H
F.2.
5 H
F.3
General government
General government (excl.social security )
Social security funds
Private sector
Private insurance
HF.
2.1
HF.
2.2
Private household out-of-pocket expenditure
Non-profit organizations serving households (Other than social insurance)
Corporation (other than health insurance)
Rest of the word
Private social insurance
Other private insurance
In-p
atie
nt c
are
incl
udin
g da
y ca
ses
A
ll in
dust
ries
Cur
ativ
e an
d re
habi
litat
ive
care
H
C.1
.1 ;
1.2
; 2.1
; 2.
2
10,
470
6
,738
6,63
9
98
3,73
3
1,18
7
1,1
87
2
,450
2
3
7
2
-
Gen
eral
hos
pita
ls
H
P.1.
1
9,7
79
6
,091
6,01
8
73
3,68
7
1,16
6
1,1
66
2
,450
0
71
Spe
cial
ity h
ospi
tals
HP.
1.2
+ 1
.3
539
5
35
535
4
4
4
Nur
sing
and
resi
dent
ial c
are
faci
litie
s
H
P.2
0
0
0
-
-
All
othe
r pr
ovid
ers
A
ll ot
her
152
1
12
86
2
6
41
17
1
7
23
1
Long
term
nur
sing
car
e H
C.3
.1 ;
3.2
All
indu
strie
s
1
18
13
0
1
3
105
1
1
104
0
-
-
Gen
eral
hos
pita
ls
H
P.1.
1
1
04
-
104
-
104
Spe
cial
ity h
ospi
tals
HP.
1.2
+ 1
.3
13
13
-
-
Nur
sing
and
resi
dent
ial c
are
faci
litie
s
H
P.2
14
13
0
13
1
1
1
0
All
othe
r pr
ovid
ers
A
ll ot
her
-
-
-
Out
-pat
ient
cur
ativ
e an
d re
habi
litat
ive
care
H
C.1
.3 ;
2.3
All
indu
strie
s
8,6
85
3
,341
3,33
5
6
5,
344
69
-
69
4
,918
4
3
315
-
Hos
pita
ls
H
P.1
4
,453
2,6
17
2,
615
2
1,83
6
5
0
50
1
,689
3
1
6
6
Offi
ces
of p
hysi
cian
s
HP.
3.1
3
,061
56
52
4
3,00
5
1
7
17
2
,733
1
1
243
Offi
ces
of d
entis
t
HP.
3.2
386
52
52
334
0
0
328
-
6
Offi
ces
of o
ther
hea
lth p
ract
ition
ers
H
P.3.
3
1
67
-
167
-
-
-
167
-
-
-
Out
-pat
ient
car
e ce
nter
s
HP.
3.4
616
6
16
616
0
-
-
-
-
-
-
-
-
Med
ical
and
dia
gnos
tic la
bora
torie
s
HP.
3.5
-
-
-
-
-
-
-
-
-
-
-
-
Oth
er p
rovi
ders
of a
mbu
lato
ry h
ealth
car
e
HP.
3.9
1
-
-
-
1
-
-
-
-
1
-
-
All
othe
r pr
ovid
ers
A
ll ot
her
1
0
0
0
1
1
-
1
-
-
-
-
Hom
e he
alth
car
e H
C.1
.4 ;
2.4
; 3.3
A
ll in
dust
ries
36
0
0
3
6
-
-
-
26
10
-
-
Anc
illary
ser
vice
s to
hea
lth c
are
HC
.4
All
indu
strie
s
8
68
250
25
0
0
618
0
0
408
9
2
01
Med
ical
goo
ds d
ispe
nsed
to o
ut-p
atie
nts
HC
.5
All
indu
strie
s
4,1
48
419
41
0
9
3,
730
0
-
0
3,6
72
43
15
-
Pha
rmac
eutic
als,
oth
er m
ed.n
on-d
urab
les
HC
.5.1
3
,155
3
71
371
0
2,78
4
0
-
0
2
,732
3
8
1
5
-
Pre
scrib
ed m
edic
ines
H
C.5
.1.1
1
,298
2
92
2
92
0
1,00
6
0
0
9
91
0
1
4
Ove
r th
e co
unte
r m
edic
ines
H
C.5
.1.2
1
,647
79
79
1,
569
-
1
,532
3
7
0
Oth
er m
edic
al n
on-d
urab
les
HC
.5.1
.3
2
10
0
0
-
20
9
-
2
09
Ther
apeu
tical
app
l.; o
ther
med
ical
dur
able
s H
C.5
.2
9
93
47
3
8
9
946
-
-
-
941
5
-
-
Gla
sses
and
oth
er v
isio
n pr
oduc
ts
HC
.5.2
.1
7
47
1
1
0
74
6
-
-
-
7
46
0
-
-
Ort
hope
dic
appl
ianc
es ;
othe
r pr
osth
etic
s H
C.5
.2.2
26
25
20
5
1
-
-
-
-
1
-
-
All
othe
r m
isc.
dura
ble
med
ical
goo
ds
HC
.5.2
.3 -
5.2
.9
2
20
21
1
7
4
199
-
-
-
195
5
-
-
Pre
vent
ion
and
publ
ic h
ealth
ser
vice
s H
C.6
A
ll in
dust
ries
1
,652
1,4
78
1,
476
2
17
4
-
-
26
1
4
134
-
Hea
lth a
dmin
istr
atio
ns a
nd h
ealth
insu
ranc
e H
C.7
A
ll in
dust
ries
3
,455
2,3
79
2,
374
5
1,07
5
77
7
7
77
8
22
3
6
7
0
Tota
l Cur
rent
exp
end
itur
e o
n H
ealt
h ca
re
HC
.1-H
C.7
A
ll in
dus
trie
s 2
9,43
2 1
4,61
7
1
4,48
4
134
1
4,81
5
2,03
4
-
2
,034
1
1,61
2
36
5
804
0
TAB
LE A
4: C
urre
nt e
xpen
dit
ure
on
Hea
lth
by
func
tio
n o
f ca
re a
nd p
rovi
der
ind
ustr
y, 2
009(
RM
Mill
ion
)
Hea
lth c
are
by fu
nctio
ns
ICHA - HC code
Total curent health expenditure
HP.1
HP.2
HP.3
HP.3.1
HP.3.2
HP.3.3
HP.3.4
HP.3.5
HP.3.6
HP.3.9
HP.4
HP.4.1
HP.4.2 - 4.9
HP.5
HP.6
HP.6.1
HP.6.2
HP.6.3
HP.6.4
HP.6.9
HP.7
HP.9
Hospitals
Nursing and residential care facilities
Providers of ambulatory health care
Offices of physicians
Offices of dentists
Offices of other health practitioners
out-patient care centres
Medical and dignostic laboratories
Providers of home health care services
Other providers of ambulatory health care
Retail and sale and other providers of medical goods
Dispensing chemist
All other sales of medical goods
Provision and administration of public health
General health administration and insurance
Government administration of health
Social security fund
Other social insurance
Other (private) insurance
All other providers of health administration
Other industries (Rest of the economy)
Rest of the world
In-P
atie
nt c
are
9
,838
9,
806
1
1
5
1
5
-
-
-
-
-
-
-
-
-
-
-
-
-
-
-
-
2
15
Cur
ativ
e an
d R
ehab
ilitat
ive
care
H
C.1
.1 ;
HC
.2.1
9
,740
9,
709
-
1
5
1
5
-
-
-
-
-
-
-
-
-
-
-
-
-
-
-
-
2
15
Lon
g-te
rm n
ursi
ng c
are
HC
.3.1
98
97
1
-
-
-
-
-
-
-
-
-
-
-
-
-
-
-
-
-
-
-
-
Ser
vice
of d
ay-c
are
750
616
1
3
121
22
-
-
99
0
-
-
-
-
-
-
-
-
-
-
-
-
-
-
Cur
ativ
e &
Reh
abilit
ativ
e ca
re
HC
.1.2
;2.2
730
609
0
12
1
2
2
-
-
9
9
0
-
-
-
-
-
-
-
-
-
-
-
-
-
-
Lon
g-te
rm n
ursi
ng c
are
HC
.3.3
7
1
3
-
-
-
-
-
-
-
-
-
-
-
-
-
-
-
-
-
-
-
-
Out
pat
ient
car
e
8,6
85
4,45
3
-
4,
231
3,
061
386
167
61
6
-
-
1
0
-
0
-
-
-
-
-
-
-
-
1
Cur
ativ
e an
d R
ehab
ilitat
ive
care
H
C.1
.3 :
2.3
36
3
5
-
1
-
-
-
-
-
-
1
-
-
-
-
-
-
-
-
-
-
-
Bas
ic m
edic
al a
nd d
iagn
osyi
c se
rvic
es
HC
.1.3
.1
5,0
08
1,33
5
-
3,
673
3,
057
-
-
616
-
-
-
-
-
-
-
-
-
-
-
-
-
-
1
Out
pat
ient
den
tal c
are
HC
.1.3
.2
4
01
1
4
38
7
1
386
-
-
-
-
-
-
-
-
-
-
-
-
-
-
-
-
All
othe
r dis
cipl
ine-
spec
ific
spec
ializ
ed c
urat
ive
care
H
C.1
.3.3
3
,051
3,
048
-
3
3
-
-
0
-
-
-
-
-
-
-
-
-
-
-
-
-
-
0
All
othe
r al
lied
heal
th o
utpa
tient
cur
ativ
e ca
re
HC
.1.3
.9 ;2
.3
1
89
2
2
16
7
-
-
167
-
-
-
-
0
-
0
-
-
-
-
-
-
-
-
-
Hom
e ca
re
36
26
1
0
-
-
-
-
-
-
-
-
-
-
-
-
-
-
-
-
-
-
-
-
Cur
ativ
e an
d R
ehab
ilitat
ive
care
H
C.1
.4 ;
2.4
8
8
-
-
-
-
-
-
-
-
-
-
-
-
-
-
-
-
-
-
Lon
g-te
rm n
ursi
ng c
are
HC
.3.3
29
18
1
0
-
-
-
-
-
-
-
-
-
-
-
-
-
-
-
-
-
-
Anc
illary
Ser
vice
s to
hea
lth c
are
868
315
-
48
3
4
6
0
134
-
1
99
-
10
4
-
-
-
-
-
-
-
-
-
-
7
0
-
Anc
illary
Ser
vice
s to
hea
lth c
are
HC
.4
3
15
483
46
0
1
34
199
10
4
-
-
-
-
-
-
-
-
-
-
7
0
Med
ical
goo
ds d
ispe
nsed
to o
utpa
tient
s
4,1
48
73
9
-
1,
067
-
0
1,0
64
2
-
-
0
2,3
43
1
,204
1,1
39
-
-
-
-
-
-
-
-
-
Pha
rmac
eutic
als
and
othe
r m
edic
al n
on-d
urab
les
HC
.5.1
5
,633
677
-
1,06
6
-
0
1
,064
1
-
-
-
1
,413
1,2
03
209
-
-
-
-
-
-
-
The
rape
utic
app
lianc
es a
nd o
ther
med
ical
dur
able
s H
C.5
.2
1,9
24
6
2
-
1
-
-
-
1
-
-
0
930
0
930
-
-
-
-
-
-
-
To
tal e
xpen
dit
ure
on
per
sona
l hea
lth
care
2
4,32
6
15,
955
2
5
5,
916
3,
143
386
1
,365
71
8
199
-
105
2
,343
1,2
04
1
,139
-
-
-
-
-
-
-
73
15
Pre
vent
ive
and
publ
ic h
ealth
ser
vice
sH
C.6
1,6
52
2
2
-
1,
184
138
247
-
79
8
-
-
0
-
-
-
445
1
-
-
-
-
1
0
-
Hea
lth a
dmin
istr
atio
n an
d he
alth
insu
ranc
eH
C.7
3,4
54
54
0
-
1
-
-
-
-
-
-
1
2
6
26
-
64
7
2,2
33
1
,169
5
-
7
11
347
8
-
To
tal c
urre
nt h
ealt
h ex
pen
dit
ure
29,
432
1
6,51
7
25
7,10
0
3,28
1
63
3
1,3
65
1,
516
1
99
-
10
5
2,3
68
1
,229
1,1
39
1,
092
2
,234
1,1
69
5
-
711
34
8
81
15

MALAYSIA NATIONAL HEALTH ACCOUNTS83
TAB
LE A
5:-
Tota
l hea
lth
exp
end
itur
e b
y p
rovi
der
ind
ustr
y an
d fi
nanc
ing
ag
ent,
200
9 (R
M M
illio
n)
H
F.1
HF.
1.1
HF.
1.2
HF.
2 H
F.2.
1 +
HF.
2.2
HF.
2.3
HF.
2.4
HF.
2.5
HF.
3
ICH
A C
ode
- H
P C
ode
Total current expenditure on
health
General government
General government excluding security
funds
Social security funds
Private Sector
Private insurance
HF.
2.1
HF.
2.2
Private household out-of-pocket expenditure
Non-profit organizations serving
households (Other than social insurance)
Corporation (other than health
insurance)
Rest of the word
Priv
ate
soci
al
insu
ranc
e O
ther
priv
ate
insu
ranc
e
Hea
lth c
are
good
s an
d se
rvic
es b
y pr
ovid
er in
dust
ry
Hos
pita
ls
HP.
1
16,
517
1
0,15
6
10,
082
75
6,36
1 1
,220
-
1
,220
4,9
72
3
1
1
37
-
Nur
sing
and
resi
dent
ial c
are
faci
litie
s H
P.2
25
13
0
13
11
1
-
1
11
Pro
vide
rs o
f am
bula
tory
hea
lth c
are
HP.
3
7,
100
2,00
4
1
,974
31
5,
096
22
-
22
4
,446
43
584
-
Offi
ces
of p
hysi
cian
s H
P.3.
1
3,
281
87
67
20
3,19
4
2
1
-
2
1
2,7
38
1
2
4
23
-
Offi
ces
of d
entis
ts
HP.
3.2
6
33
29
9
299
334
0
-
0
3
28
-
6
-
Offi
ces
of o
ther
hea
lth p
ract
ition
ers
HP.
3.3
1,36
5
-
1,36
5
-
-
-
1,3
65
-
0
-
out-
patie
nt c
are
cent
res
HP.
3.4
1,51
6
1,
494
1,4
83
10
22
1
-
1
-
22
-
-
Med
ical
and
dig
nost
ic la
bora
torie
s H
P.3.
5
199
36
36
-
163
0
-
0
-
9
155
-
Pro
vide
rs o
f hom
e he
alth
car
e se
rvic
es
HP.
3.6
-
-
-
-
-
-
-
-
-
-
Oth
er p
rovi
ders
of a
mbu
lato
ry h
ealth
car
e H
P.3.
9
105
89
89
0
17
0
-
0
16
1
-
-
Ret
ail a
nd s
ale
and
othe
r pr
ovid
ers
of m
edic
al g
oods
H
P.4
2,36
8
118
1
10
8
2,25
1
0
-
0
2,1
94
4
3
14
-
Dis
pens
ing
chem
ist
HP.
4.1
1,22
9
92
92
0
1,
137
0
-
0
1
,085
38
14
-
All
othe
r sa
les
of m
edic
al g
oods
H
P.4.
2 -
4.9
1,13
9
25
18
8
1,
114
-
-
-
1
,109
5
-
-
Pro
visi
on a
nd a
dmin
istr
atio
n of
pub
lic h
ealth
H
P.5
1,09
2
1,
077
1,0
76
2
14
-
-
14
0
Gen
eral
hea
lth a
dmin
istr
atio
n an
d in
sura
nce
HP.
6
2,
234
1,17
5
1
,170
5
1,
059
7
77
-
777
-
215
67
-
Gov
ernm
ent (
Exc
.Soc
ial i
nsur
ance
) H
P.6.
1
1,
169
1,16
9
1
,169
0
-
-
-
-
-
-
-
Soc
ial s
ecur
ity fu
nd
HP.
6.2
5
5
-
5
-
-
-
-
-
-
-
Oth
er s
ocia
l ins
uran
ce
HP.
6.3
-
-
-
-
-
-
-
-
-
-
-
Oth
er P
rivat
e in
sura
nce
HP.
6.4
-
-
7
11
7
11
-
711
-
-
-
-
All
othe
r pr
ovid
ers
of h
ealth
adm
inis
trat
ion
HP.
6.9
3
48
1
1
3
47
66
-
66
-
215
67
-
Oth
er in
dust
ries
(Res
t of t
he e
cono
my)
H
P.7
81
73
73
-
8
-
-
-
-
8
-
-
Occ
upat
iona
l hea
lth c
are
HP.
7.1
-
-
-
-
-
-
-
-
-
-
-
-
Priv
ate
hous
ehol
ds
HP.
7.2
-
-
-
-
-
-
-
-
-
-
-
-
All
othe
r in
dust
ries
as s
econ
dary
pro
duce
rs o
f hea
lth
care
H
P.7.
9
81
73
73
-
8
-
-
-
-
8
-
-
Res
t of t
he w
orld
H
P.9
15
1
0
0
15
-
1
4
1
Tota
l he
alth
exp
endi
ture
2
9,43
2
14,
690
1
4,55
6
13
4 1
4,82
3 2
,020
-
2
,020
1
1,62
6
372
804
0

84HEALTH EXPENDITURE REPORT Revised Time Series (1997-2008) & Health Expenditure Report (2009)
TAB
LE A
6:-
Cur
rent
hea
lth
exp
end
itur
e b
y p
rovi
der
ind
ustr
y an
d fi
nanc
ing
ag
ent,
200
8 (R
M M
illio
n)
IC
HA
Cod
e -
HP
Cod
e
Total current expenditure
on health
HF.
1 H
F.1.
1 H
F.1.
2 H
F.2
HF.
2.1
+ H
F.2.
2 H
F.2.
3 H
F.2.
4 H
F.2.
5 H
F.3
General government
General government excluding security
funds
Social security funds
Private Sector
Private insurance
HF.
2.1
HF.
2.2
Private household out-of-pocket expenditure
Non-profit organizations serving
households (Other than social insurance)
Corporation (other
than health insurance)
Rest of the word
Private social insurance
Other private insurance
Cur
rent
exp
endi
ture
on
Hea
lth c
are
Per
sona
l hea
lth c
are
serv
ices
HC
.1 -
HC
.3
19
,310
10
,092
9
,974
1
18
9,2
18
1,25
7
-
1,25
7
7
,497
77
387
-
In-p
atie
nt s
ervi
ces
9,8
38
6,2
41
6,2
10
3
2
3
,597
1,
172
-
1,
172
2,3
52
0
72
-
Day
car
e- s
ervi
ces
7
50
5
10
4
29
8
0
241
15
-
15
2
02
2
3
1
-
Out
-pat
ient
ser
vice
s
8
,685
3
,341
3
,335
6
5,3
44
6
9
-
6
9
4
,917
43
315
-
Hom
e ca
re-s
ervi
ces
36
0
0
-
36
-
-
-
26
1
0
-
-
Anc
illary
ser
vice
s to
hea
lth c
are
HC
.4
868
250
250
0
6
18
0
-
0
408
9
201
-
Med
ical
goo
ds d
ispe
nsed
to o
ut-p
atie
nts
HC
.5
4
,148
419
410
9
3,7
30
0
-
0
3
,672
43
1
5
-
Pha
rmac
eutic
als
and
othe
r med
ical
non
-dur
able
s H
C.5
.1
3
,155
371
371
0
2,7
84
0
-
0
2
,732
38
1
5
-
Ther
apeu
tic a
pplia
nces
and
oth
er m
edic
al
dura
bles
H
C.5
.2
993
47
38
9
946
-
-
-
9
41
5
-
-
Per
sona
l hea
lth c
are
serv
ices
and
goo
ds
HC
.1 -
HC
.5
24
,326
10
,760
10,
634
127
13
,565
1,
257
-
1,
257
11,5
78
128
6
03
-
Pre
vent
ive
and
publ
ic h
ealth
ser
vice
sH
C.6
1,6
52
1,4
78
1,4
76
2
174
-
-
-
26
1
4
1
34
-
Hea
lth a
dmin
istr
atio
n an
d he
alth
insu
ranc
eH
C.7
3,4
54
2,3
79
2,3
74
5
1
,075
777
-
7
77
8
223
67
0
Tota
l Cur
rent
Hea
lth
exp
end
itur
e
29
,432
14
,617
14,
484
134
14
,815
2,
034
-
2,
034
11,6
12
365
8
04
0

MALAYSIA NATIONAL HEALTH ACCOUNTS85
Tab
le A
7 :T
ota
l exp
end
itur
e o
n H
ealt
h, in
clud
ing
Hea
lth-
rela
ted
Fun
ctio
ns, 2
009
(RM
Mill
ion)
ICHA Code - HP Code
Total current expenditure on health
HF.
1H
F.1.
1H
F.1.
2H
F.2
HF.
2.1
+ H
F.2.
2H
F.2.
3H
F.2.
4H
F.2.
5H
F.3
General government
General government excluding security funds
Social security funds
Private Sector
Private insurance
HF.
2.1
HF.
2.2
Private household out-of-pocket expenditure
Non-profit organizations serving households (Other than social
insurance)
Corporation (other than health insurance)
Rest of the word
Private social insurance
Other private insurance
Hea
lth c
are
serv
ices
and
goo
ds b
y fu
nctio
n
Ser
vice
s of
cur
ativ
e an
d re
habi
litat
ive
care
HC
.1,H
C.2
19,1
6310
,078
9,97
410
49,
085
1,25
6-
1,25
67,
376
6638
7-
Ser
vice
s of
long
-ter
m n
ursi
ng c
are
HC
.314
713
013
133
1-
112
211
--
Anc
illary
Ser
vice
s to
hea
lth c
are
HC
.486
825
025
00
618
0-
040
89
201
-
Med
ical
goo
ds d
ispe
nsed
to o
ut-p
atie
nts
HC
.54,
148
419
410
93,
730
0-
03,
672
4315
-
Pha
rmac
eutic
als
and
othe
r med
ical
non
-dur
able
sH
C.5
.13,
155
371
371
02,
784
00
2,73
238
15-
Ther
apeu
tic a
pplia
nces
and
oth
er m
edic
al
dura
bles
HC
.5.2
993
4738
994
6-
--
941
5-
-
Per
sona
l med
ical
ser
vice
s an
d go
ods
HC
.1-H
C.5
24,3
2610
,760
10,6
3412
713
,565
1,25
7-
1,25
711
,578
128
603
-
Pre
vent
ive
and
publ
ic h
ealth
ser
vice
sH
C.6
1,65
21,
478
1,47
62
174
--
2614
134
-
Hea
lth a
dmin
istr
atio
n an
d he
alth
insu
ranc
eH
C.7
3,45
42,
379
2,37
45
1,07
577
777
78
223
670
Tota
l cur
ent e
xpen
ditu
re o
n he
alth
29,4
3214
,617
14,4
8413
414
,815
2,03
4-
2,03
411
,612
365
804
0
Gro
ss c
apita
l for
mat
ion
HC
.R.1
2,75
72,
754
2,75
4-
3-
--
3-
--
Tota
l exp
endi
ture
on
heal
th32
,189
17,3
7117
,237
134
14,8
182,
034
-2,
034
11,6
1536
580
40
Mem
oran
dum
item
s: F
urth
er h
ealth
rela
ted
func
tions
Edu
catio
n an
d tr
aini
ng o
f hea
lth p
erso
nnel
HC
.R.2
1,34
788
488
4-
463
--
-37
03
882
Res
earc
h an
d de
velo
pmen
t in
heal
thH
C.R
.350
4646
-3
--
-2
--
1
Food
, hyg
iene
and
drin
king
wat
er c
ontr
olH
C.R
.410
699
99-
7-
--
--
7-
Env
ironm
ent h
ealth
HC
.R.5
--
--
--
--
--
Adm
inis
trat
ion
and
prov
isio
n of
soc
ial s
ervi
ces
in
kind
to a
ssis
t liv
ing
with
dis
ease
HC
.R.6
--
--
--
--
--
--
Adm
inis
trat
ion
and
prov
isio
n of
hea
lth-r
elat
ed
cash
-ben
efits
HC
.R.7
--
--
--
--
--
--
Gra
nd to
tal
33,6
9218
,401
18,2
6713
415
,291
2,03
4-
2,03
411
,986
367
899
4

86HEALTH EXPENDITURE REPORT Revised Time Series (1997-2008) & Health Expenditure Report (2009)
Tab
le A
7 :T
ota
l exp
end
itur
e o
n H
ealt
h, in
clud
ing
Hea
lth-
rela
ted
Fun
ctio
ns, 2
009
(RM
Mill
ion)
ICHA Code - HP Code
Total current expenditure on health
HF.
1H
F.1.
1H
F.1.
2H
F.2
HF.
2.1
+ H
F.2.
2H
F.2.
3H
F.2.
4H
F.2.
5H
F.3
General government
General government excluding security funds
Social security funds
Private Sector
Private insurance
HF.
2.1
HF.
2.2
Private household out-of-pocket expenditure
Non-profit organizations serving households (Other than social
insurance)
Corporation (other than health insurance)
Rest of the word
Private social insurance
Other private insurance
Hea
lth c
are
serv
ices
and
goo
ds b
y fu
nctio
n
Ser
vice
s of
cur
ativ
e an
d re
habi
litat
ive
care
HC
.1,H
C.2
19,1
6310
,078
9,97
410
49,
085
1,25
6-
1,25
67,
376
6638
7-
Ser
vice
s of
long
-ter
m n
ursi
ng c
are
HC
.314
713
013
133
1-
112
211
--
Anc
illary
Ser
vice
s to
hea
lth c
are
HC
.486
825
025
00
618
0-
040
89
201
-
Med
ical
goo
ds d
ispe
nsed
to o
ut-p
atie
nts
HC
.54,
148
419
410
93,
730
0-
03,
672
4315
-
Pha
rmac
eutic
als
and
othe
r med
ical
non
-dur
able
sH
C.5
.13,
155
371
371
02,
784
00
2,73
238
15-
Ther
apeu
tic a
pplia
nces
and
oth
er m
edic
al
dura
bles
HC
.5.2
993
4738
994
6-
--
941
5-
-
Per
sona
l med
ical
ser
vice
s an
d go
ods
HC
.1-H
C.5
24,3
2610
,760
10,6
3412
713
,565
1,25
7-
1,25
711
,578
128
603
-
Pre
vent
ive
and
publ
ic h
ealth
ser
vice
sH
C.6
1,65
21,
478
1,47
62
174
--
2614
134
-
Hea
lth a
dmin
istr
atio
n an
d he
alth
insu
ranc
eH
C.7
3,45
42,
379
2,37
45
1,07
577
777
78
223
670
Tota
l cur
ent e
xpen
ditu
re o
n he
alth
29,4
3214
,617
14,4
8413
414
,815
2,03
4-
2,03
411
,612
365
804
0
Gro
ss c
apita
l for
mat
ion
HC
.R.1
2,75
72,
754
2,75
4-
3-
--
3-
--
Tota
l exp
endi
ture
on
heal
th32
,189
17,3
7117
,237
134
14,8
182,
034
-2,
034
11,6
1536
580
40
Mem
oran
dum
item
s: F
urth
er h
ealth
rela
ted
func
tions
Edu
catio
n an
d tr
aini
ng o
f hea
lth p
erso
nnel
HC
.R.2
1,34
788
488
4-
463
--
-37
03
882
Res
earc
h an
d de
velo
pmen
t in
heal
thH
C.R
.350
4646
-3
--
-2
--
1
Food
, hyg
iene
and
drin
king
wat
er c
ontr
olH
C.R
.410
699
99-
7-
--
--
7-
Env
ironm
ent h
ealth
HC
.R.5
--
--
--
--
--
Adm
inis
trat
ion
and
prov
isio
n of
soc
ial s
ervi
ces
in
kind
to a
ssis
t liv
ing
with
dis
ease
HC
.R.6
--
--
--
--
--
--
Adm
inis
trat
ion
and
prov
isio
n of
hea
lth-r
elat
ed
cash
-ben
efits
HC
.R.7
--
--
--
--
--
--
Gra
nd to
tal
33,6
9218
,401
18,2
6713
415
,291
2,03
4-
2,03
411
,986
367
899
4
1 STEERING COMMITTEE
• Co-Chairman(i) Secretary General, Ministry of Health Malaysia(ii) Director General of Health Malaysia
• Secretariat
Malaysia National Health Accounts Unit, Planning & Development Division, Ministry of Health Malaysia
• Members
Ministry of HealthMinistry of FinanceCentral Bank of MalaysiaDepartment of StatisticsEconomic Planning Unit, Prime Minister’s DepartmentPublic Services Department of MalaysiaAccountant-General’s DepartmentMinistry of Home AffairsMinistry of Higher EducationMinistry of Human ResourcesMinistry of Housing and Local GovernmentMinistry of DefenceMinistry of Rural and Regional DevelopmentMinistry of Women, Family and Community DevelopmentDepartment of Occupational Safety and HealthHealth and Environment Department, Kuala Lumpur City HallEmployees Provident Fund Social Security OrganizationMalaysian Medical AssociationAssociation of Private Hospitals of MalaysiaPrimary Care Doctors’ Organization MalaysiaFederation of Private Medical Practitioners Association of MalaysiaMalaysian Employers Federation
2 MNHA SECRETARIAT
(Current staff – Technical and Support staff)Dr. Jameela Binti ZainuddinDr. Noryati Binti Yusof @ AtanPn. Kamsiah Binti Hj. NawiSister Ng Siew LuanPn. Rohaini Binti HasimPn. Salina Binti ShafiiEn. Hishamudden Bin AliasPn. Marina Binti TalibCik Hasinah Binti Abu Hasan
MNHA COMMITTEES AND MEMBERS

MALAYSIA NATIONAL HEALTH ACCOUNTS87
Pn. Noriza Binti Ab RahmanCik Wahidah Binti WahabCik Dolly AdamPn. Nor Aslinda Waty Binti Rozikin
• (Previous MNHA staff)Dr. Siti Aishah Binti AbdullahPn. Rosmaria Binti SallehCik Nurliyana Binti MohamadCik Nur Shazana Binti AzharCik Nur Aisyah Binti Abu BakarCik Nor Amirah Binti HamidCik Nazatul Afirah Binti SazaliPn. Za’ebah Binti IsmailCik Siti Mezatu Ekma Binti Mohd NoorPn. Siti Fatimah Binti AzahariEn. Zaifulnizam Bin Abd Karim
3 REPORT EDITORIAL COMMITTEE
Publication Editor: Dr. Jameela Binti Zainuddin
• Editorial Board Members:Dr. Noryati Binti Yusof @ AtanSister Ng Siew LuanPn. Salina Binti ShafiiEn. Hishamudden Bin AliasPn. Rohaini Binti HasimPn. Kamsiah Binti Hj. Nawi
• Secretariat:Pn. Marina Binti TalibCik Hasinah Binti Abu Hasan

88HEALTH EXPENDITURE REPORT Revised Time Series (1997-2008) & Health Expenditure Report (2009)

MALAYSIA NATIONAL HEALTH ACCOUNTS89