Embed Size (px)
Citation preview

© TransGraph Consulting Pvt Ltd Slide© TransGraph Consulting Pvt Ltd SlideJune 07 2012
“Economic crisis, Price volatility and Indonesian tax structure” – way forward
By Nagaraj Meda,
Managing Director, TransGraph Consulting Pvt Ltd
BrandsTransGraphTransGraph Research Consulting TechnologyResearch Consulting Technology
Commodities CurrenciesCommodities Currencies
Malaysia –
India POTS 2012

© TransGraph Consulting Pvt Ltd Slide© TransGraph Consulting Pvt Ltd Slide
Global Economy and Currency outlook
2

© TransGraph Consulting Pvt Ltd Slide© TransGraph Consulting Pvt Ltd Slide
US Economy –
Comparatively Better off than RoW
Industrial Production has been steady during the last 2 quarters while Unemployment rate – worrisomeOperation Twist shall come to an end on June 30 and speculations are growing over its extension. Persistent higher unemployment rate is worrying the policy makers, doors remain wide open for QE3 (extension of Operation Twist) keeping in view the Presidential elections (due on 6th Nov 2012).
US to do better than RoW (Rest of World) in terms of change in growth rates
3

© TransGraph Consulting Pvt Ltd Slide© TransGraph Consulting Pvt Ltd Slide
Sovereign debt concerns. High chances of Greece exiting the Euro Zone in coming couple of quartersSpain’s banking crisis came afresh sending tremors across the global financial markets.Changing political dynamics – towards anti austerity might lead to Partial implementation of austerity High unemployment – A major concernEuro Zone to go through recessionary pressures atleast for next 2‐3 quarters
4
EU Economy –
Worrying for the World

© TransGraph Consulting Pvt Ltd Slide© TransGraph Consulting Pvt Ltd Slide
Chinese economy cooling off as can be seen from the IP growth rates. Even during the Global Financial Crisis, IP growth was near 13%
The positive signals – Inflation cooling off, high possibility of stimulus (anywhere btw $200‐300 billion), interest rate cycle peaked so cut may be expected.
5
China –
Tremors in Growth Trajectory

© TransGraph Consulting Pvt Ltd Slide© TransGraph Consulting Pvt Ltd Slide
Preferred Elliott Wave Count on EURUSD Spot–
Long term
6

© TransGraph Consulting Pvt Ltd Slide© TransGraph Consulting Pvt Ltd Slide
Rupee depreciation causing ripples in the spine of policy makers and importersRising Inflation and declining IP Growth may change the investors’ perceptionIf recent numbers are any indication, GDP growth below 6.5% for 2012‐13 should not be a big surprise
7
India –
Traversing through Rough Phase

© TransGraph Consulting Pvt Ltd Slide© TransGraph Consulting Pvt Ltd Slide
Preferred Elliott wave Count on USDINR Spot–
Long term
8

© TransGraph Consulting Pvt Ltd Slide© TransGraph Consulting Pvt Ltd Slide
Indonesian Policy Revisions
9

© TransGraph Consulting Pvt Ltd Slide© TransGraph Consulting Pvt Ltd Slide
Revised Tax Structure –
In Brief
10
CPO export tax range has been revised to 7.5% to 22.5% (Earlier it was 1.5% to 25% based on CIF Rotterdam price ranges).The reference price (base export price) for crude palm oil will be calculated base on average prices at Rotterdam, Bursa Malaysia Derivatives or the Jakarta Bourse. (Earlier the same was based on mere CPO CIF Rotterdam prices) The export tax cap on palm oil Olein products (downstream) was cut to 13 percent (Earlier the same was 25 percent)
CIF Rot Price
($/ton)
Effective tax range ($/ton)
Earlier Revised Net tax change
750 ‐1000 22 ‐100 56‐135 36.4 ‐
38.5
1001‐1100 125 ‐165 150‐181.5 20.4 ‐
21.4
1100 ‐1150 192 ‐200 198 ‐207 5.5 ‐5.75
1150‐1250 230‐280 235‐262 ‐12
>1250 312.5 281.25 ‐31.25
In absolute terms, when CIF Rotterdam prices are reigning in the range of $ 750 ‐1000, industry shall end up paying a higher tax of $ 36‐38 With further increase in market and price volatility as the prices soar higher beyond MYR 3750 (>$1250/ton), industry players shall gain advantage from the present scenario by paying a lower tax of $30 from the
present levels

© TransGraph Consulting Pvt Ltd Slide© TransGraph Consulting Pvt Ltd Slide 11
Global Palm –
In A Glimpse
In the next 3 Years, World shall be supplied with another 5MT of Palm Oil with
INDONESIA accounting for nearly 65% of this Growth
Always palm Supplies outpaced that of Demand resulting in a
continuous Stock Piling.As such Industry is inadvertently building
Supply Side Risk
With Such Supply Side Equation, lets’ now look at How the Demand Component transforms, Given the recent Indonesian Export Tax Revisions!!!
Global Palm Oil Scenario ‐ In a Nut Shell (MT)
20
25
30
35
40
45
50
55
2001‐02 2003‐04 2005‐06 2007‐08 2009‐10 2011‐12e
2
2.5
3
3.5
4
4.5
5
5.5
6Stocks Production Consumption
S-D Gap Intact Stocks on Continuous Rise
Risk is Inbuilt
Source: USDA ; Year ‐ Oct ‐ Sep
Way Forward ‐ Palm Oil Supply Projections (MT)
28.8
25.4
23.6
20.518.0
17.6 17.318.2 18.7
19.4
15
17
19
21
23
25
27
29
31
2007‐08 2008‐09 2009‐10 2010‐11 2011‐12e 2012‐13 2013‐14 2014‐15
Indones ia Malays ia
Source: USDA, TG Research; Year ‐Oct ‐ Sept
© TransGraph Consulting Pvt Ltd Slide© TransGraph Consulting Pvt Ltd Slide 12
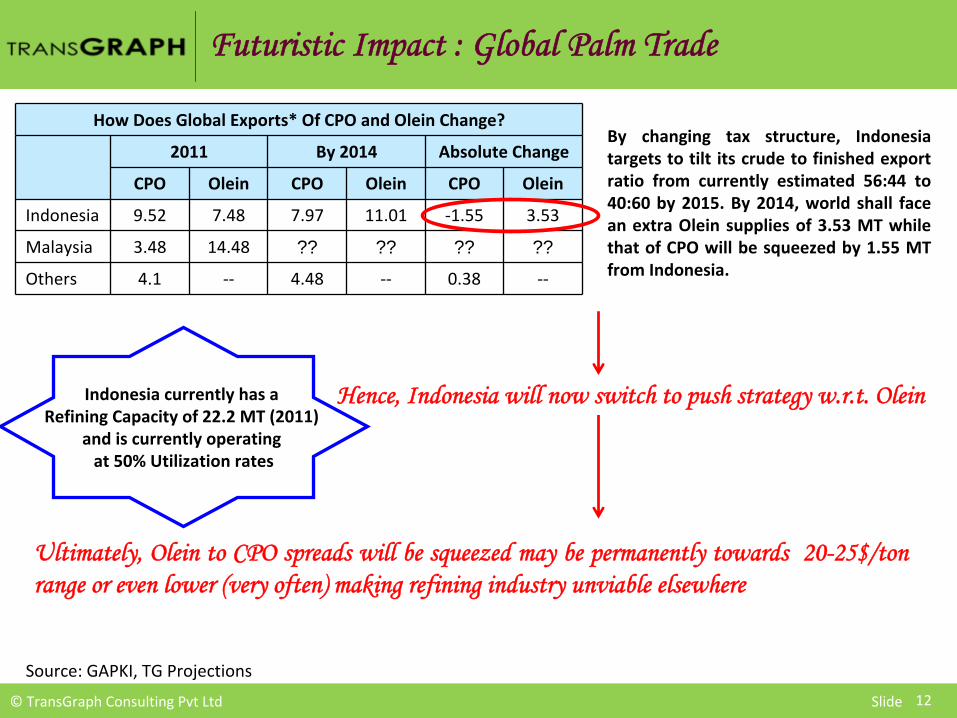
Futuristic Impact : Global Palm Trade
Ultimately, Olein
to CPO spreads will be squeezed may be permanently towards 20-25$/ton range or even lower (very often) making refining industry unviable elsewhere
How Does Global Exports* Of CPO and Olein
Change?
2011 By 2014 Absolute Change
CPO Olein CPO Olein CPO Olein
Indonesia 9.52 7.48 7.97 11.01 ‐1.55 3.53
Malaysia 3.48 14.48 ?? ?? ?? ??
Others 4.1 ‐‐ 4.48 ‐‐ 0.38 ‐‐
By
changing
tax
structure,
Indonesia
targets
to
tilt
its
crude
to
finished
export
ratio
from
currently
estimated
56:44
to
40:60
by
2015.
By
2014,
world
shall
face
an
extra
Olein
supplies
of
3.53
MT
while
that
of
CPO
will
be
squeezed
by
1.55
MT
from Indonesia.
Hence, Indonesia will now switch to push strategy w.r.t. OleinIndonesia currently has a Refining Capacity of 22.2 MT (2011)
and is currently operating at 50% Utilization rates
Source: GAPKI, TG Projections

© TransGraph Consulting Pvt Ltd Slide© TransGraph Consulting Pvt Ltd Slide
Implications to Stake Holders
13

© TransGraph Consulting Pvt Ltd Slide© TransGraph Consulting Pvt Ltd Slide 14
Malaysian refining industry shall now have intensified competition as Indonesia attempts to create market for itself.
More than pure refining industry, high degree value added industries viz. Specialty fats, Oleo Chemicals of Malaysia need to share its clientele base with the new supplier.Depreciation of MYR against USD from 2.99 to 3.2 (by 7%) since Mar’12 has temporarily rescued Malaysian Refining industry.
Indian Olein industry cannot compete with foreign originating cheaper oil.Vanaspati or modernly called IE fat industry shall have squeezed supply of feed stock – so in long‐run the industry shall become non‐economicalSpecialty fats and Oleo industries that are in nurturing stage too shall need policy support as higher feed stock prices might curtail their profitsAs such consolidation shall pick‐up pace apart from operating rates falling down sharply.
Indonesia Export tax restructuring –
Effects could be Seismic in nature
These are few to state, while given palm industry’s sheer size, ripple effects could be uncountable`
MALAYSIA INDIA
In addition, nations like Netherlands, Egypt, Saudi Arabia which are sole CPO importers too face similar crisis of their domestic refining industry.Countries like China who are RBD Olein importers have a price advantage with Indonesia’s competitive price quotes
Processing Cost MYR 75/ton Processing Cost INR 20/10 Kg

© TransGraph Consulting Pvt Ltd Slide© TransGraph Consulting Pvt Ltd Slide
India
15

© TransGraph Consulting Pvt Ltd Slide© TransGraph Consulting Pvt Ltd Slide 16
India –
Backbone for world palm industry
Since
2005,
Indian
Palm
consumption
grew
@
CAGR
of
16%
vs.
its
cumulative
veg.
oil
demand surge of 2.9%
Against
China
– 4%
of
palm
vs.
5.1%
total veg. oils
Of
the
total
world
palm
incremental
consumption of 15.8 MT, India accounted
for 29%.
Source: USDA, MPOB & TG Research; All units in MT
Hypothetically,
if
Indian
consumption
grew
only
by
10%,
then
global
stocks
could
have
been higher by another 2.2. MT.
Else
Industry
as
such
might
have
shown
lopsided
growth
Leading Palm Oil Importers -2005-06
India11%
China19%
Other42%
EU-2716%
Pakistan7%
Malaysia3%
Egypt2%
Source: USDA, TG Research
Leading Palm Oil Importers -2010-11
Egypt3%Malaysia
4%
Pakistan6%
EU-2714%
Other37%
China17%
India19%

© TransGraph Consulting Pvt Ltd Slide© TransGraph Consulting Pvt Ltd Slide
Policy driven Indian palm demand
17
World Palm industry should be thankful to Indian policy makers for opening a great market
for ever growing SE Asian palm producers
Indian Palm Import Trends ‐ CPO to Olein Mix (% share)
93 85 83 78
24
15 17 22
0
20
40
60
80
100
2002‐03 2005‐06 2008‐09 2011‐12e
CPO RBD
Higher Tari ffs Period
Nov ‐ Oct
MT
Indian Palm Import Trends ‐ CPO to Olein Mix
01234
5678
2002‐03 2005‐06 2008‐09 2011‐12e
RBD CPO Total Palm
Nov‐Oct
Policy Driven Demand Curve Shifts during 2008
MT
Indian Import Scenario ‐
2011‐12
CPO RBD Olein
Nov‐Apr 2.49 (15) 0.92 (89)
Nov‐Oct* 5.78 (7.6) 1.62 (50)
* TG Estimates; Units in MT; (y‐o‐y % change)
Constructive
policy
change
of
Zero
duty
on
CPO
and
just
7.5%
on
Olein
during
2008
has
come
to
the
rescue
of
palm
trade,
while
the
current
Indonesian
policy is restricting the opportunities.
So
far
Indian
Imports
have
already
replicated
the
repercussions
with
RBD
Olein
imports
so
far
recorded 89% higher on yearly basis

© TransGraph Consulting Pvt Ltd Slide© TransGraph Consulting Pvt Ltd Slide
Inflation –
A Check for Edible Oil Import Policies
18
Tremors
in
growth
rate
of
Indian
Economy,
coupled
with
relatively
higher
inflation
during
the
recent past shall keep a tab on policy revisions of Indian edible oil industry in the near term
Now let us look at Anatomy of Indian Edible oil Consumption and Chief problems of Indian Industry!!!
5.0
6.0
7.0
8.0
9.0
10.0
3.0
4.0
5.0
6.0
7.0
8.0
9.0
10.0
2007‐08 2008‐09 2009‐10 2010‐11 2011‐12
Annual Inflation Rate (WPI)
GDP Growth RateSource: RBI
Indian GDP and Inflation Trend

© TransGraph Consulting Pvt Ltd Slide© TransGraph Consulting Pvt Ltd Slide
Anatomy of Edible Oil Consumption Patterns
Hinterland of Kandla
Palm oil 33%
Soy oil 25%
Mustard oil 22%
Cottonseed oil 6%
GNO 4%
Hinterland of Haldia
Palm oil 31%
Soy oil 11%
Mustard oil 41%
Hinterland of JNPT +
Mangalore
Palm oil 36%
Soy oil 23%
Cottonseed oil 7%
GNO 9%
Sun oil 14%
Hinterland of Kakinada
Palm oil 38%
Soy oil 11%
Cottonseed oil 12%
GNO 12%
Sun oil 12%
Hinterland of Chennai
Palm oil 49%
GNO 4%
Sun oil 16%
19

© TransGraph Consulting Pvt Ltd Slide© TransGraph Consulting Pvt Ltd Slide
Indian Refining Industry -
South based refiners are bad hit
20
Capacity Utilization Across Hinterlands
Hinterland Kandla Haldia JNPT
and
Mangalore
Kakinada
+ 60%
of k’patnam
Chennai + 40%
Krishnapatnam
Total
palm
Refining
capacity
(TPD)
9562 5695 4680 6750 4600
Per
Year
(300 days) MMT
2.869 1.709 1.404 2.025 1.380
CPO
arriving
at
port (MMT)
1.824 1.088 0.953 0.74 0.57
Utilization 64% 64% 68% 37% 41%Source: SEA of India and TG field survey (2010)
With
Krishnapatnam
coming
in,
South
Indian
operating
rates
dropped
precipitously
and
with
Indonesian
tax
changes, the industry could be
pushed to “Un‐viable”
West & East based refiners too
shall undergo stress tests.
This happens for two reasons
1.
LOW CAPACITY UTILIZATION ‐
Already suffering with low capacity utilization and so if these rates further reduce,
it is only killing
2.
ABSENCE OF DOWNSTREAM INDUSTRIES ‐
Value addition stops mostly at Olein
level, hence leveraging from high
profit making specialty fats, vanaspati
and refining of other edible oils is absent
Our Study shows that, Indian players earn very high double digit
margins in value added downstream products while the same would be mere 2% in RBD olein
refining

© TransGraph Consulting Pvt Ltd Slide© TransGraph Consulting Pvt Ltd Slide
Indian Refining Industry -
West & East based refiners are better placed
21
Why??
Highly leveraged due to multi oil refining avenues
These regions account for 75% of biscuit & confectionary industries and more than 80% of Vanaspati (vegetable oil hard fat) making. 80% of the feedstock used in these industries is stearin.
80% of Oleo industry is located in North and West India providing good scope for offloading byproducts
Hence, those CPO refiners who don’t have high end value addition facilities in place, will be FIRST to hit. While drilling it region wise, South Indian units are badly effected.

© TransGraph Consulting Pvt Ltd Slide© TransGraph Consulting Pvt Ltd Slide
Indian Price Spreads
22

© TransGraph Consulting Pvt Ltd Slide© TransGraph Consulting Pvt Ltd Slide 23
Olein
–
CPO spread squeezing will be the biggest pain point for the industry
Now
the
industry
is
worried
that,
in
the
rush
of
market making, Indonesia will pressurize Olein
prices
and hence the spreads between the oils will become
a “Permanent Business Risk”.
Typically Indian industry will now turn more speculative –
i.e. emphasize more on price views to ensure margins required to run the business units –
like the case of Indian soy crush industry or industry players will move up the chain.
CNF Olein
–
CPO spread is quoting around 20$/ton.Narrowed Spreads with the advent of Indonesian Tax revisions
0
20
40
60
80
100
120
140
Jan‐11 Apr‐11 Jul‐11 Oct‐11 Jan‐12 Apr‐12
RBD‐CPO spread (CNF India)$/ton
‐1500
‐1000
‐500
0
500
1000
1500
2000
2500
Jun‐11 Aug‐11 Oct‐11 Dec‐11 Feb‐12 Apr‐12
Indian Soybean Crush Margins (INR/ton)

© TransGraph Consulting Pvt Ltd Slide© TransGraph Consulting Pvt Ltd Slide
Current Market Fundamentals -
Outlook
24

© TransGraph Consulting Pvt Ltd Slide© TransGraph Consulting Pvt Ltd Slide
Global Weather –
In a Glimpse
Rapeseed belts of EU, Delta tracts of US (which is yet to plant soybeans) and Indian KharifSeason (Which accounts for nearly 60% of Indian oilseed production) remain watchful in 1‐2 months.
Alarming for Oilseed Crops

© TransGraph Consulting Pvt Ltd Slide© TransGraph Consulting Pvt Ltd Slide
US Spring Crops –Looming Dryness for Jun-July Months
Weather models forecast for persisting dry conditions with above normal temperatures for Jun‐July.Dryness in Southern belts to augment worries over planting soybeans post Winter Wheat Harvest.
*Water availability to Agriculture

© TransGraph Consulting Pvt Ltd Slide© TransGraph Consulting Pvt Ltd Slide
Soybeans: Tighter Balance Sheets –
Threatening Weather –
Turn around Caveats for Markets
US shall don the role of “Rescuer” for rest of the season with SA sidelining from Global trade, amidst limited supplies along with increased emphasis on domestic crush.Argentinean B10 norms of Biodiesel and corresponding B7 at Brazil remain the moot point of higher diversion to crush vis‐à‐vis exports.Indicative that demand is purely across the producing belts and stagnant across consumption regions.
Global Soybean Crush (Apr‐Aug)
2011 2012 Abs Change
Brazil 17.30 16.96 ‐0.35
Argentina 17.31 16.93 ‐0.38
US 17.38 17.74 0.36
Paraguay 0.78 0.70 ‐0.08
G‐4 52.77 52.33 ‐0.44
Source: TG Estimates; MT
Global Soybean Exports (Apr‐Aug)
2011 2012 Abs Change
Brazil 22.38 20.98 ‐1.40
Argentina 6.73 6.15 ‐0.59
US 5.98 9.48 3.50
Paraguay 3.19 1.56 ‐1.63
G‐4 38.29 38.17 ‐0.12
Source: TG Estimates; MT
Dry weather forecasts for Jun-July and tighter balance sheets of CY beans suggest for impending optimism in Soy complex in the weeks ahead while demand remains watchful.

© TransGraph Consulting Pvt Ltd Slide© TransGraph Consulting Pvt Ltd Slide
Palm Complex –
Disappointing FFB Yields; OER close to Normality
28
FFB reduction – a major contributor for production decline so far in 2012.Seasonal Recovery on cards for Q2‐Q3.Thus, monthly CPO output at Malaysia to improve towards 1.48‐1.5 MT in June‐July. (1.27 MT in April’12)Overall Malaysian CPO output for 2012 to stay close to 18.5 MT, down by 2% Y‐o‐Y while Indonesian CPO output might remain 5‐6% higher around 25.8 MT.
TG Estimates

© TransGraph Consulting Pvt Ltd Slide© TransGraph Consulting Pvt Ltd Slide
Global Veg. Oil B/S –
Stunted Supply Growth to Eat away the Carry-in for Next Season
29
Rich supplies of Palm from SE Asia during 2011 (11.3% higher production from Malaysia and 10% from Indonesia) translated into ample carry‐in for 2012 season.Lower availability of Rapeseed and Soy oils to augur the demand for palm oil during 2012.Global veg oil stocks to steeply plunge towards 10.2 MT, 12.5% drop on yearly basis
Global Veg. Oil S'n'D Dynamics (MT)
4.4
1.4
3.0 2.62.30.9
2.72.0
0.5
‐0.7
0.5
‐0.6
‐0.1
2.1
‐0.1
1.7
8.1
4.2
6.86.2
‐2.0
0.0
2.0
4.0
6.0
8.0
2010‐11 2011‐12e 2010‐11 2011‐12e
Incrementa l Suppl ies Incrementa l Demand
Palm oil Soy oil Rape oil Sun oil Total
Falling Supplies while relatively firm demand to eat away into stocks
Source: TG Research, USDA
Global Edible Oil Stocks (MT)
1.5
4.2
4.7
4.7
4.2
2.43.03.03.8
0.60.91.1
0.5
1.31.7
0.7
10.211.7
12.9
0.0
1.0
2.0
3.0
4.0
5.0
6.0
7.0
2006‐07 2007‐08 2008‐09 2009‐10 2010‐11 2011‐12e
0
2
4
6
8
10
12
14
Palm oi l Soy oi l Rape oi l Sun oi l Tota l

© TransGraph Consulting Pvt Ltd Slide© TransGraph Consulting Pvt Ltd Slide
Indian Kharif
Crop Prospects –
2012-13
30

© TransGraph Consulting Pvt Ltd Slide© TransGraph Consulting Pvt Ltd Slide
Indian Ocean Dipole -
Keen for SW Monsoons
Indian Ocean Dipole (IOD)
movements measured by IOD Index
stands as crucial indicator for SW
Monsoons for Indian Sub‐Continent.
Negative IOD Suggests
for Drought conditions
with limited
precipitation
Global Weather models suggest
for Negative IOD to prevail
through Jun‐Jul’12 which might
be worrying for SW Monsoon
prospects
POAMA – Predictive Ocean Atmospheric Model for Australia
Warning Signals

© TransGraph Consulting Pvt Ltd Slide© TransGraph Consulting Pvt Ltd Slide 32
Kharif
Plantings –
Soybean and GN to Steal the Show
Price Realization (% Change) during Mar‐May’12 vs.
same period LY – MINOR CEREALS
Higher prices realizations for oilseeds to translate into higher acreages this yearCotton to lose some acres to better performing Soybeans and GNPulses and cereals to face stiff competition from oilseeds owing to poor returns.
Price Realization (% Change) during Mar‐May’12 vs.
same period LY – PULSES
Price Realization (% Change) during Mar‐May’12 vs.
same period LY – OILSEEDS

© TransGraph Consulting Pvt Ltd Slide© TransGraph Consulting Pvt Ltd Slide 33
Indian Kharif
Oilseed Sowing –
2012-13 -
Preliminary Estimates
Cumulative Oilseeds acres could go up by 11 lakh
ha, primarily due to soybeans and GN adding around 9 and 5 lakh
ha respectively, while Cotton could drop by
2.8 lakh
ha

© TransGraph Consulting Pvt Ltd Slide© TransGraph Consulting Pvt Ltd Slide
BMD CPO Futures Cont, MYR/MT, Elliott Wave
34
BMD Palm oil futures prices are retracing back upon honoring a crucial level at MYR 3620. According to Elliott wave analysis prices are running as the Primary wave C of Cycle wave 2. Although initial gains are expected, potential of such gains could remain limited above MYR 3300/3350. Subsequently prices could extend lower towards MYR 2500 remains open in the coming 2-3 months ahead of turning higher.

© TransGraph Consulting Pvt Ltd Slide© TransGraph Consulting Pvt Ltd Slide
BMD CPO Futures Cont, MYR/MT, Elliott Wave Count…(Short term)
35
Prices to bounce initially to 3200 MYR and shall turn to bearish mode towards 2750 and eventually to 2500 MYR in long-run. However, in the event of unexpected stimulus packages from US and EU, prices could stench short-term bounce to MYR 3350/3400 and turn lower from there

© TransGraph Consulting Pvt Ltd Slide© TransGraph Consulting Pvt Ltd Slide
BMD CPO Futures Cont, Cycle Analysis
36
In BMD CPO futures prices a 4-year cyclicality is been observed as shown above. According to the same come Oct’12 prices are likely to place a major bottom and enter a fresh bull run.

© TransGraph Consulting Pvt Ltd Slide© TransGraph Consulting Pvt Ltd Slide
CME Soyoil
Futures Cont, cents/lbs, Elliott Wave
37
CME soyoil futures prices are considered to be stretching lower as the Primary wave C of Cycle wave 2 according to Elliott wave analysis. Within the same prices could target 43 cents in the coming 2-3 months ahead of turning higher. Potential of upside above 54 cents seems limited.

© TransGraph Consulting Pvt Ltd Slide© TransGraph Consulting Pvt Ltd Slide 38
NCDEX Soy Oil Futures Cont, INR/10 Kg
NCDEX Soy Oil Futures prices have witnessed a setback from INR 790 and weakened towards INR 710 finding follow through selling. Possibility of initial gains towards INR 760 could be seen ahead of such extended weakness in the coming month. In the medium term extended weakness towards INR 650 shall remain open.

© TransGraph Consulting Pvt Ltd Slide© TransGraph Consulting Pvt Ltd Slide 39
NCDEX Soybean Futures Cont, INR/Qtl.
NCDEX Soybean futures prices are forming a triangle while hovering mixed within INR 3250-3450 as the overall weakness from the May’12 high of INR 3785 is intact. While the existing consolidation is seen as an upside correction , prices upon a retest of INR 3450 shall attract good renewed selling pressure to turn lower and prompt extension of the underlying weakness towards INR 3000 and lower in the coming months.

© TransGraph Consulting Pvt Ltd Slide© TransGraph Consulting Pvt Ltd Slide 40
MCX CPO Futures prices are hovering near INR 540 after weakening from the May’12 high of INR 635 exhibiting a weak tone. Owing to the oversold short term oscillators possibility of minor gains towards INR 580 remains open ahead of extended weakness towards INR 500 in the coming months.
MCX CPO Futures Continuation, INR/10Kg

© TransGraph Consulting Pvt Ltd Slide© TransGraph Consulting Pvt Ltd Slide
Markets Last Closing (June 6,2012)
Price outlook (3-4 months)
BMD Palm Oil Futures, MYR/MT 3003 2940-3350-2500
CME Soy Oil Futures, Cents/lb 48.5 48-53-43
NYMEX Crude Oil, USD/bbl 85.11 80-92-75
NCDEX Soy Oil Futures, INR/10kg 731.60 720-760-650
NCDEX Soybean Futures, INR/Qtl 3379.50 3260-3470-2900
MCX CPO Futures, INR/10Kg 551.50 540-580-500
Price Outlook (4-6 Months)
The global oil and oil seed complex is likely to maintain the current underlying weakness in the medium term while weather vagaries could prompt minor upside potential in the short term.

© TransGraph Consulting Pvt Ltd Slide© TransGraph Consulting Pvt Ltd Slide 42
So finally how Indonesia policies impact industry in the wake of my weak price outlook
It will be double wammy…..For Indonesian CPO Sellers
• As prices fall and incidental tax will be high in lower price brackets – much to shell-out to Govt.
For Malaysia and India• Indonesia vendors will resort to more aggressive selling of Olein and that is killing for refining industries in both these nations.

© TransGraph Consulting Pvt Ltd Slide© TransGraph Consulting Pvt Ltd Slide
Road Ahead -
TransGraph
Perspectives
43
It is only matter of time, counter-intuitive policy revisions are bound to come, especially India and Malaysia could react Following are the likely policy changes possible.By Malaysia:1.Could initiate a dialogue with Indonesia2.lift the export quota ceiling of CPO and employ similar tax structures followed by Indonesia on CPO –
level playing field
By India:1.Logically, base import price could be revised from $484/ton to 950/1000$ per ton. It will double the
incidental tax ensuring margin making scope for the refiners
a)
If this happens, Olein
prices will shoot higher tentatively translating into demand destruction2.Could initiate a dialogue with Indonesia3.Or Origin shift to Central America in the longer run
Overall the source countries priorities in order are1.
Find markets for the palm oil2.
Find market for the refined products to ensure development of industry.There
should
be
balance
and
source
countries
can
not
risk
the
first
point
at
the
cost
of
second
point. The balance between export ratio of products and materials in the soybean industry at
countries like USA should be observed by Indonesia.

© TransGraph Consulting Pvt Ltd Slide© TransGraph Consulting Pvt Ltd Slide44
Thank you for your attention
www.transgraph.com
Transgraph Consulting Pvt Limited
TransGraph Consulting Pvt. Ltd.# 6-3-655 / 2/1, III Floor, A.P. Civil Supplies Bhavan Lane, Somajiguda, Hyderabad –
82,Tel: +91-40-30685001-04: Facsimile: +91-40-30685002
E-mail: [email protected]; mktg@ transgraph.comwww.transgraph.com

LEGAL INFORMATION
This document is the whole property of Transgraph Consulting Private Limited, Hyderabad, India (hereafter “TransGraph”).
The following acts are strictly prohibited:Reproduction and/or forwarding for sale or any other usesPosting on any communication mediumTransmittal via the Internet
Terms of usageUpon receipt of this document either directly or indirectly, it is understood that the user will and must fully comply with the other terms and conditions of TransGraph. By accepting this document the user agrees to be bound by the foregoing limitations.
This publication is prepared by TransGraph and protected by copyright laws. Unless otherwise noted in the Service Agreement, the entire contents of this publication are copyrighted by TransGraph, and may not be reproduced, stored in another retrieval system, posted on any communication medium, or transmitted in any form or by any means without prior written consent of TransGraph. Unauthorized reproduction or distribution of this publication, or any portion of it, may result in severe civil and criminal penalties, and will be prosecuted to the maximum extent necessary to protect the rights of TransGraph.
The information and opinions contained in this report have been obtained from sources TransGraph believed to be reliable, but no representation or warranty, express or implied, is made that such information is accurate or complete and it should not be relied upon as such.
This report does not constitute a prospectus or other offering document or an offer or solicitation to buy or sell any assets (commodities, currencies, etc) or other investment. Information and opinions contained in the report are published for the assistance of recipients, but are not to be relied upon as authoritative or taken in substitution for the exercise of judgment by any recipient; they are subject to change without any notice and not intended to provide the sole basis of any evaluation of the instruments discussed herein. Any views expressed reflect the current views of the analysts, which do not necessarily correspond to the opinions of TransGraph or its affiliates. Opinions expressed may differ from views set out in other documents, including research, published by TransGraph.
Any reference to past performance should not be taken as an indication of future performance. No member in the public related to TransGraph accepts any liability whatsoever for any direct or consequential loss arising from any use of material contained in this report.
Analyst CertificationEach analyst responsible for the preparation of this report certifies that (i) all views expressed in this report accurately reflect the analyst's views about any and all of the factors and assets (commodities, currencies, etc) named in this report, and (ii) no part of the analyst's compensation is directly or indirectly, related to the execution of the specific recommendations or views expressed herein.
Copyright © TransGraph Consulting Private Limited, Hyderabad, India.
Prepared by Consulting Team – TransGraphRegistered Office: 6‐3‐655/2/1, AP Civil Supplies Bhavan Lane, Somajiguda, Hyderabad – 500082 INDIA Phone: +91 40 30685000 04 | E mail: services@transgraph com | Internet: www transgraph com
45