Embed Size (px)
Citation preview

MALAYSIA ECONOMIC MONITOR
JUNE 2018
Navigating Change
Pub
lic D
iscl
osur
e A
utho
rized
Pub
lic D
iscl
osur
e A
utho
rized
Pub
lic D
iscl
osur
e A
utho
rized
Pub
lic D
iscl
osur
e A
utho
rized

CONNECT WITH US
wbg.org/Malaysia
@WorldBankMalaysia
@WB_AsiaPacific
blogs.worldbank.org/category/countries/malaysia

Navigating Change
MALAYSIA ECONOMIC MONITOR
JUNE 2018

This edition of the Malaysia Economic Monitor was prepared by Richard Record (task team leader), Yew Keat Chong, Shakira Teh Sharifuddin and Punithaa Kylasapathy. Bradley Larson, Siddhartha Raja, Smita Kuriakose, Samuel Fraiberger, Anton Prokopyev, Jonathan Leigh Pemberton, Glenn-Marie Lange, Esther Naikal, Kenneth Simler, Jeevakumar Govindasamy, Achim Schmillen, Wei San Loh and Kershia Tan Wei provided additional contributions.
Mara Warwick, Faris Hadad-Zervos and Deepak Mishra provided overall guidance. The team is grateful to Sudhir Shetty, Shabih Ali Mohib, Birgit Hansl, Firas Raad, Ndiame Diop and Ekaterine Vashakmadze for their constructive input.
This report benefited from productive discussions with staff from the Economic Planning Unit at the Ministry of Economic Affairs, Bank Negara Malaysia, the Ministry of Finance, the Ministry of Communications and Multimedia and many other government ministries and agencies, all of whom provided valuable information and useful feedback.
In particular, the team would like to thank the International Cooperation Section of the Economic Planning Unit and the Economics Department of Bank Negara Malaysia for close ongoing collaboration with the World Bank and for the crucial support to the launch of this report. The team would like to express its gratitude to analysts at several private financial firms and rating institutions, whose participation in a constructive dialogue also informed the analysis.
This edition of the MEM was prepared in close partnership with the Malaysia Digital Economic Corporation. The team is grateful to management and staff for engaging in extensive discussions and providing significant written contributions to the report.
Cover Image: Getty ImagesPhotography: Samuel Goh
Joshua Foong and Min Hui Lee led external communications and the production and design of the report. Irfan Kortschak provided editing assistance, while Aziaton Ahmad provided administrative support. Kane Chong designed the report and its cover.
The findings, interpretations, and conclusions expressed in this report do not necessarily reflect the views of the Executive Directors of the World Bank or the governments they represent. The World Bank does not guarantee the accuracy of the data included in this work. The boundaries, colors, denominations, and other information shown on any map in this work do not imply any judgment on the part of the World Bank concerning the legal status of any territory or the endorsement or acceptance of such boundaries. The report is based on information current as of June 20, 2018.
EnquiriesPlease contact Richard Record ([email protected]), Yew Keat Chong ([email protected]) or Shakira Teh Sharifuddin ([email protected]) if you have any questions or comments regarding the Malaysia Economic Monitor.
Acknowledgements
2 MALAYSIA ECONOMIC MONITOR | JUNE 2018

AbbreviationsAI Artificial Intelligence
ASEAN Association of Southeast Asian Nations
B40 Bottom 40 percent (of the population)
BDA Big Data Analytics
BNM Bank Negara Malaysia
BR1M 1Malaysia Peoples Aid (Bantuan Rakyat 1Malaysia)
CPI Consumer Price Index
DAI Digital Adoption Index
DOSM Department of Statistics Malaysia
DFI Development Financial Institution
DFTZ Digital Free Trade Zone
DTAP Digital Transformation Acceleration Program
DTL Digital Transformation Lab
E&E Electrical and Electronics
EAP East Asia and Pacific
ECRL East-Coast Rail Link
EMDE Emerging Market and Developing Economies
EPF Employees Provident Fund
FDI Foreign Direct Investment
FMM Federation of Malaysian Manufacturers
GDP Gross Domestic Product
GLC Government-linked Company
GNI Gross National Income
GST Goods and Services Tax
HSBB High-speed Broad-band
HSR Kuala Lumpur-Singapore High-speed Rail
ICT Information Communications Technology
IMF International Monetary Fund
IoT Internet of Things
IPI Industrial Production Index
ITU International Telecommunication Union
LCR Liquidity Coverage Ratio
LNG Liquefied Natural Gas
M40 Middle 40 percent (of the population)
MaGIC Malaysian Global Innovation and Creativity Centre
MCMCMalaysian Communications and Multimedia Commission
MDEC Malaysia Digital Economy Corporation
MDH Malaysia Digital Hub
MEM Malaysia Economic Monitor
MGS Malaysian Government Securities
MOF Ministry of Finance
MRT3 Mass Rapid Transit Line 3
MSAP Mandatory Standard on Access Pricing
MTEP Malaysia Tech Entrepreneur Program
NeSR National eCommerce Strategic Roadmap
NFPC Non-financial Public Corporation
NPL Non-Performing Loan
OECDOrganization for Economic Cooperation and Development
OPR Overnight Policy Rate
PPP Public Private Partnership
Q/Q Quarter-on-Quarter
SAAR Seasonally Adjusted Annual Rate
SME Small and Medium Sized Enterprise
SUBB Sub-urban Broad-band
SST Sales and Services Tax
T20 Top 20 percent (of the population)
TM Telekom Malaysia
TVET Technical and Vocational Education and Training
Y/Y Year-on-Year
3MALAYSIA ECONOMIC MONITOR | JUNE 2018

AcknowledgementsAbbreviationsSummary
Recent economic developments
Economic outlook
Unlocking the potential of the digital economy
PART ONERecent economic developments
Regional economies have continued to strengthen despite moderating growth in advanced economies
Malaysia’s economy grew at a more measured pace than in previous expansions
The current account surplus has widened due to an increase in net trade
Domestic inflationary pressures have eased in recent months
Conditions in the financial system have remained broadly stable
Federal Government debt as a share of GDP has trended downwards, but guaranteed debt has increased
Economic outlookRegional economic growth is expected to remain robust through 2018
Malaysia’s near-term economic growth is expected to remain strong
Implementation of the election mandate will require careful management of potential risks
Supportive conditions offer an opportunity to undertake deeper reforms for sustained and more inclusive
growth
PART TWOUnlocking the potential of the digital economy
Key building blocks need to be in place for Malaysia to achieve its digital economy ambitions
Malaysia’s overall digital adoption is high, but business adoption lags behind peers
Malaysia’s fixed broadband adoption is low, mainly due to high costs
The ecosystem is supportive of digital entrepreneurship, though challenges exist
A competitive broadband market is key to improving connectivity and achieving higher business adoption
As Malaysia transitions into a high-income economy, it should continue its efforts to unlock the potential of
the digital economy
AppendixHighlights from Malaysia’s digital economy development initiatives
References
2
3
6
7
8
10
15
16
16
17
19
21
26
28
30
30
31
36
37
41
42
42
43
46
49
52
54
57
57
60
Table of Contents
5MALAYSIA ECONOMIC MONITOR | JUNE 2018

Summary
The historic outcome of Malaysia’s recent elections provides an unprecedented opportunity for change. The country’s 14th General Elections which took place on May 9, 2018, in the context of widespread citizen concern regarding the degree to which the proceeds of economic growth have been shared across the Malaysian society and a call for increased government accountability, have resulted in the nation’s first change in government since its independence in 1957. The new government’s emerging economic policy framework is strongly guided by its election manifesto Buku Harapan, which responds to these popular sentiments.
Heightened uncertainty amid the political transition exacerbated the ongoing turbulence in the financial markets arising from external factors. In the period between the elections and end-May, Malaysia’s 5- and 10-year sovereign spreads against US Treasuries increased by 24 and 27 basis points respectively, while the stock market fell by three percent. Meanwhile, RM19 billion of foreign capital was withdrawn from the domestic financial markets in May as post-election market turbulence coincided with heightened investor uncertainty about the emerging markets asset class. However, since then volatility in the financial markets has been largely driven by external factors amid increased global trade tensions, as the uncertainty surrounding the political transition has gradually reduced.
Malaysia’s economic fundamentals remain sound. As a highly open trade-oriented economy situated at the center of the world’s fastest growing region, Malaysia continues to benefit from strong global demand for its exports. Malaysia’s underlying economic strengths, including a diversified economic structure, a strong external position, robust institutions, and significant natural resources and human capital endowments, remain unchanged.
Malaysia’s near-term growth outlook remains strong, with sound economic fundamentals
Bold reforms that respond to the election mandate to sustain growth and increase inclusiveness would be consistent with Malaysia’s aspirations to become a high-income society. Priority areas for structural reforms could include: raising the productivity level; strengthening the provision of social assistance for low-income households; and facilitating the achievement of inclusive growth, through policies that level the playing field in access to services and economic opportunities (including measures to increase women’s labor force participation). In addition, reforms could also look at ways to increase the effectiveness of pro-inclusion spending programs, mobilize resources through more progressive taxation, and adapt to the realities of an ageing population.
Malaysia has a window of opportunity to deepen reforms and make growth work for everyone
The Malaysia Economic Monitor consists of two parts. Part 1 presents a review of recent economic developments and a macroeconomic outlook. Part 2 focuses on a selected special topic that is key to Malaysia’s development prospects, particularly as the country moves forward on its path towards becoming a high-income and developed nation. In this edition, the focus of the special topic is on the digital economy.
Unlocking the potential of the digital economy will be key to ensuring Malaysia’s successful transition to a high-income and developed economy. The adoption of digital technologies across the public and private sectors, and in both manufacturing and services will be essential to enable the growth in productivity that Malaysia needs for broad-based improvements to living standards.
6 MALAYSIA ECONOMIC MONITOR | JUNE 2018
Summary

Regional economies continued to strengthen in Q1 2018, while global growth has eased. During this quarter, the regional growth rate is estimated to have increased to 6.6 percent, bolstered by the ongoing upturn in global manufacturing activity and higher commodity prices.
The Malaysian economy expanded at a more moderate rate of 5.4 percent in Q1 2018. Real GDP growth during the quarter was primarily driven by the continued strength of household spending and notably higher net trade, amid subdued expansion of private investment and lower public expenditure. Growth was partially offset by relatively sizable inventory drawdowns of services and manufactured products.
Private consumption remained the primary contributor to Malaysia’s economic growth, expanding strongly at a rate of 6.9 percent in Q1 2018. The sustained growth of household spending occurred in the context of stable employment conditions and consumer sentiment, and was further supported by a range of government income support measures.
Private investment growth has softened to 0.5 percent during the quarter, despite the continued supportive global and domestic economic environment. Relatively modest levels of capital expenditure were observed across both export- and domestic-oriented sectors, amid uncertainties in the run-up to the general elections.
Public expenditure growth was relatively flat in Q1 2018 due to lower public consumption growth and investment spending. Growth in public consumption decelerated to 0.4 percent during the quarter. Public investment expenditure growth contracted by 1.0 percent over the same period. This was the result of lower capital outlays, mainly by public corporations, with a number of multi-year infrastructure projects nearing completion.
Malaysia’s gross exports expanded at a relatively modest pace of 5.8 percent in Q1 2018. The recent performance of exports has been driven largely by sustained external demand for E&E exports. Growth in semiconductor exports accelerated during the quarter, consistent with an upturn in the global technology
cycle. By contrast, resource- and non-resource-based manufactured exports increased at a slower rate during the quarter.
Following four consecutive quarters of double-digit growth in 2017, gross imports contracted by 0.8 percent in Q1 2018. This reflects slower growth of manufacturing activity and lower capital imports. With an increase in net trade, the current account surplus widened to 4.4 percent of GDP in Q1 2018.
Inflation has moderated in the first five months of 2018, with the rate in May 2018 standing at 1.8 percent. The overall decline largely reflects the dissipating impact of previous increases in global oil prices on domestic fuel inflation. The inflation rate for food and non-alcoholic beverages has also eased, due to relatively stable fresh food supplies amid favorable weather conditions.
While the underlying inflation rate has eased, there remain concerns regarding the buildup of cost of living pressures over recent years. The inflationary impact has been particularly pronounced for lower-income households, which spend a relatively high proportion of their income on food items, for which the buildup of price increases has been most significant. These pressures have been compounded by increased housing costs due to a structural shortfall of affordable housing at the lower end of the property market.
Labor market conditions have remained generally stable, with sustained growth in private sector employment and wages. The unemployment rate declined slightly to 3.3 percent towards the end of Q1 2018, with the continued expansion in the labor force being broadly offset by continued employment growth. During Q1 2018, private sector wage growth was sustained at 6.6 percent, slightly higher than the rate recorded in Q4 2017.
However, there is a widening gap in wage growth between manufacturing and services sectors. Wages in manufacturing increased by the average rate of 13.9 percent in Q1 2018, compared to 3.5 percent in services.
Youth unemployment has also remained elevated. In 2017, youth unemployment rates amongst 15-19 year-olds and 20-24 year-olds were close to five and three times higher respectively than the overall unemployment rate.
In January 2018, the Central Bank of Malaysia normalized the degree of monetary accommodation by increasing the OPR to 3.25 percent. This decision
Recent economic developments
7MALAYSIA ECONOMIC MONITOR | JUNE 2018
Summary

was based on an assessment that the domestic economy was on a firm growth path and that the conditions that necessitated the previous rate reduction in 2016 had significantly improved.
Domestic financial conditions have remained broadly stable. Net financing growth remained stable in Q1 2018, supported by a sustained high level of corporate bond issuances, amid relatively modest expansion of banking system and DFI loans.
The financial markets recorded significant non-resident portfolio outflows in May 2018. Cautious sentiment arising from both global factors and heightened uncertainty amid the political transition contributed to portfolio outflows in the domestic equity and bond markets. Throughout this period, volatility in the yields for MGS temporarily increased and peaked during the elections. Meanwhile, the sovereign spreads against US Treasuries widened post-elections; however, this trend has since gradually reversed and the spread has begun to stabilize. Reflecting the trend in outflows, the ringgit depreciated by 2.2 percent relative to the US dollar to RM4.01 in the period from May 1 to June 20.
Federal Government debt as a share of GDP has trended downwards, but the size of guaranteed debt has increased. Federal Government debt stood at 50.8 percent of GDP as of end-2017, two percentage points lower than in the previous year. Conversely, statutory guarantees increased to 17.6 percent of GDP in 2017, from 15.2 percent in 2016. The steady expansion of contingent liabilities since 2009 has been driven largely by increased loan guarantees to support the implementation of large-scale infrastructure projects by NFPCs. The Federal Government also has additional long-term fiscal commitments arising from a range of PPP arrangements, totalling 14.9 percent of GDP in 2017.
The government has introduced several fiscal policy changes in response to its election mandate to lower living costs, and has committed to achieving the 2.8 percent federal deficit target set for 2018. Among the major announcements made include the change of Malaysia’s consumption tax system from GST back to SST, and the adjustment to the fuel pricing mechanism. The government has also indicated that it will reassess the government debt to GDP ratio by including guaranteed debt of selected entities which are unable to service their obligations, and fiscal commitments in connection to PPPs. It also intends to review selected large infrastructure projects with a view to safeguard longer-term fiscal sustainability.
Economic outlookThe cyclical upswing in global growth is expected to continue in the near term. The global growth rate is projected to reach 3.1 percent in 2018, followed by a slight decline over the next two years to 2.9 percent in 2020 due to a gradual slowdown in the advanced economies. Conversely, growth in the emerging market and developing economies is expected to continue to increase, from 4.5 percent in 2018 to an average of 4.7 percent in 2019-2020.
Malaysia’s economy is forecast to grow at the rate of 5.4 percent in 2018, underpinned by stronger growth of household consumption. The stronger near-term outlook for household spending primarily reflects the additional impetus from the new policy measures put forth by the government, including the temporary suspension of the consumption tax. Meanwhile, public consumption is projected to expand at a lower rate than previously anticipated, primarily reflecting the planned rationalization of non-essential operating spending.
Gross fixed capital formation is expected to grow at a more modest rate than previously anticipated. The revision mainly reflects the softer-than-expected
8 MALAYSIA ECONOMIC MONITOR | JUNE 2018
Summary

private investment activity in Q1 2018, as well as expectations of contraction and deferment of the existing and future large-scale capital expenditure undertaken by the government and public corporations.
The external sector will continue to benefit from the cyclical rebound in global investment and manufacturing activity into the near future. While the robust growth of Malaysia’s exports is expected to continue in 2018, the growth rate is likely to moderate, due partly to a higher base effect. It is projected that growth will gradually decelerate over the coming years, as the global environment becomes less supportive.
The headline inflation rate is projected to be lower in 2018 than previously anticipated. This reflects the lower-than-expected inflationary pressures in H1 2018, a much weaker pass-through of the higher global oil prices on domestic fuel costs with the recent adjustment of the fuel pricing mechanism, as well as the expected overall price decline in consumption goods following the replacement of GST with SST, and the temporary suspension of the consumption tax between June and August 2018. Underlying inflation is also expected to be broadly contained over the near-term in the absence of immediate domestic cost pressures.
While Malaysia is on track to achieve its transition from an upper middle-income economy to a high-income economy, it is important to be aware of the broader aspects of development not captured by GDP growth. These include both the distribution of economic gains across geographical regions and segments of the population, and the wider dimensions of societal wellbeing, including health, education and environmental sustainability.
Important policy measures resulting from the government’s election mandate to lower living costs will need to be managed carefully to ensure they do not bring additional risks to the economy. The change of the consumption tax system from GST back to SST, and the adjustment to the fuel pricing mechanism, in the absence of adequate compensatory measures, would constrain the existing fiscal policy space. The reassessment of several planned large-scale infrastructure projects also raises uncertainty on the outlook for both public and private investment. A swift finalization of the government’s economic policy package would minimize the potential impacts on private sector confidence especially in the short term.
As a highly open economy, Malaysia will continue to face significant external risks. These include the risks associated with heightened global financial market volatility as well as the increasingly intense protectionist
sentiment and the escalation of trade tensions which could have a dampening effect on global trade and investment flows.
Malaysia is entering into a new period that offers an opportunity to strengthen structural reforms and to accelerate its convergence with high-income economies. Policymakers should look to measures that address labor market constraints and distortions in output markets; to improve the quality of education and training; to deepen regional trade integration and to improve trade facilitation; to build innovation capacity; and to unlock the potential of the digital economy as a future driver of growth. The new environment also creates opportunities for deeper reforms to strengthen institutions and governance.
Fiscal reforms should take advantage of the cyclical upswing to strengthen Malaysia’s resilience against future shocks. Ensuring longer-term fiscal sustainability in the new fiscal setting would necessitate a deeper wave of structural reforms to diversify sources of fiscal revenue, rationalize non-essential operating outlays, restructure some of the large-scale infrastructure projects, and improve spending efficiency.
A renewed social contract is essential for promoting upward economic mobility and security, and the broader development of society commensurate with high-income country status. Increasing upward economic mobility will require steps to eliminate existing disparities in access to jobs and services, as well as improving the quality of jobs available. Enhanced economic security will depend on more effective social assistance for low-income households, and a stronger system of social insurance to increase resilience to idiosyncratic shocks. Policies to strengthen institutions for inclusive growth include leveling the playing field in access to services and economic opportunities, increasing the effectiveness of pro-inclusion spending programs, mobilizing resources through progressive taxation, and adapting to the realities of an ageing population.
Malaysia’s economy is forecast to grow at the rate of 5.4 percent in 2018, underpinned by stronger growth of household consumption
9MALAYSIA ECONOMIC MONITOR | JUNE 2018
Summary

adoption and the level of sectorial productivity, with manufacturing and mining in particular having higher levels of adoption. The size of a firm is also a significant determining factor with only about 20 percent of SMEs in Malaysia using the internet for business operations.
The two major barriers to digital adoption cited by businesses are slow internet connections and lack of affordable broadband plans. In a survey conducted by MDEC and the FMM, more than 50 percent of manufacturing firms listed lack of access to the internet and slow internet speeds as the most significant constraint to utilizing digital technologies.
In terms of the level of adoption of fixed broadband services, Malaysia lags behind other countries with a similar level of economic development, with limited usage of fiber optic broadband services. Available data indicates that only about eight percent of Malaysian establishments use fiber broadband services, with a slow growth rate. By comparison, the rate of adoption of these services in Singapore, Republic of Korea and Japan stands at 99 percent, 85 percent and 60 percent respectively.
Unlocking the potential of the digital economy
Broadly, the digital economy promotes growth through three channels. First, it promotes inclusion and expands markets by reducing transaction costs, thereby enabling businesses to reach segments of the market that may not have been served. Second, digital technologies boost efficiency, enabling businesses to provide faster services, that are cheaper and more convenient. Third, these technologies can significantly reduce the cost of economic and social transactions for households, businesses and government, thereby promoting innovation.
Malaysia does well in terms of the level of digital adoption by people and government. Malaysia’s citizens are among the most digitally connected in the world. The proportion of its population with digital access increased from around 51 percent in 2006 to more than 80 percent at present. The level of digital adoption by Malaysia’s government is also high. The government has invested heavily in digital technologies to modernize and digitize its systems and processes, including electronic tax filing and digital identification systems.
However, Malaysia lags behind international peers in terms of digital adoption by businesses. Despite recent growth, only 62 percent of business establishments are connected to the internet and only 28 percent have some form of web presence. In addition, the Digital Adoption Index, which measures the use of digital technologies by various agents in an economy, shows that Malaysia has limited international bandwidth and a smaller number of secure servers. In general, in terms of the level of digital adoption by businesses, Malaysia’s performance is more comparable to that of a lower middle-income country.
There are also significant regional disparities between highly urbanized states and the rest of the country when it comes to the level of digital adoption by businesses. In general, industrialized and/or urbanized states have relatively high levels of adoption. This is partly due to the lower connection costs in urban areas, with higher population densities driving costs down, and to various government initiatives such as the Multimedia Super Corridor. There is also a strong positive correlation between the level of technology
The proportion of Malaysia’s population with digital access increased from around 51 percent in 2006 to more than 80 percent at present
Malaysian consumers pay considerably more for high-speed broadband access than consumers in other countries. In terms of price per Mbps, Malaysia ranks 74 out of 167 countries for fixed broadband services and 64 out of 118 for fiber broadband services. This places it behind regional comparators such as Vietnam and countries with similar levels of economic development such as Mexico and Turkey.
The high cost of fixed broadband internet services is partly driven by limited competition. Malaysia’s fixed broadband market is concentrated relative to other countries, and much more concentrated than is the case for mobile services. TM, the leading fixed broadband service provider, constitutes about 92 percent of the fixed broadband market share, significantly higher than the leading firms in other countries.
Malaysia can look beyond doubling its internet speed to achieving gigabit-level of connectivity,
10 MALAYSIA ECONOMIC MONITOR | JUNE 2018
Summary

similar to many advanced economies. In the global context, Malaysia’s plans to develop its broadband up to 100 Mbps+ are unlikely to make the country significantly more competitive, given that many advanced economies are already planning for gigabit networks. Access to fixed broadband services is a prerequisite for the widespread adoption of innovative technologies (especially more advanced applications such as data analytics, the internet of things and artificial intelligence), not just by businesses, but also to support improved public service delivery and growing demand of households.
Moving forward, to improve digital connectivity, Malaysia may consider adopting policies with two main objectives: (i) improving the quality and affordability of fixed broadband services; and (ii) increasing coverage of ultra-fast broadband networks. To achieve these objectives, the government should strive to increase the level of competition in the fixed broadband market by better enforcing the current regulatory framework to provide all operators with access to cable landing stations and by opening up the market across all levels of the telecom and internet supply chain.
Malaysia has made significant efforts to establish the right ecosystem to foster digital entrepreneurship. A range of institutions have been established to attract investments, provide incentives, facilitate financing, and offer training and opportunities to start-up firms. Malaysia has also pioneered the steps in promoting inclusivity through digital entrepreneurship programs such as eUsahawan and eRezeki, which are programs for the B40 and M40 income groups to take advantage of potential business opportunities created by the gig or sharing economy.
For Malaysia to successfully achieve high-income and developed country status, it will be important to unlock the potential created by the digital economy. Malaysia successfully achieved middle-income status through a model of economic growth that was mainly driven by factor accumulation. With this model generating diminishing returns and with the intensifying need to achieve higher levels of productivity, it is crucial for Malaysia to adopt digital technologies to achieve this increased productivity and drive the country’s digital transformation.
11MALAYSIA ECONOMIC MONITOR | JUNE 2018
Summary

Recent economic developments and outlook
5.9
5.0 4.8 4.7
4.1 4.04.3
4.5
5.6 5.86.2
5.9
5.4
0
1
2
3
4
5
6
7
Q1-
2015
Q2-
2015
Q3-
2015
Q4-
2015
Q1-
2016
Q2-
2016
Q3-
2016
Q4-
2016
Q1-
2017
Q2-
2017
Q3-
2017
Q4-
2017
Q1-
2018
Malaysia’s economy grew at a moremoderate pace in Q1 2018...
...with private consumption remainingthe main contributor to growth
GDP, y/y, Percentage Contribution to GDP, y/y, Percentage
-4
-2
0
2
4
6
8
Q1-
2015
Q2-
2015
Q3-
2015
Q4-
2015
Q1-
2016
Q2-
2016
Q3-
2016
Q4-
2016
Q1-
2017
Q2-
2017
Q3-
2017
Q4-
2017
Q1-
2018
Net Exports
GFCF Change in Inventory
Public Consumption
Real GDP,y/y
Private Consumption
Cautious sentiment arising from global factorsand the political transition has contributed to portfolio out�ows
The current account surplus has widened dueto an increase in net trade
...and is expected to pass the high-incomecountry threshold between 2020 and 2024
Three Scenarios for When GNI Per Capita Will Pass the High-Income ThresholdGNI Per Capita, World Bank Atlas Methodology (US$)
Malaysia’s economy is forecast to grow at5.4 percent in 2018...
GDP, y/y, Percentage
6.0
5.1
4.2
5.9
5.45.1
4.8
0
1
2
3
4
5
6
7
2014 2015 2016 2017 2018f 2019f 2020f
8000
10000
12000
14000
16000
18000
2016
2017
2018
2019
2020
2021
2022
2023
2024
2025
2026
High income threshold:US$12,055 as ofJuly 1, 2018
Baseline
Low
High
Services GoodsPrimary & SecondaryIncome Account
-10
-5
0
5
10
15
Q1-
2015
Q2-
2015
Q3-
2015
Q4-
2015
Q1-
2016
Q2-
2016
Q3-
2016
Q4-
2016
Q1-
2017
Q2-
2017
Q3-
2017
Q4-
2017
Q1-
2018
Balances, Percentage of GDP
Corporate Bondsand Sukuk
Government Bondsand BNM Bills
Equity
-20
-10
0
10
20
Non-resident Portfolio Flows, RM Billion
GE14May 2018
06/2
017
07/2
017
08/2
017
09/2
017
10/2
017
11/2
017
12/2
017
01/2
018
02/2
018
03/2
018
04/2
018
05/2
018
12 MALAYSIA ECONOMIC MONITOR | JUNE 2018

Unlocking the potential of the digital economy
Malaysians are among the most digitallyconnected in the world...
...mainly through mobile networks
However, digital adoption by businessestrails behind international peers…
…and the rate of fixed/fiber broadbandconnections is low, limiting deepdigital adoption
Fiber Optic Broadband Subscriptions (% of All Households)
SG, 99%
KR, 85%
CN, 73%
JP, 60%
BN, 54%
VN, 32%
NZ, 23%
AU, 14%
MY, 8%
PH, 1%0%
20%
40%
60%
80%
100%
2012 2013 2014 2015 2016 2017
Fixed/fiber broadband adoption is lowdue to poor affordability of services...
...and this is partly driven bymarket concentration
Average Price of Fixed Broadband Services (USD/Mbps, Log Scale) Share of Subscribers for Fixed Broadband Services, June 2017
Telekom Malaysia (92.2%)
Maxis (6.2%)
YTL Communications (0.2%)
Other Players (0.5%)
webe (0.9%)
Subscribers (June 2017)
Individuals Using the Internet (% of Population)
0%
20%
40%
60%
80%
100%
120%
140%
160%
180%
200%
0 5,000 10,000 15,000 20,000
GNI Per Capita (US$)
Malaysia
Mobile Broadband Subscriptions (Per 100 People), 3G+4G
0%
20%
40%
60%
80%
100%
120%
140%
160%
180%
200%
0 5,000 10,000 15,000 20,000
GNI Per Capita (US$)
Malaysia
Digital Adoption Index, Business Sub-index
Malaysia = 0.55
JPNKOR
SGP
HighIncome
0
.2
.4
.6
.8
1
Ind
ex S
core
GNI Per Capita (US$)
12,055
ASEAN OECD
PH
MY JP AUNZ
HKKR SG
0.01
0.1
1
10
100
1,000
10,000
0 10,000 20,000 30,000 40,000 50,000 60,000
GNI Per Capita (US$)
13MALAYSIA ECONOMIC MONITOR | JUNE 2018


PART ONE
Recent Economic Developments and Outlook
15MALAYSIA ECONOMIC MONITOR | JUNE 2018

Global growth remains robust, despite having eased in recent months, with manufacturing activity and trade having shown signs of softening (see Figure 1). In aggregate, the global GDP growth rate is estimated to have moderated slightly to 3.2 percent in Q1 2018 (Q4 2017: 3.3 percent). Despite recent signs of moderation, growth in major advanced economies remains above potential. Among emerging market and developing economies (EMDEs), the recovery in commodity exporters has continued, with activity in commodity importers remaining firm. Trade and manufacturing activity have shown signs of moderation, global financing conditions have tightened amid the ongoing withdrawal of monetary policy accommodation across advanced economies, while oil prices have trended considerably higher than previously anticipated.
FIGURE 1Global growth has eased in Q1 2018...
FIGURE 2...while regional economies have continued to strengthen
Regional economies have continued to strengthen despite moderating growth in advanced economies
In 2018, growth across the Developing East Asia and Pacific (EAP) economies has remained firm. In Q1 2018, the regional growth rate is estimated to have increased to 6.6 percent (Q4 2017: 6.5 percent), with broad-based growth observed in most major economies (see Figure 2). Exports have continued to expand, benefitting from the ongoing recovery in global investment, stronger intra-regional trade and investment integration, and higher commodity prices. Domestically, private consumption continues to be supported by improved consumer confidence and household wealth, amid moderate inflation. With the exception of China, investment expenditure across the region has remained strong, supported by higher business confidence, improved earnings and continued capital inflows.
Recent economic developments
AdvancedEconomies
Emerging andDeveloping Economies
World
0
1
2
3
4
5
GDP, y/y, Percentage
Q1-
2015
Q2-
2015
Q3-
2015
Q4-
2015
Q1-
2016
Q2-
2016
Q3-
2016
Q4-
2016
Q1-
2017
Q2-
2017
Q3-
2017
Q4-
2017
Q1-
2018
0
1
2
3
4
5
6
7
8
Q1-
2015
Q2-
2015
Q3-
2015
Q4-
2015
Q1-
2016
Q2-
2016
Q3-
2016
Q4-
2016
Q1-
2017
Q2-
2017
Q3-
2017
Q4-
2017
Q1-
2018
GDP, y/y, Percentage
China
Thailand
Indonesia
Vietnam
Philippines
Source: World Bank Global Economic Monitor Source: World Bank Global Economic Monitor
16 MALAYSIA ECONOMIC MONITOR | JUNE 2018
PART ONE - Recent Economic Developments and Outlook

FIGURE 3Malaysia’s economy grew at a more measured pace in Q1 2018...
FIGURE 4...with private consumption remaining the main contributor to growth
Malaysia’s economy grew at a more measured pace than in previous expansionsFollowing several quarters of better-than-expected growth, Malaysia’s economy expanded at a more moderate pace in Q1 2018 at 5.4 percent (Q4 2017: 5.9 percent) (see Figure 3). Real GDP growth during the quarter was primarily driven by the continued strength of household spending and notably higher net trade, amid subdued growth of private investment and lower public expenditure (see Figure 4). This was partially offset by a relatively sizable negative contribution to growth from increased inventory drawdowns of services and manufactured products.
Private consumption has remained the primary contributor to Malaysia’s economic growth, with sustained strong expansion observed in Q1 2018 at the rate of 6.9 percent (Q4 2017: 7.0 percent). This growth occurred in the context of steady increases in employment and wage growth, with consumer confidence remaining stable. Strong household expenditure was also supported by a range of government measures to increase the disposable incomes of low- and medium-income households, including reductions in personal income taxation, and continued social transfers.
Private investment growth has softened despite the continued supportive global and domestic economic environment. Private sector investment
growth moderated during the quarter, expanding at a subdued rate of 0.5 percent (Q4 2017: 9.2 percent). Capital expenditure stood at relatively modest levels in both export- and domestic-oriented sectors, amid uncertainties in the run-up to the Malaysia’s general elections which were held in May 2018. At a sectoral level, private investment expenditure was largely concentrated in the services sectors, especially in the healthcare and education subsectors.
Public expenditure growth was relatively flat in Q1 2018 on account of lower public consumption growth and a further decline in government investment spending. Growth in public consumption decelerated to 0.4 percent during the quarter (Q4 2017: 6.8 percent), due largely to reduced expenditure on supplies and services, including maintenance charges. Public investment expenditure growth contracted further by 1.0 percent over the same period (Q4 2017: -1.4 percent), as a result of reduced capital outlays mainly by public corporations, with a number of multi-year infrastructure projects nearing completion.
On the supply side, most major economic sectors continued to expand in Q1 2018. The services sector, which accounted for 54.8 percent of GDP, grew at a marginally higher rate of 6.5 percent during the quarter (Q4 2017: 6.2 percent), reflecting the accelerated
5.9
5.0 4.8 4.7
4.1 4.04.3
4.5
5.6 5.86.2
5.9
5.4
0
1
2
3
4
5
6
7
Q1-
2015
Q2-
2015
Q3-
2015
Q4-
2015
Q1-
2016
Q2-
2016
Q3-
2016
Q4-
2016
Q1-
2017
Q2-
2017
Q3-
2017
Q4-
2017
Q1-
2018
GDP, y/y, Percentage
-4
-2
0
2
4
6
8
Q1-
2015
Q2-
2015
Q3-
2015
Q4-
2015
Q1-
2016
Q2-
2016
Q3-
2016
Q4-
2016
Q1-
2017
Q2-
2017
Q3-
2017
Q4-
2017
Q1-
2018
Contribution to GDP, y/y, Percentage
Net Exports
GFCF Change in Inventory
Public Consumption
Real GDP,y/y
Private Consumption
Source: DOSM Source: World Bank staff calculations based on DOSM data
17MALAYSIA ECONOMIC MONITOR | JUNE 2018
PART ONE - Recent Economic Developments and Outlook

expansion of activities in the finance and insurance subsectors, and information and communication subsectors. The manufacturing sector also continued to expand in Q1 2018 at the rate of 5.3 percent (Q4 2017: 5.4 percent), supported by stronger output growth in the electrical and electronics (E&Es), petroleum, chemical, rubber and plastic products. Meanwhile, growth in the construction sector continued to decelerate to 4.9 percent during the quarter (Q4 2017: 5.9 percent), amid persistent excesses in both residential and commercial property markets. Growth in the agriculture sector also softened in Q1 2018, with the rate standing at 2.8 percent (Q4 2017: 10.7 percent), due mainly to a decline in rubber production amid weaker rubber prices during the quarter.
Recent economic indicators suggest that the growth momentum is expected to continue, at least in the near term. The Industrial Production Index (IPI) increased at a faster pace in April at 4.6 percent (March: 3.1 percent), supported by growth across the manufacturing and electricity sectors. Manufacturing output recorded an increase of 5.3 percent (March: 4.1 percent), on sustained strong sales in E&Es, while
TABLE 1GDP growth decomposition
electricity output rose 5.8 percent (March: 4.4 percent). The index of wholesale and retail sales also recorded a larger increase in April at 6.5 percent (March: 5.8 percent), mainly supported by wholesale trade. Survey-based indicators have provided mixed signals on growth in H2 2018. The Malaysia composite leading index, a measure of the overall economic performance in the months ahead, indicates that the economy will continue to grow, albeit at a moderated momentum in March at 0.8 percent (February: 1.1 percent). Similarly, the Malaysian Institute of Economic Research’s Consumer Sentiment and Business Conditions Index in Q1 2018 point towards continued economic expansion in the near term, though at a more moderate pace compared to in 2017.
Q1 2016
Q2 2016
Q3 2016
Q4 2016
2016Q1
2017Q2
2017Q3
2017Q4
20172017
Q1 2018
GDP 4.1 4.0 4.3 4.5 4.2 5.6 5.8 6.2 5.9 5.9 5.4
Consumption
Private Sector 5.2 6.2 6.3 6.1 6.0 6.7 7.1 7.2 7.0 7.0 6.9
Public Sector 2.7 5.4 2.1 -4.3 0.9 7.5 3.3 3.9 6.8 5.4 0.4
Gross Fixed Capital Formation 0.1 6.1 2.0 2.4 2.7 10.0 4.1 6.7 4.3 6.2 0.1
Exports of Goods & Services 1.0 2.1 -0.2 2.4 1.3 9.8 9.4 11.8 6.7 9.4 3.7
Imports of Goods & Services 2.3 2.6 -1.6 1.9 1.3 13.0 10.4 13.3 7.3 10.9 -2.0
Sectoral
Agriculture -3.9 -7.9 -6.2 -2.5 -5.2 8.4 5.9 4.1 10.7 7.2 2.8
Mining -1.3 2.1 2.8 4.9 2.1 1.4 0.1 3.0 -0.3 1.0 0.1
Manufacturing 4.6 4.2 4.3 4.7 4.4 5.6 6.0 7.0 5.4 6.0 5.3
Construction 8.0 8.9 7.9 5.1 7.4 6.6 8.3 6.1 5.9 6.7 4.9
Services 5.2 5.8 6.2 5.6 5.7 5.8 6.3 6.5 6.2 6.2 6.5
GDP, y/y, Percentage
Source: World Bank staff calculations based on DOSM data
Following several quarters of better-than-expected growth, Malaysia’s economy expanded at a more moderate pace in Q1 2018
18 MALAYSIA ECONOMIC MONITOR | JUNE 2018
PART ONE - Recent Economic Developments and Outlook

The current account surplus has widened due to an increase in net tradeMalaysia’s gross exports expanded at a relatively modest pace of 5.8 percent in Q1 2018 (Q4 2017: 12.4 percent). The recent growth of Malaysia’s exports has been driven largely by sustained external demand for E&E exports, which accounted for almost three-quarters of the total gross export growth over the period (see Figure 5). In particular, growth of semiconductor exports accelerated to 29.6 percent in Q1 2018 (Q4 2017: 24.4 percent), driven by an upturn in the global technology cycle. Exports of resource- and non-resource-based manufactured products increased a little during the quarter, supported by continued regional demand for chemical and metal products. Meanwhile, growth of commodity exports contracted in Q1 2018, weighed down by a decline in the volume of liquefied natural gas (LNG) exports and by lower prices of rubber and crude palm oil exports.
After four consecutive quarters of double-digit growth in 2017, gross imports contracted by 0.8 percent in Q1 2018, due to a lower growth in the manufacturing sector and a decline in capital imports (Q4 2017: 14.4 percent). Imports of intermediate goods, which constituted 57.1 percent of total imports in 2017, contracted by 10.5 percent
in Q1 2018 (Q4 2017: 8.9 percent), in the context of a slowing external demand for manufactured exports. The decline in capital imports during the quarter also contributed to the contraction of gross imports, due to the high base in Q1 2017, which was driven largely by the delivery of a number of high-value items, including aircraft and oil and gas vessels.
In tandem with an increase in net trade, the current account surplus widened to 4.4 percent of GDP in Q1 2018 (Q4 2017: 4.0 percent) (see Figure 6). During the quarter, Malaysia’s net trade of goods increased to RM35.7 billion (Q4 2017: RM34.1 billion), as the moderated export growth was accompanied by a contraction in imports. There was a smaller deficit in the services account at -RM5.8 billion in Q1 2018 (Q4 2017: -7.0 billion), with the decline due to lower net payments for construction services. Meanwhile, the deficit in the primary income account widened to -RM10.2 billion in Q1 2018 (Q4 2017: -RM8.4 billion), due primarily to lower income accrued to domestic firms investing abroad. The secondary income account deficit declined marginally, standing at -RM4.7 billion (Q4 2017: -RM4.8 billion), with continued sizable outward remittances from foreign workers.
FIGURE 5Much of the strength in export growth has been driven by continued demand for E&E exports...
FIGURE 6...along with a contraction in imports, contributing to a larger current account surplus
Source: World Bank staff calculations based on BNM and DOSM data Source: World Bank staff calculations based on DOSM data
-10
-5
0
5
10
15
20
25
Q1-
2015
Q2-
2015
Q3-
2015
Q4-
2015
Q1-
2016
Q2-
2016
Q3-
2016
Q4-
2016
Q1-
2017
Q2-
2017
Q3-
2017
Q4-
2017
Q1-
2018
Annual Change, Contribution to Growth, Percentage
Commodities Non E&E Exports, y/yE&E
-10
-5
0
5
10
15
Balances, Percentage of GDP
Q1-
2015
Q2-
2015
Q3-
2015
Q4-
2015
Q1-
2016
Q2-
2016
Q3-
2016
Q4-
2016
Q1-
2017
Q2-
2017
Q3-
2017
Q4-
2017
Q1-
2018
Services Goods Current AccountPrimary & SecondaryIncome Account
19MALAYSIA ECONOMIC MONITOR | JUNE 2018
PART ONE - Recent Economic Developments and Outlook

TABLE 2Selected external sector indicators
Q1 2016
Q2 2016
Q3 2016
Q4 2016
Q1 2017
Q2 2017
Q3 2017
Q4 2017
Q1 2018
Balance of Goods & Services (% of GDP) 6.1 5.4 7.4 8.0 5.8 6.4 7.8 7.6 8.7
Current Account Balance (% of GDP) 2.2 1.0 2.5 3.9 1.5 2.7 3.7 3.9 4.4
Total Exports (% of GDP) 67.7 66.8 67.1 69.4 71.2 71.2 72.3 70.9 70.1
Total Imports (% of GDP) 61.6 61.3 59.8 61.4 65.4 64.8 64.5 63.3 61.4
Net Portfolio Investment (RM billion) 15.7 0.1 -9.8 -20.1 -32.4 17.5 -9.1 11.6 -2.6
Gross Official Reserves (RM billion) 381.6 390.4 405.0 423.9 422.2 424.8 427.7 414.7 416.4
(US$ billion) 97.0 97.2 97.7 94.5 95.4 98.9 101.2 102.4 107.8
Source: World Bank staff calculations based on BNM and DOSM data
Exports grew at a robust pace in April, increasing by 14.0 percent (March: 2.2 percent). The jump was driven by E&E exports, which constitute about 38 percent of total exports. In addition, the increase was supported by stronger commodity exports particularly petroleum exports, which saw increases in both volume
and value. Imports also rose, at 9.1 percent (March: -9.6 percent) due mainly to higher imports of capital goods. Meanwhile, imports of intermediate and consumer goods declined during the same period. Overall, a trade surplus of RM13.1 billion was recorded for April 2018, a marked growth of 50.9 percent.
20 MALAYSIA ECONOMIC MONITOR | JUNE 2018
PART ONE - Recent Economic Developments and Outlook

Domestic inflationary pressures have eased in recent monthsThe CPI inflation has moderated in the first five months of 2018, standing at 1.8 percent in May 2018, (Q1 2018: 1.8 percent) (see Figure 7). The overall decline largely reflects the dissipating impact of previous increases in global oil prices on domestic fuel inflation (see Figure 8). The inflation rate for food and non-alcoholic beverages also decelerated in recent months, partly due to relatively stable fresh food supplies amid favorable weather conditions. The inflation rate for the housing and utilities category also moderated during the period, with relatively subdued rent growth.
While the underlying inflation rate has eased, there remain concerns regarding the buildup of cost of living pressures. The buildup of inflationary pressures over the past years has had a disproportionate effect on lower-income households, who spend a higher proportion of their income on food items1, for which the buildup of price increases has been most significant2
(see Box 1 on the disconnect between low rates of inflation and widespread concerns about the cost of living in Malaysia). The adverse impact of higher cumulative inflation has been more pronounced
among urban low-income households, who are also experiencing elevated housing costs due to a structural shortfall of affordable housing at the lower end of the property market.
Labor market conditions have remained generally stable, with sustained growth in private sector employment and wages. The unemployment rate declined slightly to 3.3 percent towards the end of Q1 2018 (Q4 2017: 3.4 percent), with continued expansion in the labor force being broadly offset by sustained employment growth (see Figure 9). The labor force participation rate remained stable at 68.2 percent of the working age population at the end of Q1 2018. (Q4 2017: 68.0 percent). During this quarter, private sector wage growth3 stood at 6.6 percent, slightly higher than the rate of 6.3 percent recorded in Q4 2017 (see Figure 10). At the sectoral level, the disparity in wage growth between the manufacturing and the services sectors has widened, with wages increasing at a rate of 13.9 percent on average (Q4 2017: 9.4 percent) in the case of the former compared to 3.5 percent (Q4 2017: 5.0 percent) of the latter.
FIGURE 7Headline inflation has moderated in recent months...
Source: DOSM
FIGURE 8...due largely to lower growth in transport prices
Source: World Bank staff calculations based on DOSM data
Headline In�ation Core In�ation
In�ation, y/y, Percentage
0
1
2
3
4
5
6
01/2
016
03/2
016
05/2
016
07/2
016
09/2
016
11/2
016
01/2
017
03/2
017
05/2
017
07/2
017
09/2
017
11/2
017
01/2
018
03/2
018
05/2
018
Contribution to Growth, y/y, Percentage
Others
Transport Food and Non-alcoholicBeverages
Headline InflationHousing, Water, Electricity,Gas & Other Fuels
-2
0
2
4
6
01/2
016
03/2
016
05/2
016
07/2
016
09/2
016
11/2
016
01/2
017
03/2
017
05/2
017
07/2
017
09/2
017
11/2
017
01/2
018
03/2
018
05/2
018
1 Malaysian households in the lowest-income deciles spend close to 40 percent of their expenditure on food, compared to about 25 percent among the highest-income households. Source: Report on Household Expenditure Survey 2016, DOSM.2 From January 2010 to May 2018, the cumulative increases in consumer prices were 33 percent for food and non- alcoholic beverages, 19 percent for transport, 19 percent for housing and utilities, and 12 percent for others (excluding alcoholic beverages and tobacco). Source: World Bank staff calculations based on DOSM data.3 Private sector wage is derived from the salaries and wages data published by DOSM in the Monthly Manufacturing Statistics and Quarterly Services Statistics. It covers 64 percent of total employment.
21MALAYSIA ECONOMIC MONITOR | JUNE 2018
PART ONE - Recent Economic Developments and Outlook

FIGURE 9Labor market conditions have remained broadly stable...
FIGURE 11Unemployment is especially high among 15-24 year-olds...
FIGURE 10...with a widening gap in average wage growth between the manufacturing and the services sectors
FIGURE 12...and is highest among those with higher education
Source: DOSM
Source: DOSM
Source: BNM and DOSM
Source: DOSM
Labour Force Patricipation Rate
2.6
2.8
3.0
3.2
3.4
3.6
01/2
015
04/2
015
07/2
015
10/2
015
01/2
016
04/2
016
07/2
016
10/2
016
01/2
017
04/2
017
07/2
017
10/2
017
01/2
018
Unemployment Rate, Percentage
Unemployment RateLabor Force Participation Rate
65.0
65.5
66.0
66.5
67.0
67.5
68.0
68.5
69.0
69.5
70.0
0
2
4
6
8
10
12
14
16
18
20
2012
2013
2014
2015
2016
2017
15 - 19 years-old
20 - 24 years-old
Overall (15 - 64 years-old)
Unemployment Rate, Percentage
0
2
4
6
8
10
12
14
Wage Growth, y/y, Percentage
Q2-
2017
Q3-
2017
Q4-
2017
Q1-
2018
Q2-
2017
Q3-
2017
Q4-
2017
Q1-
2018
Q2-
2017
Q3-
2017
Q4-
2017
Q1-
2018
Overall Manufacturing Major ServicesSubsectors
0
1
2
3
4
5
Unemployment Rate, Percentage
2012
2013
2014
2015
2016
2017
Tertiary
Secondary
No formaleducation
Primary
In 2017, the youth unemployment rates remained elevated at 15.4 percent amongst 15–19 year-olds and 9.6 percent amongst those 20–24 years old (see Figure 11). In 2016, the corresponding rates were 15.9 and 9.1 percent respectively. The unemployment rates in these age groups are relatively high in both
rural and urban areas, amongst men and women, and for all ethnic groups. In 2017, unemployment was also relatively high among those with tertiary education (4.2 percent), compared to those with only secondary education (3.4 percent), primary education (1.8 percent), or no formal education (2.8 percent) (see Figure 12).
22 MALAYSIA ECONOMIC MONITOR | JUNE 2018
PART ONE - Recent Economic Developments and Outlook


What explains the disconnect between low rates of inflation and widespread concerns about the cost of living in Malaysia?
Concerns and complaints about the increasing cost of living have been common in Malaysian public discourse over the past two to three years. Over the same period, the CPI inflation rate has been relatively low, standing at the average annual rate of 2.7 percent in the period from January 2015 to May 2018. What explains this apparent disconnect between economic statistics and popular perception? A large part of the explanation could be that the inflation experienced by some population groups deviates significantly from the CPI, which is a weighted average of all prices in the economy4. Such deviations are attributable to differences in the combinations of goods and services consumed by households, or spatial differences in prices, or both.
BOX 1
Furthermore, perceptions of changes in the cost of living are usually influenced by the extent to which inflation is matched by income changes.
Rising prices of necessities, especially food, have negatively affected the well-being of low-income households in recent years. Poorer households spend a larger portion of their household budgets on food and other necessary items. In Malaysia, food and non-alcoholic beverages (including food away from home) represent 28.7 percent of household consumption expenditure in aggregate, but the corresponding budget share among households earning less than RM3,000 per month is much higher at 38.5 percent. Since 2010,
4 Because the CPI is weighted according to total consumer spending in the economy it gives greater weight to households with higher consumption spending.
24 MALAYSIA ECONOMIC MONITOR | JUNE 201824
PART ONE - Recent Economic Developments and Outlook

FIGURE 13Food prices have increased more rapidly than other expenditure categories...
FIGURE 14...and consumer prices have risen faster in urban areas
prices of food and non-alcoholic beverages have been rising faster than any other major category of household expenditure (see Figure 13). Consumers tend to be more aware of price changes for items purchased frequently, so the fact of food price increases exceeding the overall CPI is magnified in consumers’ perceptions because they see it on a daily basis at grocery stores and markets.
Urban households experience higher inflation than the rest of the population. As seen in Figure 14, since 2015 the urban CPI has consistently outpaced the rural CPI. Low-income CPIs (that is, CPIs based on expenditure patterns of households with incomes less than RM3,000) are not published separately for urban and rural areas. Nevertheless, it is possible to conclude that low-income urban households have been hit extra hard by rising food prices because food makes up 36 percent of their expenditure and urban food prices have been rising faster. Furthermore, costs of housing, which forms the second largest component in households’ expenditure, have been deemed “seriously unaffordable”5 in recent years, thus further exacerbating the cost of living for urban low-income households.
Concerns about the rising cost of living are also linked to changes in household incomes. The most recent household income data show broad-based
Source: DOSM*Excludes alcoholic beverages and tobacco
Source: DOSM
Cumulative Change in Consumer Prices, July 2010 to May 2018Percentage
Urban Rural
12
1820
33
10
1716
25
0
5
10
15
20
25
30
35
40
Others*TransportHousing andUtilities
Food andnon-alcoholic
beverages
Consumer Price Index, January 2015 to May 20182010=100
105
110
115
120
125
2015 2016 2017 2018
Urban
Rural
5 BNM (2017) 2017 Third Quarterly Bulletin, Kuala Lumpur: Bank Negara Malaysia.
income growth, with the mean and median incomes growing faster than inflation for the bottom 40 percent (B40), middle 40 percent (M40), and top 20 percent (T20) of the income distribution. However, behind those averages there are households whose incomes are not keeping pace with inflation, or who resort to second or third jobs to keep up with increasing living costs. Assuring opportunities for all to develop their capacities and find more productive and remunerative employment will help counter the impact of rising living costs.
For those left behind in the job market, better designed social protection systems can also help to alleviate the rising cost of living. For example, as the government moves to replace BR1M with the new Cost of Living Aid program, several design improvements merit attention. One potential reform is to differentiate income eligibility criteria and benefit levels by the living costs faced by households in high-cost versus low-cost areas. Cash assistance programs could also be more equitable and efficient by taking household demographics into account. Preliminary analysis by the World Bank indicates that incorporating the number of household members in the eligibility criteria could improve targeting efficiency by as much as 25 percent compared to BR1M’s criterion of income per household regardless of the household’s size.
25MALAYSIA ECONOMIC MONITOR | JUNE 2018 25
PART ONE - Recent Economic Developments and Outlook

Conditions in the financial system have remained broadly stableIn January 2018, the Central Bank of Malaysia normalized the degree of monetary policy accommodation by increasing the Overnight Policy Rate (OPR) to 3.25 percent. This decision was based on an assessment that the domestic economy was on a firm growth path and that the conditions that necessitated the previous OPR reduction in 2016 had significantly improved. The increased rate was intended to preserve the sustainability of growth and to prevent the buildup of risks from interest rates being too low for a prolonged period. In 2018, Bank Negara Malaysia (BNM) expects Malaysia’s economy to expand at a rate within the range of 5.5 to 6.0 percent, with growth driven by sustained private sector demand and positive spillovers from the external sector. Meanwhile, domestic inflationary pressures are projected to ease over this period, mainly due to a smaller contribution from global cost factors.
Financial soundness indicators showed that the banking system remains resilient. During Q1 2018, the banking sector’s pre-tax profits were broadly sustained at RM9 billion (Q4 2017: RM10 billion). Domestic financial institutions remain well-capitalized,
with all banks registering capital ratios well in excess of the statutory minimum as of Q1 2018. The overall quality of the banking system’s assets continued to be sound during the quarter, as evidenced by the low levels of both delinquencies and impaired loans. Liquidity in the banking system has remained adequate, with all banking institutions recording Basel III Liquidity Coverage Ratio (LCR) levels above the minimum statutory requirement of 90 percent.
Net financing growth remained stable in Q1 2018, supported by sustained high level of corporate bond issuances (see Figure 15). Corporate financing through the bond markets sustained a double-digit growth rate of 14.2 percent in Q1 2018 (Q4 2017: 15.4 percent). This strong growth reflects sustained strong corporate bond issuances to finance private sector infrastructure projects and working capital needs. Meanwhile, the banking system and development financial institutions’ (DFIs) outstanding business loans continued to expand at a relatively slow pace of 1.3 percent during the quarter, compared to in the previous years (Q4 2017: 1.3 percent), reflecting in part increased business repayments amid improvement in
FIGURE 15Net financing growth was sustained by continued strong corporate bond issuances...
FIGURE 16...amid a relatively modest pace of expansion in banking system and DFI loans
Source: BNMSource: BNM
0
2
4
6
8
10
01/2
016
03/2
016
05/2
016
07/2
016
09/2
016
11/2
016
01/2
017
03/2
017
05/2
017
07/2
017
09/2
017
11/2
017
01/2
018
03/2
018
CorporateBonds
Banking Systemand DFI Loans
Total NetFinancing
Contribution to Net Financing Growth, y/y, Percentage
0
2
4
6
8
10
12
Q3-
2015
Q4-
2015
Q1-
2016
Q2-
2016
Q3-
2016
Q4-
2016
Q1-
2017
Q2-
2017
Q3-
2017
Q4-
2017
Q1-
2018
Total Loans Household Loans Business Loans
Outstanding Loans, y/y, Percentage
26 MALAYSIA ECONOMIC MONITOR | JUNE 2018
PART ONE - Recent Economic Developments and Outlook
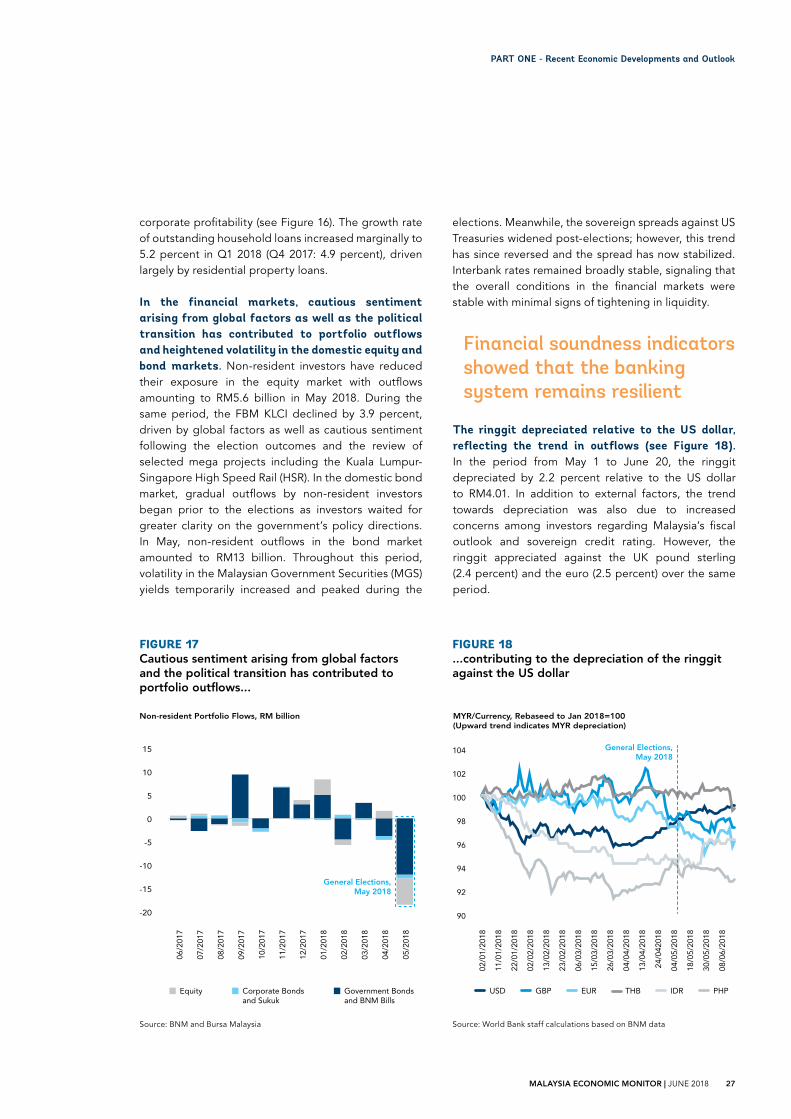
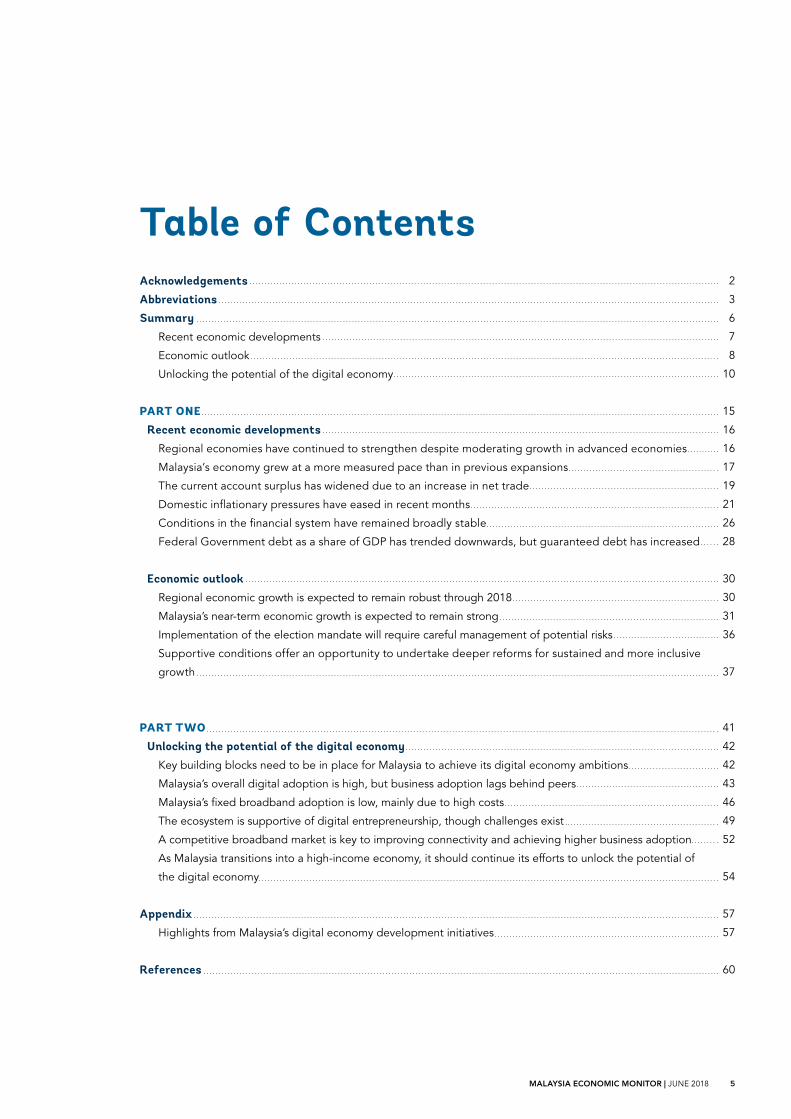
FIGURE 17Cautious sentiment arising from global factors and the political transition has contributed to portfolio outflows...
FIGURE 18...contributing to the depreciation of the ringgit against the US dollar
Source: BNM and Bursa Malaysia Source: World Bank staff calculations based on BNM data
Non-resident Portfolio Flows, RM billion
Equity Government Bondsand BNM Bills
Corporate Bondsand Sukuk
-20
-15
-10
-5
0
5
10
15
06/2
017
07/2
017
08/2
017
09/2
017
10/2
017
11/2
017
12/2
017
01/2
018
02/2
018
03/2
018
04/2
018
05/2
018
General Elections,May 2018
MYR/Currency, Rebaseed to Jan 2018=100(Upward trend indicates MYR depreciation)
90
92
94
96
98
100
102
104
02/0
1/20
18
11/0
1/20
18
22/0
1/20
18
02/0
2/20
18
13/0
2/20
18
23/0
2/20
18
06/0
3/20
18
15/0
3/20
18
26/0
3/20
18
04/0
4/20
18
13/0
4/20
18
24/0
4201
8
04/0
5/20
18
18/0
5/20
18
30/0
5/20
18
08/0
6/20
18
USD THBGBP PHPEUR IDR
General Elections,May 2018
corporate profitability (see Figure 16). The growth rate of outstanding household loans increased marginally to 5.2 percent in Q1 2018 (Q4 2017: 4.9 percent), driven largely by residential property loans.
In the financial markets, cautious sentiment arising from global factors as well as the political transition has contributed to portfolio outflows and heightened volatility in the domestic equity and bond markets. Non-resident investors have reduced their exposure in the equity market with outflows amounting to RM5.6 billion in May 2018. During the same period, the FBM KLCI declined by 3.9 percent, driven by global factors as well as cautious sentiment following the election outcomes and the review of selected mega projects including the Kuala Lumpur-Singapore High Speed Rail (HSR). In the domestic bond market, gradual outflows by non-resident investors began prior to the elections as investors waited for greater clarity on the government’s policy directions. In May, non-resident outflows in the bond market amounted to RM13 billion. Throughout this period, volatility in the Malaysian Government Securities (MGS) yields temporarily increased and peaked during the
elections. Meanwhile, the sovereign spreads against US Treasuries widened post-elections; however, this trend has since reversed and the spread has now stabilized. Interbank rates remained broadly stable, signaling that the overall conditions in the financial markets were stable with minimal signs of tightening in liquidity.
Financial soundness indicators showed that the banking system remains resilient
The ringgit depreciated relative to the US dollar, reflecting the trend in outflows (see Figure 18). In the period from May 1 to June 20, the ringgit depreciated by 2.2 percent relative to the US dollar to RM4.01. In addition to external factors, the trend towards depreciation was also due to increased concerns among investors regarding Malaysia’s fiscal outlook and sovereign credit rating. However, the ringgit appreciated against the UK pound sterling (2.4 percent) and the euro (2.5 percent) over the same period.
27MALAYSIA ECONOMIC MONITOR | JUNE 2018
PART ONE - Recent Economic Developments and Outlook

Federal Government debt as a share of GDP has trended downwards through 2017, with risks appearing manageable given the structure of public debt. As a proportion of GDP, Federal Government debt stood at 50.8 percent as of end-2017 (Q3 2017: 50.8 percent), two percentage points lower than in the previous year (see Figure 19). 97.7 percent of the Federal Government’s financial liabilities are denominated in ringgit, thus limiting its exposure to valuation changes from exchange rate movements. The debt structure also remains skewed towards medium- to long-term maturities, with 68.8 percent of outstanding issuances having a remaining maturity period of more than three years as of Q4 2017, thereby reducing rollover risks. In addition, the presence of large domestic institutional investors, collectively holding almost two-thirds of total government issuances, continues to provide underlying support for the government securities, mitigating risks associated with shifting demand from foreign investors, which accounted for 28 percent of the total government borrowing as of Q4 2017.
Federal Government debt as a share of GDP has trended downwards, but guaranteed debt has increased
In contrast, debt guaranteed by the Federal Government has increased due to a number of publicly guaranteed infrastructure investments. Total statutory guarantees stood at RM238.0 billion or 17.6 percent of GDP as of end-2017, up from RM187.3 billion or 15.2 percent of GDP in 2016 (see Figure 20). The steady expansion of fiscal contingent liabilities since 2009 has been driven largely by increased loan guarantees to support the implementation of large-scale infrastructure projects by non-financial public corporations (NFPCs). Realization of these relatively sizable guarantees could result in an unexpected strain on public finances and lead to higher sovereign financing costs. The Federal Government also has additional long-term fiscal commitments arising from a range of public-private partnership (PPP) arrangements, totaling RM201.4 billion or 14.9 percent of GDP as of Q4 2017, mostly to support increased infrastructure investment without immediate budgetary impact to the government. While the risks associated with the aggregate burden of these fiscal commitments
FIGURE 19The Federal Government debt as a share of GDP has trended downwards...
FIGURE 20...but guaranteed debt has increased
Source: BNMSource: BNM
51.6 53.0 52.754.5
52.7 50.8
0
10
20
30
40
50
60
70
2012 2013 2014 2015 2016 2017
Percentage of GDP
2012 2013 2014 2015 2016 2017
14.715.4 15.5 15.3 15.2
17.6
0
5
10
15
20
25
Percentage of GDP
28 MALAYSIA ECONOMIC MONITOR | JUNE 2018
PART ONE - Recent Economic Developments and Outlook

appear contained at the current juncture, continued vigilance and transparent, orderly management of commitments will be important to anchor market expectations regarding Malaysia’s longer-term public debt sustainability.
The government has introduced several fiscal policy changes in response to its election mandate to lower living costs, and has committed to achieving the 2.8 percent federal deficit target set for 2018. Among the major announcements made include the change of Malaysia’s consumption tax system from the Goods and Services Tax (GST), which had been effective in diversifying the revenue base away from petroleum-related sources since the 2014 oil-price slump, back to the previous single-stage
Sales and Services (SST) system6. The government has also adjusted the fuel pricing mechanism to insulate domestic RON95 gasoline and diesel prices against global oil price movements7. The resultant revenue shortfall and increased subsidy outlays for the year are expected to be compensated with higher oil-related revenues from the recovery of global oil prices, further spending restraint and increased contributions from government entities, particularly in the form of dividends. In addition, the government has indicated that it will reassess the overall Federal Government debt and liabilities including the guarantees that have materialized, and the future fiscal commitments under PPP arrangements. It also intends to review several large-scale infrastructure projects with a view to safeguard longer-term fiscal sustainability.
6 GST has been zero-rated since June 1, 2018, and will be replaced with SST effective September 1, 2018.7 Effective June 7, 2018, the prices per liter of RON95 petrol and diesel are fixed at RM2.20 and RM2.18 respectively, while the price of RON97 is floated on a weekly basis.
29MALAYSIA ECONOMIC MONITOR | JUNE 2018
PART ONE - Recent Economic Developments and Outlook

Economic outlook
The cyclical upswing in global growth is expected to continue in 2018. The global growth rate is projected to reach 3.1 percent in 2018, followed by a slight decline over the next two years to 2.9 percent in 2020 due to a gradual slowdown in advanced economies (see Figure 21). As labor market slack diminishes and monetary policy accommodation gradually unwinds, growth in advanced economies is expected to track closer to subdued potential growth rates, which remains constrained by aging populations and weak productivity trends. Conversely, growth in EMDEs is expected to continue to increase, from 4.5 percent in 2018 to 4.7 percent in 2019-2020. This acceleration primarily reflects a continued, but maturing, cyclical rebound in commodity exporting nations, with the impacts of the earlier commodity price collapse gradually dissipating. Global trade is projected to remain firm in 2018, gradually declining thereafter, consistent with the anticipated deceleration in capital expenditure across advanced economies and China.
Growth in the region is projected to remain solid in the near term. China’s economy is likely to expand at a more moderate pace in the coming years, with its growth rates projected to decline from 6.5 percent in 2018 to 6.2 percent in 2020, as it continues to rebalance. Average annual growth rates for the rest of the region are expected to peak at 5.4 percent in 2018, then to moderate slightly to 5.3 percent over the next two years as the cyclical rebound matures (see Figure 22). Domestic demand will remain the primary driver of growth in the region, reflecting continued favorable prospects for the growth of private consumption and investment amid improved confidence. Barring major external shocks, trade flows are also projected to remain robust in 2018, following which they are expected to soften as the global environment becomes less supportive.
FIGURE 21Robust global growth is likely to continue into 2018...
FIGURE 22...with a favorable outlook expected for the region
Source: World Bank staff projections Source: World Bank staff projections
Regional economic growth is expected to remain robust through 2018
0
1
2
3
4
5
6
2018f 2019f 2020f 2018f 2019f 2020f 2018f 2019f 2020f
World AdvancedEconomies
Emerging &DevelopingEconomies
GDP, y/y, Percentage Latest Estimates (June 2018)
Previous Estimates (April 2018)
2018f 2019f 2020f
Developing EAP
2018f 2019f 2020f
Developing EAPexcl. China
2018f 2019f 2020f
DevelopingASEAN
0
1
2
3
4
5
6
7
8
GDP, y/y, Percentage Latest Estimates (June 2018)
Previous Estimates (April 2018)
30 MALAYSIA ECONOMIC MONITOR | JUNE 2018
PART ONE - Recent Economic Developments and Outlook

Malaysia’s near-term economic growth is expected to remain strongMalaysia’s economy is forecast to grow at the rate of 5.4 percent in 2018, underpinned by stronger growth of household consumption (see Table 3)8. Private consumption, currently the primary driver of Malaysia’s growth, is forecast to accelerate at the rate of 7.0 percent in 2018, 0.3 percentage points above the April forecast (2017: 7.0 percent). The stronger near-term outlook for household spending primarily reflects the additional impetus from the new policy measures put forth by the government, including a 3-month suspension of the consumption tax during the transition from GST to SST, and one-off payouts to civil servants and pensioners.9 Meanwhile, public consumption is projected to expand at a lower rate than previously anticipated, at 1.6 percent in 2018 (2017: 5.4 percent), in line with the planned rationalization in government operating expenditure, including spending on non-essential services.10
Gross fixed capital formation is expected to expand at a more modest pace, with lower private and public capital expenditure than previously projected. The growth forecast of gross fixed capital formation has been revised down to 4.3 percent in 2018 and 4.1 percent in 2019 (2017: 6.2 percent). This revision mainly reflects the softer-than-expected investment activity in Q1 2018 as well as expectations of contraction and deferment of several current and future capital expenditure undertaken by the government and public corporations.
8 The forecast assumes no changes to monetary policy over the forecast period.9 A special payout of RM700 million to civil servants and pensioners was announced on June 9, 2018.10 Include professional and consulting services, refurbishments, events and promotional activities, as well as ICT systems upgrading.
TABLE 3GDP growth and contribution to growth
Growth Rates (y/y, Percentage)
Contribution to GDP Growth (Percentage Point)
2017 2018f 2019f 2020f 2017 2018f 2019f 2020f
GDP 5.9 5.4 5.1 4.8
Domestic Demand (including stocks) 6.6 5.5 5.1 4.8 6.1 5.1 4.7 4.5
Final Consumption 6.7 6.0 5.5 5.2 4.4 4.0 3.7 3.5
Private Sector 7.0 7.0 6.4 6.1 3.7 3.8 3.5 3.4
Public Sector 5.4 1.6 1.3 1.1 0.7 0.2 0.2 0.1
Gross Fixed Capital Formation 6.2 4.3 4.1 3.8 1.6 1.1 1.0 1.0
Change in Stocks 0.1 0.0 0.0 0.0
Exports of Goods & Services 9.4 6.7 6.4 6.0 6.6 4.8 4.7 4.5
Imports of Goods & Services 10.9 7.0 6.6 6.1 -6.8 -4.5 -4.3 -4.1
Source: World Bank staff calculations and projections
Private consumption, the primary driver of Malaysia’s growth, is forecast to accelerate in 2018
31MALAYSIA ECONOMIC MONITOR | JUNE 2018
PART ONE - Recent Economic Developments and Outlook

FIGURE 23Sentiment-based forecasts have been tracking below the consensus forecast since the general elections...
FIGURE 24...largely reflecting below-trend optimism in the commodity and financial markets, economic, corporate and industrial clusters
Source: World Bank staff projections Source: World Bank staff calculations
ConsensusSentiment-adjusted
01/2
018
02/2
018
03/2
018
04/2
018
05/2
018
06/2
018
4.5
5.0
5.5
6.0
6.5
GDP, 2018f, y/y, Percentage
-2.0
-1.5
-1.0
-0.5
0
0.5
1.0
1.5
01/2
018
02/2
018
03/2
018
04/2
018
05/2
018
06/2
018
News Sentiment, Z-score
Commodity/Financial
Economic
Corporate/Industrial
Political/General
11 The news-based sentiment index is derived through an analysis of the proportion of positive words (“gain”, “improve”, “agreement”, etc.) relative to the proportion of negative words (“concern”, “fear”, “decline”, etc.) present in a vast collection of news articles on Malaysia’s economy. Information derived from media reports has two main advantages compared to official statistics. First, measurements of economic conditions can be calculated in real-time, at a daily frequency. Second, this information enables the measurement of economic forces that might not be easily captured by traditional data sources, providing complementary insight into factors such as the collective sentiment regarding economic prospects. A recent study based on historical data in 25 countries between 1991 and 2017 suggests that including news-based measures of sentiment reduces the forecast errors of GDP growth by 12 percent on average relative to the consensus forecast.
The external sector will continue to benefit from the cyclical rebound in global investment and manufacturing activity into the near future. While the solid growth of Malaysia’s exports is expected to continue in 2018, the growth rate is likely to moderate, due partly to a higher base effect. It is projected that export growth will gradually decelerate over the coming years, as the global environment becomes less supportive. Import growth is projected to remain strong in 2018, due to the continued demand for manufactured exports and high levels of private sector expenditure. The current account surplus is projected to remain broadly stable at around 3.0 percent of GDP in 2018, with the sustained trade surplus of goods over the forecast horizon continuing to be weighed down by the persistent deficits in the services and income accounts.
News-based measures of economic sentiment show a downward shift in optimism over near-term economic prospects following the general elections. A complementary news-based measure of economic
sentiment developed by the staff of the World Bank’s Big Data program11 indicates a more cautious sentiment over Malaysia’s near-term macroeconomic prospects following the general elections, with the forecast of Malaysia’s GDP growth in 2018 being lower than the consensus forecast (see Figure 23). Below-trend optimism was observed across the commodity and financial markets, economic as well as corporate and industrial clusters, while the sentiment associated with the political news category has not deviated significantly from its historical averages (see Figure 24).
The external sector will continue to benefit from the cyclical rebound in global investment and manufacturing activity into the near future
32 MALAYSIA ECONOMIC MONITOR | JUNE 2018
PART ONE - Recent Economic Developments and Outlook
Headline inflation is projected to be more subdued in 2018 than previously anticipated. This reflects mainly the weaker-than-expected inflationary pressures in H1 2018, a much lower pass-through of the higher global oil prices on domestic fuel inflation with the adjustment of the fuel pricing mechanism, as well as the overall decline in the price of consumption goods following the replacement of GST with SST and the temporary suspension of the consumption tax between June and August 2018. Underlying inflation is also expected to be broadly contained over the near term in the absence of immediate domestic cost pressures, though it is expected to increase gradually over the forecast horizon, consistent with the narrowing degree of spare capacity in the economy.
Taking a longer-term perspective, Malaysia is on track to achieve its transition from an upper middle-income economy to a high-income economy within the next two to six years. Malaysia’s gross national income (GNI) per capita stood at US$9,650 in 2017, or US$2,405 below the threshold level of
US$12,055 that the World Bank currently sets to define high-income country status (see Figure 25)12. The latest World Bank staff projections13 suggest that Malaysia’s GNI per capita is likely to exceed the defined threshold at some point in the period from 2020 to 2024.
As Malaysia moves closer towards achieving high-income country status, it is important to be aware of the broader aspects of development that are not captured by GDP growth. These include the distribution of economic gains across geographical regions and segments of the population, and the wider dimensions of societal wellbeing, including health, education and environmental sustainability (see Box 2 on measuring the changing wealth in Malaysia). Moreover, Malaysia is converging to the high-income threshold at a relatively slow pace (with slower growth in per capita income) than key comparator countries that have successfully made the transition in recent decades (see Figure 26).
FIGURE 25Malaysia is expected to pass the high-income country threshold within the next 2 to 6 years...
FIGURE 26...although at a slower pace of convergence relative to high-income comparators
Source: World Bank staff projections Source: World Bank staff calculations
Three Scenarios for When GNI Per Capita Will Pass the High-income ThresholdGNI Per Capita, World Bank Atlas Methodology (US$)
8,000
10,000
12,000
14,000
16,000
18,000
2016
2017
2018
2019
2020
2021
2022
2023
2024
2025
2026
Baseline
Low
High
High incomethreshold:US$12,055 asof July 1, 2018
15.414.7
11.1 10.9
3.8
0
2
4
6
8
10
12
14
16
18
Average Growth Rate of GNI Per Capita, 10-Year Period Prior to AchievingHigh-income Country Status, World Bank Atlas Methodology (US$)
Ko
rea,
Rep
.(1
984
- 19
93)
Sing
apo
re(1
974
- 19
83)
Uru
gua
y(2
003
- 20
12)
Po
land
(199
9 -
2008
)
Mal
aysi
a(2
008
- 20
17)
12 In calculating GNI in US dollar terms, the World Bank uses the Atlas conversion factor instead of simple exchange rates. The Atlas conversion factor for any given year is the average of a country’s exchange rate for the year and its exchange rates for the two preceding years, adjusted for the difference between the rate of domestic inflation and international inflation. The purpose of the adjustment is to lessen the effect of exchange rate variability in the cross-country comparison of national incomes.13 The simulations are based on World Bank staff forecasts of future GDP growth, as well as assumptions for, among other things, the ringgit exchange rate and the high-income country threshold.
33MALAYSIA ECONOMIC MONITOR | JUNE 2018
PART ONE - Recent Economic Developments and Outlook

Measuring the changing wealth of Malaysia
National income and well-being are underpinned by a country’s assets or wealth, which comprises produced capital, natural capital, human capital, and net foreign assets. Sustained long-term economic growth requires investment and management of this broad portfolio of assets. While a country’s gross national income, or GNI, provides an important measure of its income and production, it does not reflect changes in the economy’s underlying asset base and the flows of income that an asset generates over its lifetime. For instance, it does not reflect depreciation and depletion of assets; whether investment and accumulation of wealth are keeping pace with population growth; or whether the mix of assets is consistent with a country’s development goals. To measure these impacts, economic performance is best evaluated by assessing the growth of both income and wealth, to provide a more complete picture of a nation’s economic progress and its long-term well-being.14
Malaysia’s total wealth has almost tripled over the past two decades, driven largely by the significant growth of human capital assets.15 In the period from 1995 to 2014, Malaysia’s total wealth expanded
considerably, from US$2.7 trillion to US$7.2 trillion, with per capita wealth almost doubling from around US$130,000 to US$240,000 over this period (see Figure 27). Much of the increase in wealth was driven by the rapid accumulation of its human capital assets, which more than doubled to US$181,000 per capita, or 76 percent of the total wealth, by 2014, primarily reflecting the significant investment gains from education over the past decades. In contrast, produced capital16 increased only modestly, from US$22,000 to US$30,000 per capita, over the same period, and natural capital17 declined slightly in the early 2000s before recovering to its earlier per capita level of US$29,000 in 2014.
Relative to highly economically developed countries, Malaysia has a notably low share of produced capital wealth. Given that a country’s level of economic development is strongly related to the composition of its national wealth, it is useful to examine the differences in the wealth composition of Malaysia and high-income economies, particularly as Malaysia is expected to achieve high-income status within the coming years. As Table 4 shows, the accumulation of wealth among the OECD countries has been accompanied by an increasing
BOX 2
14 Measuring national wealth and changes in wealth is part of an ongoing effort by the World Bank to monitor the long-term economic well-being of nations. Its latest report, The Changing Wealth of Nations 2018, provides wealth accounts for 141 countries for the period 1995 to 2014.15 The present value of earnings of the labor force, which factors in not only the number of years of schooling completed by workers, but also the earnings gains associated with schooling (which implicitly factors in the quality of school learning) and how long workers can work (which implicitly accounts for health conditions through life expectancy, among others).16 The discounted sum of value of the rents generated by machinery, buildings, equipment, as well as residential and non-residential urban land.17 The discounted value of earnings from energy and minerals, agricultural land, forests and terrestrial protected areas.
PART ONE - Recent Economic Developments and Outlook
34 MALAYSIA ECONOMIC MONITOR | JUNE 201834

FIGURE 27While Malaysia has significant natural resources, the majority of the country’s wealth lies in its stock of human capital
TABLE 4Wealth per capita in Malaysia compares well with regional averages, but lags behind high-income comparators
0
100,000
200,000
300,000
-50%
0%
50%
100%
150%
1995 2000 2005 2010 2014
Shar
e o
f To
tal W
ealt
h
Tota
l Wea
lth
Per
Cp
apit
a (c
ons
tant
201
4 U
S$)
Natural Capital - Renewable
Produced Capital
Human Capital
Natural Capital - Nonrenewable
Net Foreign Assets
Total Wealth Per Capita
Wealth per capita, constant 2014 US$
Malaysia% oftotal
wealth
East Asia & Pacific
% oftotal
wealth
Upper middle income
% oftotal
wealth
High income: OECD
% oftotal
wealth
Total Wealth 239,203 100% 140,042 100% 112,798 100% 708,389 100%
Produced Capital 29,989 13% 39,185 28% 28,527 25% 195,929 28%
Natural Capital 28,657 12% 14,739 11% 18,960 17% 19,525 3%
Renewables 20,763 9% 9,872 7% 12,337 11% 11,514 2%
Nonrenewable 7,894 3% 4,868 3% 6,623 6% 8,011 1%
Human Capital 180,729 76% 84,334 60% 65,742 58% 498,399 70%
Net Foreign Assets -173 0% 1,784 1% -432 0% -5,464 -1%
Source: World Bank staff calculations
Source: World Bank staff calculations
concentration of assets in human and produced capital, totalling 98 percent of the aggregate wealth in 2014. Significantly, produced capital alone constitutes more than one-quarter of the average total wealth among these countries. By contrast, Malaysia has a relatively small proportion of produced capital, at 13 percent of its total wealth, partly compensated by a higher share of natural capital at 12 percent (OECD average: three percent), with its relative abundance of renewable resources, such as agricultural land and forests.
For resource-rich countries such as Malaysia, careful management of natural assets and investment of
resource rents into strengthening non-resource capital are crucial to ensuring sustainable development. In particular, Malaysia’s abundance of renewable resources could produce enormous benefits in the long term if managed sustainably. This would involve transforming resource rents into other forms of productive assets, such as produced and human capital, with these assets serving as the main source of future wealth. Achieving this requires a combination of sound macroeconomic policies, strong institutions and good governance to promote efficient resource extraction and to ensure that rents are reinvested to generate long-term gains.
PART ONE - Recent Economic Developments and Outlook
35MALAYSIA ECONOMIC MONITOR | JUNE 2018 35

Implementation of the election mandate will require careful management of potential risksThe change of the consumption tax system from GST back to SST, and the adjustment to the fuel pricing mechanism, in the absence of adequate compensatory measures, would constrain the existing fiscal policy space. While the change of the consumption tax system from GST back to SST may partially alleviate the cost of living pressures experienced by its citizens, the absence of adequate compensatory revenue measures would result in appreciable narrowing of the government’s revenue base18, and greater reliance on less stable direct taxation and oil-related revenue. This in turn could increase the tendency for fiscal procyclicality and constrain the flexibility of fiscal adjustment against future macroeconomic shocks. The adjustment to the fuel pricing mechanism in its current form would compound the immediate fiscal strains, with the benefits being enjoyed disproportionately by the higher-income segments of the population who tend to consume a larger amount of fuel.19
the government’s medium-term development priorities and plans, could create additional uncertainty on the direction of public investments going forward, and thus on its overall contribution to growth.
Other notable risks include the relatively high levels of private and public-sector debt. In particular, the relatively high level of household debt in the context of persistent property market excesses remains a source of risk to macro-financial stability as well as acting as a strain on household spending, which warrants close monitoring. Concurrently, the overall public debt stock has remained relatively high due to the continued accumulation of fiscal deficits, and fiscal commitments from public private partnerships (PPPs). Addressing the stock of public-sector debt will require careful trade-offs, including expenditure consolidation and a review of new sources of revenue.
As a highly open economy, Malaysia will also continue to face substantial risks relating to uncertainty in the external environment. In particular, the possibility of financial market disruptions has increased amid shifting monetary policy expectations in advanced economies, which could spread across emerging economies including Malaysia, through heightened financial market volatility, reversals in capital flows, and pressures on exchange rates. Another key source of risk relates to the increasingly intense protectionist tendencies and trade tensions in some major economies. Should these escalate or lead to a loss of confidence, there would likely be a dampening effect on global trade and investment flows. Such an escalation would have a disproportionate adverse impact on Malaysia, given its high level of integration with the global economy and financial markets, and its dependence on global value chains as a source of growth. On the other hand, a higher-than-expected upturn of growth in major economies, further strengthening of global commodity prices and greater stability in the Korean peninsula represent the main upside risks, in turn could spur a stronger-than-anticipated expansion in Malaysia’s exports.
18 GST constituted 19.8 percent on average of the total Federal Government revenue between 2016 and 2017, compared to SST at 7.5 percent between 2010 and 2014.19 The government, however, has indicated in its election manifesto that it intends to move towards a more targeted petrol subsidy mechanism for the lower-income groups.
Addressing the stock of public-sector debt will require careful trade-offs, including expenditure consolidation and a review of new sources of revenue
The cancellation and reassessment of several planned large infrastructure projects raises uncertainty on the outlook for both public and private investments. In response to the need to reduce expenditures given the reduced fiscal revenue outlook, the government has indicated that it will review selected existing large-scale projects and assess their feasibility. These include the HSR and the East-Coast Rail Link (ECRL) projects. In addition, certain projects such as the Mass Rapid Transit Line 3 (MRT3) have also been canceled. The ongoing assessment of these large-scale projects, pending announcements on
36 MALAYSIA ECONOMIC MONITOR | JUNE 2018
PART ONE - Recent Economic Developments and Outlook

Supportive conditions offer an opportunity to undertake deeper reforms for sustained and more inclusive growthMalaysia is entering into a new period that offers an opportunity to undertake bold structural reforms that will facilitate the achievement of sustained long-term growth. As Malaysia converges with high-income and developed economies, incremental growth will depend less on factor accumulation, which had facilitated growth in the past, and more on raising the level of productivity to sustain higher potential growth. Thus, it is crucial to intensify the reform agenda to tackle key structural constraints to productivity growth and boost longer-term growth prospects20. Policymakers should prioritize measures to address labor market constraints and distortions in output markets; to improve the quality of education and training; to deepen regional trade integration and to improve trade facilitation; to build innovation capacity and to raise the competitiveness of SMEs; and to unlock the potential of the digital economy as a future driver of growth. The new environment has also created opportunities for deeper reforms to strengthen institutions and governance, including enhancing public institutions, lifting public sector efficiency, confronting corruption, improving transparency and citizen engagement. These reforms are crucial to support and sustain Malaysia’s development path.
Ensuring longer-term fiscal sustainability in the new fiscal setting would necessitate introducing measures to diversify sources of fiscal revenue, rationalize non-essential operating outlays and improve spending efficiency. It is important to ensure that the size and pace of fiscal adjustment is in line with the present cyclical conditions, in order to strengthen fiscal space and thereby to prepare for future adverse shocks. Priority reforms on the revenue front should center on broadening the SST base, expanding the coverage of personal income tax, reviewing the existing tax incentives, and strengthening overall tax administration and compliance. Consideration could also be given to ensure that the SST framework reflects the scale of transactions and profits being generated by Malaysia’s digital economy. On the expenditure side, reform efforts should aim at containing the relatively sizeable cost of civil service salaries and pension outlays, further rationalizing discretionary spending, untargeted subsidies and transfers, restructuring some of the large-scale infrastructure projects, as well as improving the
efficiency of development spending. Concurrently, the need to strengthen fiscal buffers should be carefully balanced against other important considerations, including providing adequate social safety nets and sustaining growth-enhancing investments.
A renewed social contract is essential to promote upward economic mobility and security and to facilitate the broader development of Malaysian society. Ensuring that people have greater opportunities to improve their lives and access to mechanisms that help protect those gains from economic shocks are essential in achieving inclusive growth. Policies need to be formulated to address lower- and middle-income Malaysians’ growing aspirations and demand for quality affordable housing and public services, while narrowing existing disparities in social and economic development. Complementary policies are needed to mitigate ex ante exposure to risks and to enhance ex post capacity to cope with adverse shocks (see Box 3 on building a better social protection system in Malaysia).
An agenda for inclusive growth and development in Malaysia could consist of three pillars: fostering economic mobility; providing greater economic security; and strengthening the institutions required for inclusive growth. Increasing upward economic mobility will require measures to eliminate existing disparities in access to jobs and services and to improve the quality of available jobs, especially for those who have invested in acquiring the skills needed in the modern work force. Enhanced economic security will depend on a more effective provision of social assistance for low-income households, a stronger system of social insurance (for example, employment insurance, health care, pensions) to increase resilience to idiosyncratic shocks, and country-level schemes to manage large systemic shocks. To facilitate the achievement of inclusive growth, policies should be formulated to level the playing field in access to services and economic opportunities (including measures to increase women’s labor force participation), to increase the effectiveness of pro-inclusion spending programs, to mobilize resources through progressive taxation, and to adapt to the realities of an ageing population.
20 World Bank (2018) ‘Productivity Unplugged: The Challenges of Malaysia’s Transition into a High-income Country’, The Malaysian Development Experience Series, Washington, DC: The World Bank.
37MALAYSIA ECONOMIC MONITOR | JUNE 2018
PART ONE - Recent Economic Developments and Outlook
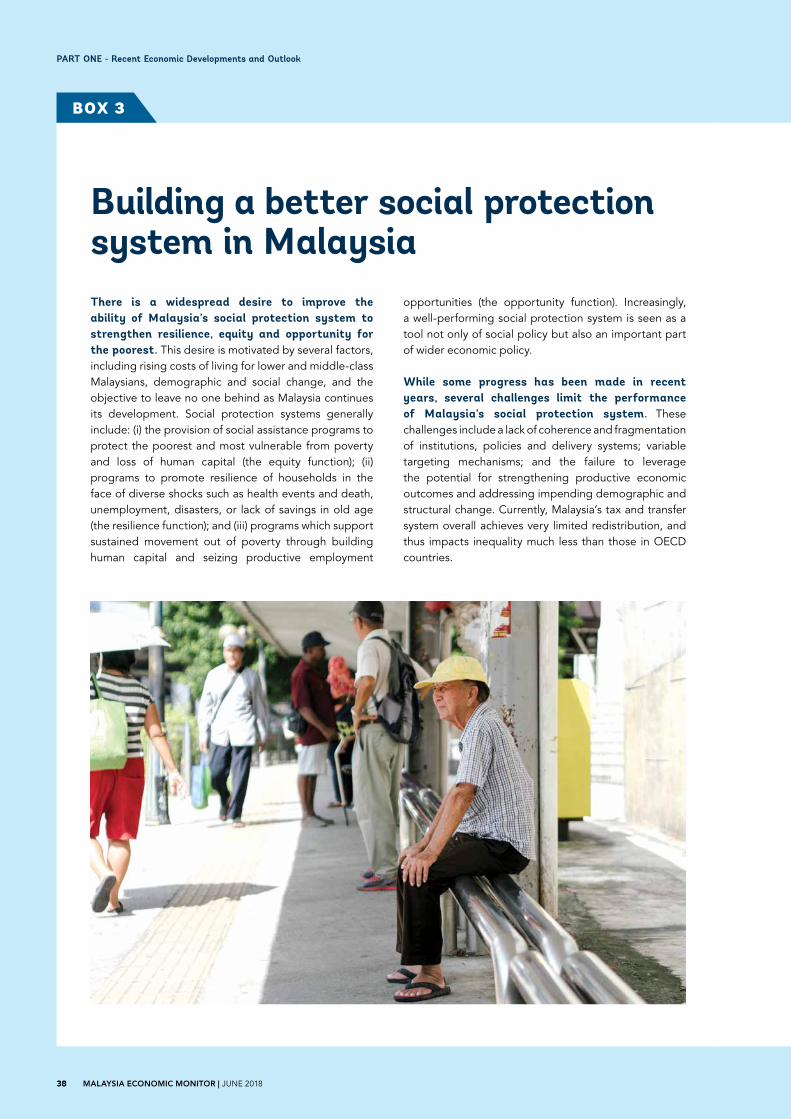
Building a better social protection system in Malaysia There is a widespread desire to improve the ability of Malaysia’s social protection system to strengthen resilience, equity and opportunity for the poorest. This desire is motivated by several factors, including rising costs of living for lower and middle-class Malaysians, demographic and social change, and the objective to leave no one behind as Malaysia continues its development. Social protection systems generally include: (i) the provision of social assistance programs to protect the poorest and most vulnerable from poverty and loss of human capital (the equity function); (ii) programs to promote resilience of households in the face of diverse shocks such as health events and death, unemployment, disasters, or lack of savings in old age (the resilience function); and (iii) programs which support sustained movement out of poverty through building human capital and seizing productive employment
opportunities (the opportunity function). Increasingly, a well-performing social protection system is seen as a tool not only of social policy but also an important part of wider economic policy.
While some progress has been made in recent years, several challenges limit the performance of Malaysia’s social protection system. These challenges include a lack of coherence and fragmentation of institutions, policies and delivery systems; variable targeting mechanisms; and the failure to leverage the potential for strengthening productive economic outcomes and addressing impending demographic and structural change. Currently, Malaysia’s tax and transfer system overall achieves very limited redistribution, and thus impacts inequality much less than those in OECD countries.
BOX 3
38 MALAYSIA ECONOMIC MONITOR | JUNE 201838
PART ONE - Recent Economic Developments and Outlook

Social protection in Malaysia has the potential to be more effective and efficient if it can achieve a more coherent system at the policy and delivery levels. Malaysia’s social protection system has the potential to play a more active policy role, stimulating savings for growth and ageing, supporting a more efficient labor market, and managing economic and household level risks. Social assistance could also shift to a more productive policy promoting sustainable graduation from social assistance where possible, while continuing to protect the truly poor and vulnerable. There could also be greater coherence and strategic vision in social protection policy and program development, including through the development of a national Social Protection Masterplan.
There is significant potential for better outcomes from the proposed Cost of Living Aid as compared to Bantuan Rakyat 1Malaysia or 1Malaysia People’s Aid (BR1M). BR1M did not fully realize its potential to achieve better socio-economic impacts given the significant level of spending. Cost of Living Aid as compared to BR1M could be strengthened by improving the targeting methodology; increasing the transparency of the budgeting and spending process; and better accounting for household location, size and composition. Cost of Living Aid also has potential to leverage goals such as higher old-age savings and incentives for workers to formalize. Beyond Cost of Living Aid, core safety net and active labor programs are underfunded in Malaysia, despite having some of the best targeting outcomes. Their potential expansion would need to be accompanied by a systematic emphasis on productive social assistance to minimize welfare dependency for those who are able to work.
The social protection system could be more effective by reducing fragmentation of social assistance programs, consolidating around flagship programs and improving and standardizing the delivery, targeting and data management mechanisms. Opportunities for consolidation of fragmented social assistance programs could be explored with a focus on protecting those who are most vulnerable. Front-end service delivery also has major potential to be consolidated in order to improve efficiency. In addition, Malaysia could move towards a more standardized and commonly implemented targeting system to promote a consistent approach in terms of the unit of targeting and program eligibility thresholds. While some steps
have been initiated to consolidate beneficiary lists from e-kasih, e-bantuan and BR1M, there is also significant potential to take integration of management information systems to a deeper level of inter-operability.
For pensions and old-age savings, Malaysia faces a dual agenda of improving the adequacy of financial protection for those already contributing to the Employees Provident Fund (EPF) while expanding coverage to reach the roughly 40 percent of the labor force currently outside the EPF net. As the country ages rapidly over coming decades, ensuring fuller coverage with adequate benefits becomes even more vital. A first step would be covering more of the elderly through supplemental approaches, including: (i) considering a non-contributory pension for those without pensions or adequate EPF accumulations; and (ii) higher matching subsidies for EPF contributions for low-income workers to incentivize higher participation in the EPF. For those with EPF accounts, the minimum age for withdrawals of savings could be further increased over time. Changes to early withdrawal rules to improve adequacy of payouts at retirement and merging the civil service pension scheme into the EPF for new civil servants (with an occupational supplement) could also be considered.
Recent decades have seen major reforms of institutions, policies and delivery systems globally, and these provide valuable lessons for Malaysia. For instance, globally, there has been a trend towards consolidation of social assistance programs into fewer flagship national programs, and of fragmented information systems towards inter-operable “social registries” which provide the informational base upon which many public programs can draw from as they determine eligibility.
Social protection in Malaysia has the potential to be more effective and efficient if it can achieve a more coherent system at the policy and delivery levels
39MALAYSIA ECONOMIC MONITOR | JUNE 2018 39
PART ONE - Recent Economic Developments and Outlook


PART TWO
Unlocking the Potential of the Digital Economy
41MALAYSIA ECONOMIC MONITOR | JUNE 2018

Key building blocks need to be in place for Malaysia to achieve its digital economy ambitions
Unlocking the potential of the digital economy
In broad terms, the digital economy promotes development and growth through three channels (see Figure 28). First, it promotes inclusion and expands markets by reducing transaction costs and thereby enabling businesses to provide services to segments of the market that might previously not have been viable. Second, digital technologies boost efficiency, enabling businesses to provide faster services, that are cheaper and more convenient. Third, these technologies can significantly reduce the cost of economic and social transactions for households, businesses and government, thereby promoting innovation.
Harnessing the opportunities created by the emergence of the digital economy could help Malaysia achieve sustainable growth and greater inclusivity. In the past, Malaysia’s economic growth has been largely driven by factor accumulation and the transformation of factors of production from lower to higher productivity activities. With this model of growth generating diminishing returns, it is now essential for Malaysia to harness the opportunities created by the emergence of the digital economy, and to adopt digital technologies to drive productivity growth. Moving forward, Malaysia’s next challenge is to ensure that it continues to create the necessary environment to enable the country to reap all of the potential benefits offered by the emergence of the digital economy. To do this, it must establish the appropriate infrastructure, bring a critical mass of individuals and businesses online, ensure that its workforce is equipped with the appropriate skills to leverage the digital economy, and formulate the appropriate policies to drive the digital transformation.
While Malaysia has already taken a number of significant steps towards embracing the digital economy, for it to generate the optimal benefits, it must address a number of key challenges. The country has made significant progress towards expanding access to basic Internet services, with almost 80 percent of the population having internet access by the end of 2016, ahead of most of its regional peers and on par with many advanced economies. Nonetheless, several key challenges need to be addressed. In particular, the level of adoption by businesses remains relatively low compared to international comparators, with cost and quality issues acting as constraints. Moreover, Malaysia also lags behind comparator countries with similar income levels in terms of the level of adoption of fixed broadband services. Businesses often identify concerns related to the cost and quality of internet services as the key constraints on the increased use of digital tools.
This edition of the Malaysia Economic Monitor attempts to analyze the extent to which Malaysia is prepared to leverage the opportunities created by the emergence of the digital economy. Specifically, it broadly analyzes two important pillars of the digital economy, these being the level of digital adoption by economic agents and the current state of digital connectivity infrastructure. The chapter identifies the areas where Malaysia is performing well and where improvements could be made. Amongst other issues, it identifies constraints related to the high costs of fixed broadband connections and the challenges that need to be addressed in order to improve businesses’ digital adoption.
42 MALAYSIA ECONOMIC MONITOR | JUNE 2018
PART TWO - Unlocking the Potential of the Digital Economy
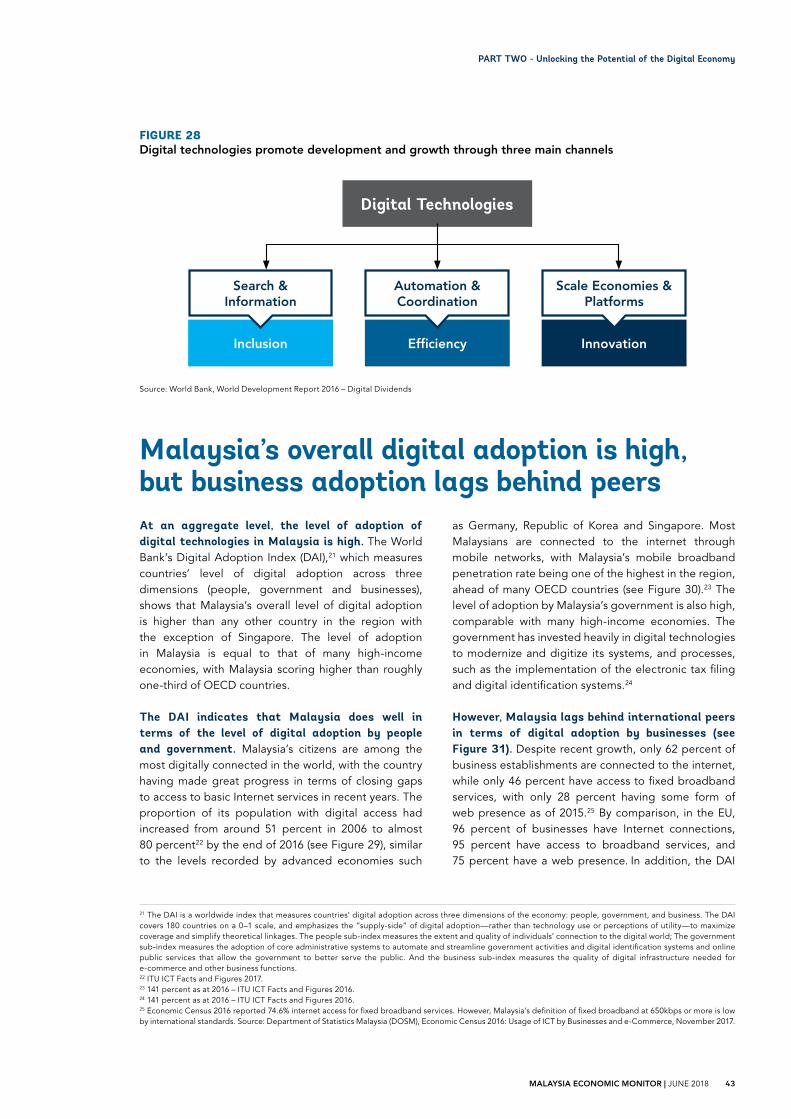
FIGURE 28Digital technologies promote development and growth through three main channels
Source: World Bank, World Development Report 2016 – Digital Dividends
21 The DAI is a worldwide index that measures countries’ digital adoption across three dimensions of the economy: people, government, and business. The DAI covers 180 countries on a 0–1 scale, and emphasizes the “supply-side” of digital adoption—rather than technology use or perceptions of utility—to maximize coverage and simplify theoretical linkages. The people sub-index measures the extent and quality of individuals’ connection to the digital world; The government sub-index measures the adoption of core administrative systems to automate and streamline government activities and digital identification systems and online public services that allow the government to better serve the public. And the business sub-index measures the quality of digital infrastructure needed for e-commerce and other business functions.22 ITU ICT Facts and Figures 2017.23 141 percent as at 2016 – ITU ICT Facts and Figures 2016.24 141 percent as at 2016 – ITU ICT Facts and Figures 2016.25 Economic Census 2016 reported 74.6% internet access for fixed broadband services. However, Malaysia’s definition of fixed broadband at 650kbps or more is low by international standards. Source: Department of Statistics Malaysia (DOSM), Economic Census 2016: Usage of ICT by Businesses and e-Commerce, November 2017.
Malaysia’s overall digital adoption is high, but business adoption lags behind peersAt an aggregate level, the level of adoption of digital technologies in Malaysia is high. The World Bank’s Digital Adoption Index (DAI),21 which measures countries’ level of digital adoption across three dimensions (people, government and businesses), shows that Malaysia’s overall level of digital adoption is higher than any other country in the region with the exception of Singapore. The level of adoption in Malaysia is equal to that of many high-income economies, with Malaysia scoring higher than roughly one-third of OECD countries.
The DAI indicates that Malaysia does well in terms of the level of digital adoption by people and government. Malaysia’s citizens are among the most digitally connected in the world, with the country having made great progress in terms of closing gaps to access to basic Internet services in recent years. The proportion of its population with digital access had increased from around 51 percent in 2006 to almost 80 percent22 by the end of 2016 (see Figure 29), similar to the levels recorded by advanced economies such
as Germany, Republic of Korea and Singapore. Most Malaysians are connected to the internet through mobile networks, with Malaysia’s mobile broadband penetration rate being one of the highest in the region, ahead of many OECD countries (see Figure 30).23 The level of adoption by Malaysia’s government is also high, comparable with many high-income economies. The government has invested heavily in digital technologies to modernize and digitize its systems, and processes, such as the implementation of the electronic tax filing and digital identification systems.24
However, Malaysia lags behind international peers in terms of digital adoption by businesses (see Figure 31). Despite recent growth, only 62 percent of business establishments are connected to the internet, while only 46 percent have access to fixed broadband services, with only 28 percent having some form of web presence as of 2015.25 By comparison, in the EU, 96 percent of businesses have Internet connections, 95 percent have access to broadband services, and 75 percent have a web presence. In addition, the DAI
Digital Technologies
Inclusion
Search & Information
Efficiency
Automation & Coordination
Innovation
Scale Economies & Platforms
43MALAYSIA ECONOMIC MONITOR | JUNE 2018
PART TWO - Unlocking the Potential of the Digital Economy
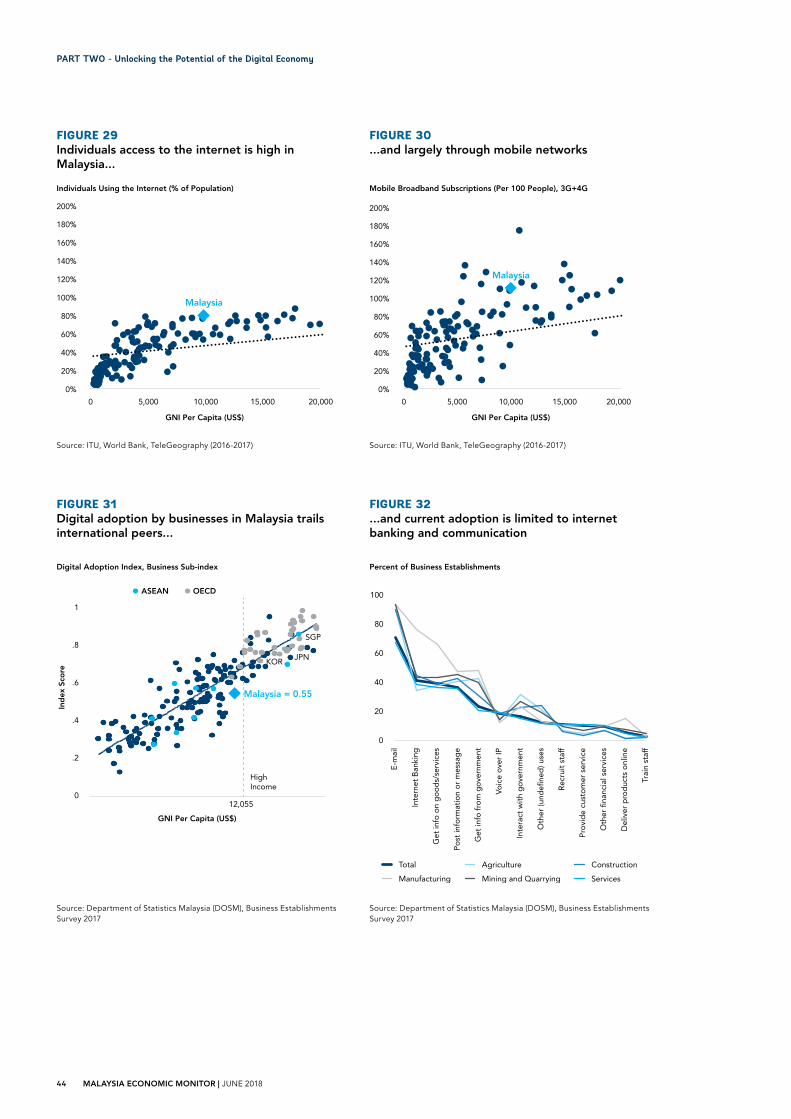
FIGURE 29Individuals access to the internet is high in Malaysia...
FIGURE 31Digital adoption by businesses in Malaysia trails international peers...
FIGURE 30...and largely through mobile networks
FIGURE 32...and current adoption is limited to internet banking and communication
Source: ITU, World Bank, TeleGeography (2016-2017)
Source: Department of Statistics Malaysia (DOSM), Business Establishments Survey 2017
Source: ITU, World Bank, TeleGeography (2016-2017)
Source: Department of Statistics Malaysia (DOSM), Business Establishments Survey 2017
Individuals Using the Internet (% of Population)
0%
20%
40%
60%
80%
100%
120%
140%
160%
180%
200%
0 5,000 10,000 15,000 20,000
GNI Per Capita (US$)
Malaysia
Digital Adoption Index, Business Sub-index
Malaysia = 0.55
JPNKOR
SGP
HighIncome
0
.2
.4
.6
.8
1
Ind
ex S
core
GNI Per Capita (US$)
12,055
ASEAN OECD
Mobile Broadband Subscriptions (Per 100 People), 3G+4G
0%
20%
40%
60%
80%
100%
120%
140%
160%
180%
200%
0 5,000 10,000 15,000 20,000
GNI Per Capita (US$)
Malaysia
E-m
ail
Inte
rnet
Ban
king
Get
info
on
go
od
s/se
rvic
es
Po
st in
form
atio
n o
r m
essa
ge
Get
info
fro
m g
ove
rnm
ent
Voic
e o
ver
IP
Inte
ract
wit
h g
ove
rnm
ent
Oth
er (u
ndefi
ned
) use
s
Rec
ruit
sta
ff
Pro
vid
e cu
sto
mer
ser
vice
Oth
er fi
nanc
ial s
ervi
ces
Del
iver
pro
duc
ts o
nlin
e
Trai
n st
aff
Percent of Business Establishments
0
20
40
60
80
100
Total
Manufacturing
Agriculture
Mining and Quarrying
Construction
Services
44 MALAYSIA ECONOMIC MONITOR | JUNE 2018
PART TWO - Unlocking the Potential of the Digital Economy

for businesses also shows that Malaysia has more limited international bandwidth and a smaller number of secure servers. In general, in terms of the level of digital adoption by businesses, Malaysia’s performance is roughly average for a lower middle-income country.
Currently, Malaysian businesses use digital services mainly only to establish a web presence, to conduct business communications, and to conduct banking transactions, with comparatively few engaging in e-commerce. The most common use of the internet by businesses is to send and receive emails, to conduct Internet banking transactions, and to obtain information from other businesses and the government (see Figure 32).26 Firms that engage in e-commerce are usually bigger firms with greater assets, more employees and higher revenues. The use of the internet for more sophisticated, innovative functions such as big data and artificial intelligence remains relatively low.
There are also significant regional disparities between highly urbanized states and the rest of the country when it comes to the level of digital adoption by businesses. In general, industrialized and/or urbanized states such as Penang, Melaka, Selangor, Kuala Lumpur and Johor have relatively higher levels of adoption. This is partly due to the lower connection costs in urban areas, with higher population densities driving costs down, and also to various government campaigns and initiatives in a number of states to promote access such as the Multimedia Super Corridor in Selangor. There is also a strong positive correlation between the level of adoption and the level of sectorial productivity, with manufacturing and mining in particular having higher levels of adoption. In states where the services sector has a relatively high level of productivity, businesses are also more likely to be connected. The size of a firm is also a significant determining factor, with the level of digital adoption by smaller firms remaining limited, as only about 20 percent of SMEs in Malaysia use the internet for business operations.27
The two major barriers to digital adoption cited by businesses are quality and affordability –slow internet connection and lack of affordable broadband plans. In a survey conducted by the MDEC and the Federation of Malaysian Manufacturers (FMM), more than 50 percent of manufacturing firms listed
lack of access to the internet and slow internet speed as the most significant constraints to utilizing digital technologies.28 In addition, the market lacks broadband plans that adequately meet the needs and budgets of businesses, particularly SMEs. Until recently, Malaysia’s fixed broadband services have been focused either on enterprise businesses, with these services being too expensive for the vast majority of small enterprises, or on mass-market services, with these services not offering the degree of reliability necessary for advanced business purposes.
26 Department of Statistics Malaysia (DOSM), Economic Census 2016: Usage of ICT by Businesses and e-Commerce, November 2017.27 SME Corp, 2015. 28 MDEC and FMM 2016, “The Adoption of ICT among FMM members”.
The level of digital adoption in Malaysia is equal to that of many high-income economies, with Malaysia scoring higher than roughly one-third of OECD countries
In the future, the adoption of digital services by the private sector may be constrained if businesses are not able to fully utilize digital technologies. Efforts to promote e-commerce may not achieve their full potential if firms are not able to use digital technologies that underpin digital operations. Thus, providing high quality internet services is crucial for businesses, as high intensity use of productivity-boosting digital services tends to consume more bandwidth. Without access to high-speed broadband connections, the widespread use and development of more advanced applications such as data analytics, Internet of Things (IoT) and artificial intelligence is unlikely. The lack of high quality and affordable broadband services may result in Malaysian firms foregoing opportunities for growth, productivity gains and innovation.
45MALAYSIA ECONOMIC MONITOR | JUNE 2018
PART TWO - Unlocking the Potential of the Digital Economy

Malaysia’s fixed broadband adoption is low, mainly due to high costsMalaysia has made significant progress towards establishing the foundations for digital connectivity and closing the gaps in basic internet access. By 2016, almost 80 percent of Malaysians had access to the internet, a level comparable to that in many advanced economies, including Australia, Japan and Republic of Korea. In Malaysia, the expansion of access to the Internet is largely the result of the uptake of mobile services, which is the preferred means of accessing the Internet. In Q1 2017, Malaysia’s mobile broadband subscribers for 3G and 4G networks has reached 118 percent of the total population, with this high proportion largely attributable to the widespread deployment of affordable smartphones and the expansion of 3G/4G networks.29
However, when it comes to the level of adoption of fixed broadband services, Malaysia lags behind other countries at a similar level of economic development, with limited use of fiber optic broadband services. Available data indicates that
only about eight percent of Malaysian households use fiber broadband services, with a slow growth rate. By comparison, the rate of adoption of these services in Singapore, Republic of Korea and Japan stands at 99 percent, 85 percent and 60 percent respectively (see Figure 33).30 A major constraint on higher levels of adoption in Malaysia is the high cost of these services (see Figure 34). The cost of these services remains high despite Malaysia having had one of the highest per capita levels of private investment in telecommunications in the region since 2010.31
Malaysian consumers pay considerably more for high-speed broadband access than consumers in other countries. While Malaysia has made significant progress in terms of facilitating affordable access to mobile internet services,32 the cost of access to high-speed broadband services is relatively high compared to other countries. In terms of price per Mbps, Malaysia ranks 74 out of 167 countries for fixed broadband services and 64 out of 118 for fiber broadband
FIGURE 33Fiber broadband growth in Malaysia significantly lags behind regional comparators...
FIGURE 34...partly due to the unaffordability of the services
Source: TeleGeography 2017 Source: TeleGeography 2017
Fiber Optic Broadband Subscriptions (% of All Households)
SG, 99%
KR, 85%
CN, 73%
JP, 60%
BN, 54%
VN, 32%
NZ, 23%
AU, 14%
MY, 8%
PH, 1%0%
20%
40%
60%
80%
100%
2012 2013 2014 2015 2016 2017
Average Price of Fixed Broadband Services (USD/Mbps, Log Scale)
PH
MY JP AUNZ
HKKR SG
0.01
0.1
1
10
100
1,000
10,000
0 10,000 20,000 30,000 40,000 50,000 60,000
GNI Per Capita (US$)
29 Based on calculation using the total subscription of 3G, 4G and LTE subscribers.30 TeleGeography, 2017.31 World Bank Private Participation in Infrastructure Database 2017.32 Malaysia ranks fourth in the Affordability Drivers Index by the Alliance for Affordable Internet.
46 MALAYSIA ECONOMIC MONITOR | JUNE 2018
PART TWO - Unlocking the Potential of the Digital Economy

FIGURE 35High fixed broadband prices are, in part, driven by limited market competition
Source: TeleGeography 2017
services.33 This places it behind regional comparators such as Vietnam and countries at a similar level of economic development such as Mexico and Turkey.
The high cost of fixed broadband internet services is partly driven by limited competition in the fixed broadband market. Relative to other countries, Malaysia’s fixed broadband market is much more concentrated than is the case for mobile services in Malaysia (see Figure 35). In Malaysia, Telekom Malaysia (TM), the leading fixed broadband service provider, as a significantly larger market share than the leading firms in other countries. The limited competition contributes to the higher fixed broadband prices in three ways. First, while TM is the major incumbent of cable landing stations in Malaysia, rather than allowing for co-location of its stations with other operators, it instead provides point-of-access connection outside the stations and charges a higher fee, which translates to a higher cost of broadband rollout. Second, given TM’s extensive broadband networks, it has been awarded exclusive memorandums of understanding with the government to deploy the high-speed broadband (HSBB) and sub-urban broadband (SUBB) plans, without contest. This eventually eliminates the possibility of attracting
private investment by the network rollout operations. Third, Malaysia also pays a higher IP transit prices34 than is the case in other countries, and this is subsequently passed on to retail consumers of broadband services.
Malaysia also performs relatively poorly in terms of the quality of its broadband services. In February 2018, Malaysia’s average download speed was ranked 63rd out of 130 countries, with an average download speed of 22.56 Mbps. This is significantly lower than regional comparators such as Singapore, which ranked in top place (161.53 Mbps) and Republic of Korea, which came in third (129.64 Mbps). Countries at similar levels of economic development as Malaysia also have significantly faster download speeds. For example, Hungary has an average download speed of 90.94 Mbps, while Thailand has an average speed of 41.35 Mbps.35
Malaysia should look beyond doubling its internet speed and aspire to achieve gigabit-level of connectivity, similar to advanced economies. In the global context, Malaysia’s plans to develop its HSBB and SUBB36 are unlikely to make Malaysia significantly more competitive, given that many advanced economies
33 TeleGeography, 2017, World Bank staff calculations34 The service of allowing traffic from another network to cross or “transit” the provider’s network, usually used to connect an internet service provider to the rest of the Internet, (https://www.telstraglobal.com/insights/blogs/blog/peering-vs-transit).35 Speedtest Global Index, February 2018 (http://www.speedtest.net/global-index)36 The HSBB is designed to deliver up to 100 Mbps for areas deployed with Fibre-to-Home broadband, while the SUBB is designed to deliver up to 20 Mbps through copper line upgrades
Telekom Malaysia (92.2%)
Maxis (6.2%)
YTL Communications (0.2%)
Other Players (0.5%)
webe (0.9%)
Subscribers (June 2017)
UQ Communications (29.7%)
NTT (24.7%)
KDDI (4.8%)
NTT DOCOMO (4.4%)
Other Players (29.1%)
Softbank BB (7.3%)
Subscribers (June 2017)
KT Corp (42.2%)
SK Broadband (25.0%)
Other Players (15.4%)
LG Uplus (17.4%)
Subscribers (June 2017)
MALAYSIA JAPANREPUBLIC OF KOREA
47MALAYSIA ECONOMIC MONITOR | JUNE 2018
PART TWO - Unlocking the Potential of the Digital Economy

FIGURE 36Different arrangements for infrastructure development across states may be driving up costs and delaying network rollout
Source: MCMC, stakeholder interviews
State government arrangements for telecom infrastructure development as at November 2017[% are total of broadband penetration (mobile and �xed)]
Labuan 61%
Sarawak 94%
Sabah 56%
Penang 114%
Perlis 71%
Kedah 72%
Kelantan 66%
Terengganu 72%
Pahang 75%
Negeri Sembilan 112%
Johor 138%
Melaka 90%
Putrajaya 70%
Kuala Lumpur 200%
Selangor 124%
Perak 89%
Closed market: Telco infra building dominated by an exclusive partner of the state government
Open market: Telco free to roll out network
Streamlined market: Telco infra building dominated by SBCs but telcos still free to roll out network
37 Korea Internet & Security Agency, https://www.kisa.or.kr/jsp/common/downloadAction.jsp?bno=263&dno=3...238 Government Offices of Sweden (http://www.government.se/496173/contentassets/afe9f1cfeaac4e39abcdd3b82d9bee5d/sweden-completely-connected-by-2025-eng.pdf)39 Malaysian Communications and Multimedia Commission (MCMC), 2017.
are already planning for gigabit networks. Republic of Korea, for example, has already implemented the Giga-Internet Pilot project, with plans to commercialize 10 Gbps broadband services by 2020,37 while Sweden aims to provide broadband access at a minimum speed of 1 Gbps by 2025.38
Regional disparities in terms of both the level of access to broadband services and their quality are also significant. For example, in Kuala Lumpur, the broadband penetration rate stood at 200 percent in Q1 2017. By contrast, the corresponding rate in Sabah stood at 56 percent, significantly below the national average of 104 percent (see Figure 36).39 Similarly, there is also significant disparities in average download speeds, with the lowest speeds in the East Malaysian states of Sabah and Sarawak. With these disparities, Malaysians in different regions have widely varying experiences with digital services, creating disparities in the abilities of people in different regions to seize the opportunities made available by the new technology.
At the state level, poorly implemented arrange-ments for the development of infrastructure may result in increased costs and delays to the rollout
of the network. In some states, land planning and use arrangements slow down or increase the costs of network roll out, posing additional challenge to network operators. Many states appoint a third-party entity to function as the intermediary between telecommunication providers and local councils. However, these state-backed companies often have exclusive rights to build or manage infrastructure used by telecommunications networks. As a result, states with exclusive partners for network deployment and where telecommunication operators are not free to build networks tend to have lower penetration rate.
Moving forward, to improve digital connectivity, Malaysia should consider adopting policies with two main objectives: (i) improving the quality and affordability of fixed broadband services; and (ii) increasing the coverage of ultra-fast broadband networks. To achieve these objectives, the government should consider three broad strategies. First, it should strive to increase the level of competition in the fixed broadband market. In the short term, this could be achieved by enforcing the current regulatory framework to provide all operators with access to cable landing stations. In the medium-term, this could be achieved
48 MALAYSIA ECONOMIC MONITOR | JUNE 2018
PART TWO - Unlocking the Potential of the Digital Economy

The ecosystem is supportive of digital entrepreneurship, though challenges existMalaysia has made significant efforts to establish the right ecosystem to foster digital entrepreneurship. A range of institutions, including the Malaysian Digital Economy Corporation (MDEC), the Malaysian Global Innovation and Creativity Centre (MaGIC) and Cradle, have been established to attract investments, provide incentives, facilitate financing and offer training and opportunities to start-up firms. Malaysia’s funding ecosystem functions relatively well in terms of supporting firms at the early entrepreneurial stages. The government’s efforts and those of these institutions, coupled with relatively high levels of digital connectivity and the high-profile success of businesses such as K-fit and Iflix, have played a role in encouraging Malaysians to become entrepreneurs. Malaysia has also pioneered steps to promote inclusivity through digital entrepreneurship programs such as eUsahawan and eRezeki, which is a program intended to enable the B40 and M40 income groups to take advantage of potential business opportunities created by the gig or sharing economy (see Box 4).
For digital entrepreneurship to fully realize its potential, several challenges, including the low level of adoption of digital payments, will need to be addressed. Establishing an environment of confidence and trust is essential to build a vibrant e-commerce environment. This can be achieved through a number of means including establishing a secure and seamless e-payment infrastructure, improving data accessibility and strengthening cybersecurity risk policies and laws. Additionally, the government should continue to build on its various initiatives to develop human capital, including working with the private sector to ensure graduates have the appropriate skills needed to capitalize opportunities in digital entrepreneurship.40
40 #mydigitalmaker was launched in August 2016, with this initiative consisting of two strategies: the full integration of STEM education in the national school curriculum, and the provision of co-curricular and extra-curricular activities related to the digital ecosystem for youth.
by opening up the market across all levels of the value chain. Second, the government should strive to attract increased private capital to execute public programs, which would also facilitate the achievement of the first strategy, making the fixed broadband market more competitive. This could include opening programs such as the HSBB and SUBB by implementing a competitive
bidding process to involve a wider range of private companies and investors. Third, it should implement measures to expand coverage and to narrow the digital gap between states by ensuring the more effective development of infrastructure deployment through improved planning and coordination with state governments and local councils.
49MALAYSIA ECONOMIC MONITOR | JUNE 2018
PART TWO - Unlocking the Potential of the Digital Economy

Fostering digital inclusivity through Malaysia’s eRezeki and eUsahawan programsIn 2015, the eRezeki and eUsahawan initiatives were launched to facilitate the greater involvement of key communities such as youth, micro-SMEs, digital entrepreneurs and the B40 communities in the digital economy. The objective of the eRezeki initiative is to provide opportunities to members of B40 communities to earn additional income by leveraging digital technologies. The eUsahawan initiative is a digital entrepreneurship program intended to mainstream digital entrepreneurship education amongst emerging and current micro-entrepreneurs through a community-centric approach.
The eRezeki initiative has three major strategies. The first strategy is to identify and establish collaboration between local and international digital platforms to secure and channel various tasks/work that could be performed by Malaysian workers. The tasks/work can fall into three categories: simple digital micro-tasks, digitally-enabled tasks, and digital work. The second strategy is to conduct outreach to targeted communities to profile and match them to suitable tasks/work. The participants collaborate with on-boarded partners’ platforms to start performing actual tasks/work and thereby to earn income. Third,
BOX 4
eRezeki functions as an intermediary platform to link up participants with tasks/work aggregated from local and international platforms through an open Application Public Interface (API). Going forward, the global online workforce program, which is an offshoot of the eRezeki program, has been introduced to prepare the country’s workforce to respond to the global trend towards the increased use of independent contractors or freelancers.
The eUsahawan program’s key focus area is on improving educational services, particularly related to digital entrepreneurship, with a lack of skills in this area being identified as one of the most significant causes for Malaysia’s digital divide. Through the program, a structured digital entrepreneurship curriculum is being rolled out through public tertiary education institutions, including technical and vocational education and training (TVET) colleges and institutions of higher learning, and through entrepreneur development agencies. The initiative targets students and micro-entrepreneurs. It covers key digital technology trends that are re-shaping businesses today, including social media marketing, mobile commerce, analytics, e-payment and digital
Source: MDEC
Number of People Trained Number Reporting Sales
Additional Sales Generation (RM million)
2015 2016 2017 2015 2016 2017 2015 2016 2017
Total 3,108 51,203 102,269 2,441 16,233 41,425 3.7 48.2 175.2
TABLE 5eUsahawan has reached a growing number of people in Malaysia
50 MALAYSIA ECONOMIC MONITOR | JUNE 201850
PART TWO - Unlocking the Potential of the Digital Economy

advertising. By establishing and facilitating a structured curriculum, the impact of eUsahawan is intended to facilitate sustainable reach to wider segments of society.
A network of educational institutions and strategic partners has been established to strengthen the eUsahawan ecosystem. The eUsahawan curriculum41 is integrated into the official curriculum of 19 educational institutions, with lecturers at these institutions being trained as eUsahawan trainers and enabled to teach both enrolled students and micro-entrepreneurs. eUsahawan collaborates with 63 strategic partners to scale up initiatives such as advisory services, outreach efforts, on-boarding, trainer mobilization, training implementation and training facilities.
Since 2015, more than 160,000 students and micro-entrepreneurs have passed through the eUsahawan program. Out of these, approximately 30 percent of participants have reported generating
additional sales, with the value of these sales totaling more than RM 320 million over a period of 3-6 months. To date, more than 2,800 participants have on-boarded various eCommerce platforms (see Table 5).
More recently, eUsahawan has extended its efforts to integrate its curriculum with the Prisons Department. As a result, the program is now being deployed at the Henry Gurney Schools and Sekolah Integriti (schools for young offenders and juvenile delinquents). In addition, the program has also been extended to parolees to help facilitate their reintegration into society. A pilot is being conducted with the Malaysian Association for the Blind to teach visually-impaired individuals how they can leverage digital platforms to establish or expand business activities.
41 The eUsahawan ‘Digital Entrepreneurship’ modules have received accreditation by the Office of Qualifications and Examinations Regulation, United Kingdom.
51MALAYSIA ECONOMIC MONITOR | JUNE 2018 51
PART TWO - Unlocking the Potential of the Digital Economy

A competitive broadband market is key to improving connectivity and achieving higher business adoptionTo improve the quality and affordability of fixed broadband, lowering the barriers for entry is crucial. To achieve this, strong support should be provided to the Malaysian Communications and Multimedia Commission (MCMC) to implement the existing regulatory framework and to remedy the effects of the dominance of TM. In the short term, these measures should involve enforcing the current regulatory framework to allow alternative operators equal access to cable landing stations and to regulate the upstream markets for IP transit prices, which could increase competitiveness in the fixed broadband market. The government has taken steps in this direction by implementing the Mandatory Standard on Access Pricing (MSAP), which stipulates the ceiling wholesale prices that can be charged by service providers for the facilities and services used by recent telco operators.42 Over the long-term, regulations should be enhanced to improve the performance of the national and last-mile43 network markets to facilitate increased competition in the fixed broadband market.
Bridging the digital gap between the states and improving the quality of access requires measures to address the fragmented landscape that governs broadband deployment at the state level. At present, states where the ability of a wide range of telecommunication operators to build networks is constrained tend to have lower levels of fixed broadband penetration. To address this, the use of fiber networks owned by entities such as the Tenaga Nasional Berhad (TNB) could be authorized by enabling them to resell their excess capacity. Also, expanding the applicability of the Uniform Building By-Laws44
to treat broadband as a utility could help to address differences in regulations related to deploying network infrastructure across states. In addition to standardizing processors, addressing the fragmentation would also mean streamlining the pricing of permits for wireless towers and allowing rights of way across all states, which would enable higher levels of investments by alternative network operators.
Measures to increase public investment in the execution of public programs could also facilitate increased competitiveness in the broadband market. In the short term, measures to achieve this could include opening programs such as the HSBB and SUBB, which have currently been awarded to TM, to competitive bidding by private investors. Over the long term, consideration could be given to reforming the regulatory framework to create a level playing field, with TM competing directly with privately-owned networks on equal terms.
42 At present, the relevant parties are in the final stage of discussion and the process is expected to conclude by July- August 2018, following which fixed broadband prices are expected to decline.43 Last-mile technology is the telecommunications infrastructure at the local/ neighborhood level that carries signals from the broad telecommunication backbone to and from the home or business (https://searchnetworking.techtarget.com/definition/last-mile-technology)44 Malaysia has the Uniform Building By-Laws 1984, which is enforced by the local authorities and applicable to all building types constructed in the local authorities’ areas. Under the By-Laws, the Federal Government administers all building regulations whilst local authorities enforce them through their internal technical departments namely planning, building and engineering. (http://www.mpc.gov.my/wp-content/uploads/2016/04/Chapter-4.pdf)
Lowering the barriers for entry is crucial to improve the quality and affordability of fixed broadband
The government could also give consideration to ensuring that its new framework for the SST fully reflects the scale of transactions and profits being generated by Malaysia’s digital economy. While it is important that the domestic fiscal framework encourages the development of a vibrant digital economy, it is equally important that Malaysia secures its fair share of tax revenue from the profits generated by providers of digital goods and services that are based outside the country. Effectively and efficiently taxing digital transactions is a challenge facing most countries, involving a balancing act between raising revenue while allowing the growth of this increasingly important segment of economic activity (see Box 5).
52 MALAYSIA ECONOMIC MONITOR | JUNE 2018
PART TWO - Unlocking the Potential of the Digital Economy

Current global view on taxing the digital economy
BOX 5
The rapid growth in the size of the digital economy worldwide has coincided with an increased focus on tax compliance by international business. With countries around the world struggling to come to terms with the costs of the recent financial crisis, many governments are seeking to determine whether international businesses have been really paying their fair share in taxes. In the usual tax setting, profits seemed to end up in places where they were subject to no, or very little, taxation. Furthermore, some large digital corporations, such as Google and Facebook, appeared to be paying very little tax, despite having a significant presence in certain markets.
Responding to these issues, the OECD/G20 launched the Base Erosion and Profit Shifting (BEPS) initiative in 2015. This project resulted in 15 actions designed to modernize international tax rules, which had not kept pace with recent developments to the manner in which international businesses operate. These 15 actions include measures intended to prevent online retailers from exploiting tax rules that enabled them to shelter their profits. Simultaneously, work on indirect taxes (VAT/GST) has been conducted to ensure that consumption taxes are collected when taxable services are supplied digitally cross-border. In lieu of this, several countries are now collecting consumption
taxes directly from the foreign suppliers of digital services.
While there is general agreement on indirect tax on the digital economy, discussions on income tax are still under way. There are diverging views on BEPS’ conclusion on income tax, which concluded that existing concepts of how value is created and taxed did not need fundamental reform. Some countries argue that some digital business models rely fundamentally on value that is created by the users. For example, social media platforms rely on user-supplied content to attract and retain users of the platform. This in turn determines the ability of the platform provider to generate revenues, such as from advertising. This concept of “user generated value” is attracting support from a number of countries, particularly in Europe. However, it will be quite some time before international consensus can be achieved. This will involve agreeing not just on the principle but on the basis for quantifying user generated value for tax purposes. The Task Force on the Digital Economy, which was created as part of the BEPS project, is continuing to work on these issues. In the meantime, countries are contemplating, or actually introducing, taxes that target digital businesses, including taxes on their gross revenues and levies on payments for digital advertising services.
53MALAYSIA ECONOMIC MONITOR | JUNE 2018
PART TWO - Unlocking the Potential of the Digital Economy

As Malaysia transitions into a high-income economy, it should continue its efforts to unlock the potential of the digital economy
Around the world, digital technologies have spread rapidly and transformed the manner in which business, work and service delivery is being conducted. The digital economy promotes development and generates dividends by promoting innovation, reducing transaction costs, boosting efficiency and productivity, making services cheaper, and enhancing inclusion by providing access to previously excluded segments of the market to a wide range of services. Across the world, many countries are strategizing and putting in place various efforts and plans to capitalize the potential returns to be generated from embracing the digital economy.
For Malaysia to successfully achieve high-income country status, it is vital that it continues to implement efforts to unlock the potential created by the emergence of the digital economy. Malaysia successfully achieved middle income status through a model of economic growth that was mainly driven by large factor accumulation. With this model generating diminishing returns and with the intensifying need to achieve higher levels productivity, it is crucial for Malaysia to adopt digital technologies to achieve this increased productivity. Moving forward, Malaysia’s next challenge is to ensure that efforts to establish a solid basis to enable the country to fully reap the benefits of the digital economy are sustained. This includes measures to ensure high levels of digital adoption by a full range of economic agents, including businesses. It also requires the development of the proper infrastructure and market for high speed connectivity, preparing the workforce with the right skills to leverage the digital economy and implementing the right policies to drive the country’s digital transformation.
One of Malaysia’s major achievements is the high rates of digital adoption by its people and by the government. The government has made considerable efforts to provide basic internet access to its citizens, with the proportion of the population connected to the internet (mostly through mobile networks) reaching the levels recorded in many developed countries. In addition, the government has also has achieved a high level of digital adoption, comparable with many
high-income economies, reflected by the significant investment it has made in modernizing and digitizing its systems and processes. However, there is scope to improve the availability of data sources to support better evidence based policy-making (see Box 6).
The government has made considerable efforts to provide basic internet access to its citizens, with the proportion of the population connected to the internet reaching the levels recorded in many developed countries
Nonetheless, the gains from the digital economy will not accrue automatically, and challenges remain. The level of digital adoption by Malaysian businesses lags behind international peers and is more comparable to that in lower middle-income countries. There is also a marked disparity in the level of adoption by businesses between regions and sectors and between firms of different sizes. This is largely due to the relatively high cost and low quality of fixed broadband internet services. To address this, increasing the competitiveness of the fixed broadband Internet services market is crucial. In addition, developing an environment of confidence and trust is essential to build a vibrant e-commerce ecosystem. Concurrently, equal attention should also be given to the analog components of digital economy, namely, rules, skills and institutions (see Box 7). Malaysia should continue to implement measures to address these challenges if it is to unlock the full potential of the digital economy and thereby to achieve its aspirations of becoming a high-income economy.
54 MALAYSIA ECONOMIC MONITOR | JUNE 2018
PART TWO - Unlocking the Potential of the Digital Economy

The importance of open data for evidence-based policymaking
BOX 6
The world is experiencing a data revolution, as governments, private companies and others race to benefit from the exponential growth in digital data. The proliferation of networked digital devices – coupled with rapid advances in mobile telecommunications, cheap storage, processing power, and data mining methods – has sparked exponential growth in the supply and demand of data. The International Data Corporation estimates that “the digital universe” is doubling in size every two years, and is set to reach 44 zettabytes (that is, 44 trillion gigabytes, or the number 44 followed by 21 zeroes) by the year 2020. Public and private entities need to adapt and innovate to capture the enhanced information benefits of the digital revolution or risk being left behind.
Data, and the information derived from data, impact development through various channels: improving policy making and public service delivery, empowering homegrown research, and enabling private sector economic growth. The increased availability of more and better data is creating opportunities for policymakers, researchers, companies, and citizen groups to make better, timelier, and more informed decisions, enhance accountability, and increase economic growth. The public sector is increasingly using data to formulate, monitor, and evaluate policies as well as to improve public service delivery. Academia and the wider research community are gathering and analyzing data, often in real time, that were previously unavailable, to uncover new policy and socioeconomic insights. The private sector is using data for product development, market analysis, and evidence-based decision making or assessment.
Enhanced data are both an input and a result of the digital economy. Data collection, management, and dissemination are evolving rapidly, streaming into a digital economy in today’s world, which is expected to add US$1.4 trillion into the global economy by 2020. For instance, data from the publicly-funded and freely available global positioning system supports markets for geospatial data and services worth US$56 billion in 2013 in the United States alone. Malaysia, where the digital economy is estimated to be 18 percent of GDP, is no exception to this symbiotic relationship. Data are also the fuel that runs the digital economy, and an
inadequate flow of data could constrain the continued growth of the digital economy.
As the digital economy gains prominence worldwide, improving the open data environment will be critical for to achieve its developed nation aspirations. Open data is a framework under which government-held data are made publicly available in formats that can easily be read and used, while still preserving the confidentiality of personal information. Open data is a tool for transparency, accountability, and innovation. Research shows that data openness is highly correlated with national income, as well as the volume and quality of scholarly research conducted in a country.45 As of 2016, Malaysia’s ranking in the Open Data Barometer, a global measure of how countries are publishing and using open data, was 53 among 115 countries studied, lower than most advanced economies and many regional economies. Achieving open data in Malaysia is possible, but it will require further refinement of legislation, policies, and perhaps most importantly, the mindset surrounding data dissemination.
A more coordinated, integrated, and open data ecosystem, with clearly defined roles among institutions, is imperative to support Malaysia’s development. Many developed economies have shown that creating a conducive environment for data sharing leverages the growing opportunities that policy analysis, service delivery or the digital economy offer. Also, it opens new opportunities for collaboration within the public and private sectors, and among them and the research community. Malaysia’s current data system consists of almost 100 entities and requires stronger coordination to optimize data collection, management and dissemination. Hence, a broader ecosystem approach is needed to create a data system that is built for open collaboration by government, the private sector, researchers, and the public. In such a system – like those found in most OECD countries and other advanced economies – sharing of aggregated and disaggregated data is systematic, routine, and institutionalized as a standard practice of government operations. Data flow reliably, and securely, like electricity from an outlet, helping countries fully reap the potential benefits of the data revolution.
45 Chuah, L. L. and N. Loayza (2017) ‘Open Data: Differences and Implications across Countries.’ World Bank Research Policy Note No. 7, The World Bank: Kuala Lumpur.
55MALAYSIA ECONOMIC MONITOR | JUNE 2018
PART TWO - Unlocking the Potential of the Digital Economy

Embracing the digital economy also means getting the analog components right
BOX 7
Despite the rapid growth of digital technologies, this has not been fully translated into digital dividends. Given that nearly 60 percent of the world’s population still remain unconnected, many people are still unable to participate in the digital economy. There are also persistent disparities in terms of digital access between gender, geography, age and income dimensions within each country. In addition, as the adoption of digital technologies increases, many economies are now faced with increasingly polarized labor markets and widening inequality. In part, this is due to technology replacing routine jobs, which forces many workers to compete for low paying jobs. This is exacerbated by the absence of accountable institutions and a failure to establish a competitive business environment, which in turn creates an uneven playing field, favoring only the better educated and well-connected.
Risks and concerns related to the adoption of digital technologies surface when the main ‘analog complements’ (i.e. rules, skills and institutions) are missing or inadequate (see Figure 37). When there is an excessive concentration of market power that gives rise to monopolies, the use of the internet curtails competition in the market, thus constraining innovation. It could also result in widening inequality as a result of workers not having the right skills to complement existing and future technologies. Furthermore, despite a better
flow of information from the internet, unaccountable governments could impede service delivery, leading to greater control rather than greater empowerment and inclusion among citizens. As such, while ensuring that the internet is accessible and affordable remains a priority, maximizing digital dividends requires an understanding of how technology interacts with these ‘analog complements’ of digital investments.
As countries continue to define their digital strategies, equal emphasis should be given to strengthening these analog complements. The quality of countries’ analog complements is correlated with income, with policies changing as countries progress towards digital transformation. In countries where internet use is still limited, the focus should be on increasing access to digital technologies and promoting digital literacy. As countries transition to higher income levels, the focus should shift towards formulating effective competition regulation and enforcement and augmenting workers’ skills. Developed countries should find ways to facilitate ‘new economy’ competition, to ensure lifelong learning and to use the internet for most government functions. Countries that establish strong analog foundations will reap ample digital dividends, including increased growth, more jobs and better services.
FIGURE 37Digital technologies create benefits and risks
Source: World Bank, World Development Report 2016 – Digital Dividends
Digital Technologies
Benefits
Risks
Inclusion
Concentration
Efficiency
Inequality
Innovation
Control
With complements
Without complements
56 MALAYSIA ECONOMIC MONITOR | JUNE 2018
PART TWO - Unlocking the Potential of the Digital Economy

Highlights from Malaysia’s digital economy development initiatives
Appendix
The Malaysia Digital Economy Corporation (MDEC), as the driver of the nation’s digital economy, has built fundamental components to spur the tech industry, to grow local tech companies, to accelerate digital economy ecosystems and to promote digital inclusivity. To date, Malaysia has attracted digital investments of a value in excess of RM320 billion from around the world exceeding, with the creation of 167,000 new high-value jobs and the emergence of a domestic ICT industry worth over RM40 billion. The bulk of these FDI came from developed economies, including the US, UK, Germany and Japan.
Beyond attracting investments, MDEC, as a key agency in the overall digital economy ecosystem, has also implemented a number of wide-ranging initiatives to align the digital economy towards Industry 4.0, to grow the start-up ecosystem, and to shape enablers such as data analytics, creative content, and cybersecurity.
Aligning the digital economy to Industry 4.0
To help accelerate Malaysia’s digital transformation, MDEC has introduced the Digital Transformation Acceleration Program (DTAP). DTAP is supported by an outcome matching grant, which is a partnership with Malaysia Investment Development Authority.
DTAP was established to enable Malaysian companies to kick-start their digital transformation. The program is supported by Digital Transformation Labs (DTL), which consists of a group of global experts that play a critical role in providing a structured approach and in advising on the use of suitable technologies. Currently, five DTLs have been identified: Bosch, Deloitte, Digital McKinsey, Rainmaking Innovation and Roland Berger. Each DTLs has its own unique characters and strengths.
DTAP is complemented by an outcome-based matching grant and taxation benefits. The grant could assist companies to tap into the expertise of the DTLs; to address key concerns; and to adopt digital technologies to exploit opportunities in the digital arena. All projects applying for support from the DTAP must have clear
measurable outcomes including:
• Increased productivity
• Reduced dependency on foreign labor
• New sources of growth
Companies going through DTAP are expected to incorporate emerging technologies such as IoT, data analytics, machine learning, and artificial intelligence into their business to achieve competitiveness with global players, and to align with Industry 4.0.
Growing the startup ecosystem
The Malaysian startup ecosystem has undergone considerable development since 2013, with a marked increase in investment in startups. Recognizing the contribution of the digital economy to the country’s GDP, the government declared 2017 as the year of the Internet Economy to amplify and accelerate the start-up ecosystem.
In 2017, MDEC launched the Malaysia Digital Hub (MDH) to support and further grow the startup ecosystem. MDH aims to address potential gaps, especially in the areas of funding, market access, talent, and technology. It brings together ecosystem players such as startups, investors, talent builders and corporate partners to the community through collaboration with co-working spaces. Co-working spaces with these necessary ecosystem partnerships will be granted the MDH status. At present, there are five co-working spaces with MDH status.
The Malaysia Tech Entrepreneur Program (MTEP) was introduced to attract technical talent and aspiring entrepreneurs from around the globe to Malaysia to establish start-ups and to expand their business into the Southeast Asia region. Taking advantage of Malaysia’s geographical location in the region, MTEP provides eligible and deserving budding entrepreneurs the opportunity to obtain a one-year or five-year entrepreneurs’ visa to kick-start their businesses in Malaysia. So far, 41 entrepreneurs across 22 countries, including the US, UK and Japan, are MTEP beneficiaries.
A
B
57MALAYSIA ECONOMIC MONITOR | JUNE 2018
Appendix

46 http://www.matrade.gov.my/en/about-matrade/media/press-releases/3735-boosting-the-exports-of-malaysia-s-creative-content-through-partnership.
Building data analytics capabilities
In 2014, Big Data Analytics (BDA) was identified as a new source of growth for Malaysia with the launch of the National Big Data Analytics Initiative. In 2017, the Initiative was expanded to become the National Data Economy Initiative to cover data technologies such as IoT and AI in addition to BDA.
The implementation of this initiative commenced with the development of a Data Economy Framework, which was intended to establish Malaysia as a regional BDA and IoT hub by spurring demands in all sectors, catalyzing adoption and usage, and building a data economy ecosystem.
The key enabler for Malaysia to build a strong data economy ecosystem is talent in data technologies. The ASEAN Data Analytics Exchange, which was established in 2017, plays the role of a regional platform to connect the community, enterprises, start-ups, academia and working professionals in a central location, and to inspire and enable organizations to embrace data technologies.
The Integrated Strategic Intelligence & Transformation System was established in 2017 to support the public sector’s increased use of BDA. This project is implemented under the Ministry of Communications and Multimedia and managed by MDEC, serving as a data repository and common analytics platform for the government to assist ministries and agencies to develop insights and to shape future policies and initiatives.
The introduction of eLadang will accelerate the adoption of data technology in non-IT driven sectors, targeting both SMEs and large companies. eLadang is a digital agriculture initiative intended to facilitate transformation from traditional farming towards high-income digital economy farming professions, by infusing digital technology (i.e. IoT, BDA and AI) into farming to increase yield and quality, with competitive production costs.
Harnessing local creativity for the digital economy
The Malaysian government has identified the creative content industry as a key economic driver. The Malaysian creative content sector contributed RM9.55 billion, and represented 6.4 percent of GDP in 2015, with Malaysia having exported RM6.8 billion worth of creative content.46
The creative content industry includes the animation, games, visual effects, new media and infrastructure platforms sectors. In the period from 2013 to 2017, these sectors grew by six percent, generating RM7.9 billion in revenue. At present, there are more than 372 studios in Malaysia directly involved in various stages of development and production, creating 11,150 jobs.
Realizing its vast potential in IP creation and talent development, Malaysia has chosen animation and games as new focus areas for the digital creative content. To create vibrant ecosystems for these area, Malaysia established the Malaysia Animation and Creative Content Centre and Level Up Inc. as accelerators for the animation and games subsectors respectively. These initiatives provide an integrated support ecosystem that consists of physical infrastructure, competency and capability development programs.
Malaysia’s animation subsector has achieved global recognition, with exports to a value of RM132 million in 2017 to more than 120 countries. To date, Malaysia has more than 20 homegrown IPs.
Malaysia’s games sector has also grown considerably, with exports to a value of RM684 million in 2017, and with 46 percent year-on-year growth. Malaysia aspires to build local games capacity and capability that will accelerate IP creation and develop talent for both local and international projects. At present, Malaysian games studios have showcased their capabilities by developing and contributing to the art and design for renowned games such as Final Fantasy, Street Fighter V and Unchartered 4.
C D
58 MALAYSIA ECONOMIC MONITOR | JUNE 2018
Appendix

Developing cybersecurity for the digital economy
ASEAN’s expenditure on cybersecurity is forecasted to grow by 15 percent in the period from 2015 to 2025. In this area, Malaysia is amongst the top three performers amongst ASEAN countries, with these countries expected to control a 75 percent market share of cybersecurity services by 2025.
The International Data Corporation forecasts that Malaysia’s security services market will grow from RM1 billion in 2016 to RM2.5 billion by 2021, due to increased opportunities across the region, with the total value of the security services market expected to reach RM10 billion by 2021.
The Asia Cybersecurity Exchange is the first cybersecurity hub in Malaysia to provide a central platform for cybersecurity collaboration, innovation and capability-building. Supported by MDEC and NACSA, the hub has been developed on the basis of a public-private partnership model that involves the participation of industry and ecosystem players such LE Global Services, premier digital technology institutions of higher learning and regional mentors.
With the rapidly expanding opportunities created by the emerging digital economy and with the rapid growth of the cybersecurity industry, two strategic initiatives have been identified: enabling market-driven innovation to meet demand from digital tech sectors; and developing critical cybersecurity talent.
National eCommerce Strategic Roadmap
Malaysia’s National eCommerce Council, driven by the Ministry of International Trade and Industry and supported by relevant agencies, was established to drive the implementation of the National eCommerce Strategic Roadmap (NeSR) and to facilitate the achievement of doubling Malaysia’s eCommerce growth to generate a contribution to GDP in excess of RM211 billion by 2020. The NeSR outlines the Malaysian government’s intervention in six Thrust Areas, as follows:
• Accelerate seller adoption of eCommerce
• Increase adoption of eProcurement by businesses
• Lift non-tariff barriers (e-Fulfillment, cross-border, e-Payment, consumer protection)
• Realign existing economic incentives
• Make strategic investments in select eCommerce player(s)
• Promote national brands to boost cross-border eCommerce
Digital Free-Trade ZoneThe Digital Free Trade Zone (DFTZ) is a strategic national initiative intended to revolutionize Malaysia’s participation in cross border trade. DFTZ was officially launched on March 22, 2017 and went live on November 3, 2017.
The DFTZ has two key objectives. Firstly, the DFTZ will drive exports of Malaysian SMEs by leveraging digital technology to enable them to export. Secondly, the DFTZ seeks to position Malaysia as a Regional Transhipment Hub, enabling it to better serve regional markets.
E F
G
59MALAYSIA ECONOMIC MONITOR | JUNE 2018
Appendix

References
BNM (2018) ‘Annual Report’, Kuala Lumpur: Bank Negara Malaysia.
BNM (2018) ‘Quarterly Bulletin’, Kuala Lumpur: Bank Negara Malaysia.
Glenn-Marie Lange, Quentin Wodon and Kevin Carey (2018) The Changing Wealth of Nations 2018: Building a Sustainable Future, Washington, DC: The World Bank.
IMF (2018) ‘Malaysia: Article IV Consultation’, Staff Report, IMF Country Report No. 18/61, Washington, DC: International Monetary Fund.
World Bank (2016) World Development Report 2016: Digital Dividends, Washington, DC: The World Bank.
World Bank (2017) Internet of Things: The New Government to Business Platform, Washington, DC: The World Bank.
World Bank (2018a) Global Economic Prospects, January 2018: Broad-based Upturn, but For How Long?, Washington, DC: The World Bank.
World Bank (2018b) Global Economic Prospects, June 2018: The Turning of the Tide?, Washington, DC: The World Bank.
World Bank (2018c) East Asia and Pacific Economic Update, April 2018: Enhancing Potential, Washington, DC: The World Bank.
World Bank (2018d) ‘Productivity Unplugged: The Challenges of Malaysia’s Transition into a High-income Country’, Washington, DC: The World Bank.
World Bank (forthcoming) Malaysia’s Digital Economy – A New Driver of Development, Washington, DC: The World Bank.
60 MALAYSIA ECONOMIC MONITOR | JUNE 2018

CONNECT WITH US
wbg.org/Malaysia
@WorldBankMalaysia
@WB_AsiaPacific
blogs.worldbank.org/category/countries/malaysia